In our previous lecture, we understood the vital parameters to be taken into consideration before data acquisition and scanning.
|
|
|
- Norah Young
- 5 years ago
- Views:
Transcription

1 Interactomics: Protein Arrays & Label Free Biosensors Professor Sanjeeva Srivastava MOOC NPTEL Course Indian Institute of Technology Bombay Module 7 Lecture No 34 Software for Image scanning and data processing In our previous lecture, we understood the vital parameters to be taken into consideration before data acquisition and scanning. (Refer Slide Time: 0:28) Today we will discuss about the software interface for scanning, image processing and data extraction. Mr. Pankaj Khanna would provide software demonstration for performing the scanning but before you move on to the live demo session on a scanning we can briefly discuss the software in general and how the user interface looks like. Prof Sanjeeva Srivastava: So, welcome again to this lecture Pankaj. So, it will be useful if we can actually see the how the software works for performing the scanning but before we move on to the live demo for the scanning performance may be we can just briefly discuss about the software in general and how the user interface looks like. If you can just elaborate on some of the features while one need to look for during the scanning process, I think that is useful for us to understand when we actually look at the demonstration for the software.
 So, there you wanted to see which kind of laser I am going to used and second one is a different features, which are used for the controlling of the image and towards the")
2 Mr. Pankaj Khanna: True. So the basic GUI which we are going to see in few minutes actually contains three different areas. The first one is image pleasure controls. (Refer Slide Time: 1:46) So, there you wanted to see which kind of laser I am going to used and second one is a different features, which are used for the controlling of the image and towards the right hand side we have a pane which is allowed or helpful in hardware controls. So, the basic one is in the hardware control is first as we said that we can look at auto PMT and other adjustment which is being done, for that we used preview scan. So, preview scan and there are different tabs which allows you to go for the true scan and the preview scan and based on the laser which particular scan you are using. So, like for example if you start with the preview scan you decide on which best pixilation suits me, which different power of laser suits me. Once you are able to do these decisions being made you can go for your own data scan. People prefer that because they are sometimes a bleaching effect on the flurophores so, they want to avoid the explosion for a longer time. So, multiple scanning is avoided. So, once you see even a single wavelength scan so if your application requires only one wavelength to be scanned there you can select in the tab only a single wavelength scan and then so also a preview scan with the data scan followed by.

3 You can also do automation that once you do a preview scan you see that it is all good then you immediately it can go for that. But very rarely people use that because you see once and then only you want to go ahead. Prof. Sanjeeva Srivastava : So I its like any general scanning even if you want to just scan sheets right? First of all you would like to preview it that how you you just want to get glimpse of the process like how the overall image looks like and then since you do your experiment you know your requirements like what wavelength need to be used, what type of flurophore you have used, then one need to optimize and correct those things during the data scan which will actually scan and then after that one need to review that whole thing and then how the slide looks like. Mr. Pankaj Khanna: True. Prof. Sanjeeva Srivastava: We will can talk little bit on the software which even I am using Genepix pro software and how one can acquire image if one has system like 4000B. (Refer Slide Time: 3:50)

4 Mr. Pankaj Khanna: Right. So, there is the button toward the side where you had having a control for the scanning time. So, as it is a dual channel that is the two lasers are present in that it is allowed to select whether you want to used one and two. Prof. Sanjeeva Srivastava: okay. Mr. Pankaj Khanna: And then based on based on one or the user application you select both the lasers and then at the level of live scan you control for the PMT and the pitch resolution you want to use for. So, these are within the same software towards the right hand side you see the pane where you have hardware control button there you can also look for all these different images which is being now suiting for your own biological applications. Prof. Sanjeeva Srivastava: I think it will be more clear when we are actually looking at the software interface. Mr. Pankaj Khanna : Sure Prof. Sanjeeva Srivastava: okay, so one we are acquiring the image what the intensity histogram still is while scanning is in process and even after the scanning is done how one can really ensure that the scan is good and what type of balance one need to make in that. (Refer Slide Time: 5:09)
5 Mr. Pankaj Khanna: yes so, basically in the preview scan when you are scanning your live data you can just switch on to the histogram graph like there what it gives is how much red and green channel are contributing towards the intensities. So, you really want that they are overlapping so they are really balancing. There could be small variability in the beginning going to the fact that they are just background and then the spots coming in. So there you want that they are really overlapping after little bit of lag that is few seconds of lag, that is it. So, once you are able to do then you can see and select whether yes this PMT is being good for me so, this is a way you check which PMT is more suitable. So you select the PMT look at them see the overlap wherever there is best overlap without saturation you want to go with those settings. Prof. Sanjeeva Srivastava: I guess now its time that we should really move on to your software interface and just see like how really the scanning is performed by using this software. Mr. Pankaj Khanna: yes let us switch on to the GUI. Prof. Sanjeeva Srivastava: Okay Pankaj so let us talk about the software how actually we can use this software for image scanning from the hardware so that now we can see it live that how one can actually control different buttons for acquisition of the good images. Mr. Pankaj Khanna: let us go to the GUI of genepix pro. Prof. Sanjeeva Srivastava: Sure.


6 (Refer Slide Time: 6:21) Mr. Pankaj Khanna: So, what you see now is a GUI or graphical user interface of genepix pro software. On top it is in the form of different tab buttons which allows you in different work group say for example image allows you in different ways and controlling of the image acquisition and histogram looks at how that image has performed. So this is what we were speaking about in the earlier slide where we can see a live kind of demo which is happening. (Refer Slide Time: 6:50)

7 And then lab book actually gives what all you have done in the different stepwise. So what is being every movement of yours in this particular software is being logged in and analysis can be done in the form of batch form which allows multiple slides so that you can do alignment and the analysis which can be perform to the batch analysis and once the analysis is over, results can be seen and scatter plot can be now plotted at the level of this graphical user interface. Once you are through you can look at the reports as well so, let us look at the major function of imaging so, what and how one control for the best image acquisition.
8 Prof. Sanjeeva Srivastava: It is important. Let us look at some of the buttons and how one can control those to acquire good image. (Refer Slide Time: 7:37) Mr. Pankaj Khanna: Sure. Let us quickly go through like different kind of buttons here. So, now the imaging can be done at different wavelengths and like preview can be done at 635 and 532. In a single laser based the wavelength can be done at 635 or wavelength at 532. So, even the
9 ratio of the imaging how the both has performed together can be looked at looking at a button of ratio of imaging. So, this one allows you to see how the image is being done after the scan. You can look at one channel, preview channel or different channels and now let us look at different tools which are available to you while or after the scanning. So, the major ones are here where you can move across the chips in the form of this hand tool, the + indicates the zoom tool and the other tools are actually this is who want to unzoom and you can also look at the whole image button. So, once you have the image these two becomes activated. So, these two are actually for the blocks and looking and the controlling the blocks and these ones are the features. So, many a times what happens usually you get the GAL file which is actually the feature information file. Prof. Sanjeeva Srivastava: Just actually you can just may be elaborate on GAL file because that is one of the very commonly used terms when people talk about microarrays right. Mr. Pankaj Khanna: Sure. So GAL stands for gene array least file. So, actually it gives the x and y coordinates where each array is usually being presented in the form of blocks, which blocks in turn are in the form of features. So these blocks and feature positions are being recorded in GAL file and then the information or annotation is given to each spot. So GAL GAL that is gene array least file essentially contains the x, y and the number of columns and so also the information of each spot how they are being annotated and placed on the chip. So, if by chance if you do not know or you have prepared yourself these buttons here allowed to make here own blocks and we create here own GAL file with the help of the tool which is called as gene arrays least generator. Prof. Sanjeeva Srivastava: okay.

10 (Refer Slide Time: 9:48)
11
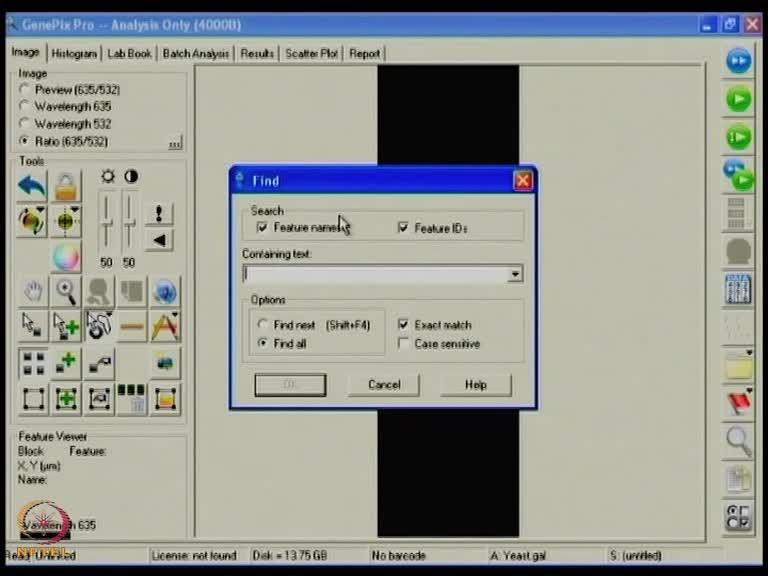
12 Mr. Pankaj Khanna : So, now let us look at the control button which is towards your right side to the first one is a preview scan and then you can also have a data scan. Prof. Sanjeeva Srivastava: okay. Mr. Pankaj Khanna: one stands for one wavelength. So, its allows you to take image from only one way and then you also have a multiple scans. So you do a preview scan, then you do a scan with this button. You also have other buttons which will light up as and when you acquire the image and this is for the analysis. So the once analysis is being done if you click this button the analysis will be performed after the alignment. So, this is actually open button so this is like normally your file where you want to open or save your images and this one is actually a flag. As we discussed the different features can be flag we can look at once the images available to you you can look at good, bad or absent and you can give them different ratings. Here again is looking at different zoom buttons so which allows you that which you want to focus are; feature names, feature ids where you want go for one particular buttons. The major one here is particularly this which allows a different workflow controls right? So, this allows in form a different ways can be happened. Now let us quickly go through a one particular scan which is a simultaneous simultaneous scan. So both lasers would be acquire to the same time. Prof. Sanjeeva Srivastava: okay.
13 (Refer Slide Time: 11:07)
14

15 Mr. Pankaj Khanna: So if I pressed on a data scan button the image the after putting inverted slides in the hardware. It is scanning so you just see on the top which is very less visible so let us try to zoom inside. So if I just put this button and allow you to zoom you can see particular how the scanning is happening. So, you are looking at different image type. So, if I click on only one wavelength this because it s live after the scanning you can see it is going for the ratio image scan. So now quickly and a histogram you see it is start coming up. Because it s scanning is going on live so its start reducing. So basically as we discussed it should be overlapping so, my settings are usually looking very nice in this particular work. Prof. Sanjeeva Srivastava: So I guess like as the scanning is progressing one need to also keep looking simultaneously the histogram. Mr. Pankaj Khanna: Correct. Prof. Sanjeeva Srivastava: To determine like how Cy3 and Cy5 are well aligned. Mr. Pankaj Khanna: Correct. So how well aligned with the help of auto-pmt so Cy3, Cy5 we can adjust auto-pmt you can adjust laser power so that you can see this one.
 Mr.")
16 Prof. Sanjeeva Srivastava: So if we see some variation then we need to come back here and adjust these parameter so that there are real ones. Mr. Pankaj Khanna: Yes. So in this fashion the image acquisition is being happening. Prof. Sanjeeva Srivastava: Right. (Refer Slide Time: 12:30) Mr. Pankaj Khanna: And you also have, we give you a power that in between the slides usually people keep barcodes. Prof. Sanjeeva Srivastava: Right. Mr. Pankaj Khanna: and our system or GenePix pro is compatible with reading the internal barcode which is being done. So so that you can have multiple scans also being possible. So nowadays each slides is coming with multiple arrays. Because of the variable densities people are focusing on the custom type. So, this can also be done with the new software upgrade developers. So, now as the scanning is being performed let us look like I will save the image and once I save the image I would like to see how the different processes is being done. (Refer Slide Time: 13:12)
17
18
19
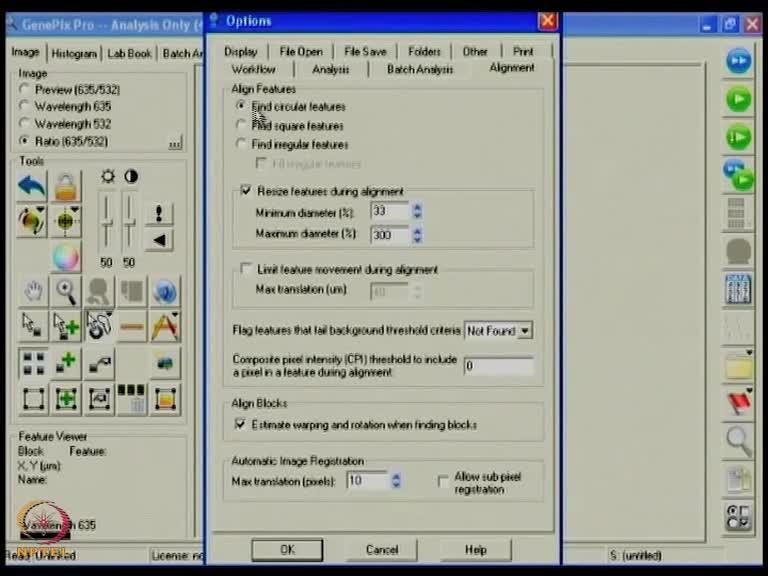
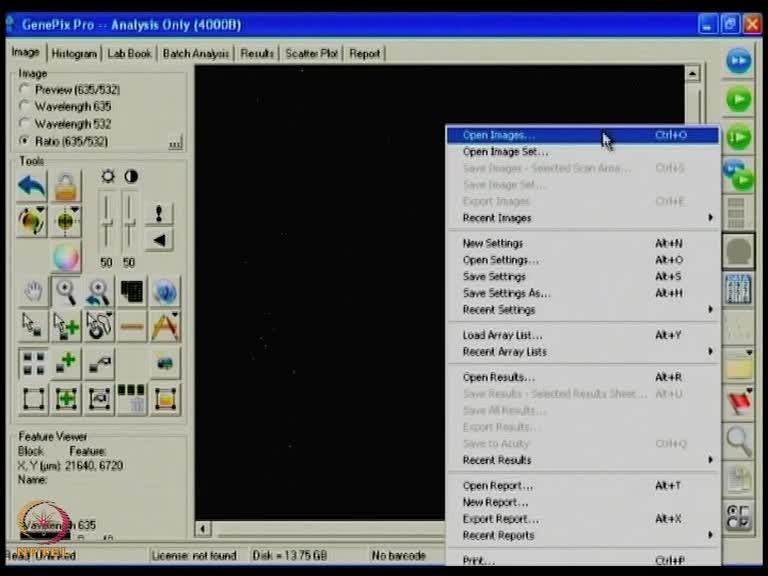
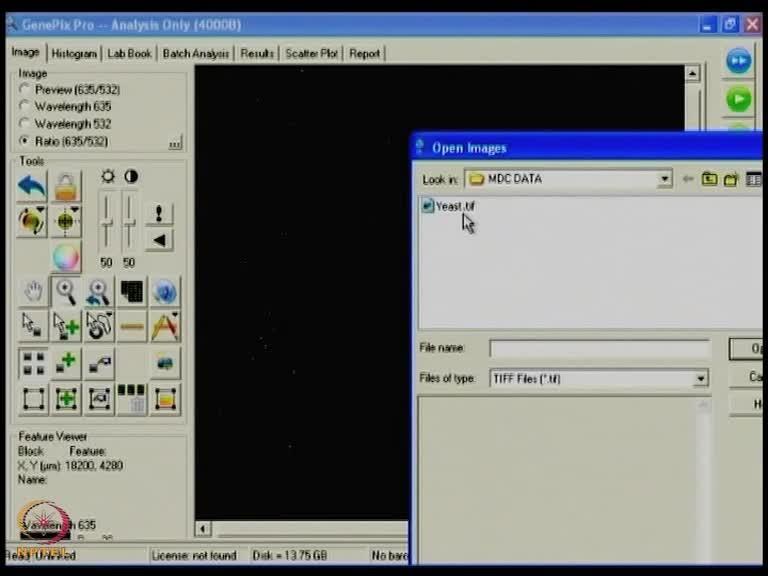
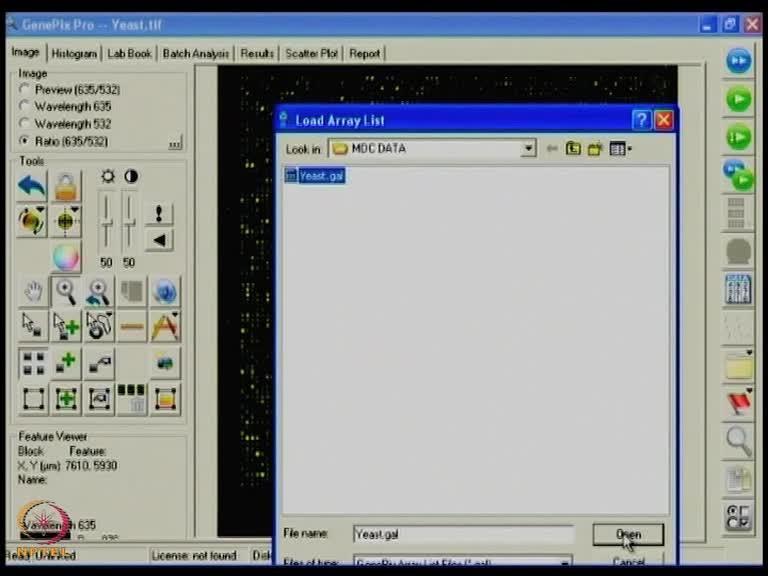
20 Mr. Pankaj Khanna: So say for example I have saved this image in the form of say this is a yeast. So, I just want to open an image which I have just saved. So, basically as we discussed each particular array can be divided into the blocks. So, this particular array of yeast contains four blocks and each block is having features. So, number of features information is given in GAL so basically terminology is array block and features. So I need to align that GAL information of positions on top of this so I have to put a GAL file and do my further analysis. So, what I am going to do now is open a GAL or GAL file which allows me for alignments. Prof. Sanjeeva Srivastava: Right. Mr. Pankaj Khanna: So, best feature of GenePix pro is its capability of identifying feature by itself which totally comes easily so let us just see how the zoom button looks like. Prof. Sanjeeva Srivastava: And one need to fine tune that alignment for overall proper image extraction. Mr. Pankaj Khanna: Correct. So, only thing you have to do here is just take your block and allow it to move to the first alignment and then what you can do is click the button over here which is for the align. Align can be done in different ways. I recommend to use the first which finds all features all blocks and do automated fashion. So if you click once you see software automatically
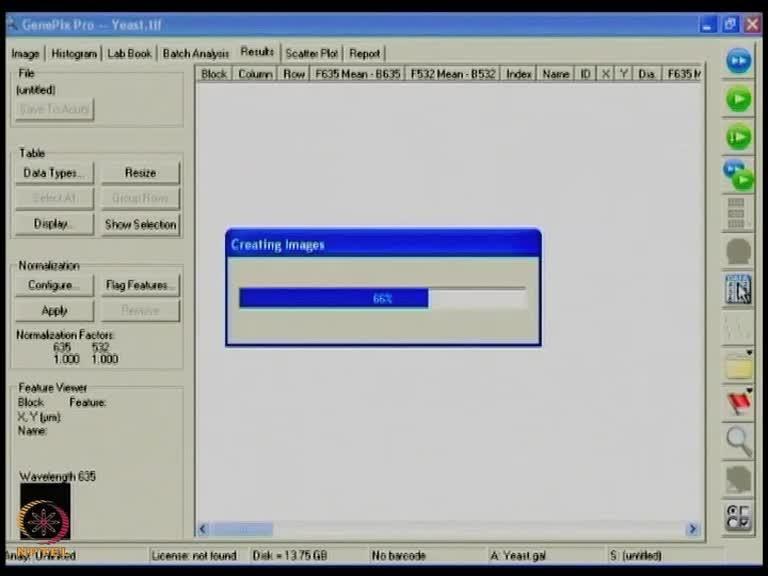
21 finds all it features wherever by chance the features are absent or they are some physical deformity is say it is not present or it flag it as back. Prof. Sanjeeva Srivastava: So one thing which is good here like its automatically adjusting according to the spot size. Mr. Pankaj Khanna: Correct. Prof. Sanjeeva Srivastava: The overall width it is adjusting according like with their some spots are not so uniform right. Mr. Pankaj Khanna: correct. Prof. Sanjeeva Srivastava: So it is making that correction here. Mr. Pankaj Khanna: Correct. So as you see you can actually move it but it does not affect live as long as you have just kept once and the data is being stored but usually people ask me is it good idea if I am by chance move to do once again. So it is not bad idea because it would take few seconds to do it. So, once you have done this particular alignment let us look these two slides which I said it can zoom out. Prof. Sanjeeva Srivastava: Ya Mr. Pankaj Khanna: So you can see whole particular slide now is being scanned and aligned as well. So it is a very quick process which software performs very easily for doing the job and once you have done this you can always hit a button of results. (Refer Slide Time: 15:51)
22

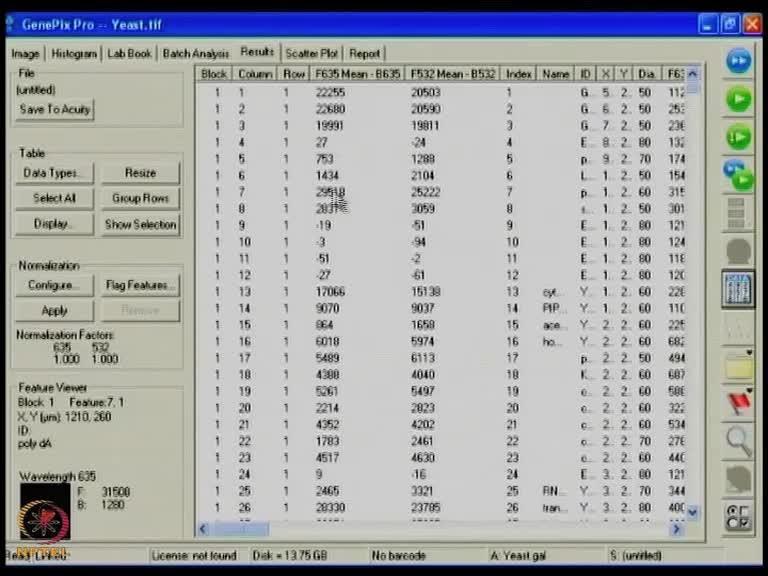
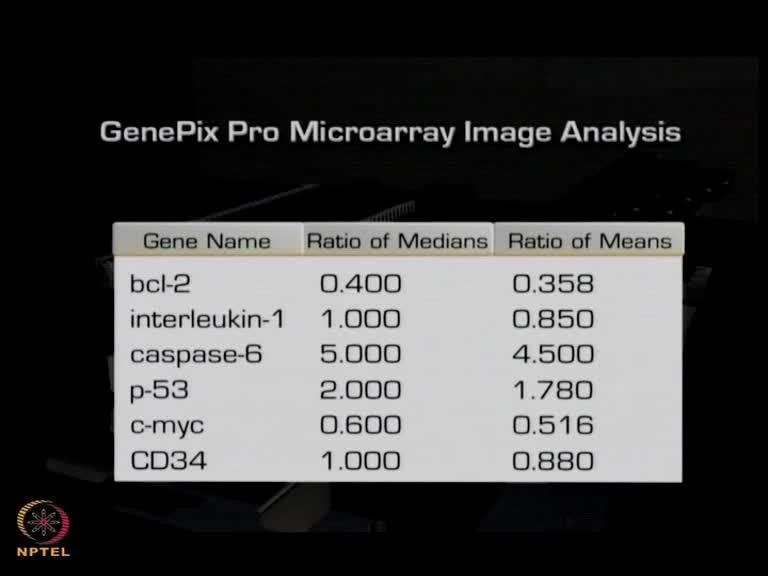
23 Now if I go to the results actually this is an empty. So, if I click on results, results are being calculated and there are some 40 different columns which will be output in the form which GenePix pro understands different ways. Prof. Sanjeeva Srivastava: Sure. Mr. Pankaj Khanna: So just quickly looking it to the major ones. The major ones here are looking at this F means the intensity from different channels 635 or 532 and this background calculation is being done accordingly in the same laser range. So, once you do a corrections what happens is you want to correct your intensity mean values with the values of the background. Prof. Sanjeeva Srivastava: Okay Mr. Pankaj Khanna: So this is what is the most important which usually people use for the further calculation apart from a ratio of means or ratio of medians which can be calculated again and being presented to you in different column formats. So each column signifies different ones. Like for example SD standard deviation, CV coefficient of variations and then different channels coming up. So, in this fashion the result would be outputted if you are image acquisition first controlling the part then allowing you to align and then do the analysis. So this is the basic steps which anybody


24 or everybody want to do in microarrays steps. So once you see the images the the people end up in the form of results and you have different columns available to you. Prof. Sanjeeva Srivastava: Right. After that what is a next into look for like how would set plots? (Refer Slide Time: 17:25) Mr. Pankaj Khanna: So there are different ways people want to visualize how my column because number make very less sense. So the best way to look is a scatter plot. Scatter plot allows you in different ways what you are plotting at X and Y axises and here if you see I am just
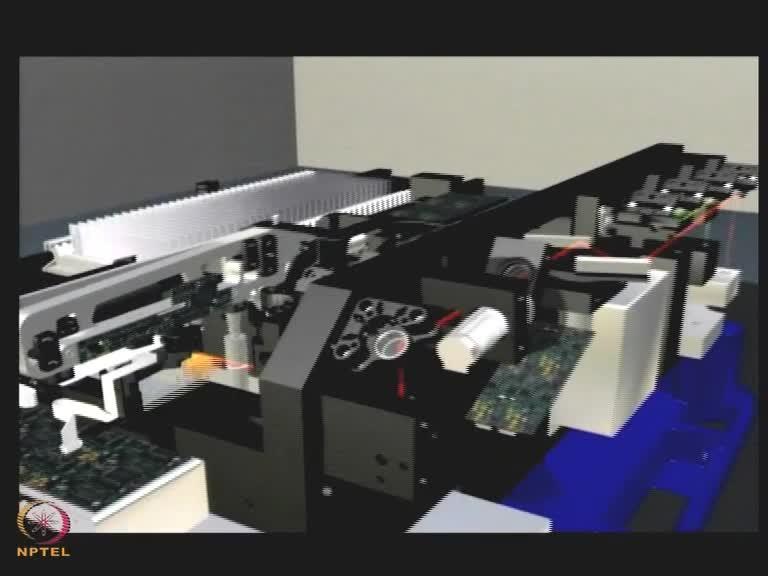
25 plotting actually towards F635 median over the F532 median. So you are comparing two different channel how they have behave. So essential rule is they should mostly the microarray assumes all the chips are having the spots and which are genes which are not bearing too much. So you expect most of them to stand nearby to the origin of the center. So this is what you want look at. How there plot are aligned. Yes so they should be not too far away from each other. So that they are not need actually to each other because you expect there are few differences but not very very significant which can be seen at very large scales. Prof. Sanjeeva Srivastava: So I guess we talked so for about how to use the hardware to scan a slide and by using this software interface, which is GenePix Pro here to acquire all the data. Now next challenge is how to really obtain some meaning full information from this whole data which we have already acquired. Mr. Pankaj Khanna: True. So GenePix pro as we discuss is acquisition software and the molecular devices recommend acuity software for further data analysis which can be at the level of secondary or tertiary based on that. So you do statistics as well as visualizations on a single or multiple data to handle that. Prof. Sanjeeva Srivastava: So Pankaj it was good to talk to you about how one can use the DNA microarray or protein microarrays, different type of slides and use the hardware the scanner to scan these slides by using this software which has various features and depending upon experiment one can actually take a decision that what type of features one need to use for that scanning. I think it would be very good if you can just share with us the video which describes the overview of the whole process is starting from the sample preparation followed by a image acquisition as well as image analysis. So if you can show us that video that will be great. Mr. Pankaj Khanna: Sure. Thanks to molecular devices they have provided me with this video which actually takes you from the basic process of biology in very very brief to importance software parts and so also the hardware design which is being emphasizes to the label of result. So let us watch that video.

.")
26 (Refer Slide Time: 19:52).
27

28
29
30

31
32
33
34
35
36
37
38
39

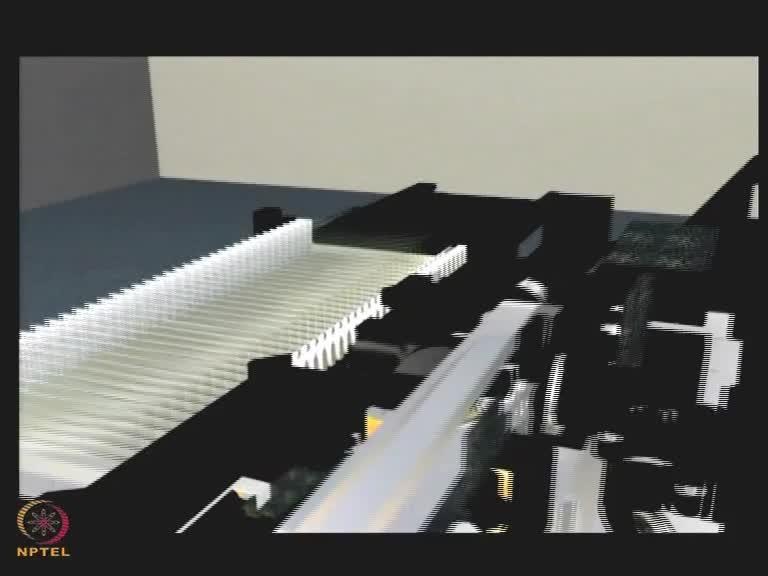
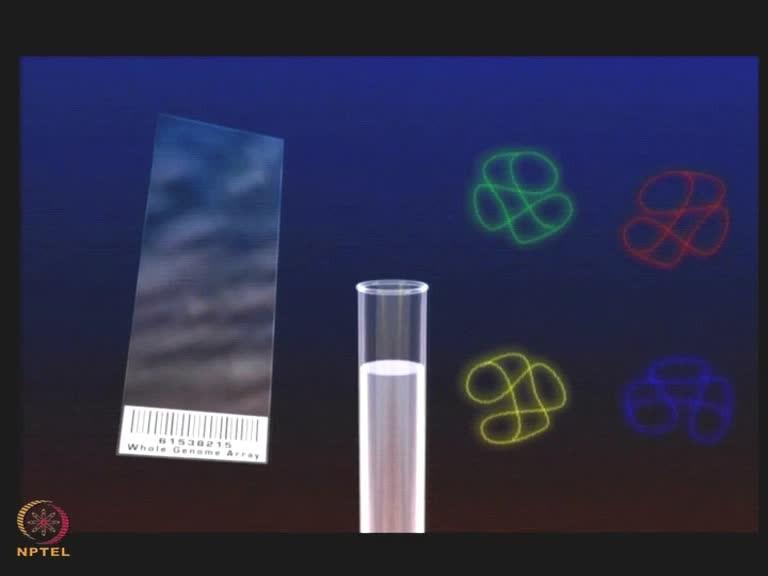
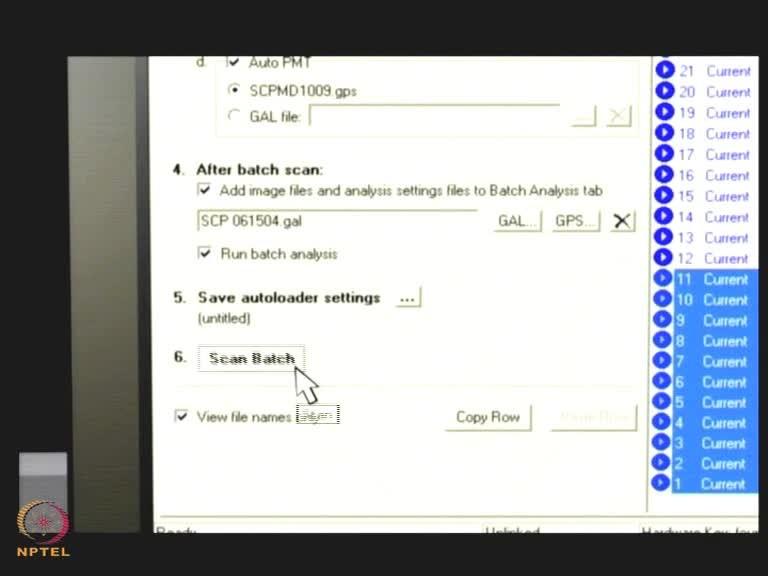
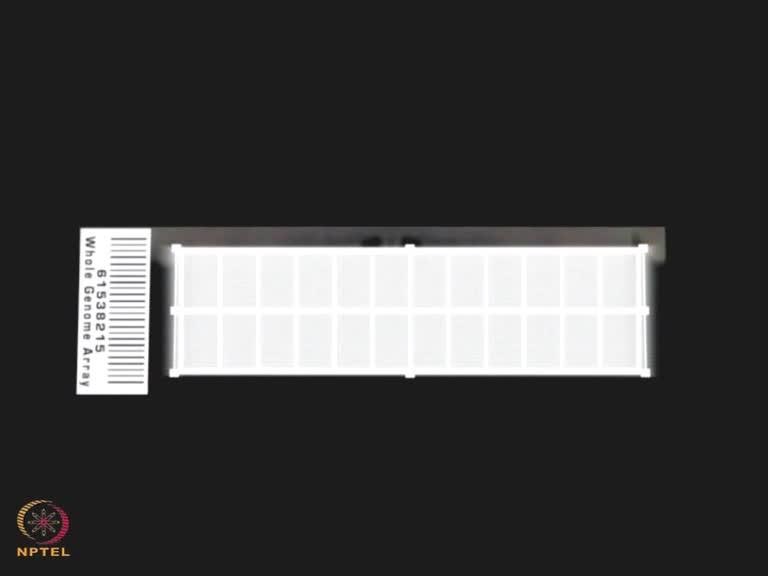
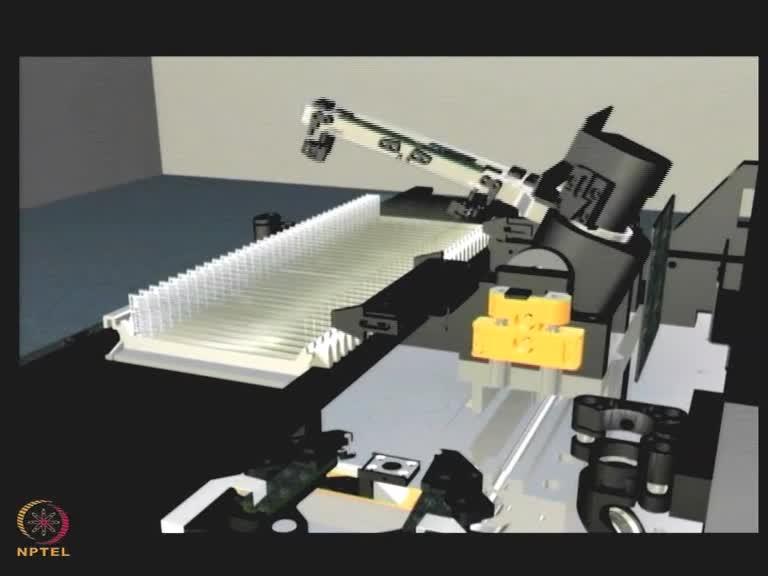
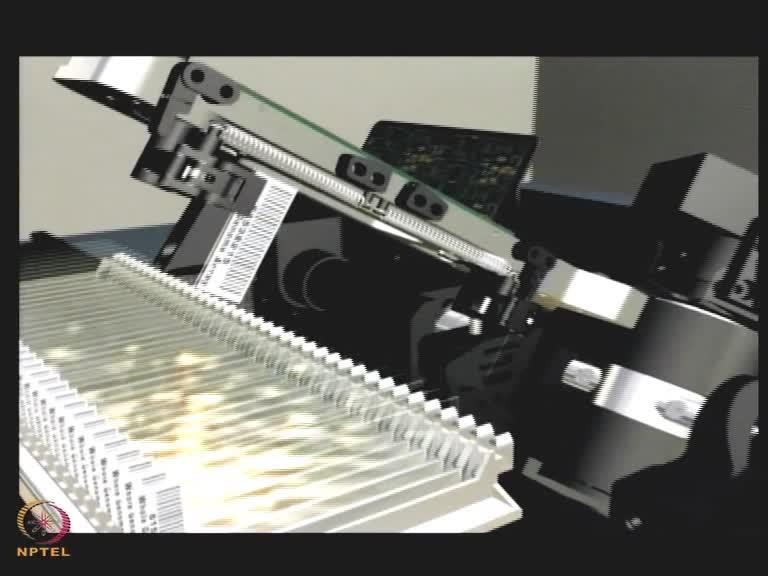
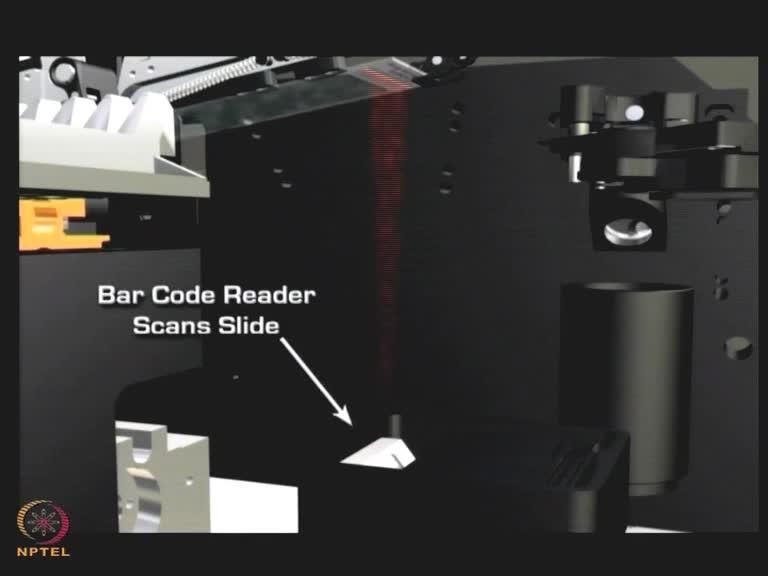
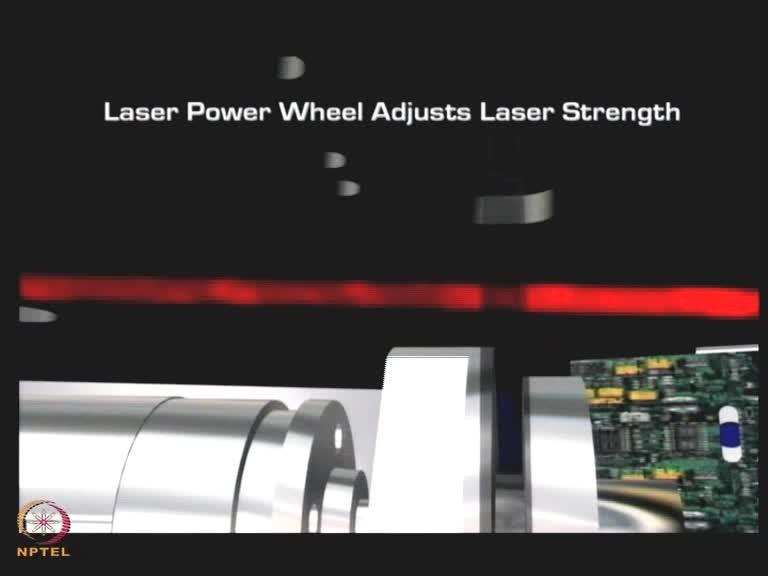
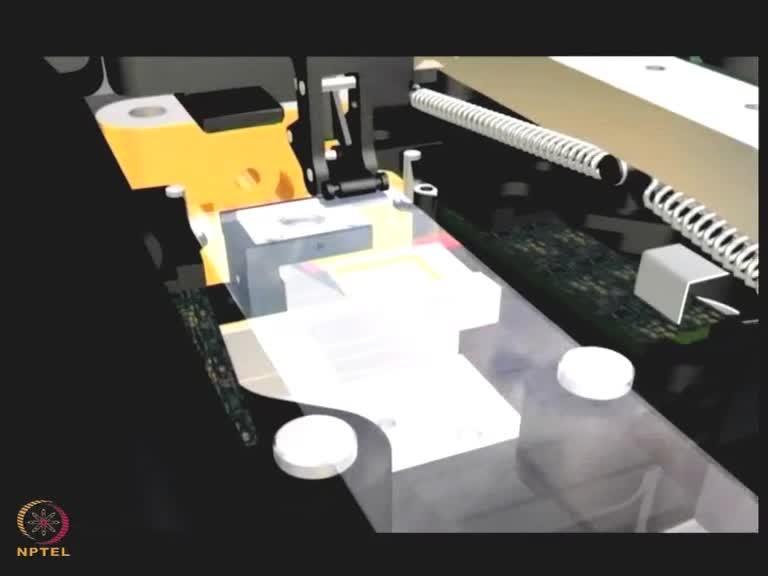
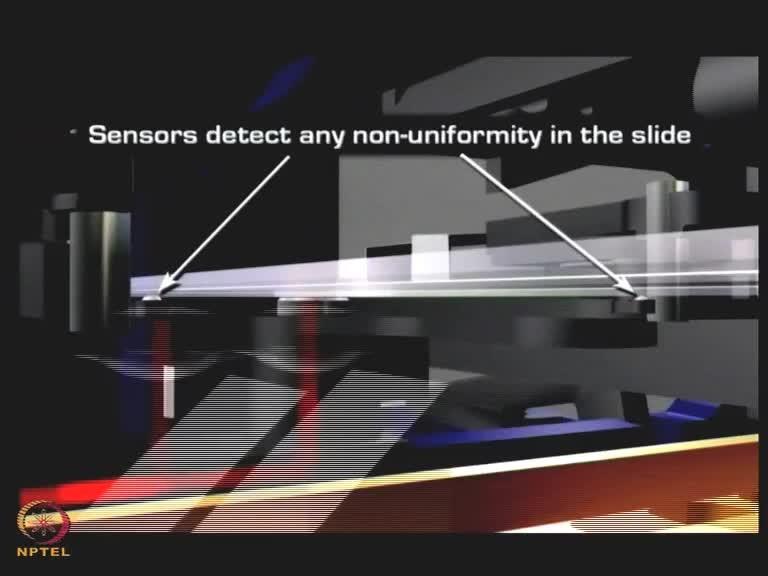
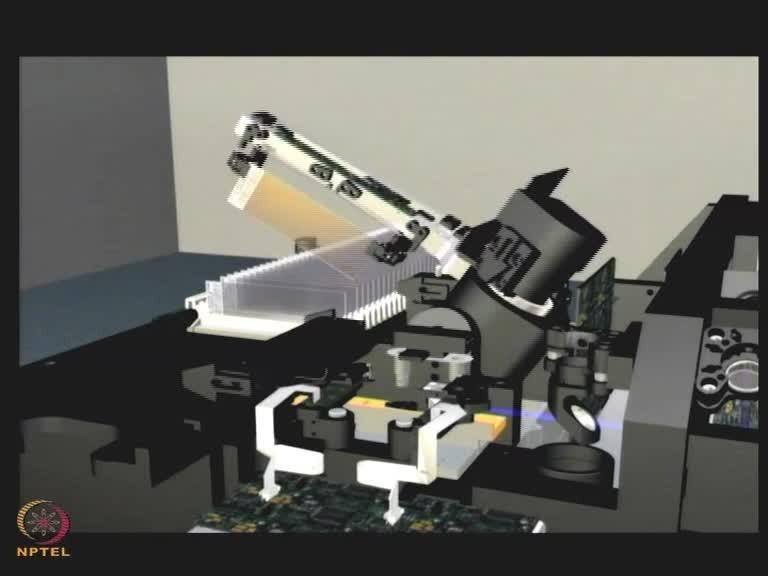
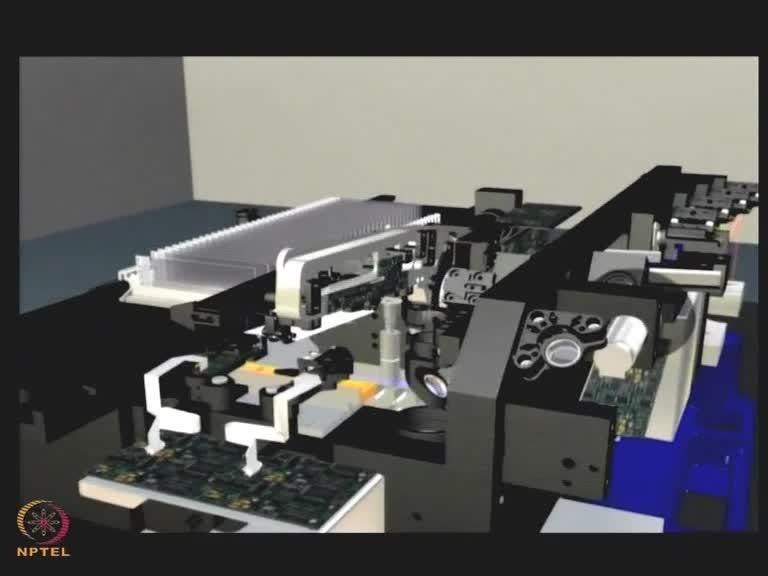
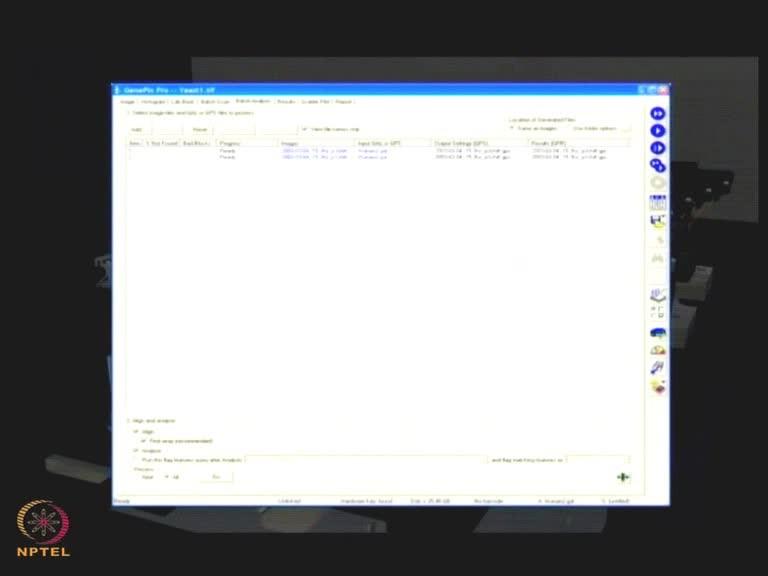
40 Molecular devices introduces the world s simplest most reliable automatic microarray slides scanner. Now you can walk away from scanning while the GenePix Autoloader 4200AL automatically loads, scans and alive and saves results for up to 36 slides. The Autoloader accommodates microarrays on standard glass microscope slides labelled with up to 4 fluorescent dyes. These microarrays can contain just a few 100 spots or 10s of 1000 of spots representing an entire genome. As many as 36 slides can be loaded into the convenience slide carrier. As the carrier is insulated into the scanner sensors detect the location of each slide indicated by a blue power on the slide carrier map. On the batch scan tab in GenePix pro you have complete flexibility to define the most appropriate settings and analysis parameters for each slide or for groups of slides. You can also choose to automate scanning analysis and file saving steps. Enter an address and GenePix pro will notify you remotely when your batch is complete. Using the defined scanning primers the precision robot arm leaps into action and moves to the first slide. Our unique never let go grippers securely clamp the slide and carry it to the scanning area. A barcode reader records the barcode and then the slide is positioned for scanning. The GenePix Autoloader 4200AL can be configured with up to 4 lasers. A neutral density filter wheel can be used to attenuate the laser power if necessary for especially bright samples. The
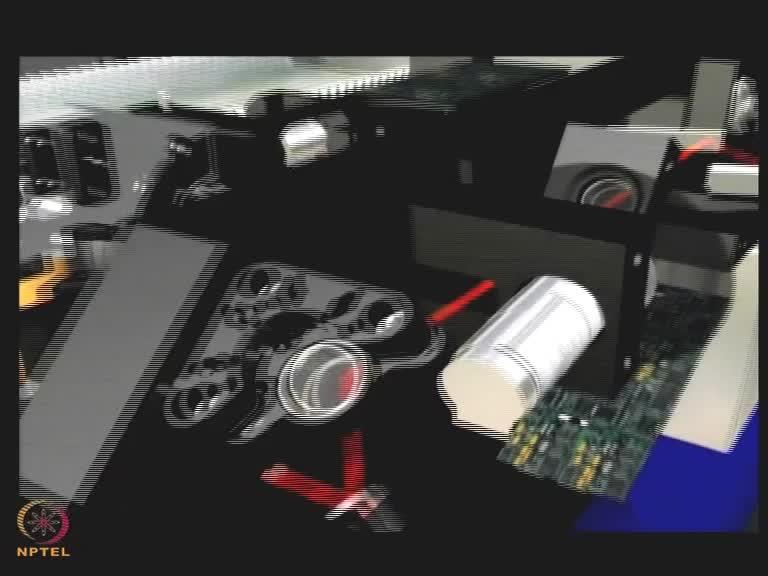
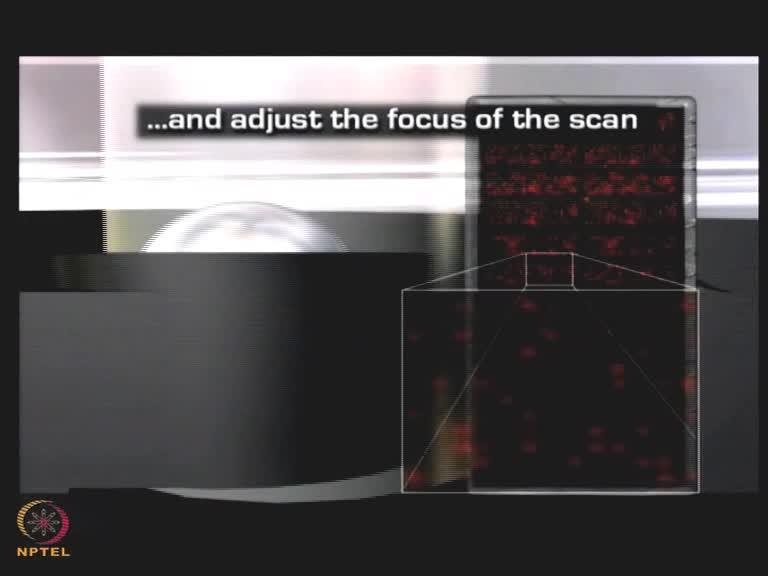
41 laser excitation beam is delivered to the surface on the microarray slide. The beam scans rapidly across the short access of the slide as the robot arm moves the slide more slowly than the long axis. Fluorescent signal emitted from the sample is collected by a photomultiplier tube. As the scan proceeds sensors detect any non-uniformity in the slide surface and the robotic arm adjust the slide position accordingly to ensure the array surface is always in perfect focus. Each channel is scanned sequentially and the developing images are displayed on the monitor. The multichannel thick images are saved automatically according to file naming conventions specified by the user. After the slide has been scanned the precision robot arm replaces it safely in the slide carrier before picking up the next slide. As each slide is scanned a list of each saved image with its associated settings and analysis files accumulates in the batch analysis tab until the batch is complete. GenePix pro automatically finds the spots and calculates up to 108 different measurements for each spot. The results are saved as a GenePix results or GPR file. GPR files can be saved automatically to the acuity database for statistical analysis, clustering and other advanced investigation. Prof. Sanjeeva Srivastava: okay it was a very useful discussion Pankaj with you for knowing more details about various type of features one need to look for to obtain very good images because that is the most important part for doing the microarrays. Once you have acquired the good images then only one can do good data analysis from that. So thank you for coming here and sharing your experience for overall microarray scanning and the data acquisition. So, thank you once again for coming here and discussing and sharing about your experience for GenePix pro. Thank you. Mr. Pankaj Khanna: Thank you. Prof. Sanjeeva Srivastava: In protein microarray experiment intensity of a spot is a representative of the interaction between the sample and analyte. To achieve this target proficiency in image processing and data acquisition is required. As discussed, the artifacts due to the contaminants such as dust particle or even very high background issues make automation in image processing

42 and data acquisition very challenging. Researchers have devised several segmentation algorithms to reduce the manual interventions. However, you have seen there a degree manual flagging is necessary to the mark the low quality spots. This data would now be pre-processed for background correction and normalization. You also seen the demonstration of one such software, GenePix pro microarray image analysis software for data acquisition and you will further see how it will be used to analyze data in subsequent lecture. There are several commercial software like protoarray prospective software which are available along with their compatible scanning devices for image processing, data acquisition and preprocessing. In our next lecture we will continue our discussion on microarray experiment workflow and how to analyze the microarray data obtained from the images generated from today s lecture. Thank you. (Refer Slide Time: 25:58)

43
44
NPTEL VIDEO COURSE PROTEOMICS PROF. SANJEEVA SRIVASTAVA
 HANDOUT LECTURE-31 MICROARRAY WORK-FLOW: IMAGE SCANNING AND DATA PROCESSING Slide 1: This module contains the summary of the discussion with Mr. Pankaj Khanna, an application specialist from Spinco Biotech,
NPTEL VIDEO COURSE PROTEOMICS PROF. SANJEEVA SRIVASTAVA
 LECTURE-31 MICROARRAY WORK-FLOW: IMAGE SACNNING AND DATA PROCESSING TRANSCRIPT Welcome to the proteomics course. In today s lecture we will talk about microarray work-flow the image scanning and processing.
Scan slides (Axon Genepix 4200AL)
") Page 1 Scan slides (Axon Genepix 4200AL) We need to scan the slides on both channels (Cy3 and Cy5) to obtain a 16-bit grayscale TIFF file for each. Typically these files are about 20-26Mb per channel,
Page 1 Scan slides (Axon Genepix 4200AL) We need to scan the slides on both channels (Cy3 and Cy5) to obtain a 16-bit grayscale TIFF file for each. Typically these files are about 20-26Mb per channel,
EmbryoCellect. RHS Scanning and Analysis Instructions. for. Genepix Pro Software
 EmbryoCellect RHS Scanning and Analysis Instructions for Genepix Pro Software EmbryoCellect Genepix Pro Scanning and Analysis Technical Data Sheet Version 1.0 October 2015 1 Copyright Reproductive Health
GenePix Application Note
 GenePix Application Note Biological Relevance of GenePix Results Shawn Handran, Ph.D. and Jack Y. Zhai, Ph.D. Axon Instruments, Inc. 3280 Whipple Road, Union City, CA 94587 Last Updated: Aug 22, 2003.
ScanArray Overview. Principle of Operation. Instrument Components
 ScanArray Overview The GSI Lumonics ScanArrayÒ Microarray Analysis System is a scanning laser confocal fluorescence microscope that is used to determine the fluorescence intensity of a two-dimensional
Products - Microarray Scanners - Laser Scanners - InnoScan 900 Series and MAPIX Software
 Products - Microarray Scanners - Laser Scanners - InnoScan 900 Series and MAPIX Software Arrayit offers the world s only next generation microarray scanning technology, with proprietary rotary motion control,
Product Information. Introduction
 Microarray Scanner Calibration Slide To quantitatively analyze scanners performance and output, adjust and fine-tune scanners, and perform comparative analysis for multiple scanner units. To verify scanners
Microarray Data Pre-processing. Ana H. Barragan Lid
 Microarray Data Pre-processing Ana H. Barragan Lid Hybridized Microarray Imaged in a microarray scanner Scanner produces fluorescence intensity measurements Intensities correspond to levels of hybridization
Quality control of microarrays
 Quality control of microarrays Solveig Mjelstad Angelskår Intoduction to Microarray technology September 2009 Overview of the presentation 1. Image analysis 2. Quality Control (QC) general concepts 3.
GenePix Application Note
 GenePix Application Note Determining the Signal-to-Noise Ratio and Optimal Photomultiplier gain setting in the GenePix 4000B Siobhan Pickett, M.S., Sean Carriedo, Ph.D. and Chang Wang, Ph.D. Axon Instruments,
Instructions for Mapping * µarray Images using GenePix 5.0
 Instructions for Mapping * µarray Images using GenePix 5.0 Preliminary Information Make sure that the GenePix 5.0 software has been installed on your computer and you have the USB hardware dongle that
Instructions for Howto Scan µarrays
 Instructions for Howto Scan µarrays Introduction After probing the µarray slides with samples, one is now ready to scan them. To scan a µarrays slide is too convert the biological information trapped on
Scanning and Image Processing -by Steve Clough
 Scanning and Image Processing -by Steve Clough cdna microarrays use two dyes with well separated emission spectra such as Cy3 and Cy5 to allow direct comparisons on single slide GSI Lumonics Ratio of Expression
Zeiss 780 Training Notes
 Zeiss 780 Training Notes Turn on Main Switch, System PC and Components Switches 780 Start up sequence Do you need the argon laser (458, 488, 514 nm lines)? Yes Turn on the laser s main power switch and
Quick Guide. LSM 5 MP, LSM 510 and LSM 510 META. Laser Scanning Microscopes. We make it visible. M i c r o s c o p y f r o m C a r l Z e i s s
 LSM 5 MP, LSM 510 and LSM 510 META M i c r o s c o p y f r o m C a r l Z e i s s Quick Guide Laser Scanning Microscopes LSM Software ZEN 2007 August 2007 We make it visible. Contents Page Contents... 1
Confocal imaging on the Leica TCS SP8. 1) Turn the system on. 2) Use TCS user account. 3) Start LAS X software:
 Turn the system on. 2) Use TCS user account. 3) Start LAS X software:") Confocal imaging on the Leica TCS SP8 1) Turn the system on. 2) Use TCS user account. 3) Start LAS X software: 4) Do not touch the microscope while the software is initializing. Choose your options: Turn
Confocal imaging on the Leica TCS SP8 1) Turn the system on. 2) Use TCS user account. 3) Start LAS X software: 4) Do not touch the microscope while the software is initializing. Choose your options: Turn
RENISHAW INVIA RAMAN SPECTROMETER
 STANDARD OPERATING PROCEDURE: RENISHAW INVIA RAMAN SPECTROMETER Purpose of this Instrument: The Renishaw invia Raman Spectrometer is an instrument used to analyze the Raman scattered light from samples
Microscopy from Carl Zeiss
 Microscopy from Carl Zeiss Contents Page Contents... 1 Introduction... 1 Starting the System... 2 Introduction to ZEN Efficient Navigation... 5 Setting up the microscope... 10 Configuring the beam path
Image Capture TOTALLAB
 1 Introduction In order for image analysis to be performed on a gel or Western blot, it must first be converted into digital data. Good image capture is critical to guarantee optimal performance of automated
Horiba LabRAM ARAMIS Raman Spectrometer Revision /28/2016 Page 1 of 11. Horiba Jobin-Yvon LabRAM Aramis - Raman Spectrometer
 Page 1 of 11 Horiba Jobin-Yvon LabRAM Aramis - Raman Spectrometer The Aramis Raman system is a software selectable multi-wavelength Raman system with mapping capabilities with a 400mm monochromator and
Development of a Next-Generation Laser-Scanner System for Life Science Research
 Development of a Next-Generation Laser-Scanner System for Life Science Research Masaki TAKAMATSU* Yasutake TANAKA* Takashi KOBAYASHI* Hiromi ISHIKAWA* and Akira YAMAGUCHI* Abstract We developed a next-generation
The Zeiss AiryScan System, Confocal Four.
 The Zeiss AiryScan System, Confocal Four. Overview. The Zeiss AiryScan module is a segmented, radially stacked GaASP detector and collector system designed to subsample the airy disk of a point emission
Leica TCS SP8 Quick Start Guide
 Leica TCS SP8 Quick Start Guide Leica TCS SP8 System Overview Start-Up Procedure 1. Turn on the CTR Control Box, Fluorescent Light for the microscope stand. 2. Turn on the Scanner Power (1) on the front
Zeiss 880 Training Notes Zen 2.3
 Zeiss 880 Training Notes Zen 2.3 1 Turn on the HXP 120V Lamp 2 Turn on Main Power Switch Turn on the Systems PC Switch Turn on the Components Switch. 3 4 5 Turn on the PC and log into your account. Start
Leica TCS SP8 Quick Start Guide
 Leica TCS SP8 Quick Start Guide Leica TCS SP8 System Overview Start-Up Procedure 1. Turn on the CTR Control Box, EL6000 fluorescent light source for the microscope stand. 2. Turn on the Scanner Power
Automatic gene expression estimation from microarray images. Daniel O. Dantas Adviser: : Junior Barrera
 Automatic gene expression estimation from microarray images Daniel O. Dantas Adviser: : Junior Barrera IME-USP Summary Introduction Problem definition Solution strategy Image segmentation Signal estimation
Cell Biology and Bioimaging Core
 Cell Biology and Bioimaging Core Leica TCS SP5 Operating Instructions Starting up the instrument 1. First, log in the log book located on the confocal desk. Include your name, your lab s PI, an account
Leica SPEII confocal microscope. Short Manual
 Leica SPEII confocal microscope Short Manual Switching ON sequence: 1. Turn on the Workstation under the bench (top, far right). 2. Turn on the Supply Unit - Laser box (big green switch first and then
Contents. Introduction
 Contents Page Contents... 1 Introduction... 1 Starting the System... 2 Introduction to ZEN Efficient Navigation... 5 Setting up the microscope... 10 Configuring the beam path and lasers... 12 Scanning
Leica SP8 Resonant Confocal. Quick-Start Guide
 Leica SP8 Resonant Confocal Quick-Start Guide Contents Start-up Preparing for Imaging Part 1 On the scope Part 2 Software interface Part 3 Heat & CO2 incubation Part 4 Other hardware options Shut-down
MAKE SURE YOUR SLIDES ARE CLEAN (TOP & BOTTOM) BEFORE LOADING DO NOT LOAD SLIDES DURING SOFTWARE INITIALIZATION
 BEFORE LOADING DO NOT LOAD SLIDES DURING SOFTWARE INITIALIZATION") Olympus VS120-L100 Slide Scanner Standard Operating Procedure Startup 1) Red power bar switch (behind monitor) 2) Computer 3) Login: UserVS120 account (no password) 4) Double click: WAIT FOR INITIALIZATION
Olympus VS120-L100 Slide Scanner Standard Operating Procedure Startup 1) Red power bar switch (behind monitor) 2) Computer 3) Login: UserVS120 account (no password) 4) Double click: WAIT FOR INITIALIZATION
Practical work no. 3: Confocal Live Cell Microscopy
 Practical work no. 3: Confocal Live Cell Microscopy Course Instructor: Mikko Liljeström (MIU) 1 Background Confocal microscopy: The main idea behind confocality is that it suppresses the signal outside
Operation Guide for the Leica SP2 Confocal Microscope Bio-Imaging Facility Hunter College October 2009
 Operation Guide for the Leica SP2 Confocal Microscope Bio-Imaging Facility Hunter College October 2009 Introduction of Fluoresence Confocal Microscopy The first confocal microscope was invented by Princeton
TRAINING MANUAL. Olympus FV1000
 TRAINING MANUAL Olympus FV1000 September 2014 TABLE OF CONTENTS A. Start-Up Procedure... 1 B. Visual Observation under the Microscope... 1 C. Image Acquisition... 4 A brief Overview of the Settings...
Nikon SIM-E & A1-R System
 Nikon SIM-E & A1-R System USER GUIDE LSU Health Sciences Center Shreveport Research Core Facility June 01 2017 Chaowei Shang 1 Table of Content 1. Start Up the System... Page 3 Hardware and microscope
Developed by BioDiscovery, Inc. DualChip evaluation software User Manual Version 1.1
 Developed by BioDiscovery, Inc. DualChip evaluation software User Manual Version 1.1 1 Table of contents 1. INTRODUCTION...3 2. SCOPE OF DELIVERY...4 3. INSTALLATION PROCEDURES...5 3.1. SYSTEM REQUIREMENTS...
Leica SP8 TCS Users Manual
 Version : 07/08/0 Leica SP8 TCS Users Manual Start up:. Turn the PC Microscope, Scanner Power, Laser Power, and the Laser Emission key to on (bottom right of desk).. Turn on the fluorescent lamp (top left
Leica Sp5 II Confocal User Guide
 Leica Sp5 II Confocal User Guide Turning on the Confocal System (instructions are posted in the room) 1. Turn on Laser Power Button 2. Turn Key to On position 3. Turn on Scanner Power Button 4. Turn on
Imaging Beyond the Basics: Optimizing Settings on the Leica SP8 Confocal
 Imaging Beyond the Basics: Optimizing Settings on the Leica SP8 Confocal Todays Goal: Introduce some additional functionalities of the Leica SP8 confocal HyD vs. PMT detectors Dye Assistant Scanning By
LSM 780 Confocal Microscope Standard Operation Protocol
 LSM 780 Confocal Microscope Standard Operation Protocol Basic Operation Turning on the system 1. Sign on log sheet according to Actual start time 2. Check Compressed Air supply for the air table 3. Switch
Bi/BE 227 Winter Assignment #3. Adding the third dimension: 3D Confocal Imaging
 Bi/BE 227 Winter 2016 Assignment #3 Adding the third dimension: 3D Confocal Imaging Schedule: Jan 20: Assignment Jan 20-Feb 8: Work on assignment Feb 10: Student PowerPoint presentations. Goals for this
GALILEO TMA CK 4500 HTS Tissue Microarray Platform
 GALILEO TMA CK 4500 HTS Tissue Microarray Platform Tissue Microarray (TMA) A Block Of Samples From Hundreds Of Blocks (S. M. Hewitt, M.D., Ph.D., Tissue Array Research Program, LP, CCR, NCI, NIH) TMA technology
Supplemental Figure 1: Histogram of 63x Objective Lens z axis Calculated Resolutions. Results from the MetroloJ z axis fits for 5 beads from each
 Supplemental Figure 1: Histogram of 63x Objective Lens z axis Calculated Resolutions. Results from the MetroloJ z axis fits for 5 beads from each lens with a 1 Airy unit pinhole setting. Many water lenses
Leica SP8 TCS Users Manual
 Leica SP8 TCS Users Manual Follow the procedure for start up and log on as posted in the lab. Please log on with your account only and do not share your password with anyone. We track and confirm usage
ZEN 2012 SP5 black edition Hotfix 12
 Information about the software ZEN 2012 SP5 black edition Hotfix 12 Software name: ZEN 2012 Service Pack 5 black edition Hotfix 12 Software version: The software version in ZEN Help About changes to 14.0.12.201
LSM 710 Confocal Microscope Standard Operation Protocol
 LSM 710 Confocal Microscope Standard Operation Protocol Basic Operation Turning on the system 1. Switch on Main power switch 2. Switch on System / PC power button 3. Switch on Components power button 4.
Zeiss LSM 880 Protocol
 Zeiss LSM 880 Protocol 1) System Startup Please note put sign-up policy. You must inform the facility at least 24 hours beforehand if you can t come; otherwise, you will receive a charge for unused time.
Zeiss LSM 780 Protocol
 Zeiss LSM 780 Protocol 1) System Startup F Please note the sign-up policy. You must inform the facility at least 24 hours beforehand if you can t come; otherwise, you will receive a charge for unused time.
Multifluorescence The Crosstalk Problem and Its Solution
 Multifluorescence The Crosstalk Problem and Its Solution If a specimen is labeled with more than one fluorochrome, each image channel should only show the emission signal of one of them. If, in a specimen
ThermaViz. Operating Manual. The Innovative Two-Wavelength Imaging Pyrometer
 ThermaViz The Innovative Two-Wavelength Imaging Pyrometer Operating Manual The integration of advanced optical diagnostics and intelligent materials processing for temperature measurement and process control.
Image Analysis for Fluorescence
 Image Analysis for Fluorescence Terminology Table Image Analysis Macro Colocalization Intensity Dye AFI The extraction of meaningful information from digital images by means of digital image processing
Overview. About other software. Administrator password. 58. UltraVIEW VoX Getting Started Guide
 Operation 58. UltraVIEW VoX Getting Started Guide Overview This chapter outlines the basic methods used to operate the UltraVIEW VoX system. About other software Volocity places great demands on the computer
Locating Molecules Using GSD Technology Project Folders: Organization of Experiment Files...1
 .....................................1 1 Project Folders: Organization of Experiment Files.................................1 2 Steps........................................................................2
Recording EPR spectra using the Loop Gap Resonator (LGR)
") Recording EPR spectra using the Loop Gap Resonator (LGR) This protocol gives step-by-step instructions for recording EPR spectra of spin labeled proteins (Nitroxide label like MTSSL) using the LGR assuming
Recording EPR spectra using the Loop Gap Resonator (LGR) This protocol gives step-by-step instructions for recording EPR spectra of spin labeled proteins (Nitroxide label like MTSSL) using the LGR assuming
CHM 152 Lab 1: Plotting with Excel updated: May 2011
 CHM 152 Lab 1: Plotting with Excel updated: May 2011 Introduction In this course, many of our labs will involve plotting data. While many students are nerds already quite proficient at using Excel to plot
Colony Imaging with powerful Analysis Software
 TM Imaging with powerful Analysis Software TM Accurate Compact Fast We re not going to interpret your results, but we ll do everything to get you there From image acquisition to data visualisation, straight
Using the zoom adjustment, zoom on the gel Adjust the tray on the VGAU 3000 to see the image of the gel in the viewfinder
 Operation of Vakili 3000 Gel Analysis Unit Both qualitative and quantitative analysis of electrophoresis experiments can be accomplished by using the Vakili 3000 Gel Analysis Unit. There are three steps
PHYSICS 220 LAB #1: ONE-DIMENSIONAL MOTION
 /53 pts Name: Partners: PHYSICS 22 LAB #1: ONE-DIMENSIONAL MOTION OBJECTIVES 1. To learn about three complementary ways to describe motion in one dimension words, graphs, and vector diagrams. 2. To acquire
Zeiss LSM 510 Confocor III Training Notes. Center for Cell Analysis & Modeling
 Zeiss LSM 510 Confocor III Training Notes Center for Cell Analysis & Modeling Confocor 3 Start Up Go to System Module Turn on Main Switch, System/ PC, and Components Switches Do you need the arc lamp?
HF Upgrade Studies: Characterization of Photo-Multiplier Tubes
 HF Upgrade Studies: Characterization of Photo-Multiplier Tubes 1. Introduction Photomultiplier tubes (PMTs) are very sensitive light detectors which are commonly used in high energy physics experiments.
CR Basics and FAQ. Overview. Historical Perspective
 Page: 1 of 6 CR Basics and FAQ Overview Computed Radiography is a term used to describe a system that electronically records a radiographic image. Computed Radiographic systems use unique image receptors
ZEISS LSM510META confocal manual
 ZEISS LSM510META confocal manual Switching on the system 1) Switch on the Remote Control button located on the table to the right of the microscope. This is the main switch for the whole system including
Operating Checklist for using the Laser Scanning Confocal Microscope. Leica TCS SP5.
 Smith College August 2010 Operating Checklist for using the Laser Scanning Confocal Microscope Leica TCS SP5. CONTENT, page no. Startup, 1 Initial set-up, 1 Software, 2 Microscope Specimen observation
3. are adherent cells (ie. cells in suspension are too far away from the coverslip)
") Before you begin, make sure your sample... 1. is seeded on #1.5 coverglass (thickness = 0.17) 2. is an aqueous solution (ie. fixed samples mounted on a slide will not work - not enough difference in refractive
Before you begin, make sure your sample... 1. is seeded on #1.5 coverglass (thickness = 0.17) 2. is an aqueous solution (ie. fixed samples mounted on a slide will not work - not enough difference in refractive
Nikon A1R. Multi-Photon & Laser Scanning Confocal Microscope. Kyle Marchuk Adam Fries Jordan Briscoe Kaitlin Corbin. April 2017.
 Nikon A1R Multi-Photon & Laser Scanning Confocal Microscope Kyle Marchuk Adam Fries Jordan Briscoe Kaitlin Corbin April 2017 Contents 1 Introduction 2 2 Start-Up 2 3 Imaging 4 3.1 Sample Alignment...........................................
How is the Digital Image Generated? Image Acquisition Devices
 In order for image analysis to be performed on a 2D gel, it must first be converted into digital data. Good image capture is critical to guarantee optimal performance of automated image analysis packages
SECTION I - CHAPTER 2 DIGITAL IMAGING PROCESSING CONCEPTS
 RADT 3463 - COMPUTERIZED IMAGING Section I: Chapter 2 RADT 3463 Computerized Imaging 1 SECTION I - CHAPTER 2 DIGITAL IMAGING PROCESSING CONCEPTS RADT 3463 COMPUTERIZED IMAGING Section I: Chapter 2 RADT
Color and More. Color basics
 Color and More In this lesson, you'll evaluate an image in terms of its overall tonal range (lightness, darkness, and contrast), its overall balance of color, and its overall appearance for areas that
(Refer Slide Time: 00:10)
") Fundamentals of optical and scanning electron microscopy Dr. S. Sankaran Department of Metallurgical and Materials Engineering Indian Institute of Technology, Madras Module 03 Unit-6 Instrumental details
Fundamentals of optical and scanning electron microscopy Dr. S. Sankaran Department of Metallurgical and Materials Engineering Indian Institute of Technology, Madras Module 03 Unit-6 Instrumental details
SpectraMax i3x Multi-Mode Detection Platform. Explore a wealth of applications in one future-ready system
 SpectraMax i3x Multi-Mode Detection Platform Explore a wealth of applications in one future-ready system Benefits User-upgradeable application modules including cellular imaging Sensitivity across spectrum
Multi-channel imaging cytometry with a single detector
 Multi-channel imaging cytometry with a single detector Sarah Locknar 1, John Barton 1, Mark Entwistle 2, Gary Carver 1 and Robert Johnson 1 1 Omega Optical, Brattleboro, VT 05301 2 Philadelphia Lightwave,
Opterra II Multipoint Scanning Confocal Microscope. Innovation with Integrity
 Opterra II Multipoint Scanning Confocal Microscope Enabling 4D Live-Cell Fluorescence Imaging through Speed, Sensitivity, Viability and Simplicity Innovation with Integrity Fluorescence Microscopy The
Why and How? Daniel Gitler Dept. of Physiology Ben-Gurion University of the Negev. Microscopy course, Michmoret Dec 2005
 Why and How? Daniel Gitler Dept. of Physiology Ben-Gurion University of the Negev Why use confocal microscopy? Principles of the laser scanning confocal microscope. Image resolution. Manipulating the
Quick Guide. NucleoCounter NC-3000
 Quick Guide NucleoCounter NC-3000 Table of contents Setting up the FlexiCyte Protocol 2 Editing Image Capture and Analysis Parameters 3 Optimizing Exposure Time 4 Compensation for Spectral Overlap 6 Creating
LEICA TCS SP5 AOBS TANDEM USER MANUAL
 LEICA TCS SP5 AOBS TANDEM USER MANUAL STARTING THE SYSTEM...2 THE LAS AF SOFTWARE...3 THE «ACQUIRE» MENU...5 CHOOSE AND CREATE A SETTING...6 THE CONTROL PANEL...8 THE DMI6000B MICROSCOPE...10 ACQUIRE ONE
Automated cdna microarray image segmentation
 Automated cdna microarray image segmentation Author Liew, Alan Wee-Chung, Yan, Hong Published 2007 Conference Title Proceedings of the International Symposium on Computational Models for Life Sciences
Illumination Correction tutorial
 Illumination Correction tutorial I. Introduction The Correct Illumination Calculate and Correct Illumination Apply modules are intended to compensate for the non uniformities in illumination often present
AxioVision 4.5 Brightfield Image Capture Procedure
 AxioVision 4.5 Brightfield Image Capture Procedure 1. STARTING-UP PROCEDURE: Remove blue dust cover and place on shelf under microscope. Turn on the halogen lamp by pushing the switch at the back right
High-sensitivity. optical molecular imaging and high-resolution digital X-ray. In-Vivo Imaging Systems
 High-sensitivity optical molecular imaging and high-resolution digital X-ray In-Vivo Imaging Systems In vivo imaging solutions available in several packages Carestream Molecular Imaging offers a selection
Module 4B7: VLSI Design, Technology, and CAD. Scanning Electron Microscopical Examination of CMOS Integrated Circuit
 Engineering Tripos Part IIB FOURTH YEAR Module 4B7: VLSI Design, Technology, and CAD Laboratory Experiment Dr D Holburn and Mr B Breton Scanning Electron Microscopical Examination of CMOS Integrated Circuit
VTube-LASER Quick Start Guide
 VTube-LASER Quick Start Guide This guide shows how to import a STEP file and then MEASURE and qualify demo tube 4 using the standard UNISCAN method of measuring. The steps in this workflow are from version
Low-level Analysis. cdna Microarrays. Lecture 2 Low Level Gene Expression Data Analysis. Stat 697K, CS 691K, Microbio 690K
 Lecture 2 Low Level Gene Expression Data nalysis Stat 697K, CS 691K, icrobio 690K Statistical Challenges odel variation of data not related to gene expression Compare expression for the same gene across
Applying Automated Optical Inspection Ben Dawson, DALSA Coreco Inc., ipd Group (987)
") Applying Automated Optical Inspection Ben Dawson, DALSA Coreco Inc., ipd Group bdawson@goipd.com (987) 670-2050 Introduction Automated Optical Inspection (AOI) uses lighting, cameras, and vision computers
Applying Automated Optical Inspection Ben Dawson, DALSA Coreco Inc., ipd Group bdawson@goipd.com (987) 670-2050 Introduction Automated Optical Inspection (AOI) uses lighting, cameras, and vision computers
1 Co Localization and Working flow with the lsm700
 1 Co Localization and Working flow with the lsm700 Samples -1 slide = mousse intestine, Dapi / Ki 67 with Cy3/ BrDU with alexa 488. -1 slide = mousse intestine, Dapi / Ki 67 with Cy3/ no BrDU (but with
Things to check before start-up.
 Byeong Cha Page 1 11/24/2009 Manual for Leica SP2 Confocal Microscope Enter you name, the date, the time, and the account number in the user log book. Things to check before start-up. Make sure that your
Comparing FCS and FRAP as methodologies for calculating diffusion
 Bi/BE 227 Winter 2018 Assignment #4 Comparing FCS and FRAP as methodologies for calculating diffusion Schedule: Jan 29: Assignment Jan 29-Feb 14: Work on assignment Feb 14: Student PowerPoint presentations.
Instructions for the Experiment
 Instructions for the Experiment Excitonic States in Atomically Thin Semiconductors 1. Introduction Alongside with electrical measurements, optical measurements are an indispensable tool for the study of
Supplemental Method Information Zeiss LSM710
 Supplemental Method Information Zeiss LSM710 1 Under the Light Path window set up the confocal for imaging a green dye (Alexa488-EGFP). For example, set up the light path as shown here using the 488 nm
How to align your laser for two-photon imaging
 How to align your laser for two-photon imaging Two-photon microscopy uses a laser to excite fluorescent molecules (fluorophores) within a sample through emitting short pulses of light at high power. This
STEM Spectrum Imaging Tutorial
 STEM Spectrum Imaging Tutorial Gatan, Inc. 5933 Coronado Lane, Pleasanton, CA 94588 Tel: (925) 463-0200 Fax: (925) 463-0204 April 2001 Contents 1 Introduction 1.1 What is Spectrum Imaging? 2 Hardware 3
Quick Operation Guide
 Quick Operation Guide Power ON Mounting specimens Set the specimen on the sample holder, and install the sample holder to the holder frame. Attach the holder frame to the XY stage. Type of holder Main
A Software Implementation of Data Acquisition Control and Management for Czerny Turner Monochromator
 A Software Implementation of Data Acquisition Control and Management for Czerny Turner Monochromator HAI-TRIEU PHAM, JUNG-BAE HWANG, YONGGWAN WON Department of Computer Engineering, Chonnam National University
TimeSync V3 User Manual. January Introduction
 TimeSync V3 User Manual January 2017 Introduction TimeSync is an application that allows researchers and managers to characterize and quantify disturbance and landscape change by facilitating plot-level
Systematic Workflow via Intuitive GUI. Easy operation accomplishes your goals faster than ever.
 Systematic Workflow via Intuitive GUI Easy operation accomplishes your goals faster than ever. 16 With the LEXT OLS4100, observation or measurement begins immediately once the sample is placed on the stage.
Nikon AZ100. Laser Scanning Macro Confocal Microscope. Jordan Briscoe Adam Fries Kyle Marchuk Kaitlin Corbin. May 2017.
 Nikon AZ100 Laser Scanning Macro Confocal Microscope Jordan Briscoe Adam Fries Kyle Marchuk Kaitlin Corbin May 2017 Contents 1 Introduction 2 2 Hardware - Startup 2 3 Software/Operation 4 3.1 Multidimensional
Leica_Dye_Finder :53 Uhr Seite 6 Dye Finder LAS AF
 Dye Finder LAS AF Dye Finder Multicolor live cell fluorescence microscopy is limited by the availability of spectrally separable fluorescent dyes. Fluorescent dyes (or spectral GFP variants) with incongruent
Spatial intensity distribution analysis Matlab user guide
 Spatial intensity distribution analysis Matlab user guide August 2011 Guide on how to use the SpIDA graphical user interface. This little tutorial provides a step by step tutorial explaining how to get
Laboratory 1: Motion in One Dimension
 Phys 131L Spring 2018 Laboratory 1: Motion in One Dimension Classical physics describes the motion of objects with the fundamental goal of tracking the position of an object as time passes. The simplest
The Basics. Introducing PaintShop Pro X4 CHAPTER 1. What s Covered in this Chapter
 CHAPTER 1 The Basics Introducing PaintShop Pro X4 What s Covered in this Chapter This chapter explains what PaintShop Pro X4 can do and how it works. If you re new to the program, I d strongly recommend