Earth s Gravitational Pull
|
|
|
- Alicia Nicholson
- 5 years ago
- Views:
Transcription
1 Satellite & Sensors

2 Space Countries
3 Earth s Gravitational Pull The Earth's gravity pulls everything toward the Earth. In order to orbit the Earth, the velocity of a body must be great enough to overcome the downward force of gravity One important fact to remember is that orbits within the Earth's atmosphere do not really exist. Atmospheric friction caused by the molecules of air (causing a frictional heating effect) will slow any object that could try to attain orbital velocity within the atmosphere. In space, with virtually no atmosphere to cause friction satellites can travel at velocities strong enough to counteract the downward pull of Earth's gravity The satellite is said to orbit around the Earth
4 Satellites Orbit

5 Geosyncronous Satellites GEO are circular orbits around the Earth having a period of 24 hours. A geosynchronous orbit with an inclination of zero degrees is called a geostationary orbit. A spacecraft in a geostationary orbit appears to hang motionless above one position on the Earth's equator. For this reason, they are ideal for some types of communication and meteorological satellites. A spacecraft in an inclined geosynchronous orbit will appear to follow a regular figure-8 pattern in the sky once every orbit. To attain geosynchronous orbit, a spacecraft is first launched into an elliptical orbit with an apogee of 35,786 km (22,236 miles) called a geosynchronous transfer orbit (GTO). The orbit is then circularized by firing the spacecraft's engine at apogee.

6 Typical Geostationary Coverage
7 Metereological Satellites

 from the geoid.")
8 Polar Orbits PO are orbits with an inclination of 90 degrees. Polar orbits are useful for satellites that carry out mapping and/or surveillance operations because as the planet rotates the spacecraft has access to virtually every point on the planet's surface Most PO are circular to slightly elliptical at distances ranging from 700 to 1700 km ( mi) from the geoid. At different altitudes they travel at different speeds.
9 Low-Spatial-resolution Sensors GOES Geostationary Operational Environment Satellite AVHRR Advanced Very High Resolution Radiometer MODIS Moderate Resolution Imaging Spectroradiometer SeaWiFS Sea-Viewing Wide Field-of-view Sensor
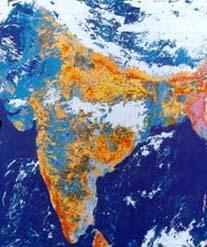
10 Satellites q Early satellites ARYABHATTA ( 360 kg ) ROHINI ( 40 kg ) Stretched ROHINI Series ( 150 kg ) BHASKARA I & II ( Remote Sensing ) APPLE ( Communication ) q Indian Remote Sensing Satellites ( IRS; Polar) q Indian National Satellites (INSAT; Geosynchronous )
 imaging radiometer designed to sense radiant and solar reflected energy from sampled areas of the")
11 GOES Geostationary Operational Environment Satellite The GOES I-M Imager is a five channel (one visible, four infrared) imaging radiometer designed to sense radiant and solar reflected energy from sampled areas of the earth.

12 GOES Geostationary Operational Environment Satellite

13 AVHRR Advanced Very High Resolution Radiometer Measuring the same view, this array of diverse wavelengths, after processing, permits multi spectral analysis for more precisely defining hydrologic, oceanographic, and meteorological parameters. Comparison of data from two channels is often used to observe features or measure various environmental parameters. The three channels operating entirely within the infrared band are used to detect the heat radiation from and hence, the temperature of land, water, sea surfaces, and the clouds above them.

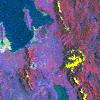
14 AVHRR Advanced Very High Resolution Radiometer
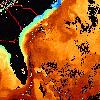
15 MODIS Moderate Resolution Imaging Spectroradiometer is a payload scientific instrument launched into Earth orbit by NASA in 1999 on board the Terra (EOS AM) Satellite, and in 2002 on board the Aqua (EOS PM) satellite. The instruments capture data in 36 spectral bands ranging in wavelength from 0.4 µm to 14.4 µm and at varying spatial resolutions (2 bands at 250 m, 5 bands at 500 m and 29 bands at 1 km). Together the instruments image the entire Earth every 1 to 2 days. They are designed to provide measurements in large-scale global dynamics including changes in Earth's cloud cover, radiation budget and processes occurring in the oceans, on land, and in the lower atmosphere.

16 MODIS Moderate Resolution Imaging Spectroradiometer


17 SeaWiFS Sea-Viewing Wide Field-of-view Sensor The purpose of the Sea-viewing Wide Field-of-view Sensor (SeaWiFS) Project is to provide useful data on ocean color to the Earth science community. Subtle changes in ocean color indicate various types and numbers of marine phytoplankton (microscopic marine plants), knowing this information can have both scientific and practical uses. The SeaWiFS Project will develop and operate a research tool that will process, calibrate, validate, archive and distribute data received from the Earthorbiting ocean color sensor.

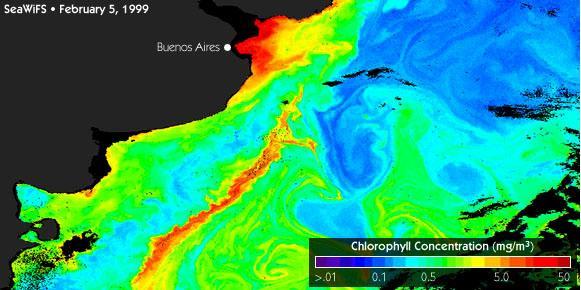
18 SeaWiFS Sea-Viewing Wide Field-of-view Sensor
 and three thermal bands at 3.7um, 11um, and 12um.")

19 Other Players ATRS - The ATSR channels are at wavelengths of 1.6um (visible) and three thermal bands at 3.7um, 11um, and 12um. AATSR - data have a resolution of 1 km at nadir, and are derived from measurements of reflected and emitted radiation taken at the following wavelengths: 0.55 µm, 0.66 µm, 0.87 µm, 1.6 µm, 3.7 µm, 11 µm and 12 µm.

20 Other Players MERIS

21 Other Players IRS-P4
22 Medium-Spatial-Resolution-Sensors Landsat Earth Resources Technology Satellite (ERTS-1) Spot Systeme Pour l Observation de la Terre IRS Indian Remote Sensing Satellite IRS-P6 - Indian ResourseSat Aster Advanced Spacebourne Thermal Emission and Reflection Radiometer
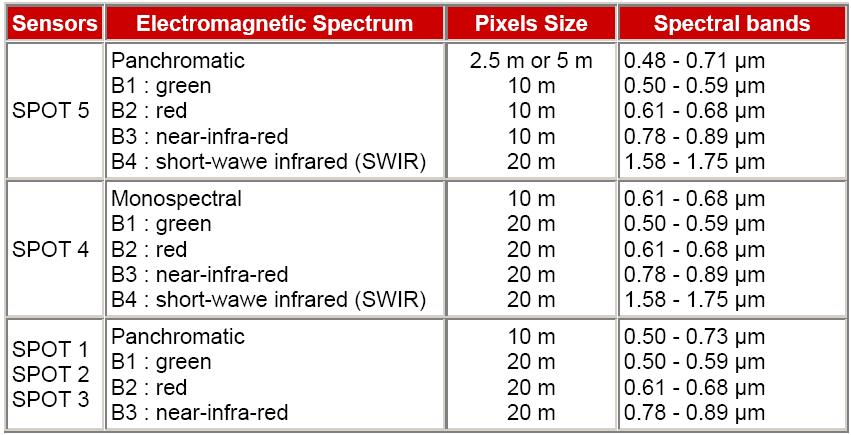
23 Landsat Landsat 1,2,3 4,5 (TM)6,7 (ETM+) Match the band combinations with their respective images 5 Thematic Mapper spectral band definitions: Band 1: micrometers (blue-green) Band 2: micrometers (green) Band 3: micrometers (red) Band 4: micrometers (near infrared) Band 5: micrometers (near infrared) Band 6: micrometers (thermal infrared) Band 7: micrometers (shortwave infrared)
 Band 2: 0.52-0.60 micrometers (green) Band 3: 0.")
 Band 6: 10.4-12.5 micrometers (thermal infrared) Band 7: 2.08-2.")
24 3, 2, 1 Landsat Landsat 1,2,3 4,5 (TM)6,7 (ETM+) 3,4,5 3,2,1 4,3,2 5,4,3 5 Thematic Mapper spectral band definitions: Band 1: micrometers (blue-green) Band 2: micrometers (green) Band 3: micrometers (red) Band 4: micrometers (near infrared) Band 5: micrometers (near infrared) Band 6: micrometers (thermal infrared) Band 7: micrometers (shortwave infrared)
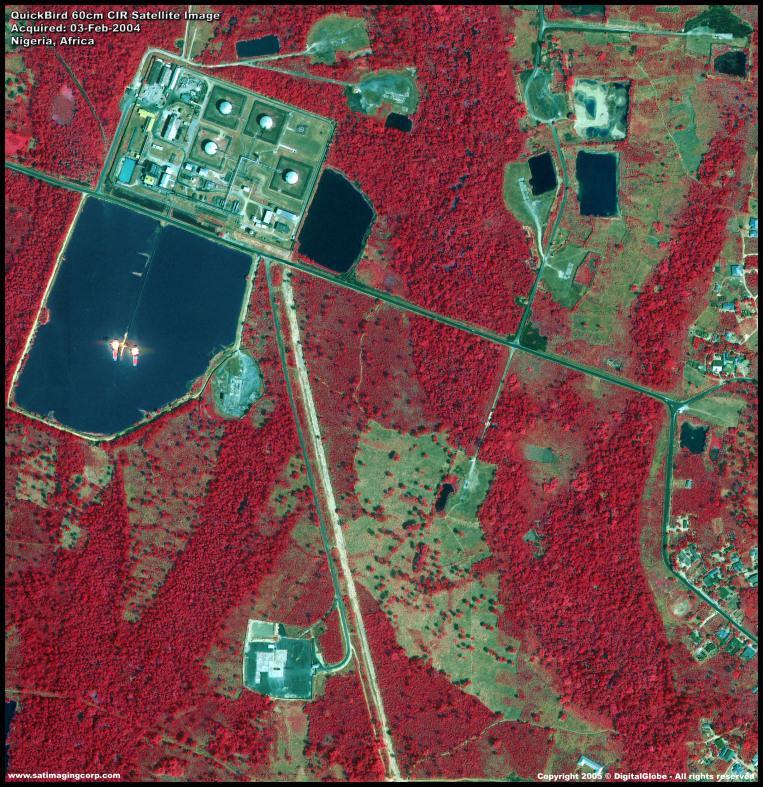
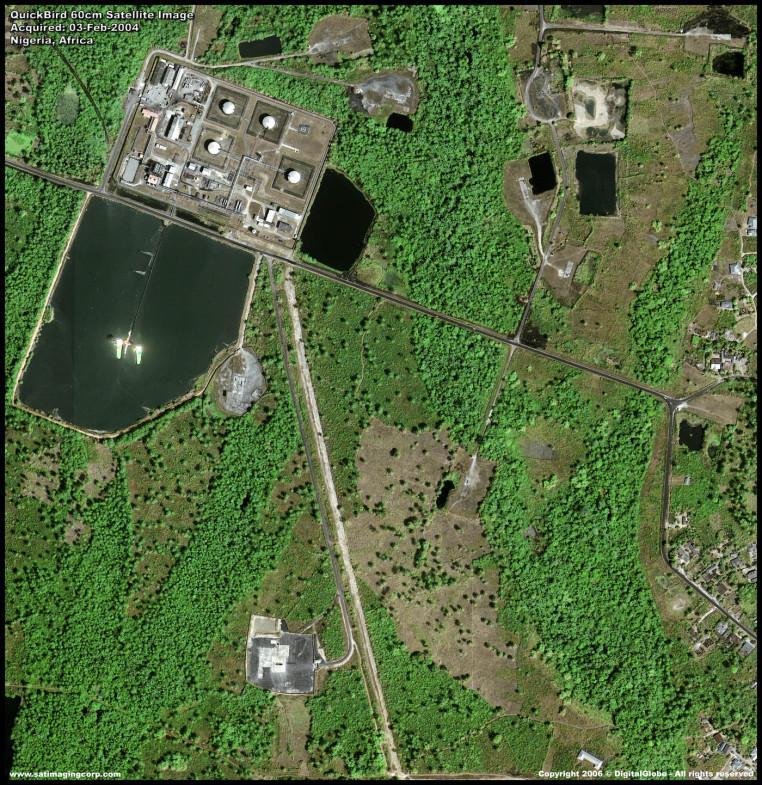
25 Landsat What does NIR tell us? Since NIR has longer wavelengths than visible light, it exhibits peculiar properties that can be exploited for remote sensing applications. Some of the information that can be obtained from NIR is crop stress (water and nutrient stress being the most common) and weed/pest infestations. Chlorophyll pigment absorbs most energy at about 650 nm (red) and around 450 nm (blue). Other pigments absorb more visible wavelengths, but the most absorption occurs in the red and blue portions of the spectrum. This absorption removes these colors from the amount of light that is transmitted and reflected, causing the predominant visible color that reaches our eyes as green. This is the reason healthy vegetation appears as a dark green. Unhealthy vegetation, on the other hand, will have less chlorophyll and thus will appear brighter (visibly) since less is absorbed and more is reflected to our eyes. This increase in red reflectance along with the green is what causes a general yellow appearance of unhealthy plants.

26 Landsat and Infrared Another feature of vegetation is the strong reflectance within the NIR. Since NIR is not absorbed by any pigments within a plant, it travels through most of the leaf and interacts with the spongy mesophyll cells. This interaction causes about half of the energy to be reflected and the other half to be transmitted through the leaf. In plants with turged and healthy mesophyll cell walls and in dense canopies, more NIR energy will be reflected and less transmitted. This cell wall/air space interaction within these cells causes healthy vegetation to look very bright in the NIR. In fact, much more NIR is reflected than visible.

27 Landsat and Infrared By monitoring the amount of NIR and visible energy reflected from a plant, it is possible to determine the health of that plant. High NIR reflectance / Low visible reflectance = Healthy Low NIR reflectance / High visible reflectance = Unhealthy
28 Landsat and Infrared First, we need to know that a spacecraft (Landsat, SPOT, or the SIR-C radar) does not "see" in color. Every image is obtained in black and white at a precise wavelength (usually between 0.4 to 12.0 microns). These electronic cameras only collect information in black and white, but they can obtain many images at the same time in different parts of the spectrum. If we look at the diagram below of the spectrum, we see several broad regions that include the ultraviolet (wavelengths between microns), visible (0.4 to 0.7 microns), near-infrared (0.7 to 1.2 microns), the solar reflected infrared (1.2 to 3.2 microns), the mid-infrared (3.2 to 15 microns) and the far infrared (longer than 15.0 microns).

29 Landsat and Infrared
30 Landsat and Infrared The value in obtaining multiple images at different wavelengths can be seen in the above figure. Here we show the individual images that were obtained by Band 2 ( microns), Band 7 ( microns) and Band 11 ( microns). Careful inspection of these three images shows that the different parts of Honolulu have different brightnesses at different wavelengths. For example, at points "a" in Band 2, we can see through the shallow water along the coastline to see the coral reef along Waikiki. At point "b" in Band 2, the rain forest on the Koolau Range is quite dark, but at the same place in Band 7, the vegetation appears quite bright. This is due to the reflective nature of chlorophyll in the leaves at this wavelength.

31 Landsat and Infrared Indeed, the relative brightness between the rain forest and the city is flipped as we look at the two images. This change in contrast is also seen between Bands 7 and 11. If we look at area "c" in Band 11, we see some dark patches. These are clouds, which in the thermal infrared are cold, but at shorter wavelengths (Bands 2 and 7) are highly reflective due to the water droplets and so are bright. Band 11 is very sensitive to temperature, and we can also find things that are warm (i.e., bright) in this image that are dark in other bands. Areas "d", which include parts of the airport runways and the sides of Diamond Head facing the sun, are both warmer than the average scene and so are bright. It is interesting to try to compare these areas in Band 2 or 7, since they are obviously quite different.

32 Landsat and Infrared Having seen that different bands (or wavelengths) have a different contrast, we can now study how the computer can produce a color image from a remote sensing data set. To do this, we take three images, which are the black and white images corresponding to Bands 2, 8 and 10.

33 SPOT Wednesday 15 August at 23 hours 40 minutes and 57 seconds UTC, an earthquake of magnitude 8 on the Richter scale shook Peru s coastline and the capital city Lima. The quake flattened 70% of the city of Pisco, spreading panic among its 130,000 inhabitants. A com parison of a SPOT 5 satellite image acquired 21 August and an archive image of 10 January 2006 highlights the trail of destruction. The streets crisscrossing the city are lying under rubble and collapsed buildings show up in the different texture of the post-quake image. Such texture differences make it possible to measure the exact extent of quake damage.
34 SPOT

35 SPOT of Mount Saint Michel

36 IRS Indian Remote Sensing Satellite The first two IRS spacecraft, IRS-1A (March' 1988) and IRS-1B (August, 1991) were launched by Russian Vostok boosters from the Baikonur Cosmodrome. IRS-1A failed in 1992, while IRS-1B continued to operate through From their 22-day repeating orbits of 905 km mean altitude and 99 degrees inclination, the two identical IRS spacecraft hosted a trio of Linear Imaging Self-Scanning (LISS) remote sensing COD instruments working in four spectral bands: µm µm, µm, and µm. The 38.5-kg LISS-I images a swath of 148 km with a resolution of 72.5 m while the kg LISS-IIA and LISS-IIB exhibit a narrower fieldof-view (74-km swath) but are aligned to provide a composite 145-km swath with a 3- km overlap and a resolution of m.
37 IRS-P6 (ResourceSat-1) IRS-P6 (RESOURCESAT-1) will be a state-of-art satellite mainly for agriculture applications and will have a 3-band multispectral LISS-IV camera with a spatial resolution better than 6 m and a swath of around 25 km with across track steerability for selected area monitoring. An improved version of LISS-III with four bands (red, green, near IR and SWIR), all at 23 m resolution and 140 km swath will provide the essential continuity to LISS-III. These sensors will provide data which will be useful for vegetation related applications and will allow multiple crop discrimination and species level discrimination. Together with an advanced Wide Field Sensor (WiFS) with 80 m resolution and 1400 km swath, the payloads will greatly aid crop/vegetation and integrated land and water resources related applications. The IRS-P6 is slated for launch by PSLV by end of 2000.
 This image shows the areas of")

38 ALOS Advanced Land Observation Satellite (Japan) This image shows the areas of Tokyo Bay. Read spots in the bay likely indicate a plague of phytoplankton. 2006/06/01 Daichi
,")
, the Shortwave")
39 ASTER The ASTER instrument consists of three separate instrument subsystems. Each subsystem operates in a different spectral region, has its own telescope(s), and was built by a different Japanese company. ASTER's three subsystems are: the Visible and Near Infrared (VNIR), the Shortwave Infrared (SWIR), and the Thermal Infrared (TIR).
40 High-Spatial-Resolution-Sensors IKONOS Space Imaging (formerly EOSAT) forming GeoEye Quickbird - Digitalglobe OrbView - GeoEye-1, formerly known as OrbView-5, is the next-generation high-resolution imaging mission of GeoEye, Dulles, VA, USA. In January 2006, the commercial imaging company GeoEye was formed, made up of former Orbimage of Dulles VA, and of former Space Imaging of Thornton, CO (Orbimage acquired Space Imaging in 2005 and gave the merged company the new name of GeoEye). The newly formed GeoEye company is the world's largest commercial satellite imagery provider.

41 The IKONOS Satellite is a high-resolution satellite operated by GeoEye. Its capabilities include capturing a 3.2m multispectral, Near-Infrared (NIR)/0.82m panchromatic resolution at nadir. Its applications include both urban and rural mapping of natural resources and of natural disasters, tax mapping, agriculture and forestry analysis, mining, engineering, construction, and change detection. It can yield relevant data for nearly all aspects of environmental study. IKONOS images have also been procured by SIC for use in the media and motion picture industries, providing aerial views and satellite photos for many areas around the world. Its high resolution data makes an integral contribution to homeland security, coastal monitoring and facilitates 3D Terrain analysis. IKONOS
42 Quickbird

43 OrbView NGA announced on September 30, 2004 that it has selected ORBIMAGE as its NextView second vendor after a competitive selection process conducted over the last six months. The contract, awarded September 30, 2004, runs through September 30, 2008 and will provide ORBIMAGE with both long-term revenue commitments as well as capital for the development of OrbView-5, ORBIMAGE's next-generation high-resolution imaging satellite. The contract, known as NextView ORBIMAGE, also assures NGA of greater access and priority to high-resolution commercial satellite imagery.
Lecture 6: Multispectral Earth Resource Satellites. The University at Albany Fall 2018 Geography and Planning
 Lecture 6: Multispectral Earth Resource Satellites The University at Albany Fall 2018 Geography and Planning Outline SPOT program and other moderate resolution systems High resolution satellite systems
The studies began when the Tiros satellites (1960) provided man s first synoptic view of the Earth s weather systems.
 provided man s first synoptic view of the Earth s weather systems.") Remote sensing of the Earth from orbital altitudes was recognized in the mid-1960 s as a potential technique for obtaining information important for the effective use and conservation of natural resources.
Remote sensing of the Earth from orbital altitudes was recognized in the mid-1960 s as a potential technique for obtaining information important for the effective use and conservation of natural resources.
NON-PHOTOGRAPHIC SYSTEMS: Multispectral Scanners Medium and coarse resolution sensor comparisons: Landsat, SPOT, AVHRR and MODIS
 NON-PHOTOGRAPHIC SYSTEMS: Multispectral Scanners Medium and coarse resolution sensor comparisons: Landsat, SPOT, AVHRR and MODIS CLASSIFICATION OF NONPHOTOGRAPHIC REMOTE SENSORS PASSIVE ACTIVE DIGITAL
The studies began when the Tiros satellites (1960) provided man s first synoptic view of the Earth s weather systems.
 provided man s first synoptic view of the Earth s weather systems.") Remote sensing of the Earth from orbital altitudes was recognized in the mid-1960 s as a potential technique for obtaining information important for the effective use and conservation of natural resources.
Remote sensing of the Earth from orbital altitudes was recognized in the mid-1960 s as a potential technique for obtaining information important for the effective use and conservation of natural resources.
9/12/2011. Training Course Remote Sensing Basic Theory & Image Processing Methods September 2011
 Training Course Remote Sensing Basic Theory & Image Processing Methods 19 23 September 2011 Popular Remote Sensing Sensors & their Selection Michiel Damen (September 2011) damen@itc.nl 1 Overview Low resolution
Introduction of Satellite Remote Sensing
 Introduction of Satellite Remote Sensing Spatial Resolution (Pixel size) Spectral Resolution (Bands) Resolutions of Remote Sensing 1. Spatial (what area and how detailed) 2. Spectral (what colors bands)
An Introduction to Remote Sensing & GIS. Introduction
 An Introduction to Remote Sensing & GIS Introduction Remote sensing is the measurement of object properties on Earth s surface using data acquired from aircraft and satellites. It attempts to measure something
Remote Sensing Platforms
 Types of Platforms Lighter-than-air Remote Sensing Platforms Free floating balloons Restricted by atmospheric conditions Used to acquire meteorological/atmospheric data Blimps/dirigibles Major role - news
Lecture 13: Remotely Sensed Geospatial Data
 Lecture 13: Remotely Sensed Geospatial Data A. The Electromagnetic Spectrum: The electromagnetic spectrum (Figure 1) indicates the different forms of radiation (or simply stated light) emitted by nature.
746A27 Remote Sensing and GIS. Multi spectral, thermal and hyper spectral sensing and usage
 746A27 Remote Sensing and GIS Lecture 3 Multi spectral, thermal and hyper spectral sensing and usage Chandan Roy Guest Lecturer Department of Computer and Information Science Linköping University Multi
Remote Sensing for Rangeland Applications
 Remote Sensing for Rangeland Applications Jay Angerer Ecological Training June 16, 2012 Remote Sensing The term "remote sensing," first used in the United States in the 1950s by Ms. Evelyn Pruitt of the
Remote Sensing Platforms
 Remote Sensing Platforms Remote Sensing Platforms - Introduction Allow observer and/or sensor to be above the target/phenomena of interest Two primary categories Aircraft Spacecraft Each type offers different
REMOTE SENSING. Topic 10 Fundamentals of Digital Multispectral Remote Sensing MULTISPECTRAL SCANNERS MULTISPECTRAL SCANNERS
 REMOTE SENSING Topic 10 Fundamentals of Digital Multispectral Remote Sensing Chapter 5: Lillesand and Keifer Chapter 6: Avery and Berlin MULTISPECTRAL SCANNERS Record EMR in a number of discrete portions
Interpreting land surface features. SWAC module 3
 Interpreting land surface features SWAC module 3 Interpreting land surface features SWAC module 3 Different kinds of image Panchromatic image True-color image False-color image EMR : NASA Echo the bat
IKONOS High Resolution Multispectral Scanner Sensor Characteristics
 High Spatial Resolution and Hyperspectral Scanners IKONOS High Resolution Multispectral Scanner Sensor Characteristics Launch Date View Angle Orbit 24 September 1999 Vandenberg Air Force Base, California,
Introduction to Remote Sensing Fundamentals of Satellite Remote Sensing. Mads Olander Rasmussen
 Introduction to Remote Sensing Fundamentals of Satellite Remote Sensing Mads Olander Rasmussen (mora@dhi-gras.com) 01. Introduction to Remote Sensing DHI What is remote sensing? the art, science, and technology
Final Examination Introduction to Remote Sensing. Time: 1.5 hrs Max. Marks: 50. Section-I (50 x 1 = 50 Marks)
") Final Examination Introduction to Remote Sensing Time: 1.5 hrs Max. Marks: 50 Note: Attempt all questions. Section-I (50 x 1 = 50 Marks) 1... is the technology of acquiring information about the Earth's
Final Examination Introduction to Remote Sensing Time: 1.5 hrs Max. Marks: 50 Note: Attempt all questions. Section-I (50 x 1 = 50 Marks) 1... is the technology of acquiring information about the Earth's
Some Basic Concepts of Remote Sensing. Lecture 2 August 31, 2005
 Some Basic Concepts of Remote Sensing Lecture 2 August 31, 2005 What is remote sensing Remote Sensing: remote sensing is science of acquiring, processing, and interpreting images and related data that
Introduction to Remote Sensing
 Introduction to Remote Sensing Spatial, spectral, temporal resolutions Image display alternatives Vegetation Indices Image classifications Image change detections Accuracy assessment Satellites & Air-Photos
Geo/SAT 2 INTRODUCTION TO REMOTE SENSING
 Geo/SAT 2 INTRODUCTION TO REMOTE SENSING Paul R. Baumann, Professor Emeritus State University of New York College at Oneonta Oneonta, New York 13820 USA COPYRIGHT 2008 Paul R. Baumann Introduction Remote
GIS Data Collection. Remote Sensing
 GIS Data Collection Remote Sensing Data Collection Remote sensing Introduction Concepts Spectral signatures Resolutions: spectral, spatial, temporal Digital image processing (classification) Other systems
Coral Reef Remote Sensing
 Coral Reef Remote Sensing Spectral, Spatial, Temporal Scaling Phillip Dustan Sensor Spatial Resolutio n Number of Bands Useful Bands coverage cycle Operation Landsat 80m 2 2 18 1972-97 Thematic 30m 7
Satellite Remote Sensing: Earth System Observations
 Satellite Remote Sensing: Earth System Observations Land surface Water Atmosphere Climate Ecosystems 1 EOS (Earth Observing System) Develop an understanding of the total Earth system, and the effects of
Govt. Engineering College Jhalawar Model Question Paper Subject- Remote Sensing & GIS
 Govt. Engineering College Jhalawar Model Question Paper Subject- Remote Sensing & GIS Time: Max. Marks: Q1. What is remote Sensing? Explain the basic components of a Remote Sensing system. Q2. What is
Remote Sensing Exam 2 Study Guide
 Remote Sensing Exam 2 Study Guide Resolution Analog to digital Instantaneous field of view (IFOV) f ( cone angle of optical system ) Everything in that area contributes to spectral response mixels Sampling
Remote Sensing and GIS
 Remote Sensing and GIS Atmosphere Reflected radiation, e.g. Visible Emitted radiation, e.g. Infrared Backscattered radiation, e.g. Radar (λ) Visible TIR Radar & Microwave 11/9/2017 Geo327G/386G, U Texas,
On the use of water color missions for lakes in 2021
 Lakes and Climate: The Role of Remote Sensing June 01-02, 2017 On the use of water color missions for lakes in 2021 Cédric G. Fichot Department of Earth and Environment 1 Overview 1. Past and still-ongoing
Spectral Signatures. Vegetation. 40 Soil. Water WAVELENGTH (microns)
") Spectral Signatures % REFLECTANCE VISIBLE NEAR INFRARED Vegetation Soil Water.5. WAVELENGTH (microns). Spectral Reflectance of Urban Materials 5 Parking Lot 5 (5=5%) Reflectance 5 5 5 5 5 Wavelength (nm)
Spectral Signatures % REFLECTANCE VISIBLE NEAR INFRARED Vegetation Soil Water.5. WAVELENGTH (microns). Spectral Reflectance of Urban Materials 5 Parking Lot 5 (5=5%) Reflectance 5 5 5 5 5 Wavelength (nm)
Int n r t o r d o u d c u ti t on o n to t o Remote Sensing
 Introduction to Remote Sensing Definition of Remote Sensing Remote sensing refers to the activities of recording/observing/perceiving(sensing)objects or events at far away (remote) places. In remote sensing,
1. Theory of remote sensing and spectrum
 1. Theory of remote sensing and spectrum 7 August 2014 ONUMA Takumi Outline of Presentation Electromagnetic wave and wavelength Sensor type Spectrum Spatial resolution Spectral resolution Mineral mapping
Aral Sea profile Selection of area 24 February April May 1998
 250 km Aral Sea profile 1960 1960 1985 1986 1987 1988 1989 1990 1991 1992 1993 1994 1995 1996 1997 1998 2010? Selection of area Area of interest Kzyl-Orda Dried seabed 185 km Syrdarya river Aral Sea Salt
Blacksburg, VA July 24 th 30 th, 2010 Remote Sensing Page 1. A condensed overview. For our purposes
 A condensed overview George McLeod Prepared by: With support from: NSF DUE-0903270 in partnership with: Geospatial Technician Education Through Virginia s Community Colleges (GTEVCC) The art and science
Sensor resolutions from space: the tension between temporal, spectral, spatial and swath. David Bruce UniSA and ISU
 Sensor resolutions from space: the tension between temporal, spectral, spatial and swath David Bruce UniSA and ISU 1 Presentation aims 1. Briefly summarize the different types of satellite image resolutions
Geostationary satellites
 Polar satellites 800 km. 99 relative to the Equator S-N during ascending leg & N-S during descending leg Each orbit 100 minutes 14 orbits a day. Sun-Synchronous provides consistent lighting of Earth-scan
REMOTE SENSING FOR FLOOD HAZARD STUDIES.
 REMOTE SENSING FOR FLOOD HAZARD STUDIES. OPTICAL SENSORS. 1 DRS. NANETTE C. KINGMA 1 Optical Remote Sensing for flood hazard studies. 2 2 Floods & use of remote sensing. Floods often leaves its imprint
NORMALIZING ASTER DATA USING MODIS PRODUCTS FOR LAND COVER CLASSIFICATION
 NORMALIZING ASTER DATA USING MODIS PRODUCTS FOR LAND COVER CLASSIFICATION F. Gao a, b, *, J. G. Masek a a Biospheric Sciences Branch, NASA Goddard Space Flight Center, Greenbelt, MD 20771, USA b Earth
Introduction to Satellite Remote Sensing
 Introduction to Satellite Remote Sensing Remote sensing of the Earth from orbital altitudes was recognized in the mid-1960 s as a potential technique for obtaining information important for the effective
REMOTE SENSING INTERPRETATION
 REMOTE SENSING INTERPRETATION Jan Clevers Centre for Geo-Information - WU Remote Sensing --> RS Sensor at a distance EARTH OBSERVATION EM energy Earth RS is a tool; one of the sources of information! 1
Remote Sensing. Division C. Written Exam
 Remote Sensing Division C Written Exam Team Name: Team #: Team Members: _ Score: /132 A. Matching (10 points) 1. Nadir 2. Albedo 3. Diffraction 4. Refraction 5. Spatial Resolution 6. Temporal Resolution
Introduction to Remote Sensing
 Introduction to Remote Sensing Outline Remote Sensing Defined Resolution Electromagnetic Energy (EMR) Types Interpretation Applications Remote Sensing Defined Remote Sensing is: The art and science of
A map says to you, 'Read me carefully, follow me closely, doubt me not.' It says, 'I am the Earth in the palm of your hand. Without me, you are alone
 A map says to you, 'Read me carefully, follow me closely, doubt me not.' It says, 'I am the Earth in the palm of your hand. Without me, you are alone and lost. Beryl Markham (West With the Night, 1946
Using Freely Available. Remote Sensing to Create a More Powerful GIS
 Using Freely Available Government Data and Remote Sensing to Create a More Powerful GIS All rights reserved. ENVI, E3De, IAS, and IDL are trademarks of Exelis, Inc. All other marks are the property of
Introduction to Remote Sensing Part 1
 Introduction to Remote Sensing Part 1 A Primer on Electromagnetic Radiation Digital, Multi-Spectral Imagery The 4 Resolutions Displaying Images Corrections and Enhancements Passive vs. Active Sensors Radar
Remote Sensing in Daily Life. What Is Remote Sensing?
 Remote Sensing in Daily Life What Is Remote Sensing? First time term Remote Sensing was used by Ms Evelyn L Pruitt, a geographer of US in mid 1950s. Minimal definition (not very useful): remote sensing
Outline. Introduction. Introduction: Film Emulsions. Sensor Systems. Types of Remote Sensing. A/Prof Linlin Ge. Photographic systems (cf(
 GMAT x600 Remote Sensing / Earth Observation Types of Sensor Systems (1) Outline Image Sensor Systems (i) Line Scanning Sensor Systems (passive) (ii) Array Sensor Systems (passive) (iii) Antenna Radar
Indian Remote Sensing Satellites
 Resourcesat-1 Indian Remote Sensing Satellites -Current & Future Resourcesat Missions - Presented by: Timothy J. Puckorius Chairman & CEO EOTec 1 Presentation Topics India s Earth Observation Heritage
Satellite Imagery and Remote Sensing. DeeDee Whitaker SW Guilford High EES & Chemistry
 Satellite Imagery and Remote Sensing DeeDee Whitaker SW Guilford High EES & Chemistry whitakd@gcsnc.com Outline What is remote sensing? How does remote sensing work? What role does the electromagnetic
Remote Sensing. Measuring an object from a distance. For GIS, that means using photographic or satellite images to gather spatial data
 Remote Sensing Measuring an object from a distance For GIS, that means using photographic or satellite images to gather spatial data Remote Sensing measures electromagnetic energy reflected or emitted
Copernicus Introduction Lisbon, Portugal 13 th & 14 th February 2014
 Copernicus Introduction Lisbon, Portugal 13 th & 14 th February 2014 Contents Introduction GMES Copernicus Six thematic areas Infrastructure Space data An introduction to Remote Sensing In-situ data Applications
Chapter 8. Remote sensing
 1. Remote sensing 8.1 Introduction 8.2 Remote sensing 8.3 Resolution 8.4 Landsat 8.5 Geostationary satellites GOES 8.1 Introduction What is remote sensing? One can describe remote sensing in different
3/31/03. ESM 266: Introduction 1. Observations from space. Remote Sensing: The Major Source for Large-Scale Environmental Information
 Remote Sensing: The Major Source for Large-Scale Environmental Information Jeff Dozier Observations from space Sun-synchronous polar orbits Global coverage, fixed crossing, repeat sampling Typical altitude
Light penetration within a clear water body. E z = E 0 e -kz
 THE BLUE PLANET 1 2 Light penetration within a clear water body E z = E 0 e -kz 3 4 5 Pure Seawater Phytoplankton b w 10-2 m -1 b w 10-2 m -1 b w, Morel (1974) a w, Pope and Fry (1997) b chl,loisel and
Remote Sensing of Environment (RSE)
") I N T R O Introduction to Introduction to Remote Sensing T O R S E Remote Sensing of Environment (RSE) with TNTmips page 1 TNTview Before Getting Started Imagery acquired by airborne or satellite sensors
I N T R O Introduction to Introduction to Remote Sensing T O R S E Remote Sensing of Environment (RSE) with TNTmips page 1 TNTview Before Getting Started Imagery acquired by airborne or satellite sensors
NEC s EO Sensors and Data Applications
 NEC s EO Sensors and Data Applications Second Singapore Space Symposium 30 September, 2015 Nanyang Technological University, Singapore Shimpei Kondo Space Technologies Department, Space System Division,
Satellite/Aircraft Imaging Systems Imaging Sensors Standard scanner designs Image data formats
 CEE 6150: Digital Image Processing 1 Satellite/Aircraft Imaging Systems Imaging Sensors Standard scanner designs Image data formats CEE 6150: Digital Image Processing 2 CEE 6150: Digital Image Processing
Remote Sensing 1 Principles of visible and radar remote sensing & sensors
 Remote Sensing 1 Principles of visible and radar remote sensing & sensors Nick Barrand School of Geography, Earth & Environmental Sciences University of Birmingham, UK Field glaciologist collecting data
Important Missions. weather forecasting and monitoring communication navigation military earth resource observation LANDSAT SEASAT SPOT IRS
 Fundamentals of Remote Sensing Pranjit Kr. Sarma, Ph.D. Assistant Professor Department of Geography Mangaldai College Email: prangis@gmail.com Ph. No +91 94357 04398 Remote Sensing Remote sensing is defined
Part I. The Importance of Image Registration for Remote Sensing
 Part I The Importance of Image Registration for Remote Sensing 1 Introduction jacqueline le moigne, nathan s. netanyahu, and roger d. eastman Despite the importance of image registration to data integration
Remote Sensing of the Environment An Earth Resource Perspective John R. Jensen Second Edition
 Remote Sensing of the Environment An Earth Resource Perspective John R. Jensen Second Edition Pearson Education Limited Edinburgh Gate Harlow Essex CM20 2JE England and Associated Companies throughout
Introduction to Remote Sensing
 Introduction to Remote Sensing Daniel McInerney Urban Institute Ireland, University College Dublin, Richview Campus, Clonskeagh Drive, Dublin 14. 16th June 2009 Presentation Outline 1 2 Spaceborne Sensors
Passive Microwave Sensors LIDAR Remote Sensing Laser Altimetry. 28 April 2003
 Passive Microwave Sensors LIDAR Remote Sensing Laser Altimetry 28 April 2003 Outline Passive Microwave Radiometry Rayleigh-Jeans approximation Brightness temperature Emissivity and dielectric constant
US Commercial Imaging Satellites
 US Commercial Imaging Satellites In the early 1990s, Russia began selling 2-meter resolution product from its archives of collected spy satellite imagery. Some of this product was down-sampled to provide
Remote Sensing. in Agriculture. Dr. Baqer Ramadhan CRP 514 Geographic Information System. Adel M. Al-Rebh G Term Paper.
 Remote Sensing in Agriculture Term Paper to Dr. Baqer Ramadhan CRP 514 Geographic Information System By Adel M. Al-Rebh G199325390 May 2012 Table of Contents 1.0 Introduction... 4 2.0 Objective... 4 3.0
John P. Stevens HS: Remote Sensing Test
 Name(s): Date: Team name: John P. Stevens HS: Remote Sensing Test 1 Scoring: Part I - /18 Part II - /40 Part III - /16 Part IV - /14 Part V - /93 Total: /181 2 I. History (3 pts. each) 1. What is the name
CHAPTER 7: Multispectral Remote Sensing
 CHAPTER 7: Multispectral Remote Sensing REFERENCE: Remote Sensing of the Environment John R. Jensen (2007) Second Edition Pearson Prentice Hall Overview of How Digital Remotely Sensed Data are Transformed
Figure 1: Percent reflectance for various features, including the five spectra from Table 1, at different wavelengths from 0.4µm to 1.4µm.
 Section 1: The Electromagnetic Spectrum 1. The wavelength range that has the highest reflectance for broadleaf vegetation and needle leaf vegetation is 0.75µm to 1.05µm. 2. Dry soil can be distinguished
JP Stevens High School: Remote Sensing
 1 Name(s): ANSWER KEY Date: Team name: JP Stevens High School: Remote Sensing Scoring: Part I - /18 Part II - /40 Part III - /16 Part IV - /14 Part V - /93 Total: /181 2 I. History (3 pts each) 1. What
ASTER ADVANCED SPACEBORNE THERMAL EMISSION AND REFLECTION RADIOMETER
 ASTER ADVANCED SPACEBORNE THERMAL EMISSION AND REFLECTION RADIOMETER Front Cover image: Simulated ASTER images of Death Valley, California. The visible image (left) shows vegetation in red, salt deposits
Monitoring agricultural plantations with remote sensing imagery
 MPRA Munich Personal RePEc Archive Monitoring agricultural plantations with remote sensing imagery Camelia Slave and Anca Rotman University of Agronomic Sciences and Veterinary Medicine - Bucharest Romania,
Dr. P Shanmugam. Associate Professor Department of Ocean Engineering Indian Institute of Technology (IIT) Madras INDIA
 Madras INDIA") Dr. P Shanmugam Associate Professor Department of Ocean Engineering Indian Institute of Technology (IIT) Madras INDIA Biography Ph.D (Remote Sensing and Image Processing for Coastal Studies) - Anna University,
Dr. P Shanmugam Associate Professor Department of Ocean Engineering Indian Institute of Technology (IIT) Madras INDIA Biography Ph.D (Remote Sensing and Image Processing for Coastal Studies) - Anna University,
FOR 353: Air Photo Interpretation and Photogrammetry. Lecture 2. Electromagnetic Energy/Camera and Film characteristics
 FOR 353: Air Photo Interpretation and Photogrammetry Lecture 2 Electromagnetic Energy/Camera and Film characteristics Lecture Outline Electromagnetic Radiation Theory Digital vs. Analog (i.e. film ) Systems
An Introduction to Geomatics. Prepared by: Dr. Maher A. El-Hallaq خاص بطلبة مساق مقدمة في علم. Associate Professor of Surveying IUG
 An Introduction to Geomatics خاص بطلبة مساق مقدمة في علم الجيوماتكس Prepared by: Dr. Maher A. El-Hallaq Associate Professor of Surveying IUG 1 Airborne Imagery Dr. Maher A. El-Hallaq Associate Professor
BASICS OF REMOTE SENSING
 BASICS OF REMOTE SENSING 23: Basics of Remote Sensing Shibendu Shankar Ray Mahalanobis National Crop Forecast Centre, Department of Agriculture & Cooperation, Krishi Vistar Sadan, Pusa Campus, New Delhi
Remote sensing in archaeology from optical to lidar. Krištof Oštir ModeLTER Scientific Research Centre of the Slovenian Academy of Sciences and Arts
 Remote sensing in archaeology from optical to lidar Krištof Oštir ModeLTER Scientific Research Centre of the Slovenian Academy of Sciences and Arts Introduction Optical remote sensing Systems Search for
Module 3 Introduction to GIS. Lecture 8 GIS data acquisition
 Module 3 Introduction to GIS Lecture 8 GIS data acquisition GIS workflow Data acquisition (geospatial data input) GPS Remote sensing (satellites, UAV s) LiDAR Digitized maps Attribute Data Management Data
Urban Classification of Metro Manila for Seismic Risk Assessment using Satellite Images
 Urban Classification of Metro Manila for Seismic Risk Assessment using Satellite Images Fumio YAMAZAKI/ yamazaki@edm.bosai.go.jp Hajime MITOMI/ mitomi@edm.bosai.go.jp Yalkun YUSUF/ yalkun@edm.bosai.go.jp
remote sensing? What are the remote sensing principles behind these Definition
 Introduction to remote sensing: Content (1/2) Definition: photogrammetry and remote sensing (PRS) Radiation sources: solar radiation (passive optical RS) earth emission (passive microwave or thermal infrared
XSAT Ground Segment at CRISP
 XSAT Ground Segment at CRISP LIEW Soo Chin Head of Research, CRISP http://www.crisp.nus.edu.sg 5 th JPTM for Sentinel Asia Step-2, 14-16 Nov 2012, Daejeon, Korea Centre for Remote Imaging, Sensing and
Lecture 2. Electromagnetic radiation principles. Units, image resolutions.
 NRMT 2270, Photogrammetry/Remote Sensing Lecture 2 Electromagnetic radiation principles. Units, image resolutions. Tomislav Sapic GIS Technologist Faculty of Natural Resources Management Lakehead University
Update on Landsat Program and Landsat Data Continuity Mission
 Update on Landsat Program and Landsat Data Continuity Mission Dr. Jeffrey Masek LDCM Deputy Project Scientist NASA GSFC, Code 923 November 21, 2002 Draft LDCM Implementation Phase RFP Overview Page 1 Celebrate!
Philpot & Philipson: Remote Sensing Fundamentals Scanners 8.1 W.D. Philpot, Cornell University, Fall 2015
 Philpot & Philipson: Remote Sensing Fundamentals Scanners 8.1 8. SCANNERS 8.1 General Scanners are scanning radiometers which, when operated from an airborne or spaceborne platform, image the terrain in
Atmospheric interactions; Aerial Photography; Imaging systems; Intro to Spectroscopy Week #3: September 12, 2018
 GEOL 1460/2461 Ramsey Introduction/Advanced Remote Sensing Fall, 2018 Atmospheric interactions; Aerial Photography; Imaging systems; Intro to Spectroscopy Week #3: September 12, 2018 I. Quick Review from
Dirty REMOTE SENSING Week 2 Interpreation
 Dirty REMOTE SENSING Week 2 Interpreation Earthobservation.wordpress.com Stuart Green Stuart.Green@teagasc.ie AERIAL PHOTOGRAPHIC INTERPRETATION http://airphotos.nrcan.gc.ca/photos101/photos101_info_e.php
CHARACTERISTICS OF REMOTELY SENSED IMAGERY. Radiometric Resolution
 CHARACTERISTICS OF REMOTELY SENSED IMAGERY Radiometric Resolution There are a number of ways in which images can differ. One set of important differences relate to the various resolutions that images express.
HYPERSPECTRAL IMAGERY FOR SAFEGUARDS APPLICATIONS. International Atomic Energy Agency, Vienna, Austria
 HYPERSPECTRAL IMAGERY FOR SAFEGUARDS APPLICATIONS G. A. Borstad 1, Leslie N. Brown 1, Q.S. Bob Truong 2, R. Kelley, 3 G. Healey, 3 J.-P. Paquette, 3 K. Staenz 4, and R. Neville 4 1 Borstad Associates Ltd.,
ASTER and USGS EROS Emergency Imaging for Hurricane Disasters
 ASTER and USGS EROS Emergency Imaging for Hurricane Disasters By Kenneth A. Duda and Michael Abrams Satellite images have been extremely useful in a variety of emergency response activities, including
INTRODUCTORY REMOTE SENSING. Geob 373
 INTRODUCTORY REMOTE SENSING Geob 373 Landsat 7 15 m image highlighting the geology of Oman http://www.satimagingcorp.com/gallery-landsat.html ASTER 15 m SWIR image, Escondida Mine, Chile http://www.satimagingcorp.com/satellite-sensors/aster.html
Indian Remote Sensing Satellites
 Resourcesat-1 Cartosat-1 Indian Remote Sensing Satellites -Current & Future Missions - Presented by: Timothy J. Puckorius Chairman & CEO EOTec 1 Presentation Topics Who is EOTec India s Earth Observation
How can we "see" using the Infrared?
 The Infrared Infrared light lies between the visible and microwave portions of the electromagnetic spectrum. Infrared light has a range of wavelengths, just like visible light has wavelengths that range
29 th Annual Louisiana RS/GIS Workshop April 23, 2013 Cajundome Convention Center Lafayette, Louisiana
 Landsat Data Continuity Mission 29 th Annual Louisiana RS/GIS Workshop April 23, 2013 Cajundome Convention Center Lafayette, Louisiana http://landsat.usgs.gov/index.php# Landsat 5 Sets Guinness World Record
Land Cover Analysis to Determine Areas of Clear-cut and Forest Cover in Olney, Montana. Geob 373 Remote Sensing. Dr Andreas Varhola, Kathry De Rego
 1 Land Cover Analysis to Determine Areas of Clear-cut and Forest Cover in Olney, Montana Geob 373 Remote Sensing Dr Andreas Varhola, Kathry De Rego Zhu an Lim (14292149) L2B 17 Apr 2016 2 Abstract Montana
Remote Sensing for Resource Management
 Remote Sensing for Resource Management Ebenezer Nyadjro US Naval Research Lab/UNO RMU Summer Program (July 31-AUG 4, 2017) Motivation Polluted Pra River Motivation. 3 Motivation Polluted Pra River Motivation.
Platforms, Sensors & Data Products
 Platforms, Sensors & Data Products Introduction Remote sensing is defined as the science which deals with obtaining information about objects on earth surface by analysis of data, received from a remote
ROLE OF SATELLITE DATA APPLICATION IN CADASTRAL MAP AND DIGITIZATION OF LAND RECORDS DR.T. RAVISANKAR GROUP HEAD (LRUMG) RSAA/NRSC/ISRO /DOS HYDERABAD
 RSAA/NRSC/ISRO /DOS HYDERABAD") ROLE OF SATELLITE DATA APPLICATION IN CADASTRAL MAP AND DIGITIZATION OF LAND RECORDS DR.T. RAVISANKAR GROUP HEAD (LRUMG) RSAA/NRSC/ISRO /DOS HYDERABAD WORKSHOP on Best Practices under National Land Records
ROLE OF SATELLITE DATA APPLICATION IN CADASTRAL MAP AND DIGITIZATION OF LAND RECORDS DR.T. RAVISANKAR GROUP HEAD (LRUMG) RSAA/NRSC/ISRO /DOS HYDERABAD WORKSHOP on Best Practices under National Land Records
Fundamentals of Remote Sensing
 Climate Variability, Hydrology, and Flooding Fundamentals of Remote Sensing May 19-22, 2015 GEO-Latin American & Caribbean Water Cycle Capacity Building Workshop Cartagena, Colombia 1 Objective To provide
Lecture 7 Earth observation missions
 Remote sensing for agricultural applications: principles and methods (2013-2014) Instructor: Prof. Tao Cheng (tcheng@njau.edu.cn). Nanjing Agricultural University Lecture 7 Earth observation missions May
Sommersemester Prof. Dr. Christoph Kleinn Institut für Waldinventur und Waldwachstum Arbeitsbereich Fernerkundung und Waldinventur.
 Basics of Remote Sensing Some literature references Franklin, SE 2001 Remote Sensing for Sustainable Forest Management Lewis Publishers 407p Lillesand, Kiefer 2000 Remote Sensing and Image Interpretation
Lecture Notes Prepared by Prof. J. Francis Spring Remote Sensing Instruments
 Lecture Notes Prepared by Prof. J. Francis Spring 2005 Remote Sensing Instruments Material from Remote Sensing Instrumentation in Weather Satellites: Systems, Data, and Environmental Applications by Rao,
Applied GIS & Remote Sensing for Disaster Mitigation #4
 Applied GIS & Remote Sensing for Disaster Mitigation #4 By Koki IWAO Senior Program Specialist iwao@ait.ac.th http://www.acrors.ait.ac.th www.acrors.ait.ac.th/ Asian Center for Research on Remote Sensing
ADDITIONAL SATELLITE AND SENSORS
 ADDITIONAL SATELLITE AND SENSORS A list of additional satellites and sensors, along with links to appropriate websites, is presented below. ACRIMSAT (Active Cavity Radiometer Irradiance Monitor Satellite)