Remote Sensing. Measuring an object from a distance. For GIS, that means using photographic or satellite images to gather spatial data
|
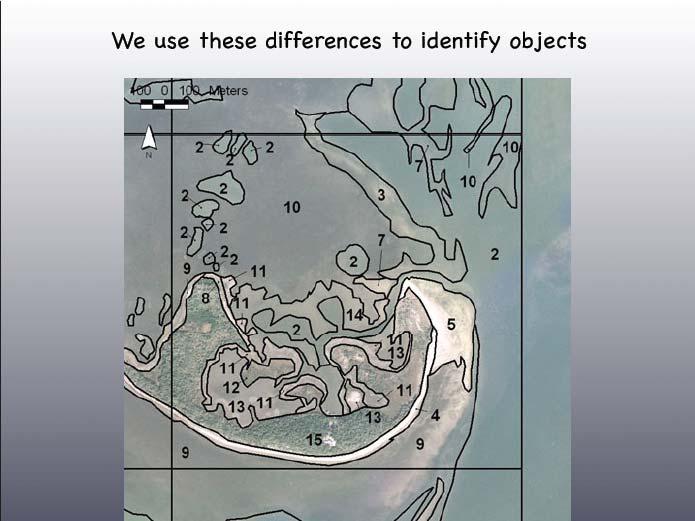
|
|
- Jonah Ashley Riley
- 6 years ago
- Views:
Transcription
1 Remote Sensing Measuring an object from a distance For GIS, that means using photographic or satellite images to gather spatial data


2 Remote Sensing measures electromagnetic energy reflected or emitted from objects airborne or satellite-based instruments
3

4 Imagery - A Rich Data Source NASA Aster and TM Imagery, San Diego, CA

5 NASA Aster and SRTM Image Data, the Grand Canyon, AZ

6 Broad Spectral Range NASA MISR Data, the Hawaiian Islands

7 The World Changes Images provide a permanent record 10/22/07
8 The World Changes Images provide a permanent record 10/23/07

9 Change: Deforestation, Rondonia, Brazil (NASA Landsat Image)
10 Detailed, geometrically accurate record

11 Broad Area Coverage

12 Broad Area Coverage
13
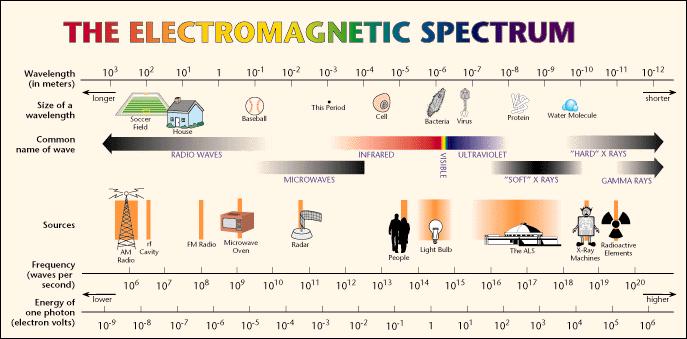
14 Background Light (300,000 km per second) A stream of energy packets called photons This stream of particles behaves like a wave or traveling energy Light waves consist of electric and magnetic fields Measured by wavelength (peak to peak) or frequency (how many waves pass a point in space per second) wavelength and frequency are related wavelength x frequency = Speed of Light λ x f = C
15 Electromagnetic energy is a mixture of waves with different frequencies Each wave represents energy that varies at a given frequency. Source:
16 For each wave, there is an electronic (E) component and a magnetic component (M). The Amplitude (A) reflects the level of the electromagnetic energy. Source:
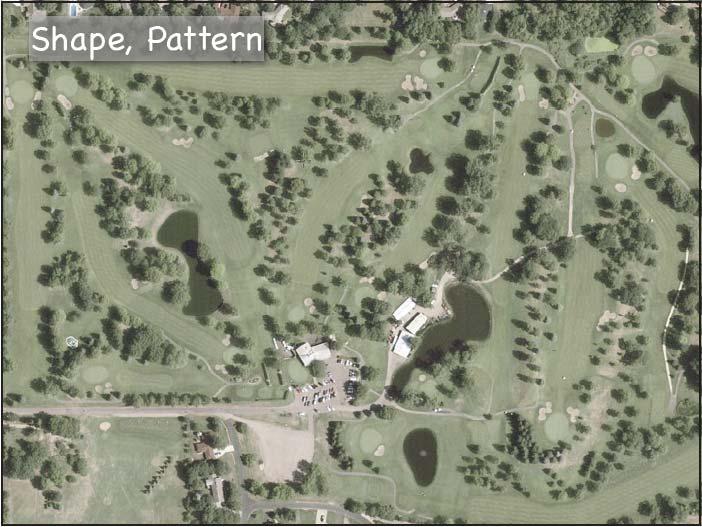
17 Plotting amplitude against the wavelength you get an electromagnetic curve, or spectrum Source:
18 Source:
19 Radiation (electromagnetic energy) is emitted by the Sun, and attenuated by the atmosphere. Specific bands of wavelengths are used for remote sensing
20 xrays Blue.4 to.5 μm (micrometers) Green.5 to.6 μm (micrometers) Red.6 to.7 μm (micrometers)
21
 http://science.howstuffworks.com/light7.")
22 Visible Light - How we see colors Emit/Reflect Absorb Addition of light waves of different frequencies Absorb some of the frequencies you see what s reflected (paint,pigments like chlorophyll)
23 Energy, Atmosphere, and Surface Interactions
24 Sources of Information Variations in electromagnetic fields that can be used to identify and characterize objects: Spectral-radiometric (color, temperature) Spatial (pattern, size, shape, texture,...) Temporal
25 Spectral Reflectance Curves % of energy reflected Wavelength (μm)

26 A B C Spectral Resolution and Spectral Sampling The three shaded bars A, B, and C represent three spectral bands. The width of each bar covers a spectral range within which no signal variation can be resolved. The width of each spectral band represents its spectral resolution. The resolution of A is coarser than the resolution of B. This is because spectral details within band A that cannot be discriminated may be partly discriminated with a spectral resolution as narrow as band B. The resolution relationships among the three bands are: Resolution of A < Resolution of C < Resolution of B Adapted from Source:
27 Concept of Spectral Bands A B C Adapted from Source:

28 Sampled at different Spatial resolutions Adapted from Source:
29 Simple example of spectral signature (visible light only) 9,9,0 (real sunlight is 9,9,9) 0,0,9 0,9,0 9,0,0 Red,Green,Blue 5,3,0 Source:
30 A = Absorbed Visible Light R = Reflected Object description Color reflected Red Gre en Blu e Ex. Red apple red R A A Yellow block yellow R R A Green block green A R A Pinkish colored block (magenta) magenta R A R Blue block blue A A R Turquoise colored block (cyan) cyan A R R Source:

31 Simple example of spectral signature (visible light only) 9,9,0 (real sunlight is 9,9,9) 0,0,9 0,9,0 9,0,0 Red,Green,Blue 5,3,0 Source:
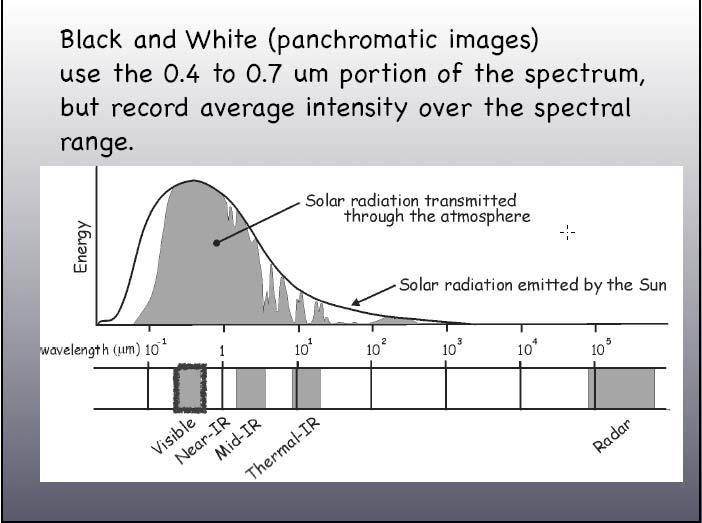
32 Radiation (electromagnetic energy) is emitted by the Sun, and attenuated by the atmosphere. Specific bands of wavelengths are used for remote sensing
33 xrays Blue.4 to.5 μm (micrometers) Green.5 to.6 μm (micrometers) Red.6 to.7 μm (micrometers)
34 Spectral Reflectance Curves % of energy reflected Wavelength (μm)
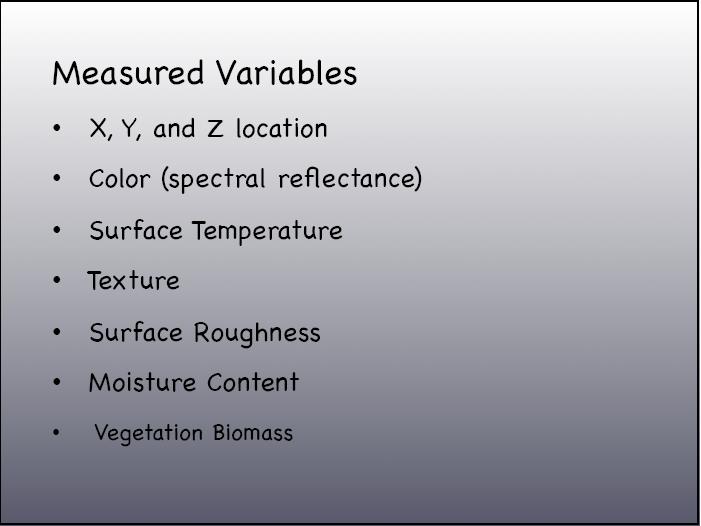
35 What Information Can Be Remotely Sensed? Fundamental Variables Planimetric (x,y) location and dimensions Topographic (z) location Color (spectral reflectance) Surface Temperature Texture Surface Roughness Moisture Content Vegetation Biomass
36
37

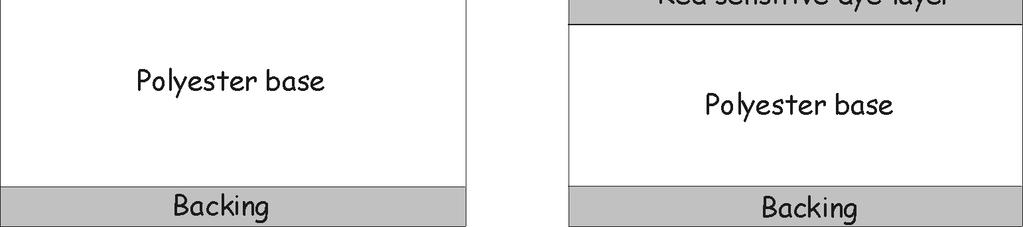
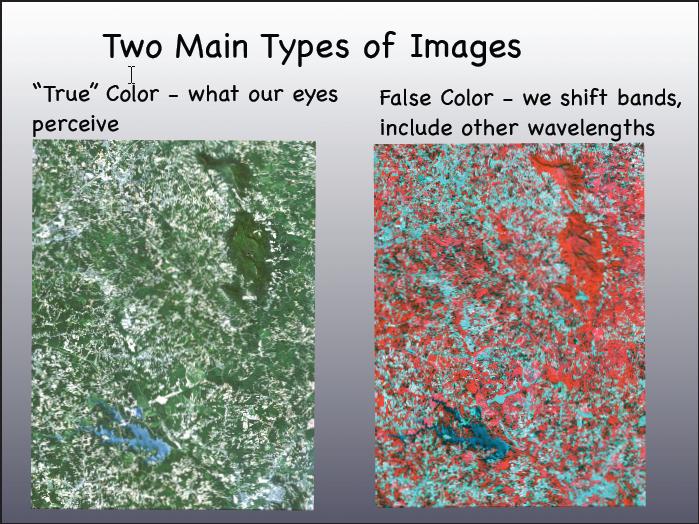
38 Two Main Types of Films
39

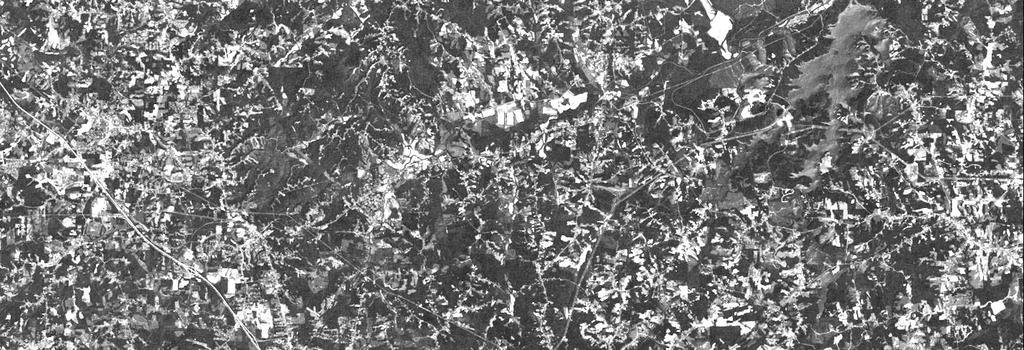
40 Black and White Image
41
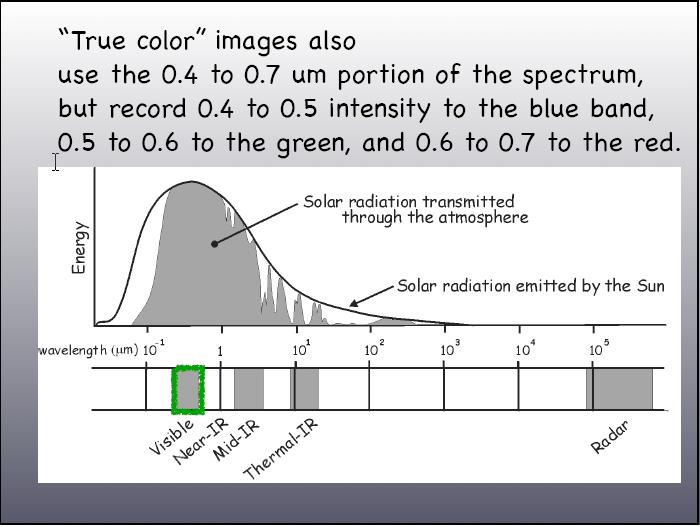
42 True Color Image
43

44 Color Infrared Color Infrared Image
45
46
 False Color True")

47 Upland forest just beginning growing season Cool season grass (brome, fescue) False Color True Color April False Color IR and True Color


48 Upland forest with full canopy False Color True Color May False Color IR and True Color

49 Bauer, 2000
50
51 Time of Year and Film Type Black and white (Panchromatic) lower costs, wide sensitivity "True" color - Enhanced interpretation Color infrared film (also near-ir or color-ir) - Enhanced vegetation, more contrast
52 What Information Can Be Remotely Sensed? Fundamental Variables Planimetric (x,y) location and dimensions Topographic (z) location Color (spectral reflectance) Surface Temperature Texture Surface Roughness Moisture Content Vegetation Biomass
53
54
55

56 Photo Interpretation This is the process of identifying and mapping the features that appear on the photos
57
58 What Information Can Be Remotely Sensed? Fundamental Variables Planimetric (x,y) location and dimensions Topographic (z) location Color (spectral reflectance) Surface Temperature Texture Surface Roughness Moisture Content Vegetation Biomass
59 Aerial Photographs
60
61
62


63 Photos are usually scanned and converted to digital images for on-screen display and measurements
64 Scale most commonly controlled by 1. flying height 2. lens focal length Scale is approximately equal to f / H f = focal length H = flying height
65 Photo Scale Set by flying height, focal length Most mapping cameras use 6 lens Reduce scale by flying higher
66 Increasing flying height reduces scale (objects get smaller, area covered by each photo increases) Increasing focal length increases scale (objects get larger, are covered decreases)
67 Scale is NOT Constant Can be over flat terrain with perfectly vertical photographs - rarely occurs Terrain - some objects are closer to lens, hence larger scale Tilt - causes perspective distortion
68 Perspective vs. Orthographic Views
69 Terrain Variation Causes Relief Displacement Features are displaced radially from their planimetric position due to differences in relative elevation
70 Tilt Distortion
71 Tilt measured as the angle between a line perpendicular to the film and a line perpendicular to the datum. Typically specified to be less than 3 o on vertical aerial photos.
72 How Big Are Tilt and Terrain Errors? Larger errors with more tilt (even under 3 o ) Larger errors with more relief (proportional to elevation difference) Larger at smaller scale
73 80 60 Terrain Range = 0 m Tilt = 0 o Tilt < 1.4 o Tilt 1.4 to 2.8 o Tilt 2.8 to 4.2 o Error (m) Photo Scale (1000s) 0
74 Error (m) Terrain Range = 500m Tilt = 0 o Tilt < 1.4 o Tilt 1.4 to 2.8 o Tilt 2.8 to 4.2 o Photo Scale (1000s) 0
75 Parallax - Relative shift in position with a change in viewing location. Closer (taller) objects shift more. We measure parallax to estimate height.
76 Overlapping Stereophotographs to create parallax shifts

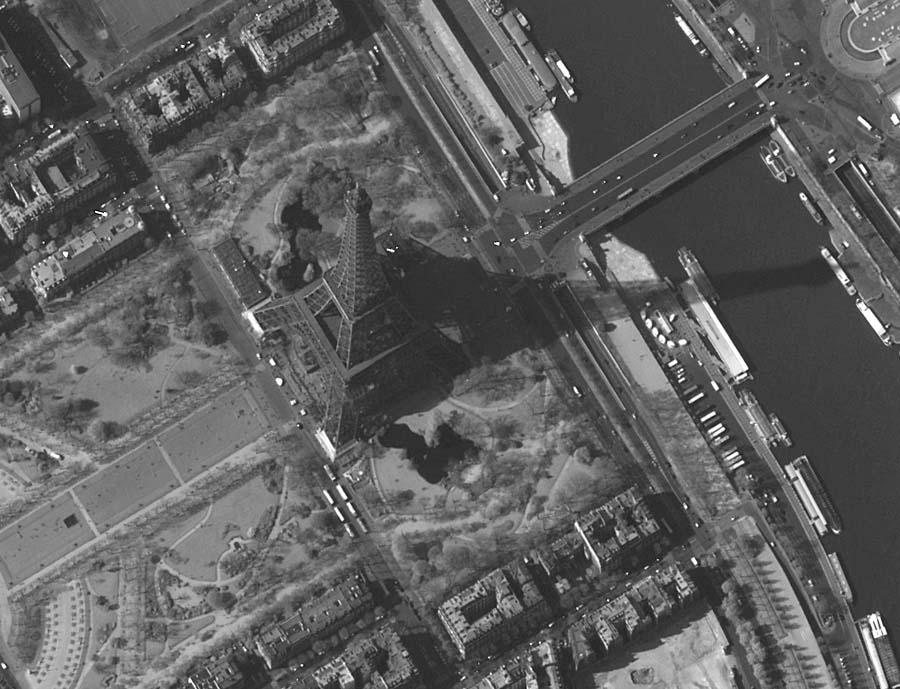
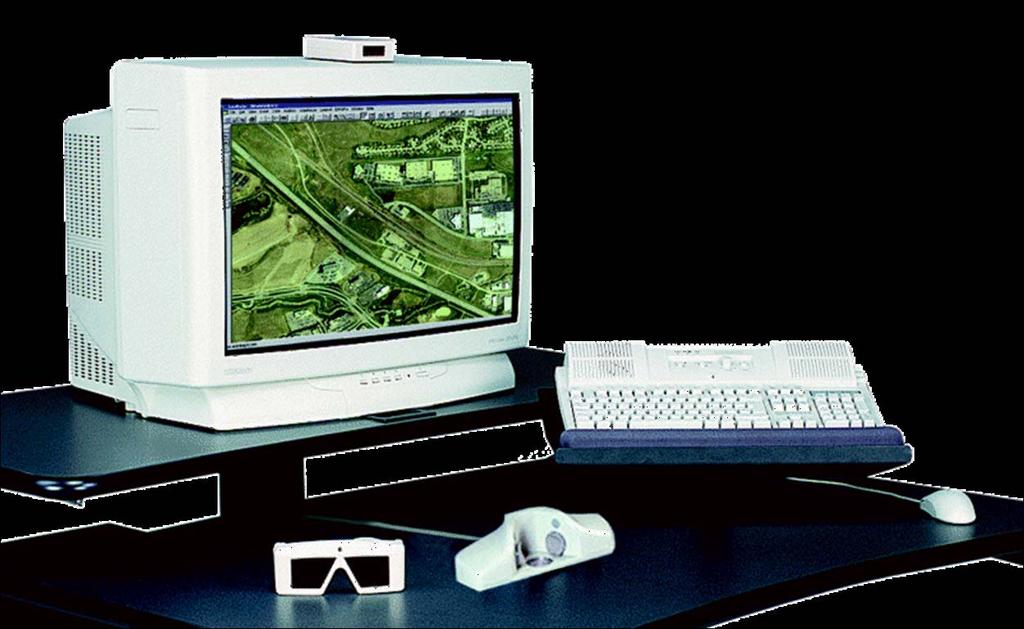
77 Source: Source:
78 Overlapping Stereophotographs to create parallax shifts
79 Relief Displacement Height affects horizontal position Displacement are radial higher outward shift Lower inward shift In a planimetric map, A should occur at the same location as B But is displace by d Question: how much is d? Use similar triangles to find out
80 Similar Triangles Strategy: Measure p (from photo) We know H (from flight record) We can get h (e.g., from DEM) We need to relate d to p, h, and H And solve for d


81 Terrain Variation Causes Relief Displacement Features are displaced radially from their planimetric position due to differences in relative elevation
82 Big triangle CNS Small triangle 1 - Cna Small triangle 2 - ABS We may see: D/P = d / p and D/P = h/h So d/p = h/h d=p*h/h
83
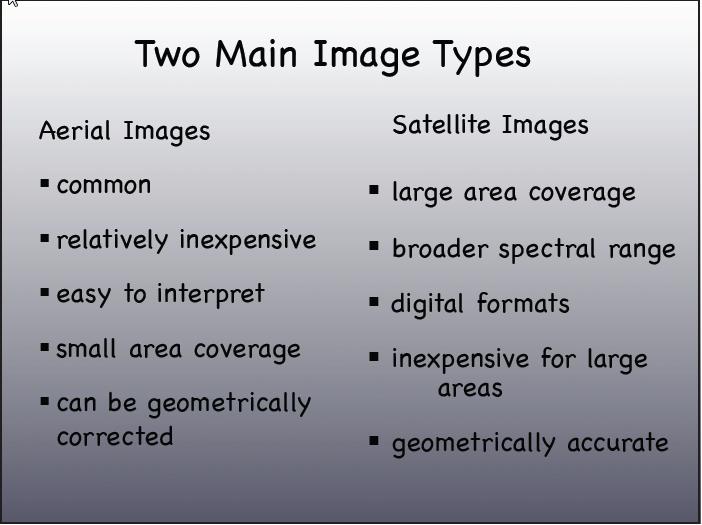
84 So We know H Measure p on photo Know h from DEM Apply equation d = p* h/h Apply for every spot (cell, pixel) on the photo, yielding an ortho-corrected image
85 What about tilt? Tilt plus terrain distortion complicates the equations, e.g., Photo x = x0 f [ m11(xp-xl) + m21(yp-yl) +m13(-zl). Where m11 = cosφ*cosκ, m21= -cosφ*cosκ, etc. The idea is the same photo measurement are used with knowledge of flying height, ground height, and now tilt (ω, φ, κ) to calculate and remove displacement.
86 Softcopy Photogrammetric Workstations Orthophoto production
87

88 An orthophotograph or orthoimage tilt/terrain distortion removed

89 An orthophotograph or orthoimage tilt/terrain distortion removed
90 Besides geometric fidelity, we are also interested in the photo information content How do we interpret the photographs? Select a photographic system appropriate to the task, i.e., scale, coverage, time of year, and film type which best renders the details of interests
91 Scale Without magnification, you are stuck at about 2-3 mm To identify individual trees -10 m across with magnification scale =.5 mm / 10,000 mm, or about 1:20,000 without magnification scale = 2 mm / 10,000 mm, or about 1:5,000
92 Coverage Scale and format determines area per photo, e.g. 9" 1:10,000 scale yields photos which contain 7,500 feet on edge 9 = 0.75 ft * 10,000 ground feet/photo feet = 7,500 ft
93 Photo Dimensions and Areas for Some Common Photo Scales Photo Scale Scaled edge 9 Photo (miles) Width 60 Road (in) Scaled Photo Area Side of 40 ac. on Photo (in, side) 1: ac : ac :15, ,240 ac 1 1:20, mi :24, mi :40, mi 2 0.4
94 Satellite Images Advantages - High view, little relief displacement - Ultra-stable satellites, little tilt distortion - Extended spectral range, from radar to far infra-red - Low cost per unit area (for large study areas) - Digital images, which may be easily enhanced, integrated into a GIS
95 Satellite Images Disadvantages Limited acquisition flexibility, fixed schedules Expensive for small areas, due to fixed frame size Limited scale/resolution Requires sophisticated, moderately expensive systems to take advantage of digital image
96
97 Systems Ikonos, Quickbird 0.6 (panchromatic) to 3.5 meter (3-band color) resolution Three to five day repeat visit Images 10 to 30 km on a side Spot Panchromatic, 2.5 to 10 m resolution 3-band color, 5 to 20 m resolution Returns from every 5 to 26 days, depending on requirements and latitude Image 60 km on a side Thematic Mapper (TM) 7 bands, 30 m resolution Return time of 16 days Image approximately 185 km on a side
98 High-Resolution Satellite Systems IKONOS (1999) High resolution system 680 km orbit Revisit times are typically 1-3 days 1 meter panchromatic 4 meter visible/infrared Scan width of 13 km pointable.

99 Quickbird (2000) 61 cm (2 foot) pan meter mulitpsectral Image side 16.5 km 1-3 day revisit
 Color and panchromatic images) This half-meter resolution satellite image features a portion of the Bonneville Dam, located 40 miles east of Portland, Oregon in the Columbia River Gorge.")
100 Geoeye (2008) Highest resolution at 0.5 meters (soon to be 0.25 m) Color and panchromatic images) This half-meter resolution satellite image features a portion of the Bonneville Dam, located 40 miles east of Portland, Oregon in the Columbia River Gorge. The dam provides electrical power generation, fish and wildlife protection, recreation and navigation. Bonneville Dam was built and is managed by the U.S. Army Corps of Engineers and was designated as a National Historical Landmark District in The image was collected on Aug. 2, 2010 by the GeoEye-1 satellite from 423 miles in space as it moved from north to south over Oregon at a speed of four miles per second.
 Color and panchromatic images) This half-meter resolution satellite image shows Tahrir Square and surrounding buildings in Cairo, Egypt.")
101 Geoeye (2008) Highest resolution at 0.5 meters (soon to be 0.25 m) Color and panchromatic images) This half-meter resolution satellite image shows Tahrir Square and surrounding buildings in Cairo, Egypt. The image was collected by the GeoEye-1 satellite on January 29, 2011 at 10:29 a.m. local time from 423 miles in space as it moved from north to south over Egypt at a speed of four miles per second.
102 Primary Uses for High Resolution Satellite Data On-screen digitizing similar to aerial photographs Infrastructure mapping (roads, etc.) Detail landuse mapping Topographic mapping Disaster assessment (fire, hurricane, flooding) Habitat and other mapping
103 Medium Resolution Sensing Systems Landsat Thematic Mapper (TM, ETM+) 7 spectral bands 30 meter resolution multispectral, 15 meter panchromatic 16-day repeat cycle data since 1984 Historical importance, new collections difficult Multispectral Scanner (MSS) 4 spectral bands 80 meter resolution 16-day repeat cycle data since 1972 SPOT coarse modes 5 spectral bands 10 to 20 meter resolution 1-3 day repeat cycle

104 TM Data Good for regional, some local analyses typically can t distinguis h objects smaller than 25 meters wide

105 SPOT 20 meter More detail than Landsat, but smaller imaged area
106 COARSE RESOLUTION LAND SENSORS AVHRR (since the 1970s) Advanced Very High Resolution Radiometer 5 spectral bands 1.1 km resolution 12 hour repeat cycle MODIS Moderate Resolution Imaging Sensor 36 spectral bands 1 km, 500m and 250 m resolutions 1 to 2 day repeat cycle

107 NOAA AVHRR Imagery

108 MODIS Image
109 Most common useful applications Landcover mapping, large areas e.g., wetlands, urban, forest Disaster evaluation, management Crop monitoring Change detection (for example, deforestation) Snow monitoring, runoff estimation Geologic prospecting Vegetation health monitoring
110 Image Classification from Multispectral Data
111 Satellite vs. Photos Which to Use? Satellites Lower detail (barely) Expanded spectrum Inherently digital Stable platform Higher flight path Inexpensive for large areas Aerial Photos Higher detail Less expensive for small areas Flexible repeat time Fly under clouds Simple handling
Introduction to Remote Sensing
 Introduction to Remote Sensing Spatial, spectral, temporal resolutions Image display alternatives Vegetation Indices Image classifications Image change detections Accuracy assessment Satellites & Air-Photos
REMOTE SENSING. Topic 10 Fundamentals of Digital Multispectral Remote Sensing MULTISPECTRAL SCANNERS MULTISPECTRAL SCANNERS
 REMOTE SENSING Topic 10 Fundamentals of Digital Multispectral Remote Sensing Chapter 5: Lillesand and Keifer Chapter 6: Avery and Berlin MULTISPECTRAL SCANNERS Record EMR in a number of discrete portions
An Introduction to Geomatics. Prepared by: Dr. Maher A. El-Hallaq خاص بطلبة مساق مقدمة في علم. Associate Professor of Surveying IUG
 An Introduction to Geomatics خاص بطلبة مساق مقدمة في علم الجيوماتكس Prepared by: Dr. Maher A. El-Hallaq Associate Professor of Surveying IUG 1 Airborne Imagery Dr. Maher A. El-Hallaq Associate Professor
Remote Sensing for Rangeland Applications
 Remote Sensing for Rangeland Applications Jay Angerer Ecological Training June 16, 2012 Remote Sensing The term "remote sensing," first used in the United States in the 1950s by Ms. Evelyn Pruitt of the
NON-PHOTOGRAPHIC SYSTEMS: Multispectral Scanners Medium and coarse resolution sensor comparisons: Landsat, SPOT, AVHRR and MODIS
 NON-PHOTOGRAPHIC SYSTEMS: Multispectral Scanners Medium and coarse resolution sensor comparisons: Landsat, SPOT, AVHRR and MODIS CLASSIFICATION OF NONPHOTOGRAPHIC REMOTE SENSORS PASSIVE ACTIVE DIGITAL
Blacksburg, VA July 24 th 30 th, 2010 Remote Sensing Page 1. A condensed overview. For our purposes
 A condensed overview George McLeod Prepared by: With support from: NSF DUE-0903270 in partnership with: Geospatial Technician Education Through Virginia s Community Colleges (GTEVCC) The art and science
An Introduction to Remote Sensing & GIS. Introduction
 An Introduction to Remote Sensing & GIS Introduction Remote sensing is the measurement of object properties on Earth s surface using data acquired from aircraft and satellites. It attempts to measure something
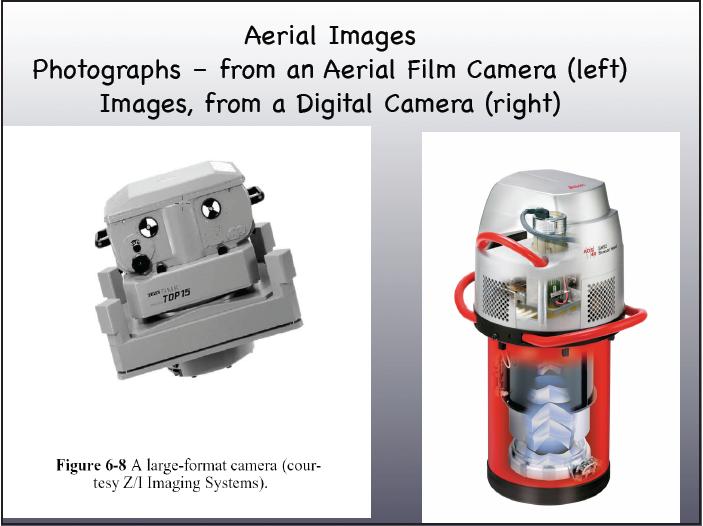
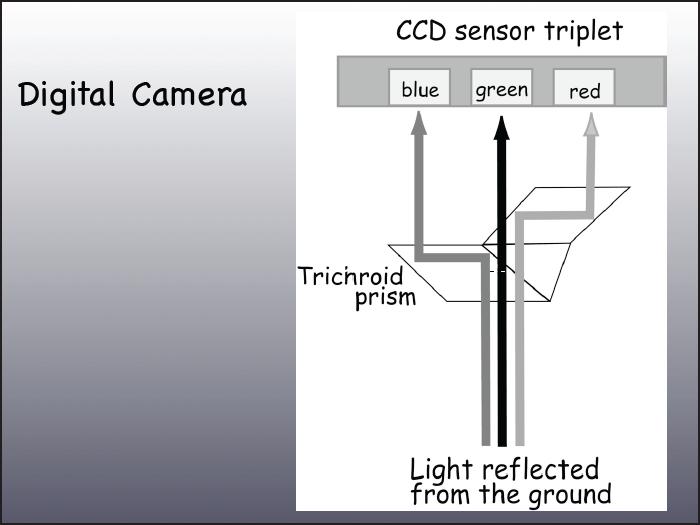
Aerial photography: Principles. Frame capture sensors: Analog film and digital cameras
 Aerial photography: Principles Frame capture sensors: Analog film and digital cameras Overview Introduction Frame vs scanning sensors Cameras (film and digital) Photogrammetry Orthophotos Air photos are
Remote Sensing Platforms
 Types of Platforms Lighter-than-air Remote Sensing Platforms Free floating balloons Restricted by atmospheric conditions Used to acquire meteorological/atmospheric data Blimps/dirigibles Major role - news
GIS Data Collection. Remote Sensing
 GIS Data Collection Remote Sensing Data Collection Remote sensing Introduction Concepts Spectral signatures Resolutions: spectral, spatial, temporal Digital image processing (classification) Other systems
Introduction of Satellite Remote Sensing
 Introduction of Satellite Remote Sensing Spatial Resolution (Pixel size) Spectral Resolution (Bands) Resolutions of Remote Sensing 1. Spatial (what area and how detailed) 2. Spectral (what colors bands)
Lecture 13: Remotely Sensed Geospatial Data
 Lecture 13: Remotely Sensed Geospatial Data A. The Electromagnetic Spectrum: The electromagnetic spectrum (Figure 1) indicates the different forms of radiation (or simply stated light) emitted by nature.
Introduction to Remote Sensing Fundamentals of Satellite Remote Sensing. Mads Olander Rasmussen
 Introduction to Remote Sensing Fundamentals of Satellite Remote Sensing Mads Olander Rasmussen (mora@dhi-gras.com) 01. Introduction to Remote Sensing DHI What is remote sensing? the art, science, and technology
CHARACTERISTICS OF REMOTELY SENSED IMAGERY. Spatial Resolution
 CHARACTERISTICS OF REMOTELY SENSED IMAGERY Spatial Resolution There are a number of ways in which images can differ. One set of important differences relate to the various resolutions that images express.
Introduction to Remote Sensing Part 1
 Introduction to Remote Sensing Part 1 A Primer on Electromagnetic Radiation Digital, Multi-Spectral Imagery The 4 Resolutions Displaying Images Corrections and Enhancements Passive vs. Active Sensors Radar
746A27 Remote Sensing and GIS. Multi spectral, thermal and hyper spectral sensing and usage
 746A27 Remote Sensing and GIS Lecture 3 Multi spectral, thermal and hyper spectral sensing and usage Chandan Roy Guest Lecturer Department of Computer and Information Science Linköping University Multi
Remote Sensing Platforms
 Remote Sensing Platforms Remote Sensing Platforms - Introduction Allow observer and/or sensor to be above the target/phenomena of interest Two primary categories Aircraft Spacecraft Each type offers different
remote sensing? What are the remote sensing principles behind these Definition
 Introduction to remote sensing: Content (1/2) Definition: photogrammetry and remote sensing (PRS) Radiation sources: solar radiation (passive optical RS) earth emission (passive microwave or thermal infrared
Some Basic Concepts of Remote Sensing. Lecture 2 August 31, 2005
 Some Basic Concepts of Remote Sensing Lecture 2 August 31, 2005 What is remote sensing Remote Sensing: remote sensing is science of acquiring, processing, and interpreting images and related data that
Remote Sensing and GIS
 Remote Sensing and GIS Atmosphere Reflected radiation, e.g. Visible Emitted radiation, e.g. Infrared Backscattered radiation, e.g. Radar (λ) Visible TIR Radar & Microwave 11/9/2017 Geo327G/386G, U Texas,
The studies began when the Tiros satellites (1960) provided man s first synoptic view of the Earth s weather systems.
 provided man s first synoptic view of the Earth s weather systems.") Remote sensing of the Earth from orbital altitudes was recognized in the mid-1960 s as a potential technique for obtaining information important for the effective use and conservation of natural resources.
Remote sensing of the Earth from orbital altitudes was recognized in the mid-1960 s as a potential technique for obtaining information important for the effective use and conservation of natural resources.
Remote sensing in archaeology from optical to lidar. Krištof Oštir ModeLTER Scientific Research Centre of the Slovenian Academy of Sciences and Arts
 Remote sensing in archaeology from optical to lidar Krištof Oštir ModeLTER Scientific Research Centre of the Slovenian Academy of Sciences and Arts Introduction Optical remote sensing Systems Search for
Int n r t o r d o u d c u ti t on o n to t o Remote Sensing
 Introduction to Remote Sensing Definition of Remote Sensing Remote sensing refers to the activities of recording/observing/perceiving(sensing)objects or events at far away (remote) places. In remote sensing,
Spectral Signatures. Vegetation. 40 Soil. Water WAVELENGTH (microns)
") Spectral Signatures % REFLECTANCE VISIBLE NEAR INFRARED Vegetation Soil Water.5. WAVELENGTH (microns). Spectral Reflectance of Urban Materials 5 Parking Lot 5 (5=5%) Reflectance 5 5 5 5 5 Wavelength (nm)
Spectral Signatures % REFLECTANCE VISIBLE NEAR INFRARED Vegetation Soil Water.5. WAVELENGTH (microns). Spectral Reflectance of Urban Materials 5 Parking Lot 5 (5=5%) Reflectance 5 5 5 5 5 Wavelength (nm)
Govt. Engineering College Jhalawar Model Question Paper Subject- Remote Sensing & GIS
 Govt. Engineering College Jhalawar Model Question Paper Subject- Remote Sensing & GIS Time: Max. Marks: Q1. What is remote Sensing? Explain the basic components of a Remote Sensing system. Q2. What is
Lecture 6: Multispectral Earth Resource Satellites. The University at Albany Fall 2018 Geography and Planning
 Lecture 6: Multispectral Earth Resource Satellites The University at Albany Fall 2018 Geography and Planning Outline SPOT program and other moderate resolution systems High resolution satellite systems
Introduction to Remote Sensing
 Introduction to Remote Sensing Outline Remote Sensing Defined Resolution Electromagnetic Energy (EMR) Types Interpretation Applications Remote Sensing Defined Remote Sensing is: The art and science of
Outline. Introduction. Introduction: Film Emulsions. Sensor Systems. Types of Remote Sensing. A/Prof Linlin Ge. Photographic systems (cf(
 GMAT x600 Remote Sensing / Earth Observation Types of Sensor Systems (1) Outline Image Sensor Systems (i) Line Scanning Sensor Systems (passive) (ii) Array Sensor Systems (passive) (iii) Antenna Radar
Photogrammetry. Lecture 4 September 7, 2005
 Photogrammetry Lecture 4 September 7, 2005 What is Photogrammetry Photogrammetry is the art and science of making accurate measurements by means of aerial photography: Analog photogrammetry (using films:
REMOTE SENSING INTERPRETATION
 REMOTE SENSING INTERPRETATION Jan Clevers Centre for Geo-Information - WU Remote Sensing --> RS Sensor at a distance EARTH OBSERVATION EM energy Earth RS is a tool; one of the sources of information! 1
The studies began when the Tiros satellites (1960) provided man s first synoptic view of the Earth s weather systems.
 provided man s first synoptic view of the Earth s weather systems.") Remote sensing of the Earth from orbital altitudes was recognized in the mid-1960 s as a potential technique for obtaining information important for the effective use and conservation of natural resources.
Remote sensing of the Earth from orbital altitudes was recognized in the mid-1960 s as a potential technique for obtaining information important for the effective use and conservation of natural resources.
Important Missions. weather forecasting and monitoring communication navigation military earth resource observation LANDSAT SEASAT SPOT IRS
 Fundamentals of Remote Sensing Pranjit Kr. Sarma, Ph.D. Assistant Professor Department of Geography Mangaldai College Email: prangis@gmail.com Ph. No +91 94357 04398 Remote Sensing Remote sensing is defined
Geo/SAT 2 INTRODUCTION TO REMOTE SENSING
 Geo/SAT 2 INTRODUCTION TO REMOTE SENSING Paul R. Baumann, Professor Emeritus State University of New York College at Oneonta Oneonta, New York 13820 USA COPYRIGHT 2008 Paul R. Baumann Introduction Remote
MSB Imagery Program FAQ v1
 MSB Imagery Program FAQ v1 (F)requently (A)sked (Q)uestions 9/22/2016 This document is intended to answer commonly asked questions related to the MSB Recurring Aerial Imagery Program. Table of Contents
Atmospheric interactions; Aerial Photography; Imaging systems; Intro to Spectroscopy Week #3: September 12, 2018
 GEOL 1460/2461 Ramsey Introduction/Advanced Remote Sensing Fall, 2018 Atmospheric interactions; Aerial Photography; Imaging systems; Intro to Spectroscopy Week #3: September 12, 2018 I. Quick Review from
9/12/2011. Training Course Remote Sensing Basic Theory & Image Processing Methods September 2011
 Training Course Remote Sensing Basic Theory & Image Processing Methods 19 23 September 2011 Popular Remote Sensing Sensors & their Selection Michiel Damen (September 2011) damen@itc.nl 1 Overview Low resolution
Abstract Quickbird Vs Aerial photos in identifying man-made objects
 Abstract Quickbird Vs Aerial s in identifying man-made objects Abdullah Mah abdullah.mah@aramco.com Remote Sensing Group, emap Division Integrated Solutions Services Department (ISSD) Saudi Aramco, Dhahran
COMPARISON OF INFORMATION CONTENTS OF HIGH RESOLUTION SPACE IMAGES
 COMPARISON OF INFORMATION CONTENTS OF HIGH RESOLUTION SPACE IMAGES H. Topan*, G. Büyüksalih*, K. Jacobsen ** * Karaelmas University Zonguldak, Turkey ** University of Hannover, Germany htopan@karaelmas.edu.tr,
Module 3 Introduction to GIS. Lecture 8 GIS data acquisition
 Module 3 Introduction to GIS Lecture 8 GIS data acquisition GIS workflow Data acquisition (geospatial data input) GPS Remote sensing (satellites, UAV s) LiDAR Digitized maps Attribute Data Management Data
RADAR (RAdio Detection And Ranging)
") RADAR (RAdio Detection And Ranging) CLASSIFICATION OF NONPHOTOGRAPHIC REMOTE SENSORS PASSIVE ACTIVE DIGITAL CAMERA THERMAL (e.g. TIMS) VIDEO CAMERA MULTI- SPECTRAL SCANNERS VISIBLE & NIR MICROWAVE Real
RADAR (RAdio Detection And Ranging) CLASSIFICATION OF NONPHOTOGRAPHIC REMOTE SENSORS PASSIVE ACTIVE DIGITAL CAMERA THERMAL (e.g. TIMS) VIDEO CAMERA MULTI- SPECTRAL SCANNERS VISIBLE & NIR MICROWAVE Real
746A27 Remote Sensing and GIS
 746A27 Remote Sensing and GIS Lecture 1 Concepts of remote sensing and Basic principle of Photogrammetry Chandan Roy Guest Lecturer Department of Computer and Information Science Linköping University What
A map says to you, 'Read me carefully, follow me closely, doubt me not.' It says, 'I am the Earth in the palm of your hand. Without me, you are alone
 A map says to you, 'Read me carefully, follow me closely, doubt me not.' It says, 'I am the Earth in the palm of your hand. Without me, you are alone and lost. Beryl Markham (West With the Night, 1946
Ghazanfar A. Khattak National Centre of Excellence in Geology University of Peshawar
 INTRODUCTION TO REMOTE SENSING Ghazanfar A. Khattak National Centre of Excellence in Geology University of Peshawar WHAT IS REMOTE SENSING? Remote sensing is the science of acquiring information about
NRS 415 Remote Sensing of Environment
 NRS 415 Remote Sensing of Environment 1 High Oblique Perspective (Side) Low Oblique Perspective (Relief) 2 Aerial Perspective (See What s Hidden) An example of high spatial resolution true color remote
Remote Sensing 1 Principles of visible and radar remote sensing & sensors
 Remote Sensing 1 Principles of visible and radar remote sensing & sensors Nick Barrand School of Geography, Earth & Environmental Sciences University of Birmingham, UK Field glaciologist collecting data
Interpreting land surface features. SWAC module 3
 Interpreting land surface features SWAC module 3 Interpreting land surface features SWAC module 3 Different kinds of image Panchromatic image True-color image False-color image EMR : NASA Echo the bat
Active and Passive Microwave Remote Sensing
 Active and Passive Microwave Remote Sensing Passive remote sensing system record EMR that was reflected (e.g., blue, green, red, and near IR) or emitted (e.g., thermal IR) from the surface of the Earth.
Volume 1 - Module 6 Geometry of Aerial Photography. I. Classification of Photographs. Vertical
 RSCC Volume 1 Introduction to Photo Interpretation and Photogrammetry Table of Contents Module 1 Module 2 Module 3.1 Module 3.2 Module 4 Module 5 Module 6 Module 7 Module 8 Labs Volume 1 - Module 6 Geometry
What is Photogrammetry
 Photogrammetry What is Photogrammetry Photogrammetry is the art and science of making accurate measurements by means of aerial photography: Analog photogrammetry (using films: hard-copy photos) Digital
Aral Sea profile Selection of area 24 February April May 1998
 250 km Aral Sea profile 1960 1960 1985 1986 1987 1988 1989 1990 1991 1992 1993 1994 1995 1996 1997 1998 2010? Selection of area Area of interest Kzyl-Orda Dried seabed 185 km Syrdarya river Aral Sea Salt
INTRODUCTORY REMOTE SENSING. Geob 373
 INTRODUCTORY REMOTE SENSING Geob 373 Landsat 7 15 m image highlighting the geology of Oman http://www.satimagingcorp.com/gallery-landsat.html ASTER 15 m SWIR image, Escondida Mine, Chile http://www.satimagingcorp.com/satellite-sensors/aster.html
Sommersemester Prof. Dr. Christoph Kleinn Institut für Waldinventur und Waldwachstum Arbeitsbereich Fernerkundung und Waldinventur.
 Basics of Remote Sensing Some literature references Franklin, SE 2001 Remote Sensing for Sustainable Forest Management Lewis Publishers 407p Lillesand, Kiefer 2000 Remote Sensing and Image Interpretation
Introduction. Introduction. Introduction. Introduction. Introduction
 Identifying habitat change and conservation threats with satellite imagery Extinction crisis Volker Radeloff Department of Forest Ecology and Management Extinction crisis Extinction crisis Conservationists
Lecture 2. Electromagnetic radiation principles. Units, image resolutions.
 NRMT 2270, Photogrammetry/Remote Sensing Lecture 2 Electromagnetic radiation principles. Units, image resolutions. Tomislav Sapic GIS Technologist Faculty of Natural Resources Management Lakehead University
9/12/2011. Training Course Remote Sensing Basic Theory & Image Processing Methods September 2011
 Training Course Remote Sensing Basic Theory & Image Processing Methods 19 23 September 2011 Introduction to Remote Sensing Michiel Damen (September 2011) damen@itc.nl 1 Overview Some definitions Remote
Geometry of Aerial Photographs
 Geometry of Aerial Photographs Aerial Cameras Aerial cameras must be (details in lectures): Geometrically stable Have fast and efficient shutters Have high geometric and optical quality lenses They can
APCAS/10/21 April 2010 ASIA AND PACIFIC COMMISSION ON AGRICULTURAL STATISTICS TWENTY-THIRD SESSION. Siem Reap, Cambodia, April 2010
 APCAS/10/21 April 2010 Agenda Item 8 ASIA AND PACIFIC COMMISSION ON AGRICULTURAL STATISTICS TWENTY-THIRD SESSION Siem Reap, Cambodia, 26-30 April 2010 The Use of Remote Sensing for Area Estimation by Robert
Active and Passive Microwave Remote Sensing
 Active and Passive Microwave Remote Sensing Passive remote sensing system record EMR that was reflected (e.g., blue, green, red, and near IR) or emitted (e.g., thermal IR) from the surface of the Earth.
Relief Displacement of Vertical Features
 G 210 Lab. Relief Displacement of Vertical Features An increase in the elevation of a feature causes its position on the photograph to be displaced radially outward from the principle point. Hence, when
FOR 353: Air Photo Interpretation and Photogrammetry. Lecture 2. Electromagnetic Energy/Camera and Film characteristics
 FOR 353: Air Photo Interpretation and Photogrammetry Lecture 2 Electromagnetic Energy/Camera and Film characteristics Lecture Outline Electromagnetic Radiation Theory Digital vs. Analog (i.e. film ) Systems
Final Examination Introduction to Remote Sensing. Time: 1.5 hrs Max. Marks: 50. Section-I (50 x 1 = 50 Marks)
") Final Examination Introduction to Remote Sensing Time: 1.5 hrs Max. Marks: 50 Note: Attempt all questions. Section-I (50 x 1 = 50 Marks) 1... is the technology of acquiring information about the Earth's
Final Examination Introduction to Remote Sensing Time: 1.5 hrs Max. Marks: 50 Note: Attempt all questions. Section-I (50 x 1 = 50 Marks) 1... is the technology of acquiring information about the Earth's
EXAMPLES OF TOPOGRAPHIC MAPS PRODUCED FROM SPACE AND ACHIEVED ACCURACY CARAVAN Workshop on Mapping from Space, Phnom Penh, June 2000
 EXAMPLES OF TOPOGRAPHIC MAPS PRODUCED FROM SPACE AND ACHIEVED ACCURACY CARAVAN Workshop on Mapping from Space, Phnom Penh, June 2000 Jacobsen, Karsten University of Hannover Email: karsten@ipi.uni-hannover.de
INTRODUCTION TO REMOTE SENSING AND ITS APPLICATIONS
 INTRODUCTION TO REMOTE SENSING AND ITS APPLICATIONS Prof. Dr. Abudeif A. Bakheit Geology Department. Faculty of Science Assiut University This representation was prepared from different power point representations
to Geospatial Technologies
 What s in a Pixel? A Primer for Remote Sensing What s in a Pixel Development UNH Cooperative Extension Geospatial Technologies Training Center Shane Bradt UConn Cooperative Extension Geospatial Technology
High Resolution Sensor Test Comparison with SPOT, KFA1000, KVR1000, IRS-1C and DPA in Lower Saxony
 High Resolution Sensor Test Comparison with SPOT, KFA1000, KVR1000, IRS-1C and DPA in Lower Saxony K. Jacobsen, G. Konecny, H. Wegmann Abstract The Institute for Photogrammetry and Engineering Surveys
CHARACTERISTICS OF REMOTELY SENSED IMAGERY. Radiometric Resolution
 CHARACTERISTICS OF REMOTELY SENSED IMAGERY Radiometric Resolution There are a number of ways in which images can differ. One set of important differences relate to the various resolutions that images express.
CanImage. (Landsat 7 Orthoimages at the 1: Scale) Standards and Specifications Edition 1.0
 Standards and Specifications Edition 1.0") CanImage (Landsat 7 Orthoimages at the 1:50 000 Scale) Standards and Specifications Edition 1.0 Centre for Topographic Information Customer Support Group 2144 King Street West, Suite 010 Sherbrooke, QC
CanImage (Landsat 7 Orthoimages at the 1:50 000 Scale) Standards and Specifications Edition 1.0 Centre for Topographic Information Customer Support Group 2144 King Street West, Suite 010 Sherbrooke, QC
Coral Reef Remote Sensing
 Coral Reef Remote Sensing Spectral, Spatial, Temporal Scaling Phillip Dustan Sensor Spatial Resolutio n Number of Bands Useful Bands coverage cycle Operation Landsat 80m 2 2 18 1972-97 Thematic 30m 7
IKONOS High Resolution Multispectral Scanner Sensor Characteristics
 High Spatial Resolution and Hyperspectral Scanners IKONOS High Resolution Multispectral Scanner Sensor Characteristics Launch Date View Angle Orbit 24 September 1999 Vandenberg Air Force Base, California,
Satellite Imagery and Remote Sensing. DeeDee Whitaker SW Guilford High EES & Chemistry
 Satellite Imagery and Remote Sensing DeeDee Whitaker SW Guilford High EES & Chemistry whitakd@gcsnc.com Outline What is remote sensing? How does remote sensing work? What role does the electromagnetic
TechTime New Mapping Tools for Transportation Engineering
 GeoEye-1 Stereo Satellite Imagery Presented by Karl Kliparchuk, M.Sc., GISP kkliparchuk@mcelhanney.com 604-683-8521 All satellite imagery are copyright GeoEye Corp GeoEye-1 About GeoEye Corp Headquarters:
Using Freely Available. Remote Sensing to Create a More Powerful GIS
 Using Freely Available Government Data and Remote Sensing to Create a More Powerful GIS All rights reserved. ENVI, E3De, IAS, and IDL are trademarks of Exelis, Inc. All other marks are the property of
Introduction to Remote Sensing. Electromagnetic Energy. Data From Wave Phenomena. Electromagnetic Radiation (EMR) Electromagnetic Energy
 Electromagnetic Energy") A Basic Introduction to Remote Sensing (RS) ~~~~~~~~~~ Rev. Ronald J. Wasowski, C.S.C. Associate Professor of Environmental Science University of Portland Portland, Oregon 1 September 2015 Introduction
A Basic Introduction to Remote Sensing (RS) ~~~~~~~~~~ Rev. Ronald J. Wasowski, C.S.C. Associate Professor of Environmental Science University of Portland Portland, Oregon 1 September 2015 Introduction
Remote Sensing is the observation of the Earth from satellites or aircrafts.
 Remote Sensing? Remote Sensing is the observation of the Earth from satellites or aircrafts. Sensors mounted on these platforms capture images of the Earth that reveal features may or may not apparent
Satellite Remote Sensing: Earth System Observations
 Satellite Remote Sensing: Earth System Observations Land surface Water Atmosphere Climate Ecosystems 1 EOS (Earth Observing System) Develop an understanding of the total Earth system, and the effects of
Introduction to Remote Sensing
 Introduction to Remote Sensing Daniel McInerney Urban Institute Ireland, University College Dublin, Richview Campus, Clonskeagh Drive, Dublin 14. 16th June 2009 Presentation Outline 1 2 Spaceborne Sensors
Remote Sensing Part 3 Examples & Applications
 Remote Sensing Part 3 Examples & Applications Review: Spectral Signatures Review: Spectral Resolution Review: Computer Display of Remote Sensing Images Individual bands of satellite data are mapped to
Course overview; Remote sensing introduction; Basics of image processing & Color theory
 GEOL 1460 /2461 Ramsey Introduction to Remote Sensing Fall, 2018 Course overview; Remote sensing introduction; Basics of image processing & Color theory Week #1: 29 August 2018 I. Syllabus Review we will
Sample Copy. Not For Distribution.
 Photogrammetry, GIS & Remote Sensing Quick Reference Book i EDUCREATION PUBLISHING Shubham Vihar, Mangla, Bilaspur, Chhattisgarh - 495001 Website: www.educreation.in Copyright, 2017, S.S. Manugula, V.
Image interpretation I and II
 Image interpretation I and II Looking at satellite image, identifying different objects, according to scale and associated information and to communicate this information to others is what we call as IMAGE
Environmental and Natural Resources Issues in Minnesota. A Remote Sensing Overview: Principles and Fundamentals. Outline. Challenges.
 A Remote Sensing Overview: Principles and Fundamentals Marvin Bauer Remote Sensing and Geospatial Analysis Laboratory College of Natural Resources University of Minnesota Remote Sensing for GIS Users Workshop,
Sources of Geographic Information
 Sources of Geographic Information Data properties: Spatial data, i.e. data that are associated with geographic locations Data format: digital (analog data for traditional paper maps) Data Inputs: sampled
1. Theory of remote sensing and spectrum
 1. Theory of remote sensing and spectrum 7 August 2014 ONUMA Takumi Outline of Presentation Electromagnetic wave and wavelength Sensor type Spectrum Spatial resolution Spectral resolution Mineral mapping
TEMPORAL ANALYSIS OF MULTI EPOCH LANDSAT GEOCOVER IMAGES IN ZONGULDAK TESTFIELD
 TEMPORAL ANALYSIS OF MULTI EPOCH LANDSAT GEOCOVER IMAGES IN ZONGULDAK TESTFIELD Şahin, H. a*, Oruç, M. a, Büyüksalih, G. a a Zonguldak Karaelmas University, Zonguldak, Turkey - (sahin@karaelmas.edu.tr,
DEMS BASED ON SPACE IMAGES VERSUS SRTM HEIGHT MODELS. Karsten Jacobsen. University of Hannover, Germany
 DEMS BASED ON SPACE IMAGES VERSUS SRTM HEIGHT MODELS Karsten Jacobsen University of Hannover, Germany jacobsen@ipi.uni-hannover.de Key words: DEM, space images, SRTM InSAR, quality assessment ABSTRACT
FOR 474: Forest Inventory. FOR 474: Forest Inventory. Why do we Care About Forest Sampling?
 FOR 474: Forest Inventory 1. Advanced Forest Inventory The Need for Forest Sampling Brief Intro to Remote Sensing and GIS Readings: FOR 474: Forest Inventory Related Courses! FOR 274: Forest Measurements
INF-GEO Introduction to remote sensing
 INF-GEO 4310 Introduction to remote sensing Anne Solberg (anne@ifi.uio.no) Satellites, orbits and repeat cycles Optical remote sensings Based on a tutorial adapted from Canadian Center for Remote Sensing,
REMOTE SENSING FOR FLOOD HAZARD STUDIES.
 REMOTE SENSING FOR FLOOD HAZARD STUDIES. OPTICAL SENSORS. 1 DRS. NANETTE C. KINGMA 1 Optical Remote Sensing for flood hazard studies. 2 2 Floods & use of remote sensing. Floods often leaves its imprint
Remote Sensing. Ch. 3 Microwaves (Part 1 of 2)
") Remote Sensing Ch. 3 Microwaves (Part 1 of 2) 3.1 Introduction 3.2 Radar Basics 3.3 Viewing Geometry and Spatial Resolution 3.4 Radar Image Distortions 3.1 Introduction Microwave (1cm to 1m in wavelength)
Remote Sensing Ch. 3 Microwaves (Part 1 of 2) 3.1 Introduction 3.2 Radar Basics 3.3 Viewing Geometry and Spatial Resolution 3.4 Radar Image Distortions 3.1 Introduction Microwave (1cm to 1m in wavelength)
First Exam. Geographers Tools: Gathering Information. Photographs and Imagery. SPIN 2 Image of Downtown Atlanta, GA 1995 REMOTE SENSING 9/19/2016
 First Exam Geographers Tools: Gathering Information Prof. Anthony Grande Hunter College Geography Lecture design, content and presentation AFG 0616. Individual images and illustrations may be subject to
Remote Sensing Exam 2 Study Guide
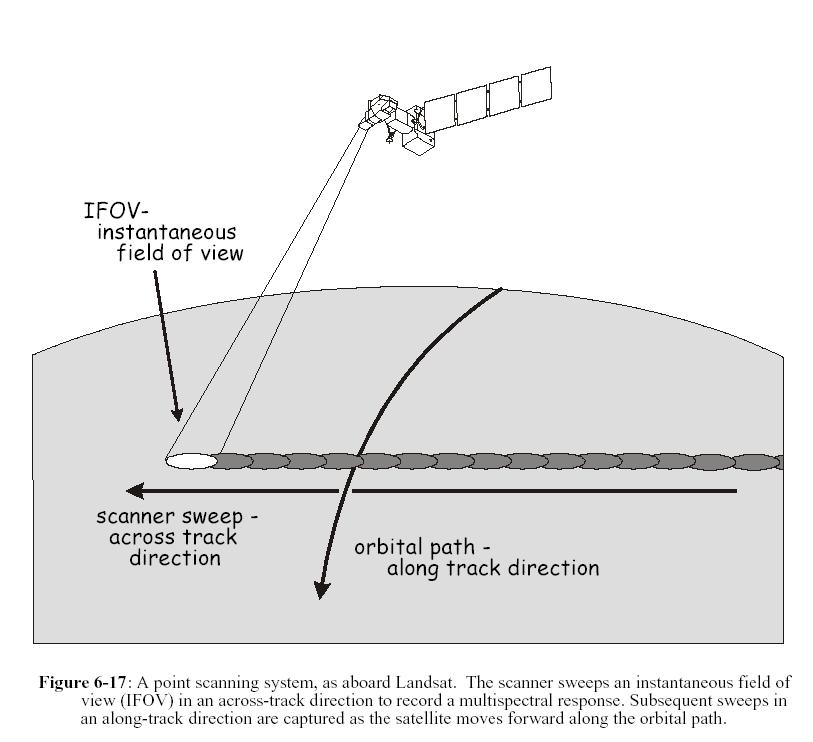
 Remote Sensing Exam 2 Study Guide Resolution Analog to digital Instantaneous field of view (IFOV) f ( cone angle of optical system ) Everything in that area contributes to spectral response mixels Sampling
Overview of how remote sensing is used by the wildland fire community.
 Overview of how remote sensing is used by the wildland fire community. Presented to the ASEN 6210 Remote Sensing Seminar on 2/18/04 by: Jeff Baranyi ESRI Denver Reported by Gary Fager. Images are from
First Exam: Thurs., Sept 28
 8 Geographers Tools: Gathering Information Prof. Anthony Grande Hunter College Geography Lecture design, content and presentation AFG 0917. Individual images and illustrations may be subject to prior copyright.
Remote Sensing of Environment (RSE)
") I N T R O Introduction to Introduction to Remote Sensing T O R S E Remote Sensing of Environment (RSE) with TNTmips page 1 TNTview Before Getting Started Imagery acquired by airborne or satellite sensors
I N T R O Introduction to Introduction to Remote Sensing T O R S E Remote Sensing of Environment (RSE) with TNTmips page 1 TNTview Before Getting Started Imagery acquired by airborne or satellite sensors
Image interpretation. Aliens create Indian Head with an ipod? Badlands Guardian (CBC) This feature can be found 300 KMs SE of Calgary.
 This feature can be found 300 KMs SE of Calgary.") Image interpretation Aliens create Indian Head with an ipod? Badlands Guardian (CBC) This feature can be found 300 KMs SE of Calgary. 50 1 N 110 7 W Milestones in the History of Remote Sensing 19 th century
Image interpretation Aliens create Indian Head with an ipod? Badlands Guardian (CBC) This feature can be found 300 KMs SE of Calgary. 50 1 N 110 7 W Milestones in the History of Remote Sensing 19 th century
John P. Stevens HS: Remote Sensing Test
 Name(s): Date: Team name: John P. Stevens HS: Remote Sensing Test 1 Scoring: Part I - /18 Part II - /40 Part III - /16 Part IV - /14 Part V - /93 Total: /181 2 I. History (3 pts. each) 1. What is the name
Remote Sensing. Division C. Written Exam
 Remote Sensing Division C Written Exam Team Name: Team #: Team Members: _ Score: /132 A. Matching (10 points) 1. Nadir 2. Albedo 3. Diffraction 4. Refraction 5. Spatial Resolution 6. Temporal Resolution
Remote Sensing. Odyssey 7 Jun 2012 Benjamin Post
 Remote Sensing Odyssey 7 Jun 2012 Benjamin Post Definitions Applications Physics Image Processing Classifiers Ancillary Data Data Sources Related Concepts Outline Big Picture Definitions Remote Sensing
First Exam: New Date. 7 Geographers Tools: Gathering Information. Photographs and Imagery REMOTE SENSING 2/23/2018. Friday, March 2, 2018.
 First Exam: New Date Friday, March 2, 2018. Combination of multiple choice questions and map interpretation. Bring a #2 pencil with eraser. Based on class lectures supplementing chapter 1. Review lecture
9/13/2011. Training Course Remote Sensing Basic Theory & Image Processing Methods September 2011
 Training Course Remote Sensing Basic Theory & Image Processing Methods 19 23 September 2011 DIGITAL TERRAIN MODELS Introduction Michiel Damen (April 2011) damen@itc.nl 1 Digital Elevation and Terrain Models