Popstats Parentage Statistics Strength of Genetic Evidence In Parentage Testing
|
|
|
- Lee Atkinson
- 6 years ago
- Views:
Transcription
1 Popstats Parentage Statistics Strength of Genetic Evidence In Parentage Testing Arthur J. Eisenberg, Ph.D. Director DNA Identity Laboratory UNT-Health Science Center
2 PATERNITY TESTING MOTHER ALLEGED FATHER CHILD Two alleles for each autosomal genetic marker
3 Typical Paternity Test Two possible outcomes of test: Inclusion The obligate paternal alleles in the child all have corresponding alleles in the Alleged Father Exclusion The obligate paternal alleles in the child DO NOT have corresponding alleles in the Alleged Father

4 Exclusion Nope Nope
5 Results The Tested Man is Excluded as the Biological Father of the Child in Question
6 Inclusion
7 Results The Tested Man Cannot be Excluded as the Biological Father of the Child in Question Several Statistical Values are Calculated to Assess the Strength of the Genetic Evidence
8 Language of Paternity Testing PI CPI W PE Paternity Index Combined Paternity Index Probability of Paternity Probability of Exclusion
9 summarizes information provided by Likelihood Ratio Paternity Index genetic testing Probability that some event will occur under a set of conditions or assumptions Divided by the probability that the same event will occur under a set of different mutually exclusive conditions or assumptions
10 Paternity Index Observe three types from a man, a woman, and a child Assume true trio the man and woman are the true biologic parents of child Assume false trio woman is the mother, man is not the father In the false trio, the child s father is a man of unknown type, selected at random from population (unrelated to mother and tested man)
11 Standard Paternity Index In paternity testing, the event is observing three phenotypes, those of a woman, man and child. The assumptions made for calculating the numerator (X) is that these three persons are a true trio. For the denominator (Y) the assumptions is thathethrepersonsarea falsetrio.
12 Paternity Analysis Hypothetical case DNA Analysis Results in Three Genotypes Mother Child Alleged Father (AB) (BC) (CD)
13 Paternity Analysis AB CD BC An AB mother and a CD father can have four possible offspring: AC, AD, BC, BD
14 Standard Paternity Index PI determination in hypothetical DNA System PI = X / Y Numerator X= is the probability that (1) a woman randomly selected from a population is type AB, and (2) a man randomly selected from a population is type CD, and (3) their child is type BC.
15 Standard Paternity Index PI determination in hypothetical DNA System PI = X / Y Denominator Y = is the probability that (1) a woman randomly selected from a population is type AB, (2) a man randomly selected and unrelated to either mother or child is type CD, and (3) the woman s child, unrelated to the randomly selected man is BC.
16 Standard Paternity Index When mating is random, the probability that the untested alternative father will transmit a specific allele to his child is equal to the allele frequency in his race. We can now look into how to actually calculate a Paternity Index
17 Hypothetical DNA Example FirstHypothesis Numerator Person Mother Child Alleged Father Type AB BC CD In order to explain this evidence Calculate Probability that a) Woman randomly selected from population is type AB b) Man randomly selected from population is type CD, and c) Their child is type BC
18 Paternity Analysis Paternity Index Numerator 2p A p B AB CD 2p C p D BC Probability = 2p A p B x 2p C p D x 0.5 x 0.5
19 Hypothetical DNA Example Second Hypothesis Denominator Person Mother Child Alleged Father Type AB BC CD In order to explain this evidence Calculate Probability that a) Woman randomly selected from population is type AB b) An alternative man randomly selected from population is type CD, and c) The woman s child, fathered by random man, is type BC
20 Paternity Analysis Paternity Index Denominator 2p A p B AB CD 2p C p D 0.5 BC p C Probability = 2p A p B x 2p C p D x 0.5 x p C
21 Paternity Analysis Paternity Index PI = PI = 2p A p B x 2p C p D x 0.5 x 0.5 2p A p B x 2p C p D x 0.5 x p C 0.5 p C
22 Hypothetical DNA Example Probability Statements Person Mother Child Alleged Father Type AB BC CD One might say (Incorrectly) a) Numerator is probability that tested man is the father, and b) Denominator is probability that he is not the father
23 Hypothetical DNA Example Probability Statement Person Mother Child Alleged Father Type AB BC CD A Correct statement is a) Numerator is probability of observed genotypes, given the tested man is the father, and b) Denominator is probability of observed genotypes, given a random man is the father.
24 Incorrect Verbal Expression of the Paternity Index? It is (X/Y) times more likely the tested man was the true biological father than an untested random man was the father
25 Correct Verbal Expression of the Paternity Index? It is (X/Y) times more likely to see the genetic results if the tested man was the true biological father than if an untested random man was the father or There is (X/Y) times more support for the genetic results if the tested man was the true biological father than if an untested random man was the father
26 There are 15 possible combinations of genotypes for a paternity trio
27 Paternity Index M and C share one allele and AF is homozygous for the obligatory allele Parents AB? C M AF Child BC C AF can only pass C allele Random Man has p chance of passing the C allele PI = 1/p
28 Paternity Analysis Paternity Index Numerator 2p A p B AB C p C BC Probability = 2p A p B x p C 2 x 0.5 x 1
29 Paternity Analysis Paternity Index Denominator 2p A p B AB C p C BC p C Probability = 2p A p B x p C 2 x 0.5 x p C
30 Paternity Analysis Paternity Index PI = PI = 2p A p B x p 2 C x 0.5 x 1 2p A p B x p 2 C x 0.5 x p C 1 p C
31 Paternity Index M and C share both alleles and AF is heterozygous with one of the obligatory alleles Parents AB? BC M AF Child AB C M has a 1 in 2 chance of passing A or B allele AF has a 1 in 2 chance of passing B allele RM has (p + q) chance of passing the A or B alleles PI = 0.5/(p+q)
32 Paternity Analysis Paternity Index Numerator 2p A p B AB BC 2p B p C 0.5 A 0.5 B AB Probability = 2p A p B x 2p B p C x 0.5 (ma) x 0.5 (fb)
33 Paternity Analysis Paternity Index Denominator 2p A p B AB BC 2p B p C 0.5 A B pa + pb AB probability = 2p A p B x 2p B p C x(0.5 (ma) x p B (mb) x p A )
34 Paternity Analysis Paternity Index PI = 2p A p B x 2p B p C x 0.5 (ma) x 0.5 (fb) 2p A p B x 2p B p C x(0.5 (mb) x p A (ma) x p B ) PI = PI = p A + 0.5p B 0.5 p A + p B
35 Paternity Index M and C share both alleles and AF is heterozygous with both of the obligatory alleles Parents AB? AB M AF Child AB C M has a 1 in 2 chance of passing A or B allele AF has a 1 in 2 chance of passing A or B allele RM has (p + q) chance of passing the A or B alleles PI = 1/(p+q)
36 Paternity Analysis Paternity Index Numerator 2p A p B AB AB 2p A p B 0.5 A B 0.5 A B AB Probability = 2p A p B x 2p A p B x (0.5 (ma) x 0.5 (fb) (mb) x 0.5 (fa) )
37 Paternity Analysis Paternity Index Denominator 2p A p B AB AB 2p A p B 0.5 A B AB probability = p A + p B 2p A p B x 2p A p B x(0.5 (ma) x p B (mb) x p A )
38 Paternity Analysis Paternity Index PI = 2p A p B x 2p A p B x (0.5 (ma) x 0.5 (fb) (mb) x 0.5 (fa) ) 2p A p B x 2p A p B x(0.5 (mb) x p A (ma) x p B ) PI = PI = p A + 0.5p B 1 p A + p B
39 Paternity Index M and C share both alleles and AF is homozygous with one of the obligatory alleles Parents AB M? B AF Child AB C M has a 1 in 2 chance of passing A or B allele AF can only pass the B allele RM has (p + q) chance of passing the A or B alleles PI = 1/(p+q)
40 Paternity Analysis Paternity Index Numerator 2p A p B AB B p B A 1 AB Probability = 2p A p B x p B2 x 0.5 (ma) x 1 (fb)
41 Paternity Analysis Paternity Index Denominator 2p A p B AB B p B A B pa + pb AB probability = 2p A p B x p B2 x(0.5 (ma) x p B (mb) x p A )
42 Paternity Analysis Paternity Index PI = 2p A p B x p B2 x 0.5 (ma) x 1 (fb) 2p A p B x p B2 x(0.5 (mb) x p A (ma) x p B ) PI = PI = p A + 0.5p B 1 p A + p B
43 PI Formulas Single locus, no null alleles, low mutation rate, codominance M A A A AB AB BC BC BD C A AB AB A A AB AB AB AF AB AB BC AB AC AB AC AC Numerator Denominator a a a 0.5a 0.5a 0.5a 0.5a 0.5a PI 0.5/a 0.5/a 0.5/a 0.5/a 0.5/a 0.5/a 0.5/a 0.5/a
44 PI Formulas Single locus, no null alleles, low mutation rate, codominance M A AB B BC C A A AB AB AF A A A A Numerator Denominator a 0.5a a 0.5a PI 1/a 1/a 1/a 1/a
45 PI Formulas Single locus, no null alleles, low mutation rate, codominance M AB C AB AF AC Numerator 0.25 Denominator 0.5(a+b) PI 0.5/(a+b)
46 PI Formulas Single locus, no null alleles, low mutation rate, codominance M AB AB C AB AB AF A AB Numerator Denominator 0.5(a+b) 0.5(a+b) PI 1/(a+b) 1/(a+b)
47 Combined Paternity Index When multiple genetic systems are tested, a PI is calculated for each system. This value is referred to as a System PI. If the genetic systems are inherited independently, the Combined Paternity Index (CPI) is the product of the System PI s
48 Combined Paternity Index What is the CPI? The CPI is a measure of the strength of the genetic evidence. It indicates whether the evidence fits better with the hypothesis that the man is the father or with the hypothesis that someone else is the father.
49 Combined Paternity Index The theoretical range for the CPI is from 0 to infinity A CPI of 1 means the genetic tests provides no information A CPI less than 1; the genetic evidence is more consistent with non-paternity than paternity. A CPI greater than 1; the genetic evidence supports the assertion that the tested man is the father.
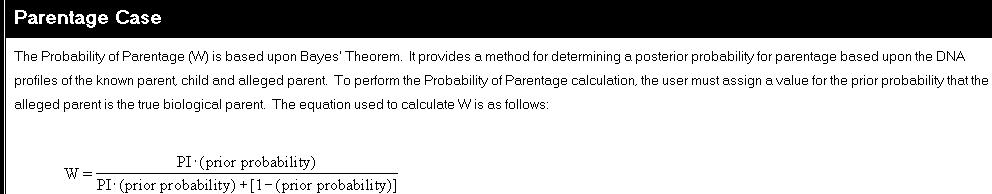
50 Probability of Paternity The probability of paternity is a measure of the strengths of one s belief in the hypothesis that the tested man is the father. The correct probability must be based on all of the evidence in the case. The non-genetic evidence comes from the testimony of the mother, tested man, and other witnesses. The genetic evidence comes from the DNA paternity test.
51 Probability of Paternity The probability of paternity (W) is based
52 Probability of Paternity The prior probability of paternity is the strength of one s belief that the tested man is the father based only on the non-genetic evidence.
53 Probability of Paternity Probability of Paternity (W) = CPI x P [CPI x P + (1 P)] P = Prior Probability; it is a number greater than 0 and less than or equal to 1. In many criminal proceedings the Probability of Paternity is not admissible. In criminal cases, the accused is presumed innocent until proven guilty. Therefore, the defense would argue that the Prior Probability should be 0. You cannot calculate a posterior Probability of Paternity with a Prior Probability of 0.
54 Probability of Paternity In the United States, the court system has made the assumption that the prior probability is equal to 0.5. The argument that is presented is that the tested man is either the true father or he is not. In the absence of any knowledge about which was the case, it is reasonable to give these two possibilities equal prior probabilities.
55 Probability of Paternity With a prior probability of 0.5, the Probability of Paternity (W) = CPI x 0.5 [CPI x (1 0.5)] = CPI CPI + 1
56 Posterior Odds in Favor of Paternity Posterior Odds = CPI x Prior Odds Prior Odds = P / (1 - P) Posterior Odds in Favor of Paternity = CPI x [P / (1 - P)] If the prior probability of paternity is 0.7, then the prior odds favoring paternity is 7 to 3. If a paternity test is done and the CPI is 10,000, then the Posterior Odds in Favor of Paternity = 10,000 x (0.7 / 0.3) = 23,333 Posterior Odds in Favor of Paternity = 23,333 to 1
57 Probability of Exclusion The probability of exclusion (PE) is defined as the probability of excluding a random individual from the population given the alleles of the child and the mother. The genetic information of the tested man is not considered in the determination of the probability of exclusion
58 Probability of Exclusion The probability of exclusion (PE) is equal to the frequency of all men in the population who do not contain an allele that matches the obligate paternal allele of the child.
59 Probability of Exclusion PE = 1 - (a 2 + 2ab) a = frequency of the allele the child inherited from the biological father (obligate paternal allele). The frequency of the obligate allele is determined for each of the major racial groups, and the most common frequency is used in the calculation.
60 Probability of Exclusion (a 2 + 2ab) = Probability of Inclusion Probability of Inclusion is equal to the frequency of all men in the population who contain an allele that matches the obligate paternal allele of the child. PE = 1 Probability of Inclusion
61 Probability of Exclusion PE = 1 - (a 2 + 2ab) b = sum of the frequency of all alleles other than the obligate paternal allele. b = (1 a) PE = 1 [a 2 + 2a(1 a)] PE = 1 [a 2 + 2a 2a 2 ] PE = 1 [2a a 2 ] PE = 1 2a + a 2 PE = (1 a) 2
62 Probability of Exclusion If the Mother and Child are both phenotype AB, men who cannot be excluded are those who could transmit either an A or B allele (or both). In this case the: PE = [1 - (a + b)] 2
63 Combined Probability of Exclusion The individual Probability of Exclusion is calculated for each of the genetic systems (loci) analyzed. The overall Probability of Excluding (CPE) a falsely accused man in a given case equals: 1 [(1 PE 1 ) x (1 PE 2 ) x (1 PE 3 ) x (1 PE N )]
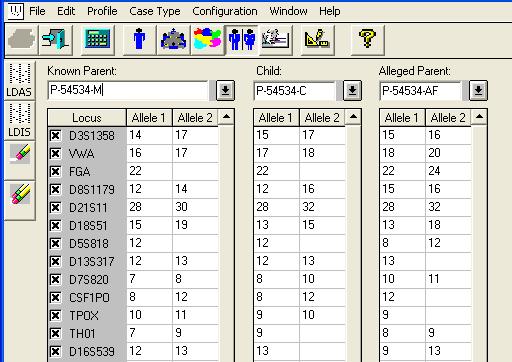
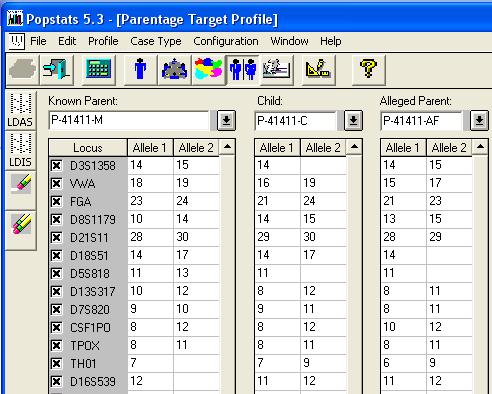
64 Paternity Trio P-54534
65 Paternity Trio P-54534
66 Paternity Trio P-54534
67 Paternity Trio P M C AF Allele Frequency D3S p 15 (3p) 17 17m 16 HUMvWA m 18 (12p p13.2) 17 18p 20 FGA (4q28) = = =
68 Paternity Trio P M C AF PI Formula D3S p 15 (3p) 17 17m 16 HUMvWA m 18 (12p p13.2) 17 18p 20 FGA (4q28) /a 0.5/a 0.5/a
69 Paternity Trio P M C AF Paternity Index D3S p 15 (3p) 17 17m 16 HUMvWA m 18 (12p p13.2) 17 18p 20 FGA (4q28)
70 Paternity Trio P M C AF PE Formula D3S p 15 (3p) 17 17m 16 HUMvWA m 18 (12p p13.2) 17 18p 20 FGA (4q28) 24 (1 a) 2 (1 a) 2 (1 a) 2
71 Paternity Trio P M C AF PE D3S p 15 (3p) 17 17m 16 HUMvWA m 18 (12p p13.2) 17 18p 20 FGA (4q28)
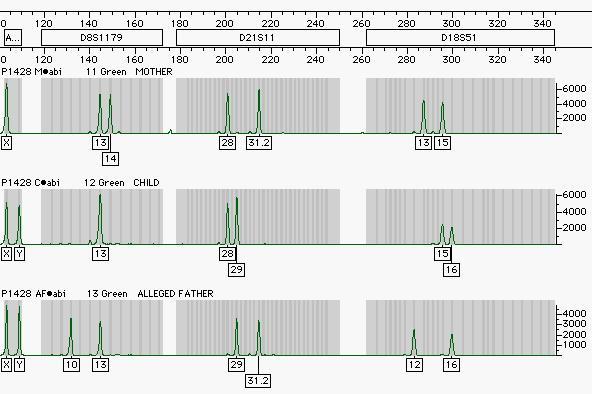
72 Paternity Trio P M C AF Allele Frequency D8S m 15 (8) 14 16p 16 D21S m 28 (21q q21) 30 32p 32 D18S p 13 (18q21.3) 19 15m = = =
73 Paternity Trio P M C AF PI Formula D8S m 15 (8) 14 16p 16 D21S m 28 (21q q21) 30 32p 32 D18S p 13 (18q21.3) 19 15m /a 0.5/a 0.5/a
74 Paternity Trio P M C AF Paternity Index D8S m 15 (8) 14 16p 16 D21S m 28 (21q q21) 30 32p 32 D18S p 13 (18q21.3) 19 15m
75 Paternity Trio P M C AF PE Formula D8S m 15 (8) 14 16p 16 D21S m 28 (21q q21) 30 32p 32 D18S p 13 (18q21.3) 19 15m 18 (1 a) 2 (1 a) 2 (1 a) 2
76 Paternity Trio P M C AF PE D8S m 15 (8) 14 16p 16 D21S m 28 (21q q21) 30 32p 32 D18S p 13 (18q21.3) 19 15m
77 Paternity Trio P M C AF Allele Frequency D5S (5q21 - q31) 12 D13S (13q22 - q31) D7S m 10 (7q) 8 10p = = = =
78 Paternity Trio P M C AF PI Formula D5S (5q21 - q31) 12 D13S (13q22 - q31) D7S m 10 (7q) 8 10p /a 1/(a+b) 0.5/a
79 Paternity Trio P M C AF Paternity Index D5S (5q21 - q31) 12 D13S (13q22 - q31) D7S m 10 (7q) 8 10p
80 Paternity Trio P M C AF PE Formula D5S (5q21 - q31) 12 D13S (13q22 - q31) D7S m 10 (7q) 8 10p 11 (1 a) 2 [1 (a+b)] 2 (1 a) 2
81 Paternity Trio P M C AF PE D5S (5q21 - q31) 12 D13S (13q22 - q31) D7S m 10 (7q) 8 10p
82 Paternity Trio P M C AF Allele Frequency HUMCSF1PO (5q q34) HUMTPOX 10 9p 9 (2p23-2pter) 11 10m HUMTH (11p15.5) 9 9 D16S (16p24 - p25) = = = = =
83 Paternity Trio P M C AF PI Formula HUMCSF1PO (5q q34) HUMTPOX 10 9p 9 (2p23-2pter) 11 10m HUMTH (11p15.5) 9 9 D16S (16p24 - p25) /(a+b) 1/a 0.5/a 0.5/a
84 Paternity Trio P M C AF Paternity Index HUMCSF1PO (5q q34) HUMTPOX 10 9p 9 (2p23-2pter) 11 10m HUMTH (11p15.5) 9 9 D16S (16p24 - p25)
85 Paternity Trio P M C AF PE Formula HUMCSF1PO (5q q34) HUMTPOX 10 9p 9 (2p23-2pter) 11 10m HUMTH (11p15.5) 9 9 D16S (16p24 - p25) [1 (a+b)] 2 (1 a) 2 (1 a) 2 (1 a) 2
86 Paternity Trio P M C AF PE HUMCSF1PO (5q q34) HUMTPOX 10 9p 9 (2p23-2pter) 11 10m HUMTH (11p15.5) 9 9 D16S (16p24 - p25)
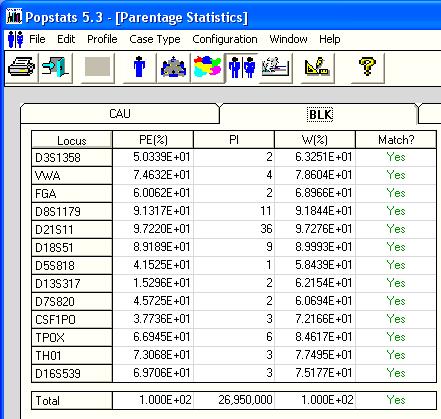
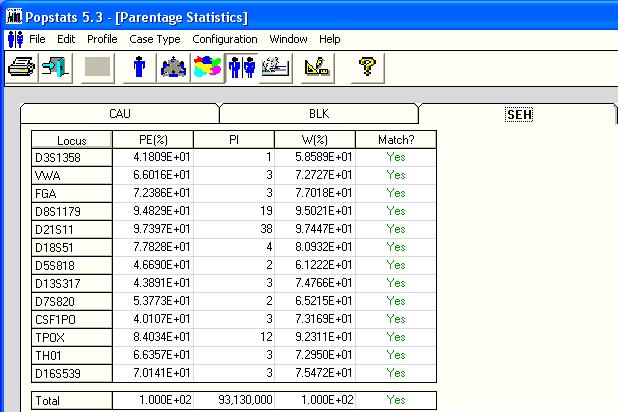
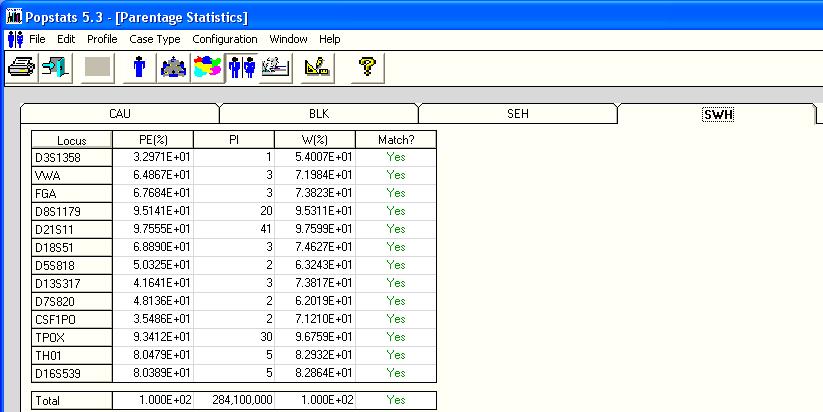
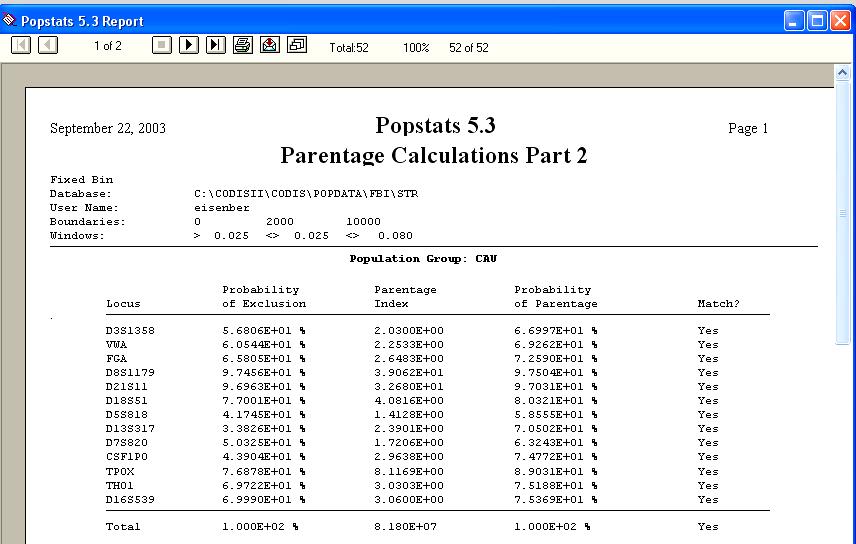
87 Paternity Trio P Core CODIS Loci Combined Paternity Index 81,424,694 Probability of Paternity % Probability of Exclusion %
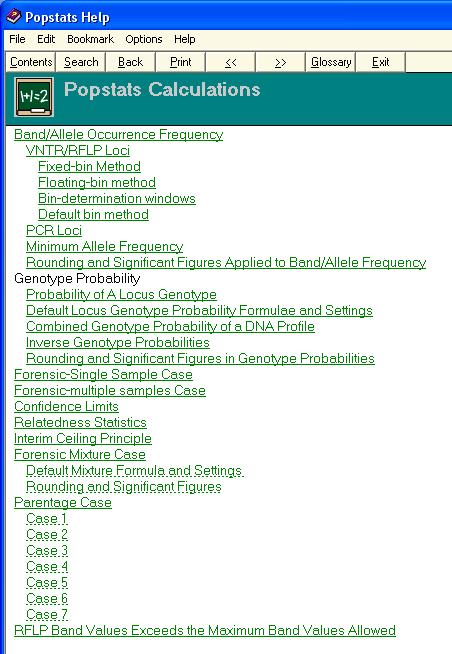
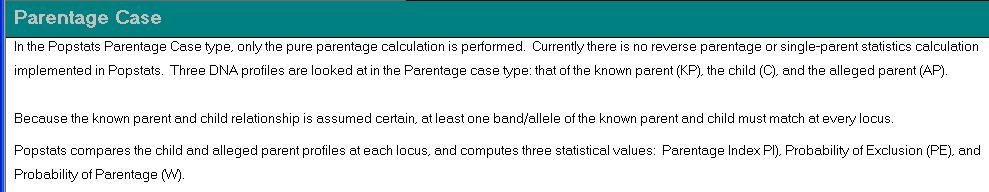
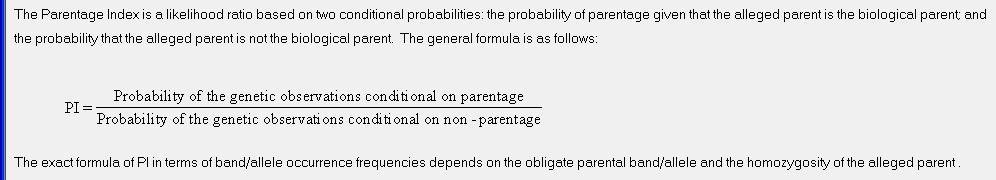
88 Popstats Parentage Calculations PopStats can only do basic parentage statistics!

89 Popstats Can only Calculate with a Complete Trio (Mother, Child, Alleged Father)
90
91
92
93
94
95

96 PE = % W = %
97
98
99
100

101 Popstats Help Equation Numbers
102 Equation Number 1 TPOX M C AF op
103 Equation Number 2 D3S1358 FGA D18S51 TH01 M C AF op M C AF op M C AF op M C AF 7 9 op 8 9 9
104 Equation Number 3 M C AF P P Q R Qop M C AF P Qop Q Q M C AF Q Qop Q
105 Equation Number 4 VWA D8S1179 D21S11 D7S820 M C AF op 20 M C AF op 16 M C AF op 32 M C AF op 11
106 Equation Number 5 M C AF M C AF M C AF P P P Q Q or P P Q Q Q or P P P Q Q Q
107 Equation Number 6 CSF1PO M C AF 8 8 op op
108 Equation Number 7 M C AF M C AF P P P Q Q S or P P Q Q Q S
109
110
111
112
113 Popstats Cannot Correctly Calculate Parentage Statistics in Non-Typical Cases
114 Parentage Statistics in Non-Typical Cases Mutation/Recombination Tested man does not match at a single genetic locus Tested Man is not the biological father but is related to the biological father (brother, son, or father)
115
116
117
118
119 Case Scenario A mother, child, and alleged father have been analyzed with the 13 core CODIS STR loci, the alleged father cannot be excluded at 12 loci, however, there is a single non-matching system (single inconsistency), the alleged father does not contain the obligate paternal allele found in the child at one locus.
120 Three possible explanations can be considered: 1. The alleged father is excluded as the biological father of the child and is unrelated to the true biological father. 2. A mutation or recombination event has occurred altering the allele inherited from the AF by the child. 3. The tested man is not the biological father, but is a 1st order relative of the true biological father, and shares the majority of alleles contributed to the child with the biological father.
121 Single Inconsistencies in Paternity Testing The American Association of Blood Banks, in their standards for parentage testing laboratories, has recognized that mutations are naturally occurring genetic events, and the mutation frequency at a given locus shall be documented (5.4.2). Standard An opinion of nonpaternity shall not be rendered on the basis of an exclusion at a single DNA locus (single inconsistency).
122 Mutations in Paternity Testing The Two Exclusion Rule A single inconsistency is not sufficient to render an opinion of non-paternity, therefore, two inconsistencies have been traditionally considered genetic evidence to exclude a tested man and to issue a finding of non-paternity. This rule has been commonly applied in both serological systems and RFLP testing. However, since STR analysis often examines a battery of a dozen or more systems it is not unexpected to occasionally see two inconsistencies in cases were the tested man is the true biological father.
123 Mutations in Paternity Testing Calculating a Paternity Index In cases with a single non-matching system, the laboratory cannot simply ignore the inconsistent locus. A paternity index must be calculated for the inconsistent locus, which takes into account the possibility of a mutation. The paternity index for a single inconsistency seen in the 13 Core CODIS STR loci is a relatively small number. The system PI is greater than zero but substantially less than one.
124 Single Inconsistency Calculating a Paternity Index AB Mother? DE Alleged Father BC Child
125 Single Inconsistency Numerator Person Mother Child Alleged Father Type AB BC DE In order to explain this evidence Calculate Probability that a) Woman randomly selected from population is type AB b) Man randomly selected from population is type DE, and c) Their child is type BC
126 Single Inconsistency Numerator Person Mother Child Alleged Father Type AB BC DE In order to explain this evidence the numerator must calculate the probability that a man without a C allele will contribute a C allele X = P(man without C allele will contribute C allele) = P(contributed gene will mutate) x P(mutated gene will be a C)
127 Single Inconsistency Numerator X = P(man without C will contribute C) X = P(contributed gene will mutate) x P(mutated gene will be a C) µ = observed rate of mutations/meiosis for the locus P(mutated gene will be a C) ie. Frequency of C allele = c X = µ x c
128 Single Inconsistency Calculating a Paternity Index Numerator 2ab AB DE 2de 0.5 µ x c BC Probability = 2ab x 2de x 0.5 x µ x c
129 Single Inconsistency Denominator Person Mother Child Alleged Father Type AB BC DE In order to explain this evidence Calculate Probability that a) Woman randomly selected from population is type AB b) An alternative man randomly selected from population is type DE, and c) The woman s child, fathered by random man, is type BC
130 Single Inconsistency Denominator Person Mother Child Alleged Father Type AB BC DE In order to explain this evidence the denominator must calculate the probability that the paternal allele is C and a random man would have a genotype inconsistent with paternity at this locus Y = P(paternal allele is C and random man has no C allele) = P(paternal gene is C) x P(random man has no C allele)
131 Single Inconsistency Denominator Y = P(paternal allele is C and random man has no C allele) = P(paternal gene is C) x P(random man has no C allele) P(paternal allele will be a C) ie. Frequency of C allele = c P(random man has no C allele) = probability of exclusion The AABB does not use the case specific power of exclusion, but the mean power of exclusion (A) Y = c. A
132 Single Inconsistency Calculating a Paternity Index Denominator 2ab AB DE 2de 0.5 BC C x A Probability = 2ab x 2de x 0.5 x c x A
133 Single Inconsistency Paternity Index PI = 2ab x 2de x 0.5 x µ x c 2ab x 2de x 0.5 x c x A PI = µ A
134 Mutation Rates and Mean Power of Exclusion for CODIS Core STR Loci Locus Mutation Rate Mean PE CSF1PO TPOX TH vwa D16S D7S D13S D5S
135 Mutation Rates and Mean Power of Exclusion for CODIS Core STR Loci Locus Mutation Rate Mean PE FGA D8S D18S D21S D3S
136 Mutation Rates and Mean Power of Exclusion for Additional STR Loci Locus Mutation Rate Mean PE F13AO FESFPS F13B LIPOL PENTA E
137 Single Inconsistency P M C AF PI Formula HUMCSF1PO HUMTPOX HUMTH01 7 9p 9 7m 6 HUMvWA m p /(a+b)] 1/(a+b) 0.5/a µ/a (0.0034/0.667)
138 Single Inconsistency P M C AF Paternity Index HUMCSF1PO HUMTPOX HUMTH01 7 9p 9 7m 6 HUMvWA m p
139 Single Inconsistency P M C AF PI Formula D16S m 12 11p 11 D7S p m 10 D13S m p 8 D5S /a 0.5/a 0.5/a 1/a
140 Single Inconsistency P M C AF Paternity Index D16S m 12 11p 11 D7S p m 10 D13S m p 8 D5S
141 Single Inconsistency P M C AF FGA 24 24m p 21 D18S D21S m p 28 D3S D8S p m 13 PI Formula 0.5/a 1/(a+b) 0.5/a 0.5/a 0.5/a
142 Single Inconsistency P M C AF Paternity Index FGA 24 24m p 21 D18S D21S m p 28 D3S D8S p m
143 Paternity Trio with a Single Inconsistency 12 STR without vwa Combined Paternity Index 126,476 Probability of Paternity % Single Inconsistency at vwa Combined Paternity Index 632 Probability of Paternity 99.84%
144 Single Inconsistencies in Paternity Testing A mutation may be one of the possible explanations, the genetic results could suggest that a close relative (such as a brother, child or father) may be the biological father.
145 Single Inconsistencies in Paternity Testing When considering brothers, on average a tested man and his brother will share 50% of their alleles each can contribute these alleles in a random manner. This is also true between a father and son of a tested man.
146 Avuncular Index AI We can use the development of a likelihood ratio to test two competing hypotheses: H 1 : The tested man s brother is the biological father of the child H 2 : A random man is the biological father of the child
147 Avuncular Index Numerator H 1 : The tested man s brother is the biological father of the child H 1 = X + Y 2 H 1 = 0.5 X Y
148 Avuncular Index Denominator H 2 : A random man is the biological father of the child H 2 = Y
149 Avuncular Index AI The Avuncular Index for any system can be written as: AI = 0.5 X Y Y AI = PI + 1 2
150 Single Inconsistency P M C AF Paternity Index HUMCSF1PO Avuncular Index HUMTPOX HUMTH01 7 9p 9 7m 6 HUMvWA m p
151 Single Inconsistency P M C AF Paternity Index D16S m 12 11p 11 Avuncular Index D7S p m 10 D13S m p 8 D5S
152 Single Inconsistency P M C AF Paternity Index FGA 24 24m p 21 Avuncular Index D18S D21S m p 28 D3S D8S p m
153 Paternity Trio with a Single Inconsistency 13 Core CODIS STR Loci Combined Paternity Index 632 Combined Avuncular Index 862
154 Single Inconsistency P M C AF Paternity Index F13AO Avuncular Index FESFPS F13B LIPOL 10 10m p PENTA E 14 13p m
155 Paternity Trio with a Single Inconsistency 18 STR Loci Combined Paternity Index 578,603 Combined Avuncular Index 101,683
156 We can use a likelihood ratio to test two competing hypotheses: H 1 : The tested man (alleged father) is the biological father of the child H 2 : The tested man s brother is the biological father of the child
157 We can use a likelihood ratio to test two competing hypotheses: Combined Paternity Index Combined Avuncular Index 578, ,683 = 5.69 The observed genetic results are 5.7-times more likely to occur under the scenario that the tested man is the father of the child, as opposed to the scenario that the tested man was the uncle of the child.
158 PowerPlex 16 System Extremely Useful in Cases with a Single Non-Matching Locus
159 P Case of Single Exclusion
160 P Case of Single Exclusion Single Exclusion
161 P Case of Single Exclusion
162 P Case of Single Exclusion PowerPlex 16 System 13 STR loci minus Penta D & Penta E Residual Combined Paternity Index 1,914 Probability of Exclusion % Probability of Paternity(prior=0.5) 99.95% 15 STR loci with Penta D & Penta E Residual Combined Paternity Index 37,699 Probability of Exclusion % Probability of Paternity(prior=0.5) %
163 Popstats Cannot Correctly Calculate Parentage Statistics in Non-Typical Cases
164 What if We Don t Have the Mother s Genetic Data? Popstats Cannot Calculate the Paternity Statistics Without the Known Parent (Mother) We can still develop a likelihood estimation for parentage. Lets examine the following logic:

165 Popstats Can only Calculate with a Complete Trio (Mother, Child, Alleged Father)
166 Paternity Index Only Man and Child Tested Observe two types from a man and a child Assume true duo the man is the father of the child Assume false duo the man is not the father of the child (simply two individuals selected at random) In the false duo the child s father is a man of unknown type, selected at random from population (unrelated to tested man)
167 Paternity Index Only Man and Child Tested Hypothetical case DNA Analysis Results in Two Genotypes Mother Child Alleged Father Not Tested (AB) (AC)
168 Motherless Paternity Index PI determination in hypothetical DNA System PI = X / Y Numerator X= is the probability that (1) a man randomly selected from a population is type AC, and (2) his child is type AB. X= Pr{AF passes A} x Pr {M passes B} + Pr{AF passes B} x Pr{M passes A}
169 Motherless Paternity Index PI determination in hypothetical DNA System PI = X / Y Denominator Y = is the probability that (1) a man randomly selected and unrelated to tested man is type AC, and (2) a child unrelated to the randomly selected man is AB. Y= Pr{RM passes A} x Pr {M passes B} + Pr{RM passes B} x Pr{M passes A}
170 Motherless Paternity Index When the mother s genetic data is present, Pr{M passes A} is 0, 0.5, or 1, and Pr{M passes B} is 0, 0.5, or 1 Without the mother s data, Pr {M passes A} becomes the frequency of the gametic allele, p and Pr {M passes B} becomes the frequency of the gametic allele, q.
171 Motherless Paternity Index So, if we have a heterozygous child AB, and a heterozygous Alleged Father AC then X= Pr{AF passes A} x Pr {M passes B} + Pr{AF passes B} x Pr{M passes A} X= Pr{AF passes A} x q + Pr{AF passes B} x p Pr{AF passes A} = 0.5 Pr{AF passes B} = 0 X= 0.5 x q + 0 x p X= 0.5q
172 Motherless Paternity Index So, if we have a heterozygous child AB, and a heterozygous Alleged Father AC then Y= Pr{RM passes A} x Pr {M passes B} + Pr{RM passes B} x Pr{M passes A} Y= p x q + q x p Y= 2pq
173 Motherless Paternity Index So, if we have a heterozygous child AB, and a heterozygous Alleged Father AC then PI = X / Y X=0.5q Y= 2pq PI = 0.5q / 2pq PI = 0.25/p PI = 1/4p
174 Paternity Index Only Man and Child Tested Parents M? AC AF Child AB C The untested Mother could have passed either the A or B allele AF has a 1 in 2 chance of passing A allele RM has (p + q) chance of passing the A or B allele
175 Paternity Index Only Man and Child Tested AC AB
176 Paternity Index Only Man and Child Tested Numerator AC 2p A p C p B 0.5 A 2p A p B AB Probability = 2p A p C x 2p A p B x 0.5 (fa) x p B
177 Paternity Index Only Man and Child Tested Denominator AC 2p A p C p A + p B p A + p B 2p A p B AB probability = 2p A p C x 2p A p B x(p (ma) x p (fb) + p (mb) x p (fa) )
178 Paternity Index Only Man and Child Tested PI = 2p A p B x 2p A p C x 0.5 (ma) x p B 2p A p B x 2p A p C x(p (ma) x p (fb) + p (mb) x p (fa) ) PI = PI = 0.5p B 2p A p B 0.25 p A
179 Paternity Index Only Man and Child Tested Parents M? A AF Child AB C The untested Mother could have passed either the A or B allele AF can only pass A allele RM has (p + q) chance of passing the A or B allele
180 Paternity Index Only Man and Child Tested A AB
181 Paternity Index Only Man and Child Tested Numerator A p A 2 p B 1 2p A p B AB Probability = p A2 x 2p A p B x 1 (fa) x p B
182 Paternity Index Only Man and Child Tested Denominator A p A 2 p A + p B p A + p B 2p A p B AB probability = p A2 x 2p A p B x(p (ma) x p (fb) + p (mb) x p (fa) )
183 Paternity Index Only Man and Child Tested PI = p A2 x 2p A p C x 1 (ma) x p B p A2 x 2p A p C x(p (ma) x p (fb) + p (mb) x p (fa) ) PI = PI = p B 2p A p B 0.5 p A
184 Paternity Index Only Man and Child Tested Parents M? AB AF Child AB C The untested Mother could have passed either the A or B allele AF can pass either A or B allele RM has (p + q) chance of passing the A or B allele
185 Paternity Index Only Man and Child Tested AB AB
186 Paternity Index Only Man and Child Tested Numerator AB 2p A p B p A + p B 0.5 A B 2p A p B AB Probability = 2p A p B x 2p A p B x (0.5 (fa) x p B (fb) x p A )
187 Paternity Index Only Man and Child Tested Denominator AB 2p A p B p A + p B p A + p B 2p A p B AB probability = 2p A p B x 2p A p B x(p (ma) x p (fb) + p (mb) x p (fa) )
188 Paternity Index Only Man and Child Tested PI = 2p A p B x 2p A p B x (0.5 (fa) x p B (fb) x p A ) 2p A p B x 2p A p B x(p (ma) x p (fb) + p (mb) x p (fa) ) PI = 0.5p B + 0.5p A 2p A p B PI = p A +p B 4p A p B
189 Paternity Index Only Man and Child Tested Parents? A M AF Child A C The untested Mother would have to pass an A allele AF can pass only the A allele RM has p chance of passing the A allele
190 Paternity Index Only Man and Child Tested A A
191 Paternity Index Only Man and Child Tested Numerator A p A 2 p A 1 p A 2 A Probability = p A2 x p A2 x 1 (fa) x p A
192 Paternity Index Only Man and Child Tested Denominator A p A 2 p A p A pa 2 A probability = p A2 x p A2 x p (ma) x p (fa)
193 Paternity Index Only Man and Child Tested PI = p A2 x p A2 x 1 (fa) x p A p A2 x p A2 x p (ma) x p (fa) PI = PI = p A p A x p A 1 p A
194 Paternity Index Only Man and Child Tested Parents? AB M AF Child A C The untested Mother would have to pass an A allele AF would have to pass the A allele RM has p chance of passing the A allele
195 Paternity Index Only Man and Child Tested AB A
196 Paternity Index Only Man and Child Tested Numerator AB 2p A p B p A 0.5 p A 2 A Probability = 2p A p B x p A2 x 0.5 (fa) x p A
197 Paternity Index Only Man and Child Tested Denominator AB 2p A p B p A p A pa 2 A probability = 2p A p B x p A2 x p (ma) x p (fa)
198 Paternity Index Only Man and Child Tested PI = 2p A p B x p A2 x 0.5 (fa) x p A 2p A p B x p A2 x p (ma) x p (fa) PI = PI = 0.5p A p A x p A 0.5 p A
199 Paternity Index Only Man and Child Tested Formulas Single locus, no null alleles, low mutation rate, codominance C AB AB AB A A AF AC AB A AC A Numerator 0.5b 0.5(a+b) b 0.5a a Denominator PI 2ab 0.25/a 2ab (a+b)/4ab 2ab 0.5/a a 2 0.5/a a 2 1/a PE [1-(a + b)] 2 [1-(a + b)] 2 [1-(a + b)] 2 (1-a) 2 (1-a) 2
200 MOTHERLESS PATERNITY CASE P C AF Allele Frequencies HUMCSF1PO = (5q q34) = HUMTPOX = (2p23-2pter) = HUMTH = (11p15.5) = HUMvWA = (12p p13.2) =
201 MOTHERLESS PATERNITY CASE P C AF PI Formula HUMCSF1PO /a (5q q34) HUMTPOX 8 8 (a+b)/4ab (2p23-2pter) HUMTH /a (11p15.5) HUMvWA /a (12p p13.2) 16
202 MOTHERLESS PATERNITY CASE P C AF PI HUMCSF1PO (5q q34) HUMTPOX (2p23-2pter) HUMTH (11p15.5) HUMvWA (12p p13.2) 16
203 MOTHERLESS PATERNITY CASE P C AF PE Formulas HUMCSF1PO [1-(a+b)] 2 (5q q34) HUMTPOX 8 8 [1-(a+b)] 2 (2p23-2pter) HUMTH [1-(a+b)] 2 (11p15.5) HUMvWA [1-(a+b)] 2 (12p p13.2) 16
204 MOTHERLESS PATERNITY CASE P C AF PE HUMCSF1PO (5q q34) HUMTPOX (2p23-2pter) HUMTH (11p15.5) HUMvWA (12p p13.2) 16
205 MOTHERLESS PATERNITY CASE P C AF Allele Frequencies D16S = (16p24 - p25) = D7S = (7q) = D13S = (13q22 - q31) D5S = (5q21 - q31) =
206 MOTHERLESS PATERNITY CASE P C AF PI Formulas D16S /a (16p24 - p25) D7S /a (7q) D13S /a (13q22 - q31) D5S /a (5q21 - q31) 13 12
207 MOTHERLESS PATERNITY CASE P C AF PI D16S (16p24 - p25) D7S (7q) D13S (13q22 - q31) D5S (5q21 - q31) 13 12
208 MOTHERLESS PATERNITY CASE P C AF PE Formulas D16S [1-(a+b)] 2 (16p24 - p25) D7S [1-(a+b)] 2 (7q) D13S (1-a) 2 (13q22 - q31) D5S [1-(a+b)] 2 (5q21 - q31) 13 12
209 MOTHERLESS PATERNITY CASE P C AF PE D16S (16p24 - p25) D7S (7q) D13S (13q22 - q31) D5S (5q21 - q31) 13 12
210 MOTHERLESS PATERNITY CASE P C AF Allele Frequencies FGA = (4q28) = D18S = (18q21.3) 20 D21S = (21q q21) 29 D3S = (3p) = D8S = (8) =
211 MOTHERLESS PATERNITY CASE P C AF PI Formulas FGA /a (4q28) D18S /a (18q21.3) 20 D21S /a (21q q21) 29 D3S /a (3p) D8S (a+b)/4ab (8) 13 13
212 MOTHERLESS PATERNITY CASE P C AF PI FGA (4q28) D18S (18q21.3) 20 D21S (21q q21) 29 D3S (3p) D8S (8) 13 13
213 MOTHERLESS PATERNITY CASE P C AF PE Formulas FGA [1-(a+b)] 2 (4q28) D18S (1-a) 2 (18q21.3) 20 D21S (1-a) 2 (21q q21) 29 D3S [1-(a+b)] 2 (3p) D8S [1-(a+b)] 2 (8) 13 13
214 MOTHERLESS PATERNITY CASE P C AF PE FGA (4q28) D18S (18q21.3) 20 D21S (21q q21) 29 D3S (3p) D8S (8) 13 13
215 Motherless Paternity 13 Core CODIS Loci Combined Paternity Index 1,676 Probability of Paternity 99.94% Probability of Exclusion 99.94%
216 PowerPlex 16 System Extremely Useful in Cases Where the Mother is Not Tested (Motherless Cases)
217 PowerPlex 16 Motherless Case P-54137
218 PowerPlex 16 Motherless Case P-54137
219 PowerPlex 16 Motherless Case P-54137
220 Motherless Case P PowerPlex 16 System 13 STR loci minus Penta D & Penta E Combined Paternity Index 1,050 Probability of Exclusion 99.98% Probability of Paternity(prior=0.5) 99.90% 15 STR loci with Penta D & Penta E Combined Paternity Index 12,340 Probability of Exclusion % Probability of Paternity(prior=0.5) %
221 Popstats Cannot Correctly Calculate Parentage Statistics in Non-Typical Cases
222 Popstats Cannot Currently Calculate Parentage Statistics For The Identification Of Human Remains Reverse Parentage Testing
223 Reverse Parentage Testing Applications Unidentified remains Victims of Mass Disasters Crime Scene Evidence Kidnapped or Abandoned Babies
224 REVERSE PARENTAGE INDEX BODY IDENTIFICATION ALLEGED EVIDENCE ALLEGED MOTHER FATHER A B B C C D
225 Reverse Parentage Testing Three genotypes: Alleged Mother Child (missing) Alleged Father
226 Reverse Parentage Analysis Missing child scenario AB CD BC
227 Reverse Parentage Index RPI = X / Y Numerator X= is the probability that (1) a woman randomly selected from a population is type AB, and (2) a man randomly selected from a population is type CD, and (3) their child is type BC.
228 Reverse Parentage Index RPI = X / Y Denominator Y = is the probability that (1) a woman randomly selected from a population and unrelated to missing child is type AB, (2) a man randomly selected from a population and unrelated to missing child is type CD, and (3) a child, randomly selected from a population is BC.
229 Reverse Parentage Analysis Missing child scenario Numerator 2p A p B AB CD 2p C p D BC Probability = 2p A p B x 2p C p D x 0.5 x 0.5
230 Reverse Parentage Analysis Missing child scenario Denominator 2p A p B AB CD 2p C p D BC 2p B p C Probability = 2p A p B x 2p C p D x2p B p C
231 Reverse Parentage Analysis Missing child scenario LR = LR = 2p A p B x 2p C p D x 0.5 x 0.5 2p A p B x 2p C p D x 2p B p C p B p C
232 Reverse Parentage Analysis Missing child scenario AB C BC
233 Reverse Parentage Analysis Missing child scenario Numerator 2 2p A p B AB C p C BC Probability = 2p A p B x p C 2 x 0.5 x 1
234 Reverse Parentage Analysis Missing child scenario Denominator 2p A p B AB C p C 2 BC 2p B p C Probability = 2p A p B x p C 2 x2p B p C
235 Reverse Parentage Analysis Missing child scenario LR = LR = p A p B x p C2 x 0.5 x 1 p A p B x p C2 x 2p B p C 0.5 2p B p C
236 Reverse Parentage Analysis Missing child scenario B C BC
237 Reverse Parentage Analysis Missing child scenario Numerator 2 p 2 B B C p C 1 1 BC Probability = p B2 x p C 2 x 1 x 1
238 Reverse Parentage Analysis Missing child scenario Denominator p B 2 B C p C 2 BC 2p B p C Probability = p B2 x p C 2 x2p B p C
239 Reverse Parentage Analysis Missing child scenario LR = LR = p B2 x p C2 x 1 x 1 p B2 x p C2 x 2p B p C 1 2p B p C
240 Having both parents to test in a reverse parentage test is indeed a luxury Often, we are limited to one parent or possibly even siblings to attempt an identification Single parent cases revert statistically to the non-maternal format we discussed earlier
241 Thank you!
AFDAA 2012 WINTER MEETING Population Statistics Refresher Course - Lecture 3: Statistics of Kinship Analysis
 AFDAA 2012 WINTER MEETING Population Statistics Refresher Course - Lecture 3: Statistics of Kinship Analysis Ranajit Chakraborty, PhD Center for Computational Genomics Institute of Applied Genetics Department
DNA: Statistical Guidelines
 Frequency calculations for STR analysis When a probative association between an evidence profile and a reference profile is made, a frequency estimate is calculated to give weight to the association. Frequency
4. Kinship Paper Challenge
 4. António Amorim (aamorim@ipatimup.pt) Nádia Pinto (npinto@ipatimup.pt) 4.1 Approach After a woman dies her child claims for a paternity test of the man who is supposed to be his father. The test is carried
DNA Parentage Test No Summary Report
 Collaborative Testing Services, Inc FORENSIC TESTING PROGRAM DNA Parentage Test No. 16-5870 Summary Report This proficiency test was sent to 27 participants. Each participant received a sample pack consisting
Primer on Human Pedigree Analysis:
 Primer on Human Pedigree Analysis: Criteria for the selection and collection of appropriate Family Reference Samples John V. Planz. Ph.D. UNT Center for Human Identification Successful Missing Person ID
DNA Parentage Test No Summary Report
 Collaborative Testing Services, Inc FORENSIC TESTING PROGRAM DNA Parentage Test No. 175871 Summary Report This proficiency test was sent to 45 participants. Each participant received a sample pack consisting
Large scale kinship:familial Searching and DVI. Seoul, ISFG workshop
 Large scale kinship:familial Searching and DVI Seoul, ISFG workshop 29 August 2017 Large scale kinship Familial Searching: search for a relative of an unidentified offender whose profile is available in
ICMP DNA REPORTS GUIDE
 ICMP DNA REPORTS GUIDE Distribution: General Sarajevo, 16 th December 2010 GUIDE TO ICMP DNA REPORTS 1. Purpose of This Document 1. The International Commission on Missing Persons (ICMP) endeavors to secure
Supporting Online Material for
 www.sciencemag.org/cgi/content/full/1122655/dc1 Supporting Online Material for Finding Criminals Through DNA of Their Relatives Frederick R. Bieber,* Charles H. Brenner, David Lazer *Author for correspondence.
Methods of Parentage Analysis in Natural Populations
 Methods of Parentage Analysis in Natural Populations Using molecular markers, estimates of genetic maternity or paternity can be achieved by excluding as parents all adults whose genotypes are incompatible
DNA Parentage Test No Summary Report
 Collaborative Testing Services, Inc FORENSIC TESTING PROGRAM DNA Parentage Test No. 165871 Summary Report This proficiency test was sent to 45 participants. Each participant received a sample pack consisting
DNA Parentage Test No Summary Report
 Collaborative Testing Services, Inc FORENSIC TESTING PROGRAM DNA Parentage Test No. 155872 Summary Report This proficiency test was sent to 38 participants. Each participant received a sample pack consisting
DNA (DeoxyriboNucleic Acid)
") Basics of DNA & Sales and Marketing Presented by: Kim Levaggi of Chromosomal Labs DNA (DeoxyriboNucleic Acid) DNA a very long molecule that is essentially the instruction manual to cells and organisms.
Basics of DNA & Sales and Marketing Presented by: Kim Levaggi of Chromosomal Labs DNA (DeoxyriboNucleic Acid) DNA a very long molecule that is essentially the instruction manual to cells and organisms.
Basics of DNA & Sales and Marketing
 Basics of DNA & Sales and Marketing Presented by: Kim Levaggi of Chromosomal Labs 1 DNA (DeoxyriboNucleic Acid) DNA a very long molecule that is essentially the instruction manual to cells and organisms.
DNA Interpretation Test No Summary Report
 Collaborative Testing Services, Inc FORENSIC TESTING PROGRAM DNA Interpretation Test No. 17-588 Summary Report This proficiency test was sent to 3 participants. Each participant received a sample pack
Lecture 1: Introduction to pedigree analysis
 Lecture 1: Introduction to pedigree analysis Magnus Dehli Vigeland NORBIS course, 8 th 12 th of January 2018, Oslo Outline Part I: Brief introductions Pedigrees symbols and terminology Some common relationships
Non-Paternity: Implications and Resolution
 Non-Paternity: Implications and Resolution Michelle Beckwith PTC Labs 2006 AABB HITA Meeting October 8, 2006 Considerations when identifying victims using relatives Identification requires knowledge of
Pedigrees How do scientists trace hereditary diseases through a family history?
 Why? Pedigrees How do scientists trace hereditary diseases through a family history? Imagine you want to learn about an inherited genetic trait present in your family. How would you find out the chances
Investigations from last time. Inbreeding and neutral evolution Genes, alleles and heterozygosity
 Investigations from last time. Heterozygous advantage: See what happens if you set initial allele frequency to or 0. What happens and why? Why are these scenario called unstable equilibria? Heterozygous
Spring 2013 Assignment Set #3 Pedigree Analysis. Set 3 Problems sorted by analytical and/or content type
 Biology 321 Spring 2013 Assignment Set #3 Pedigree Analysis You are responsible for working through on your own, the general rules of thumb for analyzing pedigree data to differentiate autosomal and sex-linked
Statistical Interpretation in Making DNA-based Identification of Mass Victims
 Statistical Interretation in Making DNAbased Identification of Mass Victims KyoungJin Shin wan Young Lee Woo Ick Yang Eunho a Det. of Forensic Medicine Yonsei University College of Medicine Det. of Information
Statistical DNA Forensics Theory, Methods and Computation
 Statistical DNA Forensics Theory, Methods and Computation Wing Kam Fung and Yue-Qing Hu Department of Statistics and Actuarial Science, The University of Hong Kong, Hong Kong Statistical DNA Forensics
1) Using the sightings data, determine who moved from one area to another and fill this data in on the data sheet.
 Using the sightings data, determine who moved from one area to another and fill this data in on the data sheet.") Parentage and Geography 5. The Life of Lulu the Lioness: A Heroine s Story Name: Objective Using genotypes from many individuals, determine maternity, paternity, and relatedness among a group of lions.
Parentage and Geography 5. The Life of Lulu the Lioness: A Heroine s Story Name: Objective Using genotypes from many individuals, determine maternity, paternity, and relatedness among a group of lions.
Genetics. 7 th Grade Mrs. Boguslaw
 Genetics 7 th Grade Mrs. Boguslaw Introduction and Background Genetics = the study of heredity During meiosis, gametes receive ½ of their parent s chromosomes During sexual reproduction, two gametes (male
Statistical DNA Forensics Theory, Methods and Computation
 Statistical DNA Forensics Theory, Methods and Computation Wing Kam Fung and Yue-Qing Hu Department of Statistics and Actuarial Science, The University of Hong Kong, Hong Kong Statistical DNA Forensics
Puzzling Pedigrees. Essential Question: How can pedigrees be used to study the inheritance of human traits?
 Name: Puzzling Pedigrees Essential Question: How can pedigrees be used to study the inheritance of human traits? Studying inheritance in humans is more difficult than studying inheritance in fruit flies
Interpretation errors in DNA profiling
 Interpretation errors in DNA profiling Dan E. Krane, Wright State University, Dayton, OH Forensic Bioinformatics (www.bioforensics.com) A controversial idea: Analysts should arrive at conclusions about
Developing Conclusions About Different Modes of Inheritance
 Pedigree Analysis Introduction A pedigree is a diagram of family relationships that uses symbols to represent people and lines to represent genetic relationships. These diagrams make it easier to visualize
1.4.1(Question should be rather: Another sibling of these two brothers) 25% % % (population risk of heterozygot*2/3*1/4)
 25% % % (population risk of heterozygot*2/3*1/4)") ----------------------------------------------------------Chapter 1--------------------------------------------------------------- (each task of this chapter is dedicated as x (x meaning the exact task.
----------------------------------------------------------Chapter 1--------------------------------------------------------------- (each task of this chapter is dedicated as x (x meaning the exact task.
Two-point linkage analysis using the LINKAGE/FASTLINK programs
 1 Two-point linkage analysis using the LINKAGE/FASTLINK programs Copyrighted 2018 Maria Chahrour and Suzanne M. Leal These exercises will introduce the LINKAGE file format which is the standard format
Using Pedigrees to interpret Mode of Inheritance
 Using Pedigrees to interpret Mode of Inheritance Objectives Use a pedigree to interpret the mode of inheritance the given trait is with 90% accuracy. 11.2 Pedigrees (It s in your genes) Pedigree Charts
Lecture 6: Inbreeding. September 10, 2012
 Lecture 6: Inbreeding September 0, 202 Announcements Hari s New Office Hours Tues 5-6 pm Wed 3-4 pm Fri 2-3 pm In computer lab 3306 LSB Last Time More Hardy-Weinberg Calculations Merle Patterning in Dogs:
KINSHIP ANALYSIS AND HUMAN IDENTIFICATION IN MASS DISASTERS: THE USE OF MDKAP FOR THE WORLD TRADE CENTER TRAGEDY
 1 KINSHIP ANALYSIS AND HUMAN IDENTIFICATION IN MASS DISASTERS: THE USE OF MDKAP FOR THE WORLD TRADE CENTER TRAGEDY Benoît Leclair 1, Steve Niezgoda 2, George R. Carmody 3 and Robert C. Shaler 4 1 Myriad
Chapter 2: Genes in Pedigrees
 Chapter 2: Genes in Pedigrees Chapter 2-0 2.1 Pedigree definitions and terminology 2-1 2.2 Gene identity by descent (ibd) 2-5 2.3 ibd of more than 2 genes 2-14 2.4 Data on relatives 2-21 2.1.1 GRAPHICAL
Free Online Training
 Using DNA and CODIS to Resolve Missing and Unidentified Person Cases B.J. Spamer NamUs Training and Analysis Division Office: 817-735-5473 Cell: 817-964-1879 Email: BJ.Spamer@unthsc.edu Free Online Training
Inbreeding and self-fertilization
 Inbreeding and self-fertilization Introduction Remember that long list of assumptions associated with derivation of the Hardy-Weinberg principle that we just finished? Well, we re about to begin violating
Automated Discovery of Pedigrees and Their Structures in Collections of STR DNA Specimens Using a Link Discovery Tool
 University of Tennessee, Knoxville Trace: Tennessee Research and Creative Exchange Masters Theses Graduate School 5-2010 Automated Discovery of Pedigrees and Their Structures in Collections of STR DNA
Inbreeding and self-fertilization
 Inbreeding and self-fertilization Introduction Remember that long list of assumptions associated with derivation of the Hardy-Weinberg principle that I went over a couple of lectures ago? Well, we re about
NON-RANDOM MATING AND INBREEDING
 Instructor: Dr. Martha B. Reiskind AEC 495/AEC592: Conservation Genetics DEFINITIONS Nonrandom mating: Mating individuals are more closely related or less closely related than those drawn by chance from
Kinship and Population Subdivision
 Kinship and Population Subdivision Henry Harpending University of Utah The coefficient of kinship between two diploid organisms describes their overall genetic similarity to each other relative to some
Need a little help with the lab?
 Need a little help with the lab? Alleles are corresponding pairs of genes located on an individual s chromosomes. Together, alleles determine the genotype of an individual. The Genotype describes the specific
1/8/2013. Free Online Training. Using DNA and CODIS to Resolve Missing and Unidentified Person Cases. Click Online Training
 Free Online Training Using DNA and CODIS to Resolve Missing and Unidentified Person Cases B.J. Spamer NamUs Training and Analysis Division Office: 817-735-5473 Cell: 817-964-1879 Email: BJ.Spamer@unthsc.edu
Biology Partnership (A Teacher Quality Grant) Lesson Plan Construction Form
 Lesson Plan Construction Form") Biology Partnership (A Teacher Quality Grant) Lesson Plan Construction Form Identifying Information: (Group Members and Schools, Title of Lesson, Length in Minutes, Course Level) Teachers in Study Group
Biology Partnership (A Teacher Quality Grant) Lesson Plan Construction Form Identifying Information: (Group Members and Schools, Title of Lesson, Length in Minutes, Course Level) Teachers in Study Group
CONGEN. Inbreeding vocabulary
 CONGEN Inbreeding vocabulary Inbreeding Mating between relatives. Inbreeding depression Reduction in fitness due to inbreeding. Identical by descent Alleles that are identical by descent are direct descendents
Manual for Familias 3
 Manual for Familias 3 Daniel Kling 1 (daniellkling@gmailcom) Petter F Mostad 2 (mostad@chalmersse) ThoreEgeland 1,3 (thoreegeland@nmbuno) 1 Oslo University Hospital Department of Forensic Services Oslo,
Chromosome X haplotyping in deficiency paternity testing principles and case report
 International Congress Series 1239 (2003) 815 820 Chromosome X haplotyping in deficiency paternity testing principles and case report R. Szibor a, *, I. Plate a, J. Edelmann b, S. Hering c, E. Kuhlisch
Probability - Introduction Chapter 3, part 1
 Probability - Introduction Chapter 3, part 1 Mary Lindstrom (Adapted from notes provided by Professor Bret Larget) January 27, 2004 Statistics 371 Last modified: Jan 28, 2004 Why Learn Probability? Some
Coalescence. Outline History. History, Model, and Application. Coalescence. The Model. Application
 Coalescence History, Model, and Application Outline History Origins of theory/approach Trace the incorporation of other s ideas Coalescence Definition and descriptions The Model Assumptions and Uses Application
The X-linked Blood Group System Xg
 J. med. Genet. (I966). 3, I62. The X-linked Blood Group System Xg Tests on British, Northern American, and Northern Eur.opean Unrelated People and Families JEAN NOADES, JUNE GAVIN, PATRICIA TIPPETT, RUTH
DAR POLICY STATEMENT AND BACKGROUND Using DNA Evidence for DAR Applications
 Effective January 1, 2014, DAR will begin accepting Y-DNA evidence in support of new member applications and supplemental applications as one element in a structured analysis. This analysis will use a
Algorithms for Genetics: Basics of Wright Fisher Model and Coalescent Theory
 Algorithms for Genetics: Basics of Wright Fisher Model and Coalescent Theory Vineet Bafna Harish Nagarajan and Nitin Udpa 1 Disclaimer Please note that a lot of the text and figures here are copied from
Contributed by "Kathy Hallett"
 National Geographic: The Genographic Project Name Background The National Geographic Society is undertaking the ambitious process of tracking human migration using genetic technology. By using the latest
Objective: Why? 4/6/2014. Outlines:
 Objective: Develop mathematical models that quantify/model resemblance between relatives for phenotypes of a quantitative trait : - based on pedigree - based on markers Outlines: Causal model for covariances
Population Genetics using Trees. Peter Beerli Genome Sciences University of Washington Seattle WA
 Population Genetics using Trees Peter Beerli Genome Sciences University of Washington Seattle WA Outline 1. Introduction to the basic coalescent Population models The coalescent Likelihood estimation of
Statistical methods in genetic relatedness and pedigree analysis
 Statistical methods in genetic relatedness and pedigree analysis Oslo, January 2018 Magnus Dehli Vigeland and Thore Egeland Exercise set III: Coecients of pairwise relatedness Exercise III-1. Use Wright's
Revising how the computer program
 Molecular Ecology (2007) 6, 099 06 doi: 0./j.365-294X.2007.03089.x Revising how the computer program Blackwell Publishing Ltd CERVUS accommodates genotyping error increases success in paternity assignment
How to Solve Linkage Map Problems
 Page 1 of 6 Examples to Accompany How to Solve Linkage Map Problems Note that these examples are invented. Real numbers would be much messier than these. Determining Linkage/Independence Suppose you want
Chapter 5 - Elementary Probability Theory
 Chapter 5 - Elementary Probability Theory Historical Background Much of the early work in probability concerned games and gambling. One of the first to apply probability to matters other than gambling
Pedigree Reconstruction using Identity by Descent
 Pedigree Reconstruction using Identity by Descent Bonnie Kirkpatrick Electrical Engineering and Computer Sciences University of California at Berkeley Technical Report No. UCB/EECS-2010-43 http://www.eecs.berkeley.edu/pubs/techrpts/2010/eecs-2010-43.html
COMMUNITY UNIT SCHOOL DISTRICT 200 Science Curriculum Philosophy
 COMMUNITY UNIT SCHOOL DISTRICT 200 Science Curriculum Philosophy Science instruction focuses on the development of inquiry, process and application skills across the grade levels. As the grade levels increase,
Enhanced Kinship Analysis and STR-based DNA Typing for Human Identification in Mass Fatality Incidents: The Swissair Flight 111 Disaster
 JForensicSci,Sept. 2004, Vol. 49, No. 5 Paper ID JFS2003311 Available online at: www.astm.org Benoît Leclair, 1,2 Ph.D.; Chantal J. Frégeau, 1 Ph.D.; Kathy L. Bowen, 1 B.Sc.; and Ron M. Fourney, 1 Ph.D.
BIOL 502 Population Genetics Spring 2017
 BIOL 502 Population Genetics Spring 2017 Week 8 Inbreeding Arun Sethuraman California State University San Marcos Table of contents 1. Inbreeding Coefficient 2. Mating Systems 3. Consanguinity and Inbreeding
Population Genetics 3: Inbreeding
 Population Genetics 3: nbreeding nbreeding: the preferential mating of closely related individuals Consider a finite population of diploids: What size is needed for every individual to have a separate
The Pedigree. NOTE: there are no definite conclusions that can be made from a pedigree. However, there are more likely and less likely explanations
 The Pedigree A tool (diagram) used to trace traits in a family The diagram shows the history of a trait between generations Designed to show inherited phenotypes Using logic we can deduce the inherited
Gene coancestry in pedigrees and populations
 Gene coancestry in pedigrees and populations Thompson, Elizabeth University of Washington, Department of Statistics Box 354322 Seattle, WA 98115-4322, USA E-mail: eathomp@uw.edu Glazner, Chris University
Genealogical trees, coalescent theory, and the analysis of genetic polymorphisms
 Genealogical trees, coalescent theory, and the analysis of genetic polymorphisms Magnus Nordborg University of Southern California The importance of history Genetic polymorphism data represent the outcome
Populations. Arindam RoyChoudhury. Department of Biostatistics, Columbia University, New York NY 10032, U.S.A.,
 Change in Recessive Lethal Alleles Frequency in Inbred Populations arxiv:1304.2955v1 [q-bio.pe] 10 Apr 2013 Arindam RoyChoudhury Department of Biostatistics, Columbia University, New York NY 10032, U.S.A.,
Find the probability that the letter to A is in the correct envelope, the letter to B is in an incorrect envelope.
 A man writes 5 letters, one each to A, B, C, D and E. Each letter is placed in a separate envelope and sealed. He then addresses the envelopes, at random, one each to A, B, C, D and E. (i) (ii) (iii) Find
Mix & match: Getting comfortable with DNA reporting. Elmira, New York. Cybergenetics People of New York v Casey Wilson
 Mix & match: Getting comfortable with DNA reporting What s in a Match? How to read a forensic DNA report Duquesne University October, 2015 Pittsburgh, PA Mark W Perlin, PhD, MD, PhD Cybergenetics, Pittsburgh,
and g2. The second genotype, however, has a doubled opportunity of transmitting the gene X to any
 Brit. J. prev. soc. Med. (1958), 12, 183-187 GENOTYPIC FREQUENCIES AMONG CLOSE RELATIVES OF PROPOSITI WITH CONDITIONS DETERMINED BY X-RECESSIVE GENES BY GEORGE KNOX* From the Department of Social Medicine,
DNA Basics, Y DNA Marker Tables, Ancestral Trees and Mutation Graphs: Definitions, Concepts, Understanding
 DNA Basics, Y DNA Marker Tables, Ancestral Trees and Mutation Graphs: Definitions, Concepts, Understanding by Dr. Ing. Robert L. Baber 2014 July 26 Rights reserved, see the copyright notice at http://gengen.rlbaber.de
TRACK 1: BEGINNING DNA RESEARCH presented by Andy Hochreiter
 TRACK 1: BEGINNING DNA RESEARCH presented by Andy Hochreiter 1-1: DNA: WHERE DO I START? Definition Genetic genealogy is the application of genetics to traditional genealogy. Genetic genealogy uses genealogical
BIOL Evolution. Lecture 8
 BIOL 432 - Evolution Lecture 8 Expected Genotype Frequencies in the Absence of Evolution are Determined by the Hardy-Weinberg Equation. Assumptions: 1) No mutation 2) Random mating 3) Infinite population
DNA Testing. February 16, 2018
 DNA Testing February 16, 2018 What Is DNA? Double helix ladder structure where the rungs are molecules called nucleotides or bases. DNA contains only four of these nucleotides A, G, C, T The sequence that
Some of these slides have been borrowed from Dr. Paul Lewis, Dr. Joe Felsenstein. Thanks!
 Some of these slides have been borrowed from Dr. Paul Lewis, Dr. Joe Felsenstein. Thanks! Paul has many great tools for teaching phylogenetics at his web site: http://hydrodictyon.eeb.uconn.edu/people/plewis
50/50. Accreditations 4/13/2016 A B A B A B. Mother. Father. Child. Everything you ever wanted to know about DNA collections and MORE!
 Everything you ever wanted to know about DNA collections and MORE! Presented by: Kim Levaggi Accreditations 1 50/50 Half of your DNA comes from your mother Half of your DNA comes from your father Mother
4/13/2016. Everything you ever wanted to know about DNA collections and MORE! Presented by: Kim Levaggi
 Everything you ever wanted to know about DNA collections and MORE! Presented by: Kim Levaggi 1 Accreditations 1 2 50/50 Half of your DNA comes from your mother Half of your DNA comes from your father Mother
Inbreeding depression in corn. Inbreeding. Inbreeding depression in humans. Genotype frequencies without random mating. Example.
 nbreeding depression in corn nbreeding Alan R Rogers Two plants on left are from inbred homozygous strains Next: the F offspring of these strains Then offspring (F2 ) of two F s Then F3 And so on November
Decrease of Heterozygosity Under Inbreeding
 INBREEDING When matings take place between relatives, the pattern is referred to as inbreeding. There are three common areas where inbreeding is observed mating between relatives small populations hermaphroditic
On identification problems requiring linked autosomal markers
 * Title Page (with authors & addresses) On identification problems requiring linked autosomal markers Thore Egeland a Nuala Sheehan b a Department of Medical Genetics, Ulleval University Hospital, 0407
Detection of Misspecified Relationships in Inbred and Outbred Pedigrees
 Detection of Misspecified Relationships in Inbred and Outbred Pedigrees Lei Sun 1, Mark Abney 1,2, Mary Sara McPeek 1,2 1 Department of Statistics, 2 Department of Human Genetics, University of Chicago,
CM I. The risk of false inclusion of a relative in parentage testing - an in shico population study
 FÜRENSiC SCiENCE CM I 257 Croat Med J.2013i54:25?-e2 doi: 10.3325/cmj.2013.54.2S? The risk of false inclusion of a relative in parentage testing - an in shico population study Aim To investigate the potential
An Optimal Algorithm for Automatic Genotype Elimination
 Am. J. Hum. Genet. 65:1733 1740, 1999 An Optimal Algorithm for Automatic Genotype Elimination Jeffrey R. O Connell 1,2 and Daniel E. Weeks 1 1 Department of Human Genetics, University of Pittsburgh, Pittsburgh,
Kenneth Nordtvedt. Many genetic genealogists eventually employ a time-tomost-recent-common-ancestor
 Kenneth Nordtvedt Many genetic genealogists eventually employ a time-tomost-recent-common-ancestor (TMRCA) tool to estimate how far back in time the common ancestor existed for two Y-STR haplotypes obtained
DNA PATERNITY TESTING YOUR QUESTIONS ANSWERED. Need some advice on testing? Call us free on:
 DNA PATERNITY TESTING YOUR QUESTIONS ANSWERED Need some advice on testing? Call us free on: 0800 036 2522 Introduction Since 1987 Cellmark has conducted over half a million DNA relationship tests and is
Bayesian parentage analysis with systematic accountability of genotyping error, missing data, and false matching
 Genetics and population analysis Bayesian parentage analysis with systematic accountability of genotyping error, missing data, and false matching Mark R. Christie 1,*, Jacob A. Tennessen 1 and Michael
Appendix III - Analysis of Non-Paternal Events
 Appendix III - Analysis of Non-Paternal Events Summary One of the challenges that genetic genealogy researchers face when carrying out Y-DNA testing on groups of men within a family surname study is to
Bias and Power in the Estimation of a Maternal Family Variance Component in the Presence of Incomplete and Incorrect Pedigree Information
 J. Dairy Sci. 84:944 950 American Dairy Science Association, 2001. Bias and Power in the Estimation of a Maternal Family Variance Component in the Presence of Incomplete and Incorrect Pedigree Information
Pizza and Who do you think you are?
 Pizza and Who do you think you are? an overview of one of the newest and possibly more helpful developments in researching genealogy and family history that of using DNA for research What is DNA? Part
SNP variant discovery in pedigrees using Bayesian networks. Amit R. Indap
 SNP variant discovery in pedigrees using Bayesian networks Amit R. Indap 1 1 Background Next generation sequencing technologies have reduced the cost and increased the throughput of DNA sequencing experiments
University of Washington, TOPMed DCC July 2018
 Module 12: Comput l Pipeline for WGS Relatedness Inference from Genetic Data Timothy Thornton (tathornt@uw.edu) & Stephanie Gogarten (sdmorris@uw.edu) University of Washington, TOPMed DCC July 2018 1 /
TDT vignette Use of snpstats in family based studies
 TDT vignette Use of snpstats in family based studies David Clayton April 30, 2018 Pedigree data The snpstats package contains some tools for analysis of family-based studies. These assume that a subject
DNA Parentage Test No Summary Report
 Collaborative Testing Services, Inc FORENSIC TESTING PROGRAM DNA Parentage Test No. 175872 Summary Report This proficiency test was sent to 42 participants. Each participant received a sample pack consisting
Pedigree Charts. The family tree of genetics
 Pedigree Charts The family tree of genetics Pedigree Charts I II III What is a Pedigree? A pedigree is a chart of the genetic history of family over several generations. Scientists or a genetic counselor
Kinship/relatedness. David Balding Professor of Statistical Genetics University of Melbourne, and University College London.
 Kinship/relatedness David Balding Professor of Statistical Genetics University of Melbourne, and University College London 2 Feb 2016 1 Ways to measure relatedness 2 Pedigree-based kinship coefficients
Development Team. Importance and Implications of Pedigree and Genealogy. Anthropology. Principal Investigator. Paper Coordinator.
 Paper No. : 13 Research Methods and Fieldwork Module : 10 Development Team Principal Investigator Prof. Anup Kumar Kapoor Department of, University of Delhi Paper Coordinator Dr. P. Venkatramana Faculty
Determining Relatedness from a Pedigree Diagram
 Kin structure & relatedness Francis L. W. Ratnieks Aims & Objectives Aims 1. To show how to determine regression relatedness among individuals using a pedigree diagram. Social Insects: C1139 2. To show
Test 4 Sample Questions
 Test 4 Sample Questions Solve the problem by applying the Fundamental Counting Principle with two groups of items. 1) An apartment complex offers apartments with four different options, designated by A
DNA Basics. OLLI: Genealogy 101 October 1, ~ Monique E. Rivera ~
 DNA Basics OLLI: Genealogy 101 October 1, 2018 ~ Monique E. Rivera ~ WHAT IS DNA? DNA (deoxyribonucleic acid) is found in every living cell everywhere. It is a long chemical chain that tells our cells
U among relatives in inbred populations for the special case of no dominance or
 PARENT-OFFSPRING AND FULL SIB CORRELATIONS UNDER A PARENT-OFFSPRING MATING SYSTEM THEODORE W. HORNER Statistical Laboratory, Iowa State College, Ames, Iowa Received February 25, 1956 SING the method of