BIOL Evolution. Lecture 8
|
|
|
- Charleen Wilson
- 5 years ago
- Views:
Transcription
1 BIOL Evolution Lecture 8
2 Expected Genotype Frequencies in the Absence of Evolution are Determined by the Hardy-Weinberg Equation. Assumptions: 1) No mutation 2) Random mating 3) Infinite population size 4) No immigration or emigration 5) No selection
3 Random genetic drift Evolution = change of allele frequency within a population Randomness cannot lead to adaptation Can nevertheless be a powerful evolutionary force Main mode by which noncoding sequence evolves?
4 Populations Population: Individuals of the same species in a particular area. (Geneticists further often assume that mating is random and panmictic) 0
5 Populations have a history
6 Pedigrees A Pedigree showing the ancestors of one individual in generation 1
7 Genealogy A Ancestry of a an allele carried by individual A
8 Genealogy A This allele shares its ancestry with other alleles
9 Demographic and genetic processes are intimately inked on the population level Red and blue dots represent two different alleles Average number of offspring is 2.2 Overall population growth
10 The simplest model: A haploid asexual population of constant size E.g. an idealized population of bacteria = single neutral mutation
11 Assumptions: Mutation is neutral (has no selective advantage or disadvantage) Population size is constant Two possibilities: fission (I.e. reproduction) or death -1 0 X X or 1:1-1 0 X X
12 Eventually every lineage will go extinct
13 Population with n=100 genes (copies) Fate of different alleles Only very few lineages are long lived
14 Why is this probability independent of population size? -1 0 X X or 1:1-1 0 X X


15 Then why does drift have a greater effect in small populations? 18 gene copies 100 gene copies


16 Example: cape buffalo in game reserves of different size Microsatellite study by Heller et al. 2010

17 Example: cape buffalo in game reserves of different size Reserves ranged in size from 100 to 28,000 km 2 Allelic richness = mean number of alleles across multiple microsatellite loci
18 In diploid organisms meiosis adds randomness
19 The Wright-Fisher Model P Q Q Q N=2 Frequency P = p = #P/2N =0.25 Frequency Q = q = #Q/2N = 0.75 Assumption: Population size is constant Assumption: Each individual produces a large number of gametes Assumption: Gametes are produced in proportion to parental allele frequencies Assumption: Mating of alleles is random Assumption: Generation are discrete
20 The Wright-Fisher Model 0.32 = 0.75 x 0.75 x 0.75 x 0.75=0.32 Which of the following outcomes is more likely?
21 The Wright-Fisher Model = 0.75 x 0.75 x 0.75 x 0.25=0.105 = 0.75 x 0.75 x 0.75 x 0.25= = 0.75 x 0.75 x 0.75 x 0.25=0.105 = 0.75 x 0.75 x 0.75 x 0.25=0.105 =0.422
22 The Wright-Fisher Model = 0.75 x 0.75 x 0.25 x 0.25= x 6 =
23 The Wright-Fisher Model = 0.75 x 0.25 x 0.25 x 0.25= x 4 = 0.047
24 The Wright-Fisher Model = 0.25 x 0.25 x 0.25 x 0.25=
 See table 28.1 (online on textbook site)")
25 The outcome of the Wright- Fisher model is described by the binomial distribution 2N = n Mean: 2Np Variance: 2Npq i = outcome with probability p (e.g. drawing a P allele for the next generation) See table 28.1 (online on textbook site)
26 The Wright-Fisher model Mean=2Np =2*2*0.25 =1 1/4=0.25 Mean allele frequency is expected to stay the same The probability for each of the 5 outcomes follows the binomial distribution
/2n =(0.25*0.75)/(2*2) =0.")
27 The Wright-Fisher model Variance=2Npq =2*2*0.25*0.75 =0.75 Variance for allele frequency: (p*q)/2n =(0.25*0.75)/(2*2) =0.047 The probability for each of the 5 outcomes follows the binomial distribution
28 Under the Wright-Fisher model the two alleles behave like competing clones
29 The Wright-Fisher Model Theoretical expectation for allele frequency if drift continues for several generations

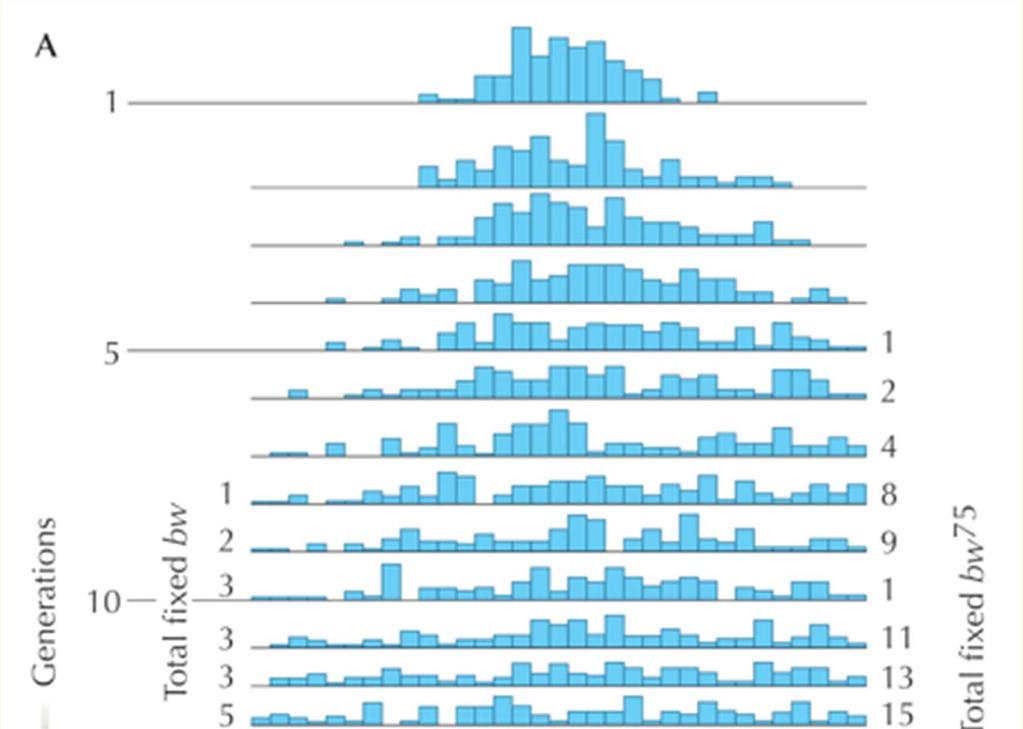
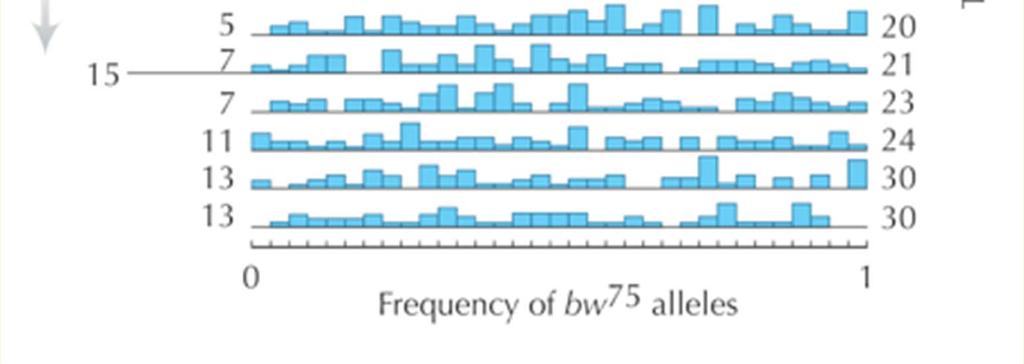
30 An experimental study of genetic drift in Drosophila Generation 0: Frequency brown mutation = p = males x 8 females N = 100 populations t = 19 generations
31
32
33 Observed variance of allele frequency in Drosophila experiment does not fit the expected variance Population size 11.5 Population size 16 In previous generation But it fits for a smaller than the census population size, the effective population size
34 Effective Population size The size of the ideal Fisher-Wright population that would give the same rate of random drift as the actual population (I.e. if the census population size and the effective population size do not match the population deviates from the Wright-Fisher model)
35 Population Size (N) vs. Effective Population Size (N e ) N e is what determines the strength of genetic drift Factors that cause N e to be less than N overlap of generations variation among indivs in reproductive success

36
37 Population Size (N) vs. Effective Population Size (N e ) Factors that cause N e to be less than N overlap of generations variation among indivs in reproductive success unequal sex ratio
38
39 Population Size (N) vs. Effective Population Size (N e ) Factors that cause N e to be less than N overlap of generations variation among indivs in reproductive success unequal sex ratio fluctuations in population size
40 Average N: 725 N e : 404

41 Population bottlenecks reduce variation and enhance genetic drift

42 (approx indivs in 1850s)
43 mtdna variation in Whooping Cranes Haplotype Pre-bottleneck Post-bottleneck * *Present immediately after the bottleneck (1951), but not today. Glenn et al. (1999) Conservation Biology 13:

44 Effective population size of humans Tenesa et al., Genome Res : Northern and Western Europe Yoruba, Nigeria
45 How can we know about past effective population size?
46 What is the chance that two random alleles share an ancestor in the previous generation? 1/2N Chances for coalescent event get smaller with fewer lineages sorting
47 Branches get longer with fewer remaining lineages, even though N stays the same Expected times for coalescent events with 6 to 2 lineages remaining E(T2)=2N/1 E(T3)=2N/3 E(T4)=2N/6 E(T5)=2N/10 E(T6)=2N/15
48 We can make predictions about the average and variance of coalescent times - but not about specific genealogies Some potential outcomes of evolution in a Wright-Fisher population
49 (Typical) constant population size genealogy Null model for genealogies with no other forces than drift at constant size
50 Wright-Fisher Genealogy Null model for our expectations about the age of common ancestors
51 Genealogy of a bottleneck The most recent common ancestor of a random set of alleles is younger than it would be without a bottleneck
52 Bottleneck genealogy Alleles trace back to a few ancestors in the recent past bottleneck
53 The distribution of mutations in alleles can be used to estimate past population size Many old mutations are shared, but young mutations occur only in certain alleles
Population Genetics using Trees. Peter Beerli Genome Sciences University of Washington Seattle WA
 Population Genetics using Trees Peter Beerli Genome Sciences University of Washington Seattle WA Outline 1. Introduction to the basic coalescent Population models The coalescent Likelihood estimation of
Algorithms for Genetics: Basics of Wright Fisher Model and Coalescent Theory
 Algorithms for Genetics: Basics of Wright Fisher Model and Coalescent Theory Vineet Bafna Harish Nagarajan and Nitin Udpa 1 Disclaimer Please note that a lot of the text and figures here are copied from
Genealogical trees, coalescent theory, and the analysis of genetic polymorphisms
 Genealogical trees, coalescent theory, and the analysis of genetic polymorphisms Magnus Nordborg University of Southern California The importance of history Genetic polymorphism data represent the outcome
Coalescence. Outline History. History, Model, and Application. Coalescence. The Model. Application
 Coalescence History, Model, and Application Outline History Origins of theory/approach Trace the incorporation of other s ideas Coalescence Definition and descriptions The Model Assumptions and Uses Application
Forward thinking: the predictive approach
 Coalescent Theory 1 Forward thinking: the predictive approach Random variation in reproduction causes random fluctuation in allele frequencies. Can describe this process as diffusion: (Wright 1931) showed
2 The Wright-Fisher model and the neutral theory
 0 THE WRIGHT-FISHER MODEL AND THE NEUTRAL THEORY The Wright-Fisher model and the neutral theory Although the main interest of population genetics is conceivably in natural selection, we will first assume
Comparative method, coalescents, and the future
 Comparative method, coalescents, and the future Joe Felsenstein Depts. of Genome Sciences and of Biology, University of Washington Comparative method, coalescents, and the future p.1/36 Correlation of
Coalescents. Joe Felsenstein. GENOME 453, Winter Coalescents p.1/39
 Coalescents Joe Felsenstein GENOME 453, Winter 2007 Coalescents p.1/39 Cann, Stoneking, and Wilson Becky Cann Mark Stoneking the late Allan Wilson Cann, R. L., M. Stoneking, and A. C. Wilson. 1987. Mitochondrial
Coalescents. Joe Felsenstein. GENOME 453, Autumn Coalescents p.1/48
 Coalescents p.1/48 Coalescents Joe Felsenstein GENOME 453, Autumn 2015 Coalescents p.2/48 Cann, Stoneking, and Wilson Becky Cann Mark Stoneking the late Allan Wilson Cann, R. L., M. Stoneking, and A. C.
Population Structure and Genealogies
 Population Structure and Genealogies One of the key properties of Kingman s coalescent is that each pair of lineages is equally likely to coalesce whenever a coalescent event occurs. This condition is
Comparative method, coalescents, and the future. Correlation of states in a discrete-state model
 Comparative method, coalescents, and the future Joe Felsenstein Depts. of Genome Sciences and of Biology, University of Washington Comparative method, coalescents, and the future p.1/28 Correlation of
Viral epidemiology and the Coalescent
 Viral epidemiology and the Coalescent Philippe Lemey and Marc A. Suchard Department of Microbiology and Immunology K.U. Leuven, and Departments of Biomathematics and Human Genetics David Geffen School
The Two Phases of the Coalescent and Fixation Processes
 The Two Phases of the Coalescent and Fixation Processes Introduction The coalescent process which traces back the current population to a common ancestor and the fixation process which follows an individual
The Coalescent Model. Florian Weber
 The Coalescent Model Florian Weber 23. 7. 2016 The Coalescent Model coalescent = zusammenwachsend Outline Population Genetics and the Wright-Fisher-model The Coalescent on-constant population-sizes Further
The genealogical history of a population The coalescent process. Identity by descent Distribution of pairwise coalescence times
 The coalescent The genealogical history of a population The coalescent process Identity by descent Distribution of pairwise coalescence times Adding mutations Expected pairwise differences Evolutionary
Decrease of Heterozygosity Under Inbreeding
 INBREEDING When matings take place between relatives, the pattern is referred to as inbreeding. There are three common areas where inbreeding is observed mating between relatives small populations hermaphroditic
Lecture 6: Inbreeding. September 10, 2012
 Lecture 6: Inbreeding September 0, 202 Announcements Hari s New Office Hours Tues 5-6 pm Wed 3-4 pm Fri 2-3 pm In computer lab 3306 LSB Last Time More Hardy-Weinberg Calculations Merle Patterning in Dogs:
Population Genetics. Joe Felsenstein. GENOME 453, Autumn Population Genetics p.1/70
 Population Genetics Joe Felsenstein GENOME 453, Autumn 2013 Population Genetics p.1/70 Godfrey Harold Hardy (1877-1947) Wilhelm Weinberg (1862-1937) Population Genetics p.2/70 A Hardy-Weinberg calculation
Population Genetics. Joe Felsenstein. GENOME 453, Autumn Population Genetics p.1/74
 Population Genetics Joe Felsenstein GENOME 453, Autumn 2011 Population Genetics p.1/74 Godfrey Harold Hardy (1877-1947) Wilhelm Weinberg (1862-1937) Population Genetics p.2/74 A Hardy-Weinberg calculation
Some of these slides have been borrowed from Dr. Paul Lewis, Dr. Joe Felsenstein. Thanks!
 Some of these slides have been borrowed from Dr. Paul Lewis, Dr. Joe Felsenstein. Thanks! Paul has many great tools for teaching phylogenetics at his web site: http://hydrodictyon.eeb.uconn.edu/people/plewis
Exercise 4 Exploring Population Change without Selection
 Exercise 4 Exploring Population Change without Selection This experiment began with nine Avidian ancestors of identical fitness; the mutation rate is zero percent. Since descendants can never differ in
Inbreeding and self-fertilization
 Inbreeding and self-fertilization Introduction Remember that long list of assumptions associated with derivation of the Hardy-Weinberg principle that I went over a couple of lectures ago? Well, we re about
MODERN population genetics is data driven and
 Copyright Ó 2009 by the Genetics Society of America DOI: 10.1534/genetics.108.092460 Note Extensions of the Coalescent Effective Population Size John Wakeley 1 and Ori Sargsyan Department of Organismic
Inbreeding and self-fertilization
 Inbreeding and self-fertilization Introduction Remember that long list of assumptions associated with derivation of the Hardy-Weinberg principle that we just finished? Well, we re about to begin violating
Analysis of geographically structured populations: Estimators based on coalescence
 Analysis of geographically structured populations: Estimators based on coalescence Peter Beerli Department of Genetics, Box 357360, University of Washington, Seattle WA 9895-7360, Email: beerli@genetics.washington.edu
The Coalescent. Chapter Population Genetic Models
 Chapter 3 The Coalescent To coalesce means to grow together, to join, or to fuse. When two copies of a gene are descended from a common ancestor which gave rise to them in some past generation, looking
Population Genetics 3: Inbreeding
 Population Genetics 3: nbreeding nbreeding: the preferential mating of closely related individuals Consider a finite population of diploids: What size is needed for every individual to have a separate
STAT 536: The Coalescent
 STAT 536: The Coalescent Karin S. Dorman Department of Statistics Iowa State University November 7, 2006 Wright-Fisher Model Our old friend the Wright-Fisher model envisions populations moving forward
Investigations from last time. Inbreeding and neutral evolution Genes, alleles and heterozygosity
 Investigations from last time. Heterozygous advantage: See what happens if you set initial allele frequency to or 0. What happens and why? Why are these scenario called unstable equilibria? Heterozygous
CONGEN. Inbreeding vocabulary
 CONGEN Inbreeding vocabulary Inbreeding Mating between relatives. Inbreeding depression Reduction in fitness due to inbreeding. Identical by descent Alleles that are identical by descent are direct descendents
Lecture 1: Introduction to pedigree analysis
 Lecture 1: Introduction to pedigree analysis Magnus Dehli Vigeland NORBIS course, 8 th 12 th of January 2018, Oslo Outline Part I: Brief introductions Pedigrees symbols and terminology Some common relationships
Methods of Parentage Analysis in Natural Populations
 Methods of Parentage Analysis in Natural Populations Using molecular markers, estimates of genetic maternity or paternity can be achieved by excluding as parents all adults whose genotypes are incompatible
Kinship and Population Subdivision
 Kinship and Population Subdivision Henry Harpending University of Utah The coefficient of kinship between two diploid organisms describes their overall genetic similarity to each other relative to some
DISCUSSION: RECENT COMMON ANCESTORS OF ALL PRESENT-DAY INDIVIDUALS
 Adv. Appl. Prob. 31, 1027 1035 (1999) Printed in Northern Ireland Applied Probability Trust 1999 DISCUSSION: RECENT COMMON ANCESTORS OF ALL PRESENT-DAY INDIVIDUALS It is a pleasure to be able to comment
Optimum contribution selection conserves genetic diversity better than random selection in small populations with overlapping generations
 Optimum contribution selection conserves genetic diversity better than random selection in small populations with overlapping generations K. Stachowicz 12*, A. C. Sørensen 23 and P. Berg 3 1 Department
Bioinformatics I, WS 14/15, D. Huson, December 15,
 Bioinformatics I, WS 4/5, D. Huson, December 5, 204 07 7 Introduction to Population Genetics This chapter is closely based on a tutorial given by Stephan Schiffels (currently Sanger Institute) at the Australian
Population genetics: Coalescence theory II
 Population genetics: Coalescence theory II Peter Beerli August 27, 2009 1 The variance of the coalescence process The coalescent is an accumulation of waiting times. We can think of it as standard queuing
Coalescent Theory: An Introduction for Phylogenetics
 Coalescent Theory: An Introduction for Phylogenetics Laura Salter Kubatko Departments of Statistics and Evolution, Ecology, and Organismal Biology The Ohio State University lkubatko@stat.ohio-state.edu
Bottlenecks reduce genetic variation Genetic Drift
 Bottlenecks reduce genetic variation Genetic Drift Northern Elephant Seals were reduced to ~30 individuals in the 1800s. Rare alleles are likely to be lost during a bottleneck Two important determinants
Coalescent Theory. Magnus Nordborg. Department of Genetics, Lund University. March 24, 2000
 Coalescent Theory Magnus Nordborg Department of Genetics, Lund University March 24, 2000 Abstract The coalescent process is a powerful modeling tool for population genetics. The allelic states of all homologous
Determining Relatedness from a Pedigree Diagram
 Kin structure & relatedness Francis L. W. Ratnieks Aims & Objectives Aims 1. To show how to determine regression relatedness among individuals using a pedigree diagram. Social Insects: C1139 2. To show
TREES OF GENES IN POPULATIONS
 1 TREES OF GENES IN POPULATIONS Joseph Felsenstein Abstract Trees of ancestry of copies of genes form in populations, as a result of the randomness of birth, death, and Mendelian reproduction. Considering
NON-RANDOM MATING AND INBREEDING
 Instructor: Dr. Martha B. Reiskind AEC 495/AEC592: Conservation Genetics DEFINITIONS Nonrandom mating: Mating individuals are more closely related or less closely related than those drawn by chance from
Part I. Concepts and Methods in Bacterial Population Genetics COPYRIGHTED MATERIAL
 Part I Concepts and Methods in Bacterial Population Genetics COPYRIGHTED MATERIAL Chapter 1 The Coalescent of Bacterial Populations Mikkel H. Schierup and Carsten Wiuf 1.1 BACKGROUND AND MOTIVATION Recent
Population Structure. Population Structure
 Nonrandom Mating HWE assumes that mating is random in the population Most natural populations deviate in some way from random mating There are various ways in which a species might deviate from random
Ancestral Recombination Graphs
 Ancestral Recombination Graphs Ancestral relationships among a sample of recombining sequences usually cannot be accurately described by just a single genealogy. Linked sites will have similar, but not
arxiv: v1 [q-bio.pe] 4 Mar 2013
![arxiv: v1 [q-bio.pe] 4 Mar 2013](/thumbs/75/72248364.jpg "arxiv: v1 [q-bio.pe] 4 Mar 2013") Hybrid-Lambda: simulation of multiple merger and Kingman gene genealogies in species networks and species trees arxiv:1303.0673v1 [q-bio.pe] 4 Mar 2013 Sha Zhu 1,, James H Degnan 2 and Bjarki Eldon 3 1
Hybrid-Lambda: simulation of multiple merger and Kingman gene genealogies in species networks and species trees arxiv:1303.0673v1 [q-bio.pe] 4 Mar 2013 Sha Zhu 1,, James H Degnan 2 and Bjarki Eldon 3 1
Conservation Genetics Inbreeding, Fluctuating Asymmetry, and Captive Breeding Exercise
 Conservation Genetics Inbreeding, Fluctuating Asymmetry, and Captive Breeding Exercise James P. Gibbs Reproduction of this material is authorized by the recipient institution for nonprofit/non-commercial
Recent effective population size estimated from segments of identity by descent in the Lithuanian population
 Anthropological Science Advance Publication Recent effective population size estimated from segments of identity by descent in the Lithuanian population Alina Urnikytė 1 *, Alma Molytė 1, Vaidutis Kučinskas
Coalescence time distributions for hypothesis testing -Kapil Rajaraman 498BIN, HW# 2
 Coalescence time distributions for hypothesis testing -Kapil Rajaraman (rajaramn@uiuc.edu) 498BIN, HW# 2 This essay will be an overview of Maryellen Ruvolo s work on studying modern human origins using
Objective: Why? 4/6/2014. Outlines:
 Objective: Develop mathematical models that quantify/model resemblance between relatives for phenotypes of a quantitative trait : - based on pedigree - based on markers Outlines: Causal model for covariances
Populations. Arindam RoyChoudhury. Department of Biostatistics, Columbia University, New York NY 10032, U.S.A.,
 Change in Recessive Lethal Alleles Frequency in Inbred Populations arxiv:1304.2955v1 [q-bio.pe] 10 Apr 2013 Arindam RoyChoudhury Department of Biostatistics, Columbia University, New York NY 10032, U.S.A.,
Tópicos Depto. Ciencias Biológicas, UniAndes Profesor Andrew J. Crawford Semestre II
 Tópicos Depto. Ciencias Biológicas, UniAndes Profesor Andrew J. Crawford Semestre 29 -II Lab Coalescent simulation using SIMCOAL 17 septiembre 29 Coalescent theory provides a powerful model
GENEALOGICAL TREES, COALESCENT THEORY AND THE ANALYSIS OF GENETIC POLYMORPHISMS
 GENEALOGICAL TREES, COALESCENT THEORY AND THE ANALYSIS OF GENETIC POLYMORPHISMS Noah A. Rosenberg and Magnus Nordborg Improvements in genotyping technologies have led to the increased use of genetic polymorphism
PopGen3: Inbreeding in a finite population
 PopGen3: Inbreeding in a finite population Introduction The most common definition of INBREEDING is a preferential mating of closely related individuals. While there is nothing wrong with this definition,
Coalescent Likelihood Methods. Mary K. Kuhner Genome Sciences University of Washington Seattle WA
 Coalescent Likelihood Methods Mary K. Kuhner Genome Sciences University of Washington Seattle WA Outline 1. Introduction to coalescent theory 2. Practical example 3. Genealogy samplers 4. Break 5. Survey
Using Meiosis to make a Mini-Manc
 Using Meiosis to make a Mini-Manc INTRODUCTION This activity demonstrates the principles of Independent assortment of chromosomes and shows how meiosis leads to tremendous genetic variation. Mini-Manc
MOLECULAR POPULATION GENETICS: COALESCENT METHODS BASED ON SUMMARY STATISTICS
 MOLECULAR POPULATION GENETICS: COALESCENT METHODS BASED ON SUMMARY STATISTICS Daniel A. Vasco*, Keith A. Crandall* and Yun-Xin Fu *Department of Zoology, Brigham Young University, Provo, UT 8460, USA Human
Genetic Diversity and the Structure of Genealogies in Rapidly Adapting Populations
 Genetic Diversity and the Structure of Genealogies in Rapidly Adapting Populations The Harvard community has made this article openly available. Please share how this access benefits you. Your story matters
Estimating Ancient Population Sizes using the Coalescent with Recombination
 Estimating Ancient Population Sizes using the Coalescent with Recombination Sara Sheehan joint work with Kelley Harris and Yun S. Song May 26, 2012 Sheehan, Harris, Song May 26, 2012 1 Motivation Introduction
Behavioral Adaptations for Survival 1. Co-evolution of predator and prey ( evolutionary arms races )
") Behavioral Adaptations for Survival 1 Co-evolution of predator and prey ( evolutionary arms races ) Outline Mobbing Behavior What is an adaptation? The Comparative Method Divergent and convergent evolution
Behavioral Adaptations for Survival 1 Co-evolution of predator and prey ( evolutionary arms races ) Outline Mobbing Behavior What is an adaptation? The Comparative Method Divergent and convergent evolution
Prentice Hall Biology: Exploring Life 2004 Correlated to: Pennsylvania Academic Standards for Science and Technology (By the End of Grade 10)
") Pennsylvania Academic Standards for Science and Technology (By the End of Grade 10) 3.1 UNIFYING THEMES 3.1.10. GRADE 10 A. Discriminate among the concepts of systems, subsystems, feedback and control
Pennsylvania Academic Standards for Science and Technology (By the End of Grade 10) 3.1 UNIFYING THEMES 3.1.10. GRADE 10 A. Discriminate among the concepts of systems, subsystems, feedback and control
Inbreeding depression in corn. Inbreeding. Inbreeding depression in humans. Genotype frequencies without random mating. Example.
 nbreeding depression in corn nbreeding Alan R Rogers Two plants on left are from inbred homozygous strains Next: the F offspring of these strains Then offspring (F2 ) of two F s Then F3 And so on November
Every human cell (except red blood cells and sperm and eggs) has an. identical set of 23 pairs of chromosomes which carry all the hereditary
 has an. identical set of 23 pairs of chromosomes which carry all the hereditary") Introduction to Genetic Genealogy Every human cell (except red blood cells and sperm and eggs) has an identical set of 23 pairs of chromosomes which carry all the hereditary information that is passed
Introduction to Genetic Genealogy Every human cell (except red blood cells and sperm and eggs) has an identical set of 23 pairs of chromosomes which carry all the hereditary information that is passed
Chapter 2: Genes in Pedigrees
 Chapter 2: Genes in Pedigrees Chapter 2-0 2.1 Pedigree definitions and terminology 2-1 2.2 Gene identity by descent (ibd) 2-5 2.3 ibd of more than 2 genes 2-14 2.4 Data on relatives 2-21 2.1.1 GRAPHICAL
Genomic Variation of Inbreeding and Ancestry in the Remaining Two Isle Royale Wolves
 Journal of Heredity, 17, 1 16 doi:1.19/jhered/esw8 Original Article Advance Access publication December 1, 16 Original Article Genomic Variation of Inbreeding and Ancestry in the Remaining Two Isle Royale
Growing the Family Tree: The Power of DNA in Reconstructing Family Relationships
 Growing the Family Tree: The Power of DNA in Reconstructing Family Relationships Luke A. D. Hutchison Natalie M. Myres Scott R. Woodward Sorenson Molecular Genealogy Foundation (www.smgf.org) 2511 South
Research Article The Ancestry of Genetic Segments
 International Scholarly Research Network ISRN Biomathematics Volume 2012, Article ID 384275, 8 pages doi:105402/2012/384275 Research Article The Ancestry of Genetic Segments R B Campbell Department of
5 Inferring Population
 5 Inferring Population History and Demography While population genetics was a very theoretical discipline originally, the modern abundance of population genetic data has forced the field to become more
AFDAA 2012 WINTER MEETING Population Statistics Refresher Course - Lecture 3: Statistics of Kinship Analysis
 AFDAA 2012 WINTER MEETING Population Statistics Refresher Course - Lecture 3: Statistics of Kinship Analysis Ranajit Chakraborty, PhD Center for Computational Genomics Institute of Applied Genetics Department
Exercise 8. Procedure. Observation
 Exercise 8 Procedure Observe the slide under lower magnification of the microscope. In case of chart/models/photographs, note the feature of blastula in your practical record and draw labelled diagram.
Mehdi Sargolzaei L Alliance Boviteq, St-Hyacinthe, QC, Canada and CGIL, University of Guelph, Guelph, ON, Canada. Summary
 An Additive Relationship Matrix for the Sex Chromosomes 2013 ELARES:50 Mehdi Sargolzaei L Alliance Boviteq, St-Hyacinthe, QC, Canada and CGIL, University of Guelph, Guelph, ON, Canada Larry Schaeffer CGIL,
Characterization of the global Brown Swiss cattle population structure
 Swedish University of Agricultural Sciences Faculty of Veterinary Medicine and Animal Science Characterization of the global Brown Swiss cattle population structure Worede Zinabu Gebremariam Examensarbete
ORIGINAL ARTICLE Purging deleterious mutations in conservation programmes: combining optimal contributions with inbred matings
 (203), 8 & 203 Macmillan Publishers Limited www.nature.com/hdy All rights reserved 008-067X/3 ORIGINAL ARTICLE Purging deleterious mutations in conservation programmes: combining optimal contributions
Chapter 12 Gene Genealogies
 Chapter 12 Gene Genealogies Noah A. Rosenberg Program in Molecular and Computational Biology. University of Southern California, Los Angeles, California 90089-1113 USA. E-mail: noahr@usc.edu. Phone: 213-740-2416.
Genetics. 7 th Grade Mrs. Boguslaw
 Genetics 7 th Grade Mrs. Boguslaw Introduction and Background Genetics = the study of heredity During meiosis, gametes receive ½ of their parent s chromosomes During sexual reproduction, two gametes (male
Wright-Fisher Process. (as applied to costly signaling)
") Wright-Fisher Process (as applied to costly signaling) 1 Today: 1) new model of evolution/learning (Wright-Fisher) 2) evolution/learning costly signaling (We will come back to evidence for costly signaling
Wright-Fisher Process (as applied to costly signaling) 1 Today: 1) new model of evolution/learning (Wright-Fisher) 2) evolution/learning costly signaling (We will come back to evidence for costly signaling
6.047/6.878 Lecture 21: Phylogenomics II
 Guest Lecture by Matt Rasmussen Orit Giguzinsky and Ethan Sherbondy December 13, 2012 1 Contents 1 Introduction 3 2 Inferring Orthologs/Paralogs, Gene Duplication and Loss 3 2.1 Species Tree..............................................
Developing Conclusions About Different Modes of Inheritance
 Pedigree Analysis Introduction A pedigree is a diagram of family relationships that uses symbols to represent people and lines to represent genetic relationships. These diagrams make it easier to visualize
Development Team. Importance and Implications of Pedigree and Genealogy. Anthropology. Principal Investigator. Paper Coordinator.
 Paper No. : 13 Research Methods and Fieldwork Module : 10 Development Team Principal Investigator Prof. Anup Kumar Kapoor Department of, University of Delhi Paper Coordinator Dr. P. Venkatramana Faculty
Detecting Heterogeneity in Population Structure Across the Genome in Admixed Populations
 Genetics: Early Online, published on July 20, 2016 as 10.1534/genetics.115.184184 GENETICS INVESTIGATION Detecting Heterogeneity in Population Structure Across the Genome in Admixed Populations Caitlin
Cover Page. The handle holds various files of this Leiden University dissertation
 Cover Page The handle http://hdl.handle.net/1887/22110 holds various files of this Leiden University dissertation Author: Trimbos, Krijn Title: Genetic patterns of Black-tailed Godwit populations and their
Kinship/relatedness. David Balding Professor of Statistical Genetics University of Melbourne, and University College London.
 Kinship/relatedness David Balding Professor of Statistical Genetics University of Melbourne, and University College London 2 Feb 2016 1 Ways to measure relatedness 2 Pedigree-based kinship coefficients
Pedigree Reconstruction using Identity by Descent
 Pedigree Reconstruction using Identity by Descent Bonnie Kirkpatrick Electrical Engineering and Computer Sciences University of California at Berkeley Technical Report No. UCB/EECS-2010-43 http://www.eecs.berkeley.edu/pubs/techrpts/2010/eecs-2010-43.html
Chapter 4 Neutral Mutations and Genetic Polymorphisms
 Chapter 4 Neutral Mutations and Genetic Polymorphisms The relationship between genetic data and the underlying genealogy was introduced in Chapter. Here we will combine the intuitions of Chapter with the
BIOLOGY 1101 LAB 6: MICROEVOLUTION (NATURAL SELECTION AND GENETIC DRIFT)
") BIOLOGY 1101 LAB 6: MICROEVOLUTION (NATURAL SELECTION AND GENETIC DRIFT) READING: Please read chapter 13 in your text. INTRODUCTION: Evolution can be defined as a change in allele frequencies in a population
BIOLOGY 1101 LAB 6: MICROEVOLUTION (NATURAL SELECTION AND GENETIC DRIFT) READING: Please read chapter 13 in your text. INTRODUCTION: Evolution can be defined as a change in allele frequencies in a population
Simulated gene genealogy of a sample of size 50 from a population of constant size. The History of Population Size from Whole Genomes.
 Simulated gene genealogy of a sample of size 50 from a population of constant size The History of Population Size from Whole Genomes Alan R Rogers October 1, 2018 Short terminal branches; long basal ones
Coalescent Theory for a Partially Selfing Population
 Copyright 6 1997 by the Genetics Society of America T Coalescent Theory for a Partially Selfing Population Yun-xin FU Human Genetics Center, University of Texas, Houston, Texas 77225 Manuscript received
DNA Haplogroups Report
 DNA Haplogroups Report for Matthew Mayberry Generated and printed on Sep 25 2011, 01:59 pm X This is a mtdna Haplogroup Report This is a mtdna Subclade Report Search criteria used in this report: HVR-1
Genetics: Early Online, published on June 29, 2016 as /genetics A Genealogical Look at Shared Ancestry on the X Chromosome
 Genetics: Early Online, published on June 29, 2016 as 10.1534/genetics.116.190041 GENETICS INVESTIGATION A Genealogical Look at Shared Ancestry on the X Chromosome Vince Buffalo,,1, Stephen M. Mount and
ESTIMATION OF THE NUMBER OF INDIVIDUALS FOUNDING COLONIZED POPULATIONS
 ORIGINAL ARTICLE doi:1.1111/j.1558-5646.7.8.x ESTIMATION OF THE NUMBER OF INDIVIDUALS FOUNDING COLONIZED POPULATIONS Eric C. Anderson 1, and Montgomery Slatkin 3,4 1 Fisheries Ecology Division, Southwest
POPULATION GENETICS: WRIGHT FISHER MODEL AND COALESCENT PROCESS. Hailong Cui and Wangshu Zhang. Superviser: Prof. Quentin Berger
 POPULATIO GEETICS: WRIGHT FISHER MODEL AD COALESCET PROCESS by Hailong Cui and Wangshu Zhang Superviser: Prof. Quentin Berger A Final Project Report Presented In Partial Fulfillment of the Requirements
Kenneth Nordtvedt. Many genetic genealogists eventually employ a time-tomost-recent-common-ancestor
 Kenneth Nordtvedt Many genetic genealogists eventually employ a time-tomost-recent-common-ancestor (TMRCA) tool to estimate how far back in time the common ancestor existed for two Y-STR haplotypes obtained
Autosomal-DNA. How does the nature of Jewish genealogy make autosomal DNA research more challenging?
 Autosomal-DNA How does the nature of Jewish genealogy make autosomal DNA research more challenging? Using Family Finder results for genealogy is more challenging for individuals of Jewish ancestry because
Probability and Genetics #77
 Questions: Five study Questions EQ: What is probability and how does it help explain the results of genetic crosses? Probability and Heredity In football they use the coin toss to determine who kicks and
Supplemental Lab. EXTINCTION GAME
 Extinction Game 1 Supplemental Lab. EXTINCTION GAME Refer to the Extinction: The Game of Ecology (S.P. Hubbell, Sinauer Associates, Inc.) manual for more details. A. Introduction The Extinction board game
[CLIENT] SmithDNA1701 DE January 2017
![[CLIENT] SmithDNA1701 DE January 2017](/thumbs/93/113058427.jpg "[CLIENT] SmithDNA1701 DE January 2017") [CLIENT] SmithDNA1701 DE1704205 11 January 2017 DNA Discovery Plan GOAL Create a research plan to determine how the client s DNA results relate to his family tree as currently constructed. The client s
[CLIENT] SmithDNA1701 DE1704205 11 January 2017 DNA Discovery Plan GOAL Create a research plan to determine how the client s DNA results relate to his family tree as currently constructed. The client s
Pedigrees How do scientists trace hereditary diseases through a family history?
 Why? Pedigrees How do scientists trace hereditary diseases through a family history? Imagine you want to learn about an inherited genetic trait present in your family. How would you find out the chances
AFRICAN ANCEvSTRY OF THE WHITE AMERICAN POPULATION*
 AFRICAN ANCEvSTRY OF THE WHITE AMERICAN POPULATION* ROBERT P. STUCKERT Department of Sociology and Anthropology, The Ohio State University, Columbus 10 Defining a racial group generally poses a problem
Theoretical Population Biology. An approximate likelihood for genetic data under a model with recombination and population splitting
 Theoretical Population Biology 75 (2009) 33 345 Contents lists available at ScienceDirect Theoretical Population Biology journal homepage: www.elsevier.com/locate/tpb An approximate likelihood for genetic