AFDAA 2012 WINTER MEETING Population Statistics Refresher Course - Lecture 3: Statistics of Kinship Analysis
|
|
|
- Alice Elliott
- 5 years ago
- Views:
Transcription
1 AFDAA 2012 WINTER MEETING Population Statistics Refresher Course - Lecture 3: Statistics of Kinship Analysis Ranajit Chakraborty, PhD Center for Computational Genomics Institute of Applied Genetics Department of Forensic and Investigative Genetics University of North Texas Health Science Center Fort Worth, Texas 76107, USA Tel. (817) ; Fax (817) ranajit.chakraborty@unthsc.edu Lecture given as a part of the AFDAA Population Statistics Refresher Course Held at the AFDAA 2012 Winter Meeting at Auston, TX on February 2, 2012
2 Statistics of Kinship Analysis Learning Objectives Attendees of this lecture should be able to understand Objectives of kinship analysis from DNA evidence data Possible conclusions of kinship analysis Questions answered from kinship analysis Concept of exclusion probability and their limitations Likelihood ratio approach of kinship analysis Paternity analysis, reverse parentage analysis, and kinship analysis for missing person identification Advanced issues mutation, need of linage markers
3 Lecture 3: Statistics for Kinship Analysis from DNA Evidence Topics Covered What is kinship analysis and its special cases Possible conclusions from kinship analysis of DNA evidence Questions answered in kinship analysis Requirements of data for kinship analysis Likelihood ratio: Paternity Index, Kinship Index General formulation of statistics for kinship analysis Advanced issues (mutation, missing person identification with multiple remains and choice of informative reference samples)
4 Kinship Analysis Kinship Determination Objectives: - Evidence sample s DNA is compared with that of one or more reference profiles - The objective is to determine the validity of stated biological relatedness among individuals, generally in reference to the placement of a specific target individual in the pedigree of reference individuals profiles
5 Kinship Analysis Types of Kinship Analysis - Standard Paternity Analysis - Deficient Paternity Analysis (e.g., Mother-less cases) - Reverse Parentage Analysis - Familial Search (i.e., Pairwise relationship testing) - Missing person identification
6 Three Types of Conclusions Exclusion (Match), or Inclusion Inconclusive
7 What is an Exclusion? In all types of Kinship Analyses Allele sharing among evidence and reference samples disagrees with the Mendelian rules of transmission of alleles with the stated relationship being tested
8 When is the Observation at a Locus Inconclusive? Compromised nature of samples tested failed to definitely exclude or include reference individuals May occur for one or more loci, while other loci typed may lead to unequivocal definite inclusion/ exclusion conclusions Caused often by DNA degradation (resulting in allele drop out), and/or low concentration of DNA (resulting in alleles with low peak height and/or area) for the evidence sample
9 What is an Inclusion? In all types of Kinship Analyses Allele sharing among evidence and reference samples is consistent with Mendelian rules of transmission of alleles with the stated relationship being tested; i.e., the stated biological relationship cannot be rejected (Note: In the context of Kinship analyses, the terminology of match is not appropriate)
10 Exclusion Nope Nope
11 Inclusion

12 PATERNITY TESTING MOTHER ALLEGED FATHER CHILD Two alleles for each autosomal genetic marker
13 Language of Paternity Testing Maternal Contribution Obligate Paternal Allele Dual Obligate Paternal Alleles
14 Three Genetic Profiles are Determined Mother A B Child B m C p Alleged father C D
15 Typical Paternity Test Two possible outcomes of test: Inclusion The obligate paternal alleles in the child all have corresponding alleles in the Alleged Father Exclusion The obligate paternal alleles in the child DO NOT have corresponding alleles in the Alleged Father
16 Exclusion Nope Nope
17 Results The Tested Man is Excluded as the Biological Father of the Child in Question
18 Inclusion
19 Results The Tested Man Cannot be Excluded as the Biological Father of the Child in Question Several Statistical Values are Calculated to Assess the Strength of the Genetic Evidence
20 Language of Paternity Testing PI CPI W PE RMNE Paternity Index Combined Paternity Index Probability of Paternity Probability of Exclusion Random Man Not Excluded
21 summarizes information provided by Likelihood Ratio Paternity Index genetic testing Probability that some event will occur under a set of conditions or assumptions Divided by the probability that the same event will occur under a set of different mutually exclusive conditions or assumptions
22 Paternity Index Observe three types from a man, a woman, and a child Assume true trio the man and woman are the true biologic parents of child Assume false trio woman is the mother, man is not the father In the false trio the child s father is a man of unknown type, selected at random from population (unrelated to mother and tested man)
23 Standard Paternity Index Mother, Child, and Alleged Father PI is a likelihood ratio = X/Y Defined as the probability that an event will occur under a particular set of conditions (X). Divided by the probability that the event will occur under a different set of conditions (Y).
24 Standard Paternity Index In paternity testing, the event is observing three phenotypes, those of a woman, man and child. The assumptions made for calculating the numerator (X) is that these three persons are a true trio. For the denominator (Y) the assumptions is that the three persons are a false trio.
25 Paternity Biological Relationship Parents M F Child C
26 Paternity Analysis?
27 Paternity Analysis Hypothetical case DNA Analysis Results in Three Genotypes Mother Child Alleged Father () (BC) (CD)
28 Paternity Analysis CD BC An mother and a CD father can have four possible offspring: AC, AD, BC, BD
29 Standard Paternity Index PI determination in hypothetical DNA System PI = X / Y Numerator X = is the probability that (1) a woman randomly selected from a population is type, and (2) a man randomly selected from a population is type CD, and (3) their child is type BC.
30 Paternity Analysis CD BC
31 Standard Paternity Index PI determination in hypothetical DNA System PI = X / Y Denominator Y = is the probability that (1) a woman randomly selected from a population is type, (2) a man randomly selected and unrelated to either mother or child is type CD, and (3) the woman s child, unrelated to the randomly selected man is BC.
32 Paternity Analysis CD Tested Man BC CD Untested Random Man
33 Standard Paternity Index When mating is random, the probability that the untested alternative father will transmit a specific allele to his child is equal to the allele frequency in his race. We can no look into how to actually calculate a Paternity Index
34 Hypothetical DNA Example First Hypothesis Numerator Person Mother Child Alleged Father Type BC CD In order to explain this evidence Calculate Probability that a) Woman randomly selected from population is type b) Man randomly selected from population is type CD, and c) Their child is type BC
35 Paternity Analysis Paternity Index Numerator 2p A p B CD 2p C p D BC Probability = 2p A p B x 2p C p D x 0.5 x 0.5
36 Hypothetical DNA Example Second Hypothesis Denominator Person Mother Child Alleged Father Type BC CD In order to explain this evidence Calculate Probability that a) Woman randomly selected from population is type b) An alternative man randomly selected from population is type CD, and c) The woman s child, fathered by random man, is type BC
37 Paternity Analysis Paternity Index Denominator 2p A p B CD 2p C p D 0.5 BC p C Probability = 2p A p B x 2p C p D x 0.5 x p C
38 Paternity Analysis Paternity Index PI = PI = 2p A p B x 2p C p D x 0.5 x 0.5 2p A p B x 2p C p D x 0.5 x p C 0.5 p C
39 Hypothetical DNA Example Probability Statements Person Mother Child Alleged Father Type BC CD One might say (Incorrectly) a) Numerator is probability that tested man is the father, and b) Denominator is probability that he is not the father
40 Hypothetical DNA Example Probability Statement Person Mother Child Alleged Father Type BC CD A Correct statement is a) Numerator is probability of observed genotypes, given the tested man is the father, and b) Denominator is probability of observed genotypes, given a random man is the father.
41 Paternity M and C share one allele and AF is heterozygous for the other allele Parents M? CD AF Child BC C AF has a 1 in 2 chance of passing C allele Random Man has p chance of passing the C allele PI = 0.5/p
42 There are 15 possible combinations of genotypes for a paternity trio
43 Paternity Biological Relationship Parents M F Child C
44 Paternity Index M and C share one allele and AF is homozygous for the obligatory allele Parents? C M AF Child BC C AF can only pass C allele Random Man has p chance of passing the C allele PI = 1/p
45 Paternity Analysis Paternity Index Numerator 2 2p A p p C B C BC Probability = 2p A p B x p C 2 x 0.5 x 1
46 Paternity Analysis Paternity Index Denominator 2p A p B C p C BC p C Probability = 2p A p B x p C 2 x 0.5 x p C
47 Paternity Analysis Paternity Index PI = PI = 2p A p B x p 2 C x 0.5 x 1 2p A p B x p 2 C x 0.5 x p C 1 p C
48 Paternity Index M and C share both alleles and AF is heterozygous with one of the obligatory alleles Parents? BC M AF Child C M has a 1 in 2 chance of passing A or B allele AF has a 1 in 2 chance of passing B allele RM has (p + q) chance of passing the A or B alleles PI = 0.5/(p+q)
49 Paternity Analysis Paternity Index Numerator 2p A p B BC 2p B p C 0.5 A 0.5 B Probability = 2p A p B x 2p B p C x 0.5 (ma) x 0.5 (fb)
50 Paternity Analysis Paternity Index Denominator 2p A p B BC 2p B p C 0.5 probability = p A + p B 2p A p B x 2p B p C x (0.5 (ma) x p B (mb) x p A )
51 Paternity Analysis Paternity Index PI = 2p A p B x 2p B p C x 0.5 (ma) x 0.5 (fb) 2p A p B x 2p B p C x (0.5 (mb) x p A (ma) x p B ) PI = PI = p A + 0.5p B 0.5 p A + p B
52 Paternity Index M and C share both alleles and AF is heterozygous with both of the obligatory alleles Parents? M AF Child C M has a 1 in 2 chance of passing A or B allele AF has a 1 in 2 chance of passing A or B allele RM has (p + q) chance of passing the A or B alleles PI = 1/(p+q)
53 Paternity Analysis Paternity Index Numerator 2p A p B 2p A p B 0.5 A B 0.5 A B Probability = 2p A p B x 2p B p C x (0.5 (ma) x 0.5 (fb) (mb) x 0.5 (fa) )
54 Paternity Analysis Paternity Index Denominator 2p A p B 2p A p B 0.5 A B probability = p A + p B 2p A p B x 2p A p B x (0.5 (ma) x p B (mb) x p A )
55 Paternity Analysis Paternity Index PI = 2p A p B x 2p B p C x (0.5 (ma) x 0.5 (fb) (mb) x 0.5 (fa) ) 2p A p B x 2p B p C x (0.5 (mb) x p A (ma) x p B ) PI = PI = p A + 0.5p B 1 p A + p B
56 Paternity Biological Relationship Parents M F Child C
57 Paternity Index M and C share both alleles and AF is heterozygous with one of the obligatory alleles Parents? B M AF Child C M has a 1 in 2 chance of passing A or B allele AF can only pass the B allele RM has (p + q) chance of passing the A or B alleles PI = 1/(p+q)
58 Paternity Analysis Paternity Index Numerator 2p A p B p B B Probability = 2p A p B x p B 2 x 0.5 (ma) x 1 (fb)
59 Paternity Analysis Paternity Index Denominator 2p A p B B p B probability = p A + p B 2p A p B x p B2 x (0.5 (ma) x p B + 1 (mb) x p A )
60 Paternity Analysis Paternity Index PI = 2p A p B x p B 2 x 0.5 (ma) x 1 (fb) 2p A p B x p B2 x (0.5 (mb) x p A (ma) x p B ) PI = PI = p A + 0.5p B 1 p A + p B
61 PI Formulas Single locus, no null alleles, low mutation rate, codominance M A A A BC BC BD C A A A AF BC AC AC AC Numerator Denominator a b b 0.5a 0.5a 0.5a 0.5a 0.5a PI 0.5/a 0.5/b 0.5/b 0.5/a 0.5/a 0.5/a 0.5/a 0.5/a
62 PI Formulas Single locus, no null alleles, low mutation rate, codominance M A B BC C A A AF A A A A Numerator Denominator a 0.5a a 0.5a PI 1/a 1/a 1/a 1/a
63 PI Formulas Single locus, no null alleles, low mutation rate, codominance M C AF AC Numerator 0.25 Denominator 0.5(a+b) PI 0.5/(a+b)
64 PI Formulas Single locus, no null alleles, low mutation rate, codominance M C AF A Numerator Denominator 0.5(a+b) 0.5(a+b) PI 1/(a+b) 1/(a+b)
65 Effect of Population Substructure
66 SAMPLING THEORY OF ALLELE FREQUENCIES Under the mutation-drift balance, the probability of a sample in which n i copies of the allele A i is observed, for any set of i = 1, 2,... is given by n ( ) ( ) i i ni Pr( Ai ) ( n ) ( ) i i i Where n = Σn i, i = p i (1 - )/,. = i = (1 - )/, p i = frequency of allele A i in the population and ( ) is the Gamma function, in which is the coefficient of coancestry (equivalent to F st or G st, the coefficient of gene differentiation between subpopulations within the population)
67 GENOTYPE FREQUENCY Using the general theory, 2 i i i i i Pr( A A ) p p (1 p ) Pr( A A ) 2 p p (1 ) i j i j
68 CONDITIONAL MATCH PROBILITY [2 (1 ) pi][3 (1 ) pi] Pr( Ai Ai Ai Ai ) (1 )(1 2 ) Pr( A A A A ) i j i j 2[ (1 ) p ][ (1 ) p ] i (1 )(1 2 ) j Thus, for = 0, 2 i i i i i i i Pr( A A ) Pr( A A A A ) P Pr( A A ) Pr( A A A A ) 2PP i j i j i j i j
69 PI Formulas population substructure considered M A A A BC BC BD C A A A AF BC AC AC AC PI (1+3 ) / 2[3 +a(1- )] (1+3 ) / 2[ +b(1- )] (1+3 ) / 2[ +b(1- )] (1+3 ) / 2[2 +a(1- )] (1+3 ) / 2[2 +a(1- )] (1+3 ) / 2[ +a(1- )] (1+3 ) / 2[ +a(1- )] (1+3 ) / 2[ +a(1- )]
70 PI Formulas Single locus, no null alleles, low mutation rate, codominance M A B BC C A A AF A A A A PI (1+3 ) / [4 +a(1- )] (1+3 ) / [3 +a(1- )] (1+3 ) / [2 +a(1- )] (1+3 ) / [2 +a(1- )]
71 PI Formulas Single locus, no null alleles, low mutation rate, codominance M C AF AC PI (1+3 ) / 2[3 +(1- )(a+b)]
72 PI Formulas Single locus, no null alleles, low mutation rate, codominance M C AF A PI (1+3 ) / [4 +(1- ) (a+b)] (1+3 ) / [4 +(1- ) (a+b)]
73 Combined Paternity Index
74 Combined Paternity Index When multiple genetic systems are tested, a PI is calculated for each system. This value is referred to as a System PI. If the genetic systems are inherited independently, the Combined Paternity Index (CPI) is the product of the System PI s
75 Combined Paternity Index What is the CPI? The CPI is a measure of the strength of the genetic evidence. It indicates whether the evidence fits better with the hypothesis that the man is the father or with the hypothesis that someone else is the father. continued...
76 Combined Paternity Index The theoretical range for the CPI is from 0 to infinity A CPI of 1 means the genetic tests provides no information A CPI less than 1; the genetic evidence is more consistent with non-paternity than paternity. A CPI greater than 1; the genetic evidence supports the assertion that the tested man is the father.
77 Probability of Paternity
78 Probability of Paternity The probability of paternity is a measure of the strengths of one s belief in the hypothesis that the tested man is the father. The correct probability must be based on all of the evidence in the case. The non-genetic evidence comes from the testimony of the mother, tested man, and other witnesses. The genetic evidence comes from the DNA paternity test.
79 Probability of Paternity The probability of paternity (W) is based upon Baye s Theorem, which provides a method for determining a posterior probability based upon the genetic results of testing the mother, child, and alleged father. In order to determine the probability of paternity, an assumption must be made (before testing) as to the prior probability that the tested man is the true biological father.
80 Probability of Paternity The prior probability of paternity is the strength of one s belief that the tested man is the father based only on the non-genetic evidence.
81 Probability of Paternity Probability of Paternity (W) = CPI x P [CPI x P + (1 P)] P = Prior Probability; it is a number greater than 0 and less than or equal to 1. In many criminal proceedings the Probability of Paternity is not admissible. In criminal cases, the accused is presumed innocent until proven guilty. Therefore, the defense would argue that the Prior Probability should be 0. You cannot calculate a posterior Probability of Paternity with a Prior Probability of 0.
82 Probability of Paternity In the United States, the court system has made the assumption that the prior probability is equal to 0.5. The argument that is presented is that the tested man is either the true father or he is not. In the absence of any knowledge about which was the case, it is reasonable to give these two possibilities equal prior probabilities.
83 Probability of Paternity With a prior probability of 0.5, the Probability of Paternity (W) = = CPI x 0.5 [CPI x (1 0.5)] CPI x 0.5 CPI x = CPI CPI + 1
84 Posterior Odds in Favor of Paternity Posterior Odds = CPI x Prior Odds Prior Odds = P / (1 - P) Posterior Odds in Favor of Paternity = CPI x [P / (1 - P)] If the prior probability of paternity is 0.7, then the prior odds favoring paternity is 7 to 3. If a paternity test is done and the CPI is 10,000, then the Posterior Odds in Favor of Paternity = 10,000 x (0.7 / 0.3) = 23,333 Posterior Odds in Favor of Paternity = 23,333 to 1
85 Probability of Exclusion
86 Probability of Exclusion The probability of exclusion (PE) is defined as the probability of excluding a random individual from the population given the alleles of the child and the mother The genetic information of the tested man is not considered in the determination of the probability of exclusion
87 Probability of Exclusion The probability of exclusion (PE) is equal to the frequency of all men in the population who do not contain an allele that matches the obligate paternal allele of the child.
88 Probability of Exclusion PE = 1 - (a 2 + 2ab) a = frequency of the allele the child inherited from the biological father (obligate paternal allele). The frequency of the obligate allele is determined for each of the major racial groups, and the most common frequency is used in the calculation.
89 Probability of Exclusion PE = 1 - (a 2 + 2ab) b = sum of the frequency of all alleles other than the obligate paternal allele. b = (1 a) PE = 1 [a 2 + 2a(1 a)] PE = 1 [a 2 + 2a 2a 2 ] PE = 1 [2a a 2 ] PE = 1 2a + a 2 PE = (1 a) 2
90 Probability of Exclusion If the Mother and Child are both phenotype, men who cannot be excluded are those who could transmit either an A or B allele (or both). In this case the: PE = [1 - (a + b)] 2
91 Probability of Exclusion In addition, if population substructure is considered PE = (1-a b)(1- )[1-(1- )(a+b)] (1-2 ) (1-3 )
92 PE formulas M A C A OA A PE (1- )(1-a)[1-a(1- )] / (1+2 )(1+3 ) A A [2 +(1- )(1-b)] [3 +(1- )(1-b)] / (1+2 )(1+3 )
93 PE formulas M C AA OA A PE [1-a(1- )][1+ -a(1- )] / (1+2 )(1+3 ) BB B [1-b(1- )][1+ -b(1- )] / (1+2 )(1+3 ) A/B (1-a-b)(1- )[1-(a+b)(1- )] / (1+2 )(1+3 )
94 PE formulas M C AC OA C PE [(1- )(1-c)+2 ][(1- )(1-c)+3 ] / (1+2 )(1+3 ) BC C [(1- )(1-c)+2 ][(1- )(1-c)+3 ] / (1+2 )(1+3 )
95 Combined Probability of Exclusion The individual Probability of Exclusion is calculated for each of the genetic systems (loci) analyzed. The overall Probability of Excluding (CPE) a falsely accused man in a given case equals: 1 [(1 PE 1 ) x (1 PE 2 ) x (1 PE 3 ) x (1 PE N )]
96 Random Man Not Excluded PE = 1 - (a 2 + 2ab) RMNE This component of the equation represents the proportion of the male population that contain the obligate paternal allele and therefore would not be excluded as the father of the tested child for a given genetic test.
97 Random Man Not Excluded PE = 1 RMNE Or RMNE = 1 - PE For a given group of genetic loci tested, the proportion of the male population that would not be excluded is equal to: RMNE 1 x RMNE 2 x RMNE 3 x. RMNE N


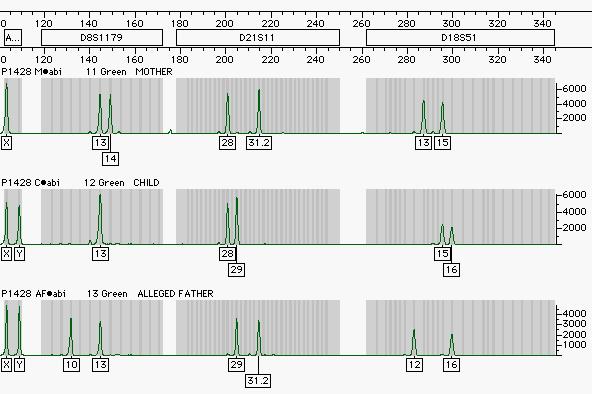
98 PowerPlex TM 1.1 CSF1PO D16S539 TPOX D7820 TH01 D13S317 vwa D5S818 M C AF M C AF P P M C AF M C AF P P-41414
99 Typical Paternity Trio P M C AF Allele Frequency HUMCSF1PO (5q q34) HUMTPOX (2p23-2pter) HUMTH01 7 9p 9 (11p15.5) 7m 6 HUMvWA m 16 (12p p13.2) 18 16p 15 8 = = = = = =
100 Typical Paternity Trio P M C AF PI Formula HUMCSF1PO (5q q34) HUMTPOX (2p23-2pter) HUMTH01 7 9p 9 (11p15.5) 7m 6 HUMvWA m 16 (12p p13.2) 18 16p /(a+b)] 1/(a+b) 0.5/a 0.5/a
101 Typical Paternity Trio P M C AF Paternity Index HUMCSF1PO (5q q34) HUMTPOX (2p23-2pter) HUMTH01 7 9p 9 (11p15.5) 7m 6 HUMvWA m 16 (12p p13.2) 18 16p
102 Typical Paternity Trio P M C AF PE Formula HUMCSF1PO (5q q34) HUMTPOX (2p23-2pter) HUMTH01 7 9p 9 (11p15.5) 7m 6 HUMvWA m 16 (12p p13.2) 18 16p 15 [1 (a+b)] 2 [1 (a+b)] 2 (1 a) 2 (1 a) 2
103 Typical Paternity Trio P M C AF PE HUMCSF1PO (5q q34) HUMTPOX (2p23-2pter) HUMTH01 7 9p 9 (11p15.5) 7 7m 6 HUMvWA m 16 (12p p13.2) 18 16p
104 Typical Paternity Trio P M C AF Allele Frequency D16S m 12 (16p24 - p25) 11p 11 D7S p 11 (7q) 9 9m 10 D13S m 11 (13q22 - q31) 10 8p 8 D5S (5q21 - q31) = = = =
105 Typical Paternity Trio P M C AF PI Formula D16S m 12 (16p24 - p25) 11p 11 D7S p 11 (7q) 9 9m 10 D13S m 11 (13q22 - q31) 10 8p 8 D5S (5q21 - q31) /a 0.5/a 0.5/a 1/a
106 Typical Paternity Trio P M C AF D16S m 12 (16p24 - p25) 11p 11 D7S p 11 (7q) 9 9m 10 D13S m 11 (13q22 - q31) 10 8p 8 D5S (5q21 - q31) Paternity Index
107 Typical Paternity Trio P M C AF D16S m 12 (16p24 - p25) 11p 11 D7S p 11 (7q) 9 9m 10 D13S m 11 (13q22 - q31) 10 8p 8 D5S (5q21 - q31) 11 PE Formula (1 a) 2 (1 a) 2 (1 a) 2 (1 a) 2
108 Typical Paternity Trio P M C AF D16S m 12 (16p24 - p25) 11p 11 D7S p 11 (7q) 9 9m 10 D13S m 11 (13q22 - q31) 10 8p 8 D5S (5q21 - q31) 11 PE


109 PowerPlex 2.1 PENTA E FGA D18S51 TPOX D8S1179 D21S11 TH01 vwa D3S1358 M C AF M C AF P P M C AF M C AF P P-41414
110 Typical Paternity Trio P M C AF Allele Frequency FGA 24 24m 23 (4q28) 23 21p 21 D18S (18q21.3) D21S m 29 (21q q21) 28 29p 28 D3S (3p) D8S p 15 (8) 10 14m = = = = = =
111 Typical Paternity Trio P M C AF PI Formula FGA 24 24m 23 (4q28) 23 21p 21 D18S (18q21.3) D21S m 29 (21q q21) 28 29p 28 D3S (3p) D8S p 15 (8) 10 14m /a 1/(a+b) 0.5/a 0.5/a 0.5/a
112 Typical Paternity Trio P M C AF Paternity Index FGA 24 24m 23 (4q28) 23 21p 21 D18S (18q21.3) D21S m 29 (21q q21) 28 29p 28 D3S (3p) D8S p 15 (8) 10 14m
113 Typical Paternity Trio P M C AF PE Formula FGA 24 24m 23 (4q28) 23 21p 21 D18S (18q21.3) D21S m 29 (21q q21) 28 29p 28 D3S (3p) D8S p 15 (8) 10 14m 13 (1 a) 2 [1 (a+b)] 2 (1 a) 2 (1 a) 2 (1 a) 2
114 Typical Paternity Trio P M C AF PE FGA 24 24m 23 (4q28) 23 21p 21 D18S (18q21.3) D21S m 29 (21q q21) 28 29p 28 D3S (3p) D8S p 15 (8) 10 14m
115 Typical Paternity Trio 13 Core CODIS Loci Combined Paternity Index 431,602 Probability of Paternity % Probability of Exclusion %
116
117 What if. we don t have the mother s genetic data? We can still develop a likelihood estimation for parentage. Lets examine the following logic:
118 Paternity Index Only Man and Child Tested Observe two types from a man and a child Assume true duo the man is the father of the child Assume false duo the man is not the father of the child (simply two individuals selected at random) In the false duo the child s father is a man of unknown type, selected at random from population (unrelated to tested man)
119 Paternity Index Only Man and Child Tested Hypothetical case DNA Analysis Results in Two Genotypes Mother Child Alleged Father Not Tested () (AC)
120 Motherless Paternity Index PI determination in hypothetical DNA System PI = X / Y Numerator X = is the probability that (1) a man randomly selected from a population is type AC, and (2) his child is type. X = Pr{AF passes A} x Pr {M passes B} + Pr{AF passes B} x Pr{M passes A}
121 Motherless Paternity Index PI determination in hypothetical DNA System PI = X / Y Denominator Y = is the probability that (1) a man randomly selected and unrelated to tested man is type AC, and (2) a child unrelated to the randomly selected man is. Y = Pr{RM passes A} x Pr {M passes B} + Pr{RM passes B} x Pr{M passes A}
122 Motherless Paternity Index When the mother s genetic data is present, Pr{M passes A} is 0, 0.5, or 1, and Pr{M passes B} is 0, 0.5, or 1 Without the mother s data, Pr {M passes A} becomes the frequency of the gametic allele, p and Pr {M passes B} becomes the frequency of the gametic allele, q.
123 Motherless Paternity Index So, if we have a heterozygous child, and a heterozygous Alleged Father AC then X = Pr{AF passes A} x Pr {M passes B} + Pr{AF passes B} x Pr{M passes A} X = Pr{AF passes A} x q + Pr{AF passes B} x p Pr{AF passes A} = 0.5 Pr{AF passes B} = 0 X = 0.5 x q + 0 x p X = 0.5q
124 Motherless Paternity Index So, if we have a heterozygous child, and a heterozygous Alleged Father AC then Y = Pr{RM passes A} x Pr {M passes B} + Pr{RM passes B} x Pr{M passes A} Y = p x q + q x p Y = 2pq
125 Motherless Paternity Index So, if we have a heterozygous child, and a heterozygous Alleged Father AC then PI = X / Y X = 0.5q Y = 2pq PI = 0.5q / 2pq PI = 0.25/p PI = 1/4p
126 Paternity Index Only Man and Child Tested Parents M? AC AF Child C The untested Mother could have passed either the A or B allele AF has a 1 in 2 chance of passing A allele RM has (p + q) chance of passing the A or B allele
127 Paternity Index Only Man and Child Tested AC
128 Paternity Index Only Man and Child Tested Numerator AC 2p A p C p B 0.5 A 2p A p B Probability = 2p A p C x 2p A p B x 0.5 (fa) x p B
129 Paternity Index Only Man and Child Tested Denominator AC 2p A p C p A + p B p A + p B 2p A p B probability = 2p A p C x 2p A p B x (p (ma) x p (fb) + p (mb) x p (fa) )
130 Paternity Index Only Man and Child Tested PI = 2p A p B x 2p A p C x 0.5 (ma) x p B 2p A p B x 2p A p C x (p (ma) x p (fb) + p (mb) x p (fa) ) PI = PI = 0.5p B 2p A p B 0.25 p A
131 Paternity Index Only Man and Child Tested Parents M? A AF Child C The untested Mother could have passed either the A or B allele AF can only pass A allele RM has (p + q) chance of passing the A or B allele
132 Paternity Index Only Man and Child Tested A
133 Paternity Index Only Man and Child Tested Numerator A p A 2 p B 1 2p A p B Probability = p A 2 x 2p A p B x 1 (fa) x p B
134 Paternity Index Only Man and Child Tested Denominator A p A 2 p A + p B p A + p B 2p A p B probability = p A2 x 2p A p B x (p (ma) x p (fb) + p (mb) x p (fa) )
135 Paternity Index Only Man and Child Tested PI = p A 2 x 2p A p C x 1 (ma) x p B p A 2 x 2p A p C x (p (ma) x p (fb) + p (mb) x p (fa) ) PI = PI = p B 2p A p B 0.5 p A
136 Paternity Index Only Man and Child Tested Parents M? AF Child C The untested Mother could have passed either the A or B allele AF can pass either A or B allele RM has (p + q) chance of passing the A or B allele
137 Paternity Index Only Man and Child Tested
138 Paternity Index Only Man and Child Tested Numerator 2p A p B p A + p B 0.5 A B 2p A p B Probability = 2p A p B x 2p A p B x (0.5 (fa) x p B (fb) x p A )
139 Paternity Index Only Man and Child Tested Denominator 2p A p B p A + p B p A + p B 2p A p B probability = 2p A p B x 2p A p B x (p (ma) x p (fb) + p (mb) x p (fa) )
140 Paternity Index Only Man and Child Tested PI = 2p A p B x 2p A p B x (0.5 (fa) x p B (fb) x p A ) 2p A p B x 2p A p B x (p (ma) x p (fb) + p (mb) x p (fa) ) PI = 0.5p B + 0.5p A 2p A p B PI = p A + p B 4p A p B
141 Paternity Index Only Man and Child Tested Parents? A M AF Child A C The untested Mother would have to pass an A allele AF can pass only the A allele RM has p chance of passing the A allele
142 Paternity Index Only Man and Child Tested A A
143 Paternity Index Only Man and Child Tested Numerator A p A 2 p A 1 p A 2 A Probability = p A 2 x p A 2 x 1 (fa) x p A
144 Paternity Index Only Man and Child Tested Denominator A p A 2 p A p A p A 2 A probability = p A 2 x p A 2 x p (ma) x p (fa)
145 Paternity Index Only Man and Child Tested PI = p A 2 x p A 2 x 1 (fa) x p A p A 2 x p A 2 x p (ma) x p (fa) PI = PI = p A p A x p A 1 p A
146 Paternity Index Only Man and Child Tested Parents? M AF Child A C The untested Mother would have to pass an A allele AF would have to pass the A allele RM has p chance of passing the A allele
147 Paternity Index Only Man and Child Tested A
148 Paternity Index Only Man and Child Tested Numerator 2p A p B p A 0.5 p A 2 A Probability = 2p A p B x p A 2 x 0.5 (fa) x p A
149 Paternity Index Only Man and Child Tested Denominator 2p A p B p A p A p A 2 A probability = 2p A p B x p A 2 x p (ma) x p (fa)
150 Paternity Index Only Man and Child Tested PI = 2p A p B x p A 2 x 0.5 (fa) x p A 2p A p B x p A 2 x p (ma) x p (fa) PI = PI = 0.5p A p A x p A 0.5 p A
151 Paternity Index Only Man and Child Tested Formulas Single locus, no null alleles, low mutation rate, codominance C A A AF AC A AC A Numerator 0.5b 0.5(a+b) b 0.5a a Denominator PI 2ab 0.25/a 2ab (a+b)/4ab 2ab 0.5/a a 2 0.5/a a 2 1/a PE [1-(a + b)] 2 [1-(a + b)] 2 [1-(a + b)] 2 (1-a) 2 (1-a) 2
152 C Paternity Index Only Man and Child Tested Formulas: with Population Substructure AF AC PI (1+2 ) / 4[(1- )a+ ] PE (1- )(1-a-b)[1-(1- )(a+b)] / (1+ )(1+2 ) A (1+2 )[(a+b)(1- )+2 ] / 4[(1- )a+ ] [(1- )b+ ] (1+2 ) / 2[(1- )a+2 ]
153 C A Paternity Index Only Man and Child Tested Formulas: with Population Substructure AF AC PI (1+2 ) / 2[(1- )a+2 ] PE (1- )(1-a)[(1- )(1-a)+ ] / (1+ )(1+2 ) A A (1+2 ) / [(1- )a+3 ]
154 41376 PowerPlex 2.1 FGA TPOX PENTA E D18S51 D8S1179 D21S11 TH01 vwa D3S1358 C AF C AF
155 MOTHERLESS PATERNITY CASE P C AF Allele Frequencies HUMCSF1PO = (5q q34) = HUMTPOX = (2p23-2pter) = HUMTH = (11p15.5) = HUMvWA = (12p p13.2) =
 / 4ab PI = (0.5b + 0.5a) / 2ab")
156 41376 TPOX 13 C AF C PI = X / Y AF X = 0.5b + 0.5a Y = 2ab PI = (a + b) / 4ab PI = (0.5b + 0.5a) / 2ab

157 41376 THO C AF C AF PI = X / Y X = 0.5b Y = 2ab PI = 0.25 / a PI = 0.5b / 2ab

158 41376 vwa C AF C AF PI = X / Y X = b Y = 2ab PI = 0.5 / a PI = b / 2ab
159 MOTHERLESS PATERNITY CASE P C AF PI Formula HUMCSF1PO /a (5q q34) HUMTPOX 8 8 (a+b)/4ab (2p23-2pter) HUMTH /a (11p15.5) HUMvWA /a (12p p13.2) 16
160 MOTHERLESS PATERNITY CASE P C AF PI HUMCSF1PO (5q q34) HUMTPOX (2p23-2pter) HUMTH (11p15.5) HUMvWA (12p p13.2) 16
161 MOTHERLESS PATERNITY CASE P C AF PE Formulas HUMCSF1PO [1-(a+b)] 2 (5q q34) HUMTPOX 8 8 [1-(a+b)] 2 (2p23-2pter) HUMTH [1-(a+b)] 2 (11p15.5) HUMvWA [1-(a+b)] 2 (12p p13.2) 16
162 MOTHERLESS PATERNITY CASE P C AF PE HUMCSF1PO (5q q34) HUMTPOX (2p23-2pter) HUMTH (11p15.5) HUMvWA (12p p13.2) 16
163 MOTHERLESS PATERNITY CASE P C AF Allele Frequencies D16S = (16p24 - p25) = D7S = (7q) = D13S = (13q22 - q31) D5S = (5q21 - q31) =
164 MOTHERLESS PATERNITY CASE P C AF PI Formulas D16S /a (16p24 - p25) D7S /a (7q) D13S /a (13q22 - q31) D5S /a (5q21 - q31) 13 12
165 MOTHERLESS PATERNITY CASE P C AF PI D16S (16p24 - p25) D7S (7q) D13S (13q22 - q31) D5S (5q21 - q31) 13 12
166 MOTHERLESS PATERNITY CASE P C AF PE Formulas D16S [1-(a+b)] 2 (16p24 - p25) D7S [1-(a+b)] 2 (7q) D13S (1-a) 2 (13q22 - q31) D5S [1-(a+b)] 2 (5q21 - q31) 13 12
167 MOTHERLESS PATERNITY CASE P C AF PE D16S (16p24 - p25) D7S (7q) D13S (13q22 - q31) D5S (5q21 - q31) 13 12
168 MOTHERLESS PATERNITY CASE P C AF Allele Frequencies FGA = (4q28) = D18S = (18q21.3) 20 D21S = (21q q21) 29 D3S = (3p) = D8S = (8) =

169 41376 FGA C AF C AF PI = X / Y X = 0.5b Y = 2ab PI = 0.5b / 2ab PI = 0.25 / a

170 41376 D18S C AF C AF PI = X / Y X = 0.5a Y = a 2 PI = 0.5 / a PI = 0.5a / a 2

171 C PI = X / Y AF D21S11 C AF X = 0.5a Y = a 2 PI = 0.5a / a 2 PI = 0.5 / a

172 41376 D3S C PI = X / Y X = 0.5b Y = 2ab AF C AF PI = 0.25 / a PI = 0.5b / 2ab
 / 2ab PI = (a + b) / 4ab")
173 D8S1179 C AF C PI = X / Y AF X = 0.5b + 0.5a Y = 2ab PI = (0.5b + 0.5a) / 2ab PI = (a + b) / 4ab
174 MOTHERLESS PATERNITY CASE P C AF PI Formulas FGA /a (4q28) D18S /a (18q21.3) 20 D21S /a (21q q21) 29 D3S /a (3p) D8S (a+b)/4ab (8) 13 13
175 MOTHERLESS PATERNITY CASE P C AF PI FGA (4q28) D18S (18q21.3) 20 D21S (21q q21) 29 D3S (3p) D8S (8) 13 13
176 MOTHERLESS PATERNITY CASE P C AF PE Formulas FGA [1-(a+b)] 2 (4q28) D18S (1-a) 2 (18q21.3) 20 D21S (1-a) 2 (21q q21) 29 D3S [1-(a+b)] 2 (3p) D8S [1-(a+b)] 2 (8) 13 13
177 MOTHERLESS PATERNITY CASE P C AF PE FGA (4q28) D18S (18q21.3) 20 D21S (21q q21) 29 D3S (3p) D8S (8) 13 13
178 Motherless Paternity 13 Core CODIS Loci ( =0) Combined Paternity Index 1,676 Probability of Paternity 99.94% (prior=0.5) Probability of Exclusion 99.94%
179 Motherless Paternity 13 Core CODIS Loci ( =0.01) Combined Paternity Index 867 Probability of Paternity 99.88% Probability of Exclusion 99.90%
180 Motherless Paternity 13 Core CODIS Loci ( =0.03) Combined Paternity Index 309 Probability of Paternity 99.68% Probability of Exclusion 99.80%
181 Reverse Paternity Testing Can we identify crime scene evidence to a deceased/missing individual? Applications: no-body homicides victims of mass disasters
182 REVERSE PATERNITY INDEX BODY IDENTIFICATION ALLEGED EVIDENCE ALLEGED MOTHER FATHER A B B C C D
183 Three genotypes: Alleged Mother Child (missing) Alleged Father
184 Missing child?
185 Reverse Paternity Index RPI = X / Y Numerator X = is the probability that (1) a woman randomly selected from a population is type, and (2) a man randomly selected from a population is type CD, and (3) their child is type BC.
186 Reverse Paternity Analysis CD BC
187 Reverse Paternity Index RPI = X / Y Denominator Y = is the probability that (1) a woman randomly selected from a population and unrelated to missing child is type, (2) a man randomly selected from a population and unrelated to missing child is type CD, and (3) a child, randomly selected from a population is BC.
188 Reverse Paternity Analysis Missing child scenario CD BC
189 Hypothetical DNA Example First Hypothesis Numerator Person Alleged Mother Child Alleged Father Type BC CD In order to explain this evidence Calculate Probability that a) Woman randomly selected from population is type b) Man randomly selected from population is type CD, and c) Their child is type BC
190 Reverse Paternity Analysis Missing child scenario Numerator 2p A p B CD 2p C p D BC Probability = 2p A p B x 2p C p D x 0.5 x 0.5
191 Hypothetical DNA Example Second Hypothesis Denominator Person Alleged Mother Child Alleged Father Type BC CD In order to explain this evidence Calculate Probability that a) Woman randomly selected from population is type b) Man randomly selected from population is type CD, and c) A child, randomly selected and unrelated to either woman or man, is type BC
192 Paternity Analysis Paternity Index Denominator 2p A p B CD 2p C p D BC 2p B p C Probability = 2p A p B x 2p C p D x 2p B p C
193 Reverse Paternity Analysis Missing child scenario CD BC
194 Reverse Paternity Analysis Missing child scenario LR = LR = 2p A p B x 2p C p D x 0.5 x 0.5 2p A p B x 2p C p D x 2p B p C p B p C
195 Reverse Paternity Analysis Missing child scenario CC BC
196 Reverse Paternity Analysis Missing child scenario Numerator 2 2p A p p C B C BC Probability = 2p A p B x p C 2 x 0.5 x 1
197 Paternity Analysis Paternity Index Denominator 2p A p B C p C 2 BC 2p B p C Probability = 2p A p B x p C 2 x 2p B p C
198 LR = LR = p B p B x 2p C p D x 0.5 x 1 p B p B x 2p C p D x 2p B p C 0.5 2p B p C
199 Example of Failure of Pairwise Comparison of profiles to detect True Relationship K3 K1 AA AA K4 Q1 K2? AC Q1 = Evidence Sample; K1 ~ K4 = Reference samples, with family relationships known; Q1 is investigated as a Full Sibling in the family Pairwise comparison of Q1 with others cannot exclude P- O, F-S, H-S relationships Five profiles together exclude (barring mutation) Q1 being the missing family member mtdna and Y-STR, along with autosomal STRs, can discriminate H-S vs. completely unrelated scenarios for Q1
200 A Real Case of Missing Person Identification Father (untyped) Mother (untyped) ? (bone) Data Autosomal STRs typed for: , , , and Mitochondrial DNA (mtdna) typed for: and Y-STRs typed for: , , , and Question: Does (bone) belong to the above pedigree?
201 Example (Contd.) Process of Identification comparison of likelihoods of two pedigrees Father (untyped) Mother (untyped) Father (untyped) Mother (untyped) (Bone) V S and (Bone)
202 Statistics for Example Case (Autosomal STRs) Likelihood ratio (LR), θ= 0 with mutation (STRBase) Population IQQ CCP SCL TMC PUQ LR 7.47E E E E E+09 Prior odds = 1/6 Probability of Positive Identification (PIP) = (LR*prior odds)/(lr*prior odds + 1) Population IQQ CCP SCL TMC PUQ LR (Bone)
203 Example Contd. (Mitochondrial DNA Match) mtdna Haplotype frequency and LR per population Population Sample Size Counts Exact frequency Mismatch = 0 CI(0.95) UpperBound LR Counts General frequency Mismatch<=2 CI(0.95) UpperBound LR Total E E E E+02 African E E E E E+02 Asian E E E+01 Caucasian E E E+02 Hispanic E E E+02 Native Ame E
204 Example Contd. (Y Chromosome STRs Match) Y STR Haplotype frequency and LR per population Population Counts Sample Size θ Conditional frequency CI(0.95) UpperBound LR Total E E E E+03 African Ame E E E E+02 Asian E E E E+02 Caucasian E E E E+02 Hispanic E E E E+02 Indian E E E E+02 Native Ame N/A N/A 3.42 E E+01
205 Thank you!
Popstats Parentage Statistics Strength of Genetic Evidence In Parentage Testing
 Popstats Parentage Statistics Strength of Genetic Evidence In Parentage Testing Arthur J. Eisenberg, Ph.D. Director DNA Identity Laboratory UNT-Health Science Center eisenber@hsc.unt.edu PATERNITY TESTING
DNA: Statistical Guidelines
 Frequency calculations for STR analysis When a probative association between an evidence profile and a reference profile is made, a frequency estimate is calculated to give weight to the association. Frequency
4. Kinship Paper Challenge
 4. António Amorim (aamorim@ipatimup.pt) Nádia Pinto (npinto@ipatimup.pt) 4.1 Approach After a woman dies her child claims for a paternity test of the man who is supposed to be his father. The test is carried
Methods of Parentage Analysis in Natural Populations
 Methods of Parentage Analysis in Natural Populations Using molecular markers, estimates of genetic maternity or paternity can be achieved by excluding as parents all adults whose genotypes are incompatible
DNA Parentage Test No Summary Report
 Collaborative Testing Services, Inc FORENSIC TESTING PROGRAM DNA Parentage Test No. 16-5870 Summary Report This proficiency test was sent to 27 participants. Each participant received a sample pack consisting
Large scale kinship:familial Searching and DVI. Seoul, ISFG workshop
 Large scale kinship:familial Searching and DVI Seoul, ISFG workshop 29 August 2017 Large scale kinship Familial Searching: search for a relative of an unidentified offender whose profile is available in
Primer on Human Pedigree Analysis:
 Primer on Human Pedigree Analysis: Criteria for the selection and collection of appropriate Family Reference Samples John V. Planz. Ph.D. UNT Center for Human Identification Successful Missing Person ID
Supporting Online Material for
 www.sciencemag.org/cgi/content/full/1122655/dc1 Supporting Online Material for Finding Criminals Through DNA of Their Relatives Frederick R. Bieber,* Charles H. Brenner, David Lazer *Author for correspondence.
ICMP DNA REPORTS GUIDE
 ICMP DNA REPORTS GUIDE Distribution: General Sarajevo, 16 th December 2010 GUIDE TO ICMP DNA REPORTS 1. Purpose of This Document 1. The International Commission on Missing Persons (ICMP) endeavors to secure
DNA Parentage Test No Summary Report
 Collaborative Testing Services, Inc FORENSIC TESTING PROGRAM DNA Parentage Test No. 175871 Summary Report This proficiency test was sent to 45 participants. Each participant received a sample pack consisting
Lecture 1: Introduction to pedigree analysis
 Lecture 1: Introduction to pedigree analysis Magnus Dehli Vigeland NORBIS course, 8 th 12 th of January 2018, Oslo Outline Part I: Brief introductions Pedigrees symbols and terminology Some common relationships
DNA Parentage Test No Summary Report
 Collaborative Testing Services, Inc FORENSIC TESTING PROGRAM DNA Parentage Test No. 165871 Summary Report This proficiency test was sent to 45 participants. Each participant received a sample pack consisting
DNA Interpretation Test No Summary Report
 Collaborative Testing Services, Inc FORENSIC TESTING PROGRAM DNA Interpretation Test No. 17-588 Summary Report This proficiency test was sent to 3 participants. Each participant received a sample pack
DNA Parentage Test No Summary Report
 Collaborative Testing Services, Inc FORENSIC TESTING PROGRAM DNA Parentage Test No. 155872 Summary Report This proficiency test was sent to 38 participants. Each participant received a sample pack consisting
Investigations from last time. Inbreeding and neutral evolution Genes, alleles and heterozygosity
 Investigations from last time. Heterozygous advantage: See what happens if you set initial allele frequency to or 0. What happens and why? Why are these scenario called unstable equilibria? Heterozygous
DNA (DeoxyriboNucleic Acid)
") Basics of DNA & Sales and Marketing Presented by: Kim Levaggi of Chromosomal Labs DNA (DeoxyriboNucleic Acid) DNA a very long molecule that is essentially the instruction manual to cells and organisms.
Basics of DNA & Sales and Marketing Presented by: Kim Levaggi of Chromosomal Labs DNA (DeoxyriboNucleic Acid) DNA a very long molecule that is essentially the instruction manual to cells and organisms.
Statistical Interpretation in Making DNA-based Identification of Mass Victims
 Statistical Interretation in Making DNAbased Identification of Mass Victims KyoungJin Shin wan Young Lee Woo Ick Yang Eunho a Det. of Forensic Medicine Yonsei University College of Medicine Det. of Information
Basics of DNA & Sales and Marketing
 Basics of DNA & Sales and Marketing Presented by: Kim Levaggi of Chromosomal Labs 1 DNA (DeoxyriboNucleic Acid) DNA a very long molecule that is essentially the instruction manual to cells and organisms.
CONGEN. Inbreeding vocabulary
 CONGEN Inbreeding vocabulary Inbreeding Mating between relatives. Inbreeding depression Reduction in fitness due to inbreeding. Identical by descent Alleles that are identical by descent are direct descendents
1) Using the sightings data, determine who moved from one area to another and fill this data in on the data sheet.
 Using the sightings data, determine who moved from one area to another and fill this data in on the data sheet.") Parentage and Geography 5. The Life of Lulu the Lioness: A Heroine s Story Name: Objective Using genotypes from many individuals, determine maternity, paternity, and relatedness among a group of lions.
Parentage and Geography 5. The Life of Lulu the Lioness: A Heroine s Story Name: Objective Using genotypes from many individuals, determine maternity, paternity, and relatedness among a group of lions.
Statistical DNA Forensics Theory, Methods and Computation
 Statistical DNA Forensics Theory, Methods and Computation Wing Kam Fung and Yue-Qing Hu Department of Statistics and Actuarial Science, The University of Hong Kong, Hong Kong Statistical DNA Forensics
Statistical DNA Forensics Theory, Methods and Computation
 Statistical DNA Forensics Theory, Methods and Computation Wing Kam Fung and Yue-Qing Hu Department of Statistics and Actuarial Science, The University of Hong Kong, Hong Kong Statistical DNA Forensics
Chapter 2: Genes in Pedigrees
 Chapter 2: Genes in Pedigrees Chapter 2-0 2.1 Pedigree definitions and terminology 2-1 2.2 Gene identity by descent (ibd) 2-5 2.3 ibd of more than 2 genes 2-14 2.4 Data on relatives 2-21 2.1.1 GRAPHICAL
Pedigrees How do scientists trace hereditary diseases through a family history?
 Why? Pedigrees How do scientists trace hereditary diseases through a family history? Imagine you want to learn about an inherited genetic trait present in your family. How would you find out the chances
Spring 2013 Assignment Set #3 Pedigree Analysis. Set 3 Problems sorted by analytical and/or content type
 Biology 321 Spring 2013 Assignment Set #3 Pedigree Analysis You are responsible for working through on your own, the general rules of thumb for analyzing pedigree data to differentiate autosomal and sex-linked
Automated Discovery of Pedigrees and Their Structures in Collections of STR DNA Specimens Using a Link Discovery Tool
 University of Tennessee, Knoxville Trace: Tennessee Research and Creative Exchange Masters Theses Graduate School 5-2010 Automated Discovery of Pedigrees and Their Structures in Collections of STR DNA
Lecture 6: Inbreeding. September 10, 2012
 Lecture 6: Inbreeding September 0, 202 Announcements Hari s New Office Hours Tues 5-6 pm Wed 3-4 pm Fri 2-3 pm In computer lab 3306 LSB Last Time More Hardy-Weinberg Calculations Merle Patterning in Dogs:
Developing Conclusions About Different Modes of Inheritance
 Pedigree Analysis Introduction A pedigree is a diagram of family relationships that uses symbols to represent people and lines to represent genetic relationships. These diagrams make it easier to visualize
Genetics. 7 th Grade Mrs. Boguslaw
 Genetics 7 th Grade Mrs. Boguslaw Introduction and Background Genetics = the study of heredity During meiosis, gametes receive ½ of their parent s chromosomes During sexual reproduction, two gametes (male
Non-Paternity: Implications and Resolution
 Non-Paternity: Implications and Resolution Michelle Beckwith PTC Labs 2006 AABB HITA Meeting October 8, 2006 Considerations when identifying victims using relatives Identification requires knowledge of
Interpretation errors in DNA profiling
 Interpretation errors in DNA profiling Dan E. Krane, Wright State University, Dayton, OH Forensic Bioinformatics (www.bioforensics.com) A controversial idea: Analysts should arrive at conclusions about
NON-RANDOM MATING AND INBREEDING
 Instructor: Dr. Martha B. Reiskind AEC 495/AEC592: Conservation Genetics DEFINITIONS Nonrandom mating: Mating individuals are more closely related or less closely related than those drawn by chance from
BIOL Evolution. Lecture 8
 BIOL 432 - Evolution Lecture 8 Expected Genotype Frequencies in the Absence of Evolution are Determined by the Hardy-Weinberg Equation. Assumptions: 1) No mutation 2) Random mating 3) Infinite population
Kinship and Population Subdivision
 Kinship and Population Subdivision Henry Harpending University of Utah The coefficient of kinship between two diploid organisms describes their overall genetic similarity to each other relative to some
Population Structure. Population Structure
 Nonrandom Mating HWE assumes that mating is random in the population Most natural populations deviate in some way from random mating There are various ways in which a species might deviate from random
Statistical methods in genetic relatedness and pedigree analysis
 Statistical methods in genetic relatedness and pedigree analysis Oslo, January 2018 Magnus Dehli Vigeland and Thore Egeland Exercise set III: Coecients of pairwise relatedness Exercise III-1. Use Wright's
Chromosome X haplotyping in deficiency paternity testing principles and case report
 International Congress Series 1239 (2003) 815 820 Chromosome X haplotyping in deficiency paternity testing principles and case report R. Szibor a, *, I. Plate a, J. Edelmann b, S. Hering c, E. Kuhlisch
Puzzling Pedigrees. Essential Question: How can pedigrees be used to study the inheritance of human traits?
 Name: Puzzling Pedigrees Essential Question: How can pedigrees be used to study the inheritance of human traits? Studying inheritance in humans is more difficult than studying inheritance in fruit flies
1.4.1(Question should be rather: Another sibling of these two brothers) 25% % % (population risk of heterozygot*2/3*1/4)
 25% % % (population risk of heterozygot*2/3*1/4)") ----------------------------------------------------------Chapter 1--------------------------------------------------------------- (each task of this chapter is dedicated as x (x meaning the exact task.
----------------------------------------------------------Chapter 1--------------------------------------------------------------- (each task of this chapter is dedicated as x (x meaning the exact task.
Revising how the computer program
 Molecular Ecology (2007) 6, 099 06 doi: 0./j.365-294X.2007.03089.x Revising how the computer program Blackwell Publishing Ltd CERVUS accommodates genotyping error increases success in paternity assignment
Bottlenecks reduce genetic variation Genetic Drift
 Bottlenecks reduce genetic variation Genetic Drift Northern Elephant Seals were reduced to ~30 individuals in the 1800s. Rare alleles are likely to be lost during a bottleneck Two important determinants
Free Online Training
 Using DNA and CODIS to Resolve Missing and Unidentified Person Cases B.J. Spamer NamUs Training and Analysis Division Office: 817-735-5473 Cell: 817-964-1879 Email: BJ.Spamer@unthsc.edu Free Online Training
1/8/2013. Free Online Training. Using DNA and CODIS to Resolve Missing and Unidentified Person Cases. Click Online Training
 Free Online Training Using DNA and CODIS to Resolve Missing and Unidentified Person Cases B.J. Spamer NamUs Training and Analysis Division Office: 817-735-5473 Cell: 817-964-1879 Email: BJ.Spamer@unthsc.edu
Two-point linkage analysis using the LINKAGE/FASTLINK programs
 1 Two-point linkage analysis using the LINKAGE/FASTLINK programs Copyrighted 2018 Maria Chahrour and Suzanne M. Leal These exercises will introduce the LINKAGE file format which is the standard format
Mix & match: Getting comfortable with DNA reporting. Elmira, New York. Cybergenetics People of New York v Casey Wilson
 Mix & match: Getting comfortable with DNA reporting What s in a Match? How to read a forensic DNA report Duquesne University October, 2015 Pittsburgh, PA Mark W Perlin, PhD, MD, PhD Cybergenetics, Pittsburgh,
KINSHIP ANALYSIS AND HUMAN IDENTIFICATION IN MASS DISASTERS: THE USE OF MDKAP FOR THE WORLD TRADE CENTER TRAGEDY
 1 KINSHIP ANALYSIS AND HUMAN IDENTIFICATION IN MASS DISASTERS: THE USE OF MDKAP FOR THE WORLD TRADE CENTER TRAGEDY Benoît Leclair 1, Steve Niezgoda 2, George R. Carmody 3 and Robert C. Shaler 4 1 Myriad
Inbreeding and self-fertilization
 Inbreeding and self-fertilization Introduction Remember that long list of assumptions associated with derivation of the Hardy-Weinberg principle that we just finished? Well, we re about to begin violating
BIOL 502 Population Genetics Spring 2017
 BIOL 502 Population Genetics Spring 2017 Week 8 Inbreeding Arun Sethuraman California State University San Marcos Table of contents 1. Inbreeding Coefficient 2. Mating Systems 3. Consanguinity and Inbreeding
On identification problems requiring linked autosomal markers
 * Title Page (with authors & addresses) On identification problems requiring linked autosomal markers Thore Egeland a Nuala Sheehan b a Department of Medical Genetics, Ulleval University Hospital, 0407
Enhanced Kinship Analysis and STR-based DNA Typing for Human Identification in Mass Fatality Incidents: The Swissair Flight 111 Disaster
 JForensicSci,Sept. 2004, Vol. 49, No. 5 Paper ID JFS2003311 Available online at: www.astm.org Benoît Leclair, 1,2 Ph.D.; Chantal J. Frégeau, 1 Ph.D.; Kathy L. Bowen, 1 B.Sc.; and Ron M. Fourney, 1 Ph.D.
Objective: Why? 4/6/2014. Outlines:
 Objective: Develop mathematical models that quantify/model resemblance between relatives for phenotypes of a quantitative trait : - based on pedigree - based on markers Outlines: Causal model for covariances
Gene coancestry in pedigrees and populations
 Gene coancestry in pedigrees and populations Thompson, Elizabeth University of Washington, Department of Statistics Box 354322 Seattle, WA 98115-4322, USA E-mail: eathomp@uw.edu Glazner, Chris University
ville, VA Associate Editor: XXXXXXX Received on XXXXX; revised on XXXXX; accepted on XXXXX
 Robust Relationship Inference in Genome Wide Association Studies Ani Manichaikul 1,2, Josyf Mychaleckyj 1, Stephen S. Rich 1, Kathy Daly 3, Michele Sale 1,4,5 and Wei- Min Chen 1,2,* 1 Center for Public
Detection of Misspecified Relationships in Inbred and Outbred Pedigrees
 Detection of Misspecified Relationships in Inbred and Outbred Pedigrees Lei Sun 1, Mark Abney 1,2, Mary Sara McPeek 1,2 1 Department of Statistics, 2 Department of Human Genetics, University of Chicago,
TDT vignette Use of snpstats in family based studies
 TDT vignette Use of snpstats in family based studies David Clayton April 30, 2018 Pedigree data The snpstats package contains some tools for analysis of family-based studies. These assume that a subject
Inbreeding and self-fertilization
 Inbreeding and self-fertilization Introduction Remember that long list of assumptions associated with derivation of the Hardy-Weinberg principle that I went over a couple of lectures ago? Well, we re about
Population Genetics 3: Inbreeding
 Population Genetics 3: nbreeding nbreeding: the preferential mating of closely related individuals Consider a finite population of diploids: What size is needed for every individual to have a separate
Detecting Heterogeneity in Population Structure Across the Genome in Admixed Populations
 Genetics: Early Online, published on July 20, 2016 as 10.1534/genetics.115.184184 GENETICS INVESTIGATION Detecting Heterogeneity in Population Structure Across the Genome in Admixed Populations Caitlin
Web-based Y-STR database for haplotype frequency estimation and kinship index calculation
 20-05-29 Web-based Y-STR database for haplotype frequency estimation and kinship index calculation In Seok Yang Dept. of Forensic Medicine Yonsei University College of Medicine Y chromosome short tandem
Decrease of Heterozygosity Under Inbreeding
 INBREEDING When matings take place between relatives, the pattern is referred to as inbreeding. There are three common areas where inbreeding is observed mating between relatives small populations hermaphroditic
Contributed by "Kathy Hallett"
 National Geographic: The Genographic Project Name Background The National Geographic Society is undertaking the ambitious process of tracking human migration using genetic technology. By using the latest
Determining Relatedness from a Pedigree Diagram
 Kin structure & relatedness Francis L. W. Ratnieks Aims & Objectives Aims 1. To show how to determine regression relatedness among individuals using a pedigree diagram. Social Insects: C1139 2. To show
Using Autosomal DNA for Genealogy Debbie Parker Wayne, CG, CGL SM
 Using Autosomal DNA for Genealogy Debbie Parker Wayne, CG, CGL SM This is one article of a series on using DNA for genealogical research. There are several types of DNA tests offered for genealogical purposes.
Coalescence. Outline History. History, Model, and Application. Coalescence. The Model. Application
 Coalescence History, Model, and Application Outline History Origins of theory/approach Trace the incorporation of other s ideas Coalescence Definition and descriptions The Model Assumptions and Uses Application
Kinship/relatedness. David Balding Professor of Statistical Genetics University of Melbourne, and University College London.
 Kinship/relatedness David Balding Professor of Statistical Genetics University of Melbourne, and University College London 2 Feb 2016 1 Ways to measure relatedness 2 Pedigree-based kinship coefficients
Population Genetics using Trees. Peter Beerli Genome Sciences University of Washington Seattle WA
 Population Genetics using Trees Peter Beerli Genome Sciences University of Washington Seattle WA Outline 1. Introduction to the basic coalescent Population models The coalescent Likelihood estimation of
Using Pedigrees to interpret Mode of Inheritance
 Using Pedigrees to interpret Mode of Inheritance Objectives Use a pedigree to interpret the mode of inheritance the given trait is with 90% accuracy. 11.2 Pedigrees (It s in your genes) Pedigree Charts
Halley Family. Mystery? Mystery? Can you solve a. Can you help solve a
 Can you solve a Can you help solve a Halley Halley Family Family Mystery? Mystery? Who was the great grandfather of John Bennett Halley? He lived in Maryland around 1797 and might have been born there.
Lutz Roewer, Sascha Willuweit Dept. Forensic Genetics, Institute of Legal Medicine and Forensic Sciences Charité Universitätsmedizin Berlin, Germany
 The new YHRD Lutz Roewer, Sascha Willuweit Dept. Forensic Genetics, Institute of Legal Medicine and Forensic Sciences Charité Universitätsmedizin Berlin, Germany 2000 2004 2008 2014 Aug 99 Jun 00 Jan 03
Linkage Analysis in Merlin. Meike Bartels Kate Morley Danielle Posthuma
 Linkage Analysis in Merlin Meike Bartels Kate Morley Danielle Posthuma Software for linkage analyses Genehunter Mendel Vitesse Allegro Simwalk Loki Merlin. Mx R Lisrel MERLIN software Programs: MERLIN
Pedigree Reconstruction using Identity by Descent
 Pedigree Reconstruction using Identity by Descent Bonnie Kirkpatrick Electrical Engineering and Computer Sciences University of California at Berkeley Technical Report No. UCB/EECS-2010-43 http://www.eecs.berkeley.edu/pubs/techrpts/2010/eecs-2010-43.html
An Optimal Algorithm for Automatic Genotype Elimination
 Am. J. Hum. Genet. 65:1733 1740, 1999 An Optimal Algorithm for Automatic Genotype Elimination Jeffrey R. O Connell 1,2 and Daniel E. Weeks 1 1 Department of Human Genetics, University of Pittsburgh, Pittsburgh,
The Pedigree. NOTE: there are no definite conclusions that can be made from a pedigree. However, there are more likely and less likely explanations
 The Pedigree A tool (diagram) used to trace traits in a family The diagram shows the history of a trait between generations Designed to show inherited phenotypes Using logic we can deduce the inherited
Pedigree Charts. The family tree of genetics
 Pedigree Charts The family tree of genetics Pedigree Charts I II III What is a Pedigree? A pedigree is a chart of the genetic history of family over several generations. Scientists or a genetic counselor
Manual for Familias 3
 Manual for Familias 3 Daniel Kling 1 (daniellkling@gmailcom) Petter F Mostad 2 (mostad@chalmersse) ThoreEgeland 1,3 (thoreegeland@nmbuno) 1 Oslo University Hospital Department of Forensic Services Oslo,
Algorithms for Genetics: Basics of Wright Fisher Model and Coalescent Theory
 Algorithms for Genetics: Basics of Wright Fisher Model and Coalescent Theory Vineet Bafna Harish Nagarajan and Nitin Udpa 1 Disclaimer Please note that a lot of the text and figures here are copied from
Autosomal-DNA. How does the nature of Jewish genealogy make autosomal DNA research more challenging?
 Autosomal-DNA How does the nature of Jewish genealogy make autosomal DNA research more challenging? Using Family Finder results for genealogy is more challenging for individuals of Jewish ancestry because
[CLIENT] SmithDNA1701 DE January 2017
![[CLIENT] SmithDNA1701 DE January 2017](/thumbs/93/113058427.jpg "[CLIENT] SmithDNA1701 DE January 2017") [CLIENT] SmithDNA1701 DE1704205 11 January 2017 DNA Discovery Plan GOAL Create a research plan to determine how the client s DNA results relate to his family tree as currently constructed. The client s
[CLIENT] SmithDNA1701 DE1704205 11 January 2017 DNA Discovery Plan GOAL Create a research plan to determine how the client s DNA results relate to his family tree as currently constructed. The client s
Population Structure and Genealogies
 Population Structure and Genealogies One of the key properties of Kingman s coalescent is that each pair of lineages is equally likely to coalesce whenever a coalescent event occurs. This condition is
SNP variant discovery in pedigrees using Bayesian networks. Amit R. Indap
 SNP variant discovery in pedigrees using Bayesian networks Amit R. Indap 1 1 Background Next generation sequencing technologies have reduced the cost and increased the throughput of DNA sequencing experiments
Need a little help with the lab?
 Need a little help with the lab? Alleles are corresponding pairs of genes located on an individual s chromosomes. Together, alleles determine the genotype of an individual. The Genotype describes the specific
Forensic use of Y chromosome DNA: a general overview
 DOI 10.1007/s00439-017-1776-9 REVIEW Forensic use of Y chromosome DNA: a general overview Manfred Kayser 1 Received: 5 February 2017 / Accepted: 8 March 2017 The Author(s) 2017. This article is an open
What Can I Learn From DNA Testing?
 What Can I Learn From DNA Testing? From where did my ancestors migrate? What is my DNA Signature? Was my ancestor a Jewish Cohanim Priest? Was my great great grandmother really an Indian Princes? I was
Bayesian parentage analysis with systematic accountability of genotyping error, missing data, and false matching
 Genetics and population analysis Bayesian parentage analysis with systematic accountability of genotyping error, missing data, and false matching Mark R. Christie 1,*, Jacob A. Tennessen 1 and Michael
Populations. Arindam RoyChoudhury. Department of Biostatistics, Columbia University, New York NY 10032, U.S.A.,
 Change in Recessive Lethal Alleles Frequency in Inbred Populations arxiv:1304.2955v1 [q-bio.pe] 10 Apr 2013 Arindam RoyChoudhury Department of Biostatistics, Columbia University, New York NY 10032, U.S.A.,
COMMUNITY UNIT SCHOOL DISTRICT 200 Science Curriculum Philosophy
 COMMUNITY UNIT SCHOOL DISTRICT 200 Science Curriculum Philosophy Science instruction focuses on the development of inquiry, process and application skills across the grade levels. As the grade levels increase,
Bioinformatics I, WS 14/15, D. Huson, December 15,
 Bioinformatics I, WS 4/5, D. Huson, December 5, 204 07 7 Introduction to Population Genetics This chapter is closely based on a tutorial given by Stephan Schiffels (currently Sanger Institute) at the Australian
Ewing Surname Y-DNA Project Article 8
 Ewing Surname Y-DNA Project Article 8 This is the eighth in a series of articles about the Ewing Surname Y-DNA Project. The previous seven articles have appeared in the last seven issues of the Journal
Introduction to Autosomal DNA Tools
 GENETIC GENEALOGY JOURNEY Debbie Parker Wayne, CG, CGL Introduction to Autosomal DNA Tools Just as in the old joke about a new genealogist walking into the library and asking for the book that covers my
DNA Testing. February 16, 2018
 DNA Testing February 16, 2018 What Is DNA? Double helix ladder structure where the rungs are molecules called nucleotides or bases. DNA contains only four of these nucleotides A, G, C, T The sequence that
Optimum contribution selection conserves genetic diversity better than random selection in small populations with overlapping generations
 Optimum contribution selection conserves genetic diversity better than random selection in small populations with overlapping generations K. Stachowicz 12*, A. C. Sørensen 23 and P. Berg 3 1 Department
TRACK 1: BEGINNING DNA RESEARCH presented by Andy Hochreiter
 TRACK 1: BEGINNING DNA RESEARCH presented by Andy Hochreiter 1-1: DNA: WHERE DO I START? Definition Genetic genealogy is the application of genetics to traditional genealogy. Genetic genealogy uses genealogical
University of Washington, TOPMed DCC July 2018
 Module 12: Comput l Pipeline for WGS Relatedness Inference from Genetic Data Timothy Thornton (tathornt@uw.edu) & Stephanie Gogarten (sdmorris@uw.edu) University of Washington, TOPMed DCC July 2018 1 /
DAR POLICY STATEMENT AND BACKGROUND Using DNA Evidence for DAR Applications
 Effective January 1, 2014, DAR will begin accepting Y-DNA evidence in support of new member applications and supplemental applications as one element in a structured analysis. This analysis will use a
DNA Basics. OLLI: Genealogy 101 October 1, ~ Monique E. Rivera ~
 DNA Basics OLLI: Genealogy 101 October 1, 2018 ~ Monique E. Rivera ~ WHAT IS DNA? DNA (deoxyribonucleic acid) is found in every living cell everywhere. It is a long chemical chain that tells our cells
Meek DNA Project Group B Ancestral Signature
 Meek DNA Project Group B Ancestral Signature The purpose of this paper is to explore the method and logic used by the author in establishing the Y-DNA ancestral signature for The Meek DNA Project Group
DNA Testing What you need to know first
 DNA Testing What you need to know first This article is like the Cliff Notes version of several genetic genealogy classes. It is a basic general primer. The general areas include Project support DNA test
DNA Basics, Y DNA Marker Tables, Ancestral Trees and Mutation Graphs: Definitions, Concepts, Understanding
 DNA Basics, Y DNA Marker Tables, Ancestral Trees and Mutation Graphs: Definitions, Concepts, Understanding by Dr. Ing. Robert L. Baber 2014 July 26 Rights reserved, see the copyright notice at http://gengen.rlbaber.de
Pizza and Who do you think you are?
 Pizza and Who do you think you are? an overview of one of the newest and possibly more helpful developments in researching genealogy and family history that of using DNA for research What is DNA? Part
Genealogical trees, coalescent theory, and the analysis of genetic polymorphisms
 Genealogical trees, coalescent theory, and the analysis of genetic polymorphisms Magnus Nordborg University of Southern California The importance of history Genetic polymorphism data represent the outcome