The Virginia Tech U.S. Forest Service December 2016 Housing Commentary: Section I
|
|
|
- Everett Alexander
- 5 years ago
- Views:
Transcription


1 The Virginia Tech U.S. Forest Service December 2016 Housing Commentary: Section I Urs Buehlmann Department of Sustainable Biomaterials College of Natural Resources & Environment Virginia Tech Blacksburg, VA buehlmann@gmail.com Delton Alderman Forest Products Marketing Unit Forest Products Laboratory U.S. Forest Service Madison, WI dalderman@fs.fed.us 2017 Virginia Polytechnic Institute and State University VCE-ANR250NP Virginia Cooperative Extension programs and employment are open to all, regardless of age, color, disability, gender, gender identity, gender expression, national origin, political affiliation, race, religion, sexual orientation, genetic information, veteran status, or any other basis protected by law. An equal opportunity/affirmative action employer. Issued in furtherance of Cooperative Extension work, Virginia Polytechnic Institute and State University, Virginia State University, and the U.S. Department of Agriculture cooperating. Edwin J. Jones, Director, Virginia Cooperative Extension, Virginia Tech, Blacksburg; M. Ray McKinnie, Administrator, 1890Extension Program, Virginia State University, Petersburg.
2 Table of Contents Slide 3: Summary Slide 4: Housing Scorecard Slide 5: Wood Use in Construction Slide 7: 2017 Housing Forecasts Slide 11: New Housing Starts Slide 16: Regional Housing Starts Slide 27: New Housing Permits Slide 29: Regional New Housing Permits Slide 36: Housing Under Construction Slide 38: Regional Under Construction Slide 43: Housing Completions Slide 46: Regional Housing Completions Slide 49: New Single-Family House Sales Slide 53: New Sales-Population Ratio Slide 53: Regional SF House Sales & Price Slide 61: Construction Spending Slide 64: Construction Spending Shares Slide 69: Existing House Sales Slide 70: Existing Sales by Price & Region Slide 73: First-Time Purchasers Slide 76: Affordability Slide 80: Summary Slide 81: Virginia Tech Disclaimer Slide 82: USDA Disclaimer This report is a free monthly service of Virginia Tech. Past issues can be found at: To request the report, please buehlmann@gmail.com
3 Summary In December 2016, aggregate monthly housing data were mixed. Overall permits declined month-over-month and in creased minimally year-over-year. Single-family permits declined month-over-month. New single-family house construction spending improved minimally on a month-over-month basis and year-over-year basis. The February 9th Atlanta Fed GDPNow model projects aggregate residential investment spending to increase at a 5.3 percent seasonally adjusted annual rate in Quarter 1; new residential investment spending was estimated at 10.2 percent; and improvements were projected 3.3 percent. 1 Regionally, data were mixed across all sectors. In this month s issue, we present several 2017 new housing forecasts. In aggregate, these projections have decreased slightly from the 2016 forecasts. This month s commentary also contains relevant housing data; data exploration; new single- and multifamily and existing housing data; economic information; and demographics. Section I contains data and commentary and Section II includes Federal Reserve analysis; private indicators; and demographic commentary. We hope you find this commentary beneficial. Sources: 1 2/9/17
4 December 2016 Housing Scorecard M/M Y/Y Housing Starts 11.3% 5.7% Single-Family Starts 4.0% 3.9% Housing Permits 0.2% 0.7% Single-Family Permits 4.7% 10.7% Housing Completions 7.9% 8.7% New Single-Family House Sales 10.4% 0.4% Private Residential Construction Spending 0.5% 3.7% Single-Family Construction Spending 0.5% 0.3% Existing House Sales 1 2.8% 0.7% M/M = month-over-month; Y/Y = year-over-year; NC = no change Source: U.S. Department of Commerce-Construction; 1 National Association of Realtors (NAR )
5 New Construction s Percentage of Wood Products Consumption 22% Non-structural panels: New Housing Structural panels: New housing 78% Other markets 64% 36% Other markets 29% All Sawnwood: New housing 71% Other markets Source: U.S. Forest Service. Howard, J. and D. McKeever U.S. Forest Products Annual Market Review and Prospects,
6 Repair and Remodeling s Percentage of Wood Products Consumption 14% Non-structural panels: Remodeling 22% Structural panels: Remodeling Other markets Other markets 86% 78% 23% All Sawnwood: Remodeling Other markets 77% Source: U.S. Forest Service. Howard, J. and D. McKeever U.S. Forest Products Annual Market Review and Prospects,
7 2017 Housing Forecasts* Total starts, range: 1,170 to 1,360 Median: 1,262 Single-family starts, range: 795 to 893 Median: 856 New house sales, range: 610 to 680 Median: 642 Organization Total Starts Single- Family Starts APA - The Engineered Wood Association a 1, Bank of Montreal b 1,320 Bloomberg c 1,250 Blue Chip d 1,260 The Conference Board e 1,280 Deloitte f 1,270 Dodge Data & Analytics g 1, Export Development Canada h +13 % New House Sales Fannie Mae i 1, Freddie Mac j 1,360 Forest Economic Advisors k 1, * All in thousands of units
8 2017 Housing Forecasts* Organization Total Starts Forisk l 1,250 Single-Family Starts New House Sales Home Advisor m 1, Goldman Sachs n 1, Merrill Lynch o 1, Metrostudy p 1,256 Mortgage Bankers Association q 1, National Association of Homebuilders r 1, National Association of Realtors s 1, PiperJaffray t 1, Royal Bank of Canada (RBC) u 1,212 Scotia Bank v 1,300 TD Economics w 1,240 The Federal Reserve Bank of Chicago x 1,200 UCLA Ziman Center for Real Estate y 1,200 to 1,250 Wells Fargo z 1, * All in thousands of units
9 2017 Housing Forecasts References a-random Lengths, Volume 73, Issue 1 (1/6/17) b- c- d- e- f- g- h- i- j- k-random Lengths, Volume 73, Issue 1 (1/6/17) l- m-
10 2017 Housing Forecasts References n- o- p- q- r- s- t- u- v- w- x- y- z-
11 New Housing Starts Total Starts SF Starts MF 2-4 Starts MF 5 Starts December 1,226, ,000 14, ,000 November 1,102, ,000 3, , ,160, ,000 16, ,000 M/M 11.3% -4.0% 366.7% 53.9% Y/Y change 5.7% 3.9% -12.5% 10.3% * All start data are presented at a seasonally adjusted annual rate (SAAR). ** US DOC does not report 2 to 4 multifamily starts directly, this is an estimation ((Total starts (SF + 5 unit MF)). Source: 1/19/17
12 Total Housing Starts 2,000 1,750 1,500 SAAR = Seasonally adjusted annual rate; in thousands Total starts 57-year average: 1,443 mm units SF starts 57-year average: 1,025 mm units MF starts 52-year average: 420 m units 1,250 1, Total December Starts: 1,226 mm units SF Starts 2-4 MF Starts 5 MF Starts Source: 1/19/17
13 New SF Starts to 54 SF starts: 1/1/59 to 7/1/07 ratio: to 54 year old classification: 1/19/17 ratio: All SF starts: 1/1/63 to 7/1/07 ratio: All SF Starts: 1/27/17 ratio: Ratio: SF Housing Starts/Civilian Noninstitutional Population Ratio: SF Housing Starts/Civilian Noninstitutional Population (20-54) New SF starts adjusted for the US population From January 1959 to July 2007, the long-term ratio of new SF starts to the total US noninstitutionalized population was ; in December 2016 it was a minimal decrease from November (0.0033). The ratio of non-institutionalized population, aged 24 to 54 (long-term ratio) is ; in December 2016 it was a decrease from November (0.0056). From a population viewpoint, construction is less than what is necessary for changes in population (i.e., under-building). Sources: and The Federal Reserve Bank of St. Louis; 1/19/17
14 Total Housing Starts: Six-Month Average 1400 Total Starts SAAR; in thousands Percentage change Jan 2016 Feb 2016 Mar 2016 Apr 2016 May 2016 Jun 2016 Jul 2016 Aug 2016 Sep 2016 Oct 2016 Nov 2016 Dec 2016 Total Starts Total Starts-6-mo. Ave. Total Starts-6-mo. percentage change -1.5 Source: 1/19/17
15 SF Housing Starts: Six-Month Average 900 SF Starts SAAR; in thousands Percentage change Jan 2016 Feb 2016 Mar 2016 Apr 2016 May 2016 Jun 2016 Jul 2016 Aug 2016 Sep 2016 Oct 2016 Nov 2016 Dec 2016 SF Starts Single Starts-6-mo. Ave. Single Starts-6-mo. percentage change -3.0 Source: 1/19/17
16 New Housing Starts by Region NE Total NE SF NE MF** December 96,000 62,000 34,000 November 81,000 59,000 22, ,000 63,000 93,000 M/M change 18.5% 5.1% 54.5% Y/Y change -38.5% -1.6% -63.4% MW Total MW SF MW MF December 227, , ,000 November 173, ,000 32, , ,000 52,000 M/M change 31.2% -9.9% 212.5% Y/Y change 38.4% 13.4% 92.3% All data are SAAR; NE = Northeast and MW = Midwest. ** US DOC does not report multifamily starts directly, this is an estimation (Total starts SF starts). Source: 1/19/17
17 New Housing Starts by Region S Total S SF S MF** December 572, , ,000 November 580, , , , , ,000 M/M change -1.4% -7.4% 18.7% Y/Y change -3.2% -1.7% -7.0% W Total W SF W MF December 331, , ,000 November 268, ,000 86, , ,000 79,000 M/M change 23.5% 6.0% 60.5% Y/Y change 32.9% 13.5% 74.7% All data are SAAR; S = South and W = West. ** US DOC does not report multifamily starts directly, this is an estimation (Total starts SF starts). Source: 1/19/17
18 Total Housing Starts by Region 1,100 SAAR; in thousands 1, Total NE Starts Total MW Starts Total S Starts Total W Starts Source: 1/19/17
19 SF Housing Starts by Region 900 SAAR; in thousands NE SF Starts MW SF Starts S SF Starts W SF Starts Source: 1/19/17
20 Nominal & SAAR SF Housing Starts LHS: SAAR; in thousands RHS: Non-adjusted; in thousands December 2015 and December Jul Aug 2015 Sep 2015 Oct 2015 Nov 2015 Dec 2015 Jan 2016 Feb Mar 2016 Apr 2016 May 2016 Jun 2016 Jul 2016 Aug 2016 Sep 2016 Oct 2016 Nov 2016 Dec New SF Starts (adj) Apparent Expansion Factor New SF Starts (non-adj) Nominal and Adjusted New SF Monthly Sales Presented above is nominal (non-adjusted) new SF start data contrasted against SAAR data. The apparent expansion factor is the ratio of the unadjusted number of houses started in the US to the seasonally adjusted number of houses started in the US (i.e., to the sum of the seasonally adjusted values for the four regions). U.S. DOC-Construction Source: 1/19/17
21 MF Housing Starts by Region 250 SAAR; in thousands NE MF Starts MW MF Starts S MF Starts W MF Starts Source: 1/19/17
22 MF 2017 Forecast Multifamily 2017 Outlook: Positioned for Further Growth The multifamily market has enjoyed several years of rapid growth and seems poised to continue to grow in 2017, although at a more moderate pace. Slow-but-steady economic growth continued in 2016, which supported strong demand for multifamily rental units. Despite high levels of construction permits and starts, vacancy rates remained flat, while strong demand pushed up rents and gross-income growth above the historical norm. A greater amount of new supply will be delivered to the market in 2017 but most of it will be absorbed, given continued economic growth and strong multifamily fundamentals. Vacancy rates will increase slightly, but still leave room for rent and gross-income growth. The top 10 list of fastest-growing metropolitan areas will see some jockeying for position in 2017, with smaller, more affordable markets making a showing. Multifamily Investments, Research & Modeling Team, FreddieMac Multifamily Source: 1/31/17
23 MF 2017 Forecast 2017: Moderation Is the Word The multifamily market will continue to grow in line with the historical average in Employment growth is expected to remain near 2016 growth levels and demand for multifamily units to stay strong due to lifestyle preferences and demographic trends. At a national level, multifamily completions are expected to be higher in 2017 than in 2016 but will continue to enter the market at a disciplined rate. As a result, vacancy rates will increase modestly in 2017 and are expected to breach 5 percent for the first time since 2011, although remain below the historical average. With employment growth higher than population growth and wages rising, demand for multifamily units will remain robust. Rents will grow at a pace in line with 2016 s rate and remain above the historical average in 2017, as shown in Exhibit 2. Multifamily Investments, Research & Modeling Team, FreddieMac Multifamily Source: 1/31/17
24 Housing Starts by Percent 100.0% 90.0% 80.0% 70.0% 78.5% 60.0% 64.8% 50.0% 40.0% 35.2% 30.0% 20.0% 21.5% 10.0% 0.0% Single-Family Starts - % Multi-Family Starts - % Source: 1/19/17
25 Railroad Lumber & Wood Shipments vs. U.S. SF Housing Starts 10,000 LHS: Lumber shipments in thousands RHS: SF Starts 1,400 9,000 8,000 1,200 7,000 1,000 6, ,000 4, , ,000 1,000 - Data are average weekly originations for each month, are not seasonally adjusted, and do not include intermodal. AAR Lumber & Wood Shipments (U.S. + Canada) SF Starts Sources: Association of American Railroads (AAR), Rail Time Indicators report 1/6/17; U.S. DOC-Construction; 1/19/17 Return Return to TOC TOC
26 Railroad Lumber & Wood Shipments vs. U.S. SF Housing Starts: 6-month Offset 10,000 9,000 8,000 7,000 6,000 5,000 4,000 3,000 2,000 1,000 - LHS: Lumber shipments in thousands RHS: SF Starts Data are average weekly originations for each month, are not seasonally adjusted, and do not include intermodal. AAR 1,400 1,200 1, Lumber & Wood Shipments (U.S. + Canada) SF Starts (6-mo. offset) In this graph, January 2007 lumber shipments are contrasted with July 2007 SF starts, and continuing through November 2016 SF starts. The purpose is to discover if lumber shipments relate to future singlefamily starts. Also, it is realized that lumber and wood products are trucked; however, to our knowledge comprehensive trucking data is not available. Sources: Association of American Railroads (AAR), Rail Time Indicators report 1/6/17; U.S. DOC-Construction; 1/19/17 Return Return to TOC TOC
27 New Housing Permits Total Permits* SF Permits * All permit data are presented at a seasonally adjusted annual rate (SAAR). MF 2-4 unit Permits MF 5 unit Permits December 1,210, ,000 38, ,000 November 1,212, ,000 37, , ,201, ,000 35, ,000 M/M change Y/Y change Source: 1/19/17
28 Total New Housing Permits 2,200 2,000 SAAR; in thousands 1,800 1,600 1,400 Total November Permits: 1,201 m units 1,200 1, SF Permits 2-4 MF Permits 5 MF Permits Source: 1/19/17
29 New Housing Permits by Region NE Total NE SF NE MF December 113,000 55,000 58,000 November 110,000 55,000 55, ,000 58, ,000 M/M change Y/Y change MW Total MW SF MW MF December 189, ,000 68,000 November 188, ,000 66, , ,000 55,000 M/M change Y/Y change * All data are SAAR. Source: 1/19/17
30 New Housing Permits by Region S Total S SF S MF December 568, , ,000 November 585, , , , , ,000 M/M change Y/Y change W Total W SF W MF December 340, , ,000 November 329, , , , , ,000 M/M change Y/Y change * All data are SAAR. Source: 1/19/17
31 Total Housing Permits by Region 1,200 SAAR; in thousands 1, Total NE Permits Total MW Permits Total S Permits Total W Permits Source: 1/19/17
32 SF Housing Permits by Region 900 SAAR; in thousands NE SF Permits MW SF Permits S SF Permits W SF Permits Source: 1/19/17
33 MF Housing Permits by Region 225 SAAR; in thousands NE MF Permits MW MF Permits S MF Permits W MF Permits Source: 1/19/17
34 Railroad Lumber & Wood Shipments vs. U.S. SF Housing Permits 10,000 LHS: Lumber shipments in thousands RHS: SF Permits ,000 8, , ,000 5, ,000 3, ,000 1,000 - Data are average weekly originations for each month, are not seasonally adjusted, and do not include intermodal. AAR Lumber & Wood Shipments (U.S. + Canada) SF Permits Sources: Association of American Railroads (AAR), Rail Time Indicators report 1/6/17; U.S. DOC-Construction; 1/19/17 Return Return to TOC TOC
35 Railroad Lumber & Wood Shipments vs. U.S. SF Housing Starts: 3-month Offset 10,000 9,000 8,000 7,000 6,000 5,000 4,000 3,000 LHS: Lumber shipments in thousands RHS: SF Permits ,000 1,000 - Data are average weekly originations for each month, are not seasonally adjusted, and do not include intermodal. AAR Lumber & Wood Shipments (U.S. + Canada) SF Permits (3-mo. offset) In this graph, January 2007 lumber shipments are contrasted with April 2007 SF permits, and continuing through November 2016 SF permits. The purpose is to discover if lumber shipments relate to future singlefamily starts. Also, it is realized that lumber and wood products are trucked; however, to our knowledge comprehensive trucking data is not available. Sources: Association of American Railroads (AAR), Rail Time Indicators report 1/6/17; U.S. DOC-Construction; 1/19/17 Return Return to TOC TOC
36 New Housing Under Construction Total Under Construction* SF Under Construction All housing under construction data are presented at a seasonally adjusted annual rate (SAAR). ** US DOC does not report 2-4 multifamily units under construction directly, this is an estimation ((Total under construction (SF + 5 unit MF)). MF 2-4 unit** Under Construction MF 5 unit Under Construction December 1,054, ,000 11, ,000 November 1,043, ,000 11, , , ,000 11, ,000 M/M change 1.1% 0.9% 0.0% 1.2% Y/Y change 8.0% 7.4% 0.0% 8.6% Source: 1/19/17
37 Total Housing Under Construction 1,100 1,000 SAAR; in thousands Total November Under Construction: 1,054 mm units SF Under Construction 2-4 MF Under Construction 5 MF Under Construction Source: 1/19/17
38 New Housing Under Construction by Region NE Total NE SF NE MF** December 189,000 53, ,000 November 191,000 52, , ,000 49, ,000 M/M change -1.0% 1.9% -2.2% Y/Y change 5.6% 8.2% 4.6% MW Total MW SF MW MF December 143,000 75,000 68,000 November 142,000 74,000 68, ,000 68,000 62,000 M/M change 0.7% 1.4% 0.0% Y/Y change 10.0% 10.3% 9.7% All data are SAAR; NE = Northeast and MW = Midwest. ** US DOC does not report multifamily units under construction directly, this is an estimation (Total under construction SF under construction). Source: 1/19/17
39 New Housing Under Construction by Region S Total S SF S MF** December 444, , ,000 November 440, , , , , ,000 M/M change 0.9% -0.5% 2.2% Y/Y change 3.5% 1.9% 5.0% W Total W SF W MF December 278, , ,000 November 270, , , ,000 94, ,000 M/M change 3.0% 2.8% 3.1% Y/Y change 16.8% 17.0% 16.7% All data are SAAR; S = South and W = West. ** US DOC does not report multifamily units under construction directly, this is an estimation (Total under construction SF under construction). Source: 1/19/17
40 Total Housing Under Construction by Region 700 SAAR; in thousands Total NE Under Construction Total MW Under Construction Total S Under Construction Total W Under Construction Source: 1/19/17
41 SF Housing Under Construction by Region 450 SAAR; in thousands NE SF Under Construction MW SF Under Construction S SF Under Construction W SF Under Construction Source: 1/19/17
42 MF Housing Under Construction by Region SAAR; in thousands NE MF Under Construction MW MF Under Construction S MF Under Construction W MF Under Construction Source: 1/19/17
43 New Housing Completions Total Completions* SF Completions All completion data are presented at a seasonally adjusted annual rate (SAAR). MF 2-4 unit** Completions ** US DOC does not report multifamily completions directly, this is an estimation ((Total completions (SF + 5 unit MF)). MF 5 unit Completions December 1,123, ,000 7, ,000 November 1,219, ,000 11, , ,033, ,000 9, ,000 M/M change -7.9% -0.9% -36.4% -19.3% Y/Y change 8.7% 7.5% -22.2% 12.3% Source: 1/19/17
44 Total Housing Completions 1,800 SAAR; in thousands 1,600 1,400 1,200 Total November Completions: 1,223 m units 1, Total SF Completions Total 2-4 MF Completions Total 5 MF Completions Source: 1/19/17
45 New Housing Completions by Region 1,000 SAAR; in thousands Total NE Completions Total MW Completions Total S Completions Total W Completions All data are SAAR; NE = Northeast and MW = Midwest. ** US DOC does not report multifamily completions directly, this is an estimation (Total completions SF completions). Source: 1/19/17
46 Total Housing Completions by Region NE Total NE SF NE MF** December 114,000 51,000 63,000 November 113,000 48,000 65, ,000 49,000 41,000 M/M change 0.9% 6.3% -3.1% Y/Y change 26.7% 4.1% 53.7% MW Total MW SF MW MF December 184, ,000 71,000 November 187, ,000 59, , ,000 38,000 M/M change -1.6% -11.7% 20.3% Y/Y change 20.3% -1.7% 86.8% All data are SAAR; NE = Northeast and MW = West. ** US DOC does not report multi-family completions directly, this is an estimation (Total completions SF completions). Source: 1/19/17
47 Total Housing Completions by Region S Total S SF S MF** December 604, , ,000 November 698, , , , , ,000 M/M change -13.5% -0.7% -34.3% Y/Y change 19.8% 12.9% 41.5% W Total W SF W MF December 221, ,000 54,000 November 221, ,000 62, , , ,000 M/M change 0.0% 5.0% -12.9% Y/Y change -22.7% 2.5% -56.1% All data are SAAR; S = South and W = West. ** US DOC does not report multi-family completions directly, this is an estimation (Total completions SF completions). Source: 1/19/17
48 SF Housing Completions by Region 900 SAAR; in thousands NE SF Completions MW SF Completions S SF Completions W SF Completions Source: 1/19/17
49 New Single-Family House Sales New SF Sales* Median Price Mean Price Month's Supply December 536, , , November 598, , , , , , M/M change -10.4% 4.3% 5.1% 16.0% Y/Y change -0.4% 7.9% 7.2% 11.5% * All sales data are presented at a seasonally adjusted annual rate (SAAR). Source: 1/27/17
50 New SF House Sales 1,400 SAAR; in thousands 1,200 1, average: 652,679 units average: 633,895 units December 2016: 536, Jan Feb Mar Apr May Jun Jul Aug Sep Oct Nov Dec Total SF Sales Source: 1/27/17
51 New SF House Sales LHS: Nominal & Expansion Factors Nominal & SF data, in thousands RHS: New SF SAAR Contrast of December 2015 and December New SF sales (adj) Apparent Expansion Factor New SF sales (non-adj) Nominal and Adjusted New SF Monthly Sales Presented above is nominal (non-adjusted) new SF sales data contrasted against SAAR data. The apparent expansion factor is the ratio of the unadjusted number of houses sold in the US to the seasonally adjusted number of houses sold in the US (i.e., to the sum of the seasonally adjusted values for the four regions). U.S. DOC-Construction Source: 1/27/17
52 New SF House Sales to 54 year old classification new sales: 1/1/63 to 12/31/07 ratio: All new sales: 1/1/63 to 12/31/07 ratio: to 54: 1/27/17 ratio: All new sales: 1/27/17 ratio: Ratio of New SF Sales/Civilian Noninstitutional Population Ratio of New SF Sales/Civilian Noninstitutional Population (24-54) New SF sales adjusted for the US population From January 1963 to December 2007, the long-term ratio of new house sales to the total US noninstitutionalized population was ; in December 2016 it was a minimal decrease from November (0.0023). The ratio of non-institutionalized population, aged 24 to 54 (long-term ratio ) is ; in December 2016 it was a decrease from November (0.0041). From a population viewpoint, construction is less than what is necessary for changes in population (i.e., under-building). Sources: and The Federal Reserve Bank of St. Louis; 1/27/17
53 New SF House Sales by Region and Price Category NE SF Sales MW SF Sales S SF Sales W SF Sales December 46,000 49, , ,000 November 31,000 83, , , ,000 69, , ,000 M/M change 48.4% -41.0% -12.6% -1.3% Y/Y change 48.4% -29.0% 0.0% 2.0% $150m $150 - $199.9m $ m $300 - $399.9m $400 - $499.9m $500 - $749.9m $750m December 1,2 1,000 4,000 11,000 9,000 5,000 5,000 3,000 November 1,000 4,000 14,000 11,000 5,000 5,000 2, ,000 5,000 12,000 7,000 5,000 4,000 2,000 M/M change 0.0% 0.0% -21.4% -18.2% 0.0% 0.0% 50.0% Y/Y change -50.0% -20.0% -8.3% 28.6% 0.0% 25.0% 50.0% All data are SAAR. 1 Houses for which sales price were not reported have been distributed proportionally to those for which sales price was reported; 2 Detail June not add to total because of rounding. Source: 1/27/17
54 New SF House Sales by Region SAAR; in thousands NE SF Sales MW SF Sales S SF Sales W SF Sales Source: 1/27/17
55 New SF House Sales by Price Category ; in thousands, and thousands of dollars; SAAR Total New SF Sales*: 501 mm units < $150 $150-$199.9 $ $300-$399.9 $400-$499.9 $500-$749.9 > $750 * Sales tallied by price category. Source: 8/23/16
56 New SF House Sales by Price Category 18 in thousands and thousands of dollars; SAAR Jan 2016 Feb 2016 Mar 2016 Apr 2016 May 2016 Jun 2016 Jul 2016 Aug 2016 Sep 2016 Oct 2016 Nov 2016 Dec 2016 < $150 $150-$199.9 $ $300-$399.9 $400-$499.9 $500-$749.9 > $750 Source: 1/27/17
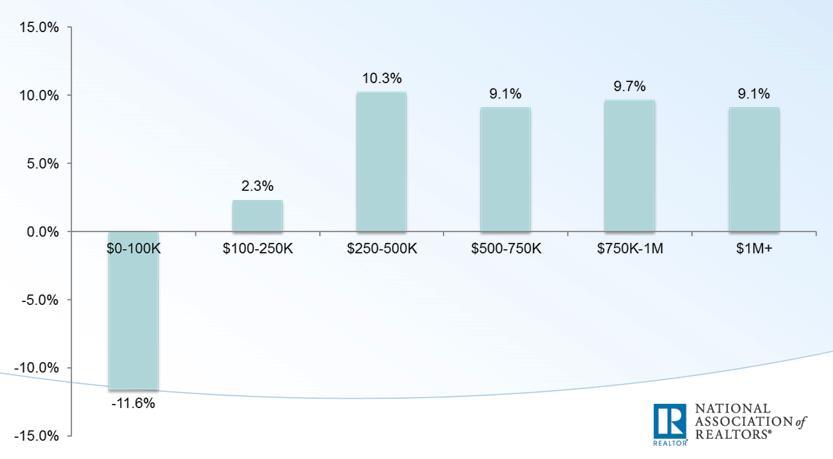
57 New SF House Sales December New Sales $750m, 3,000, 7.9% $150m, 1,000, 2.6% $150-$199.9m, 4,000, 10.5% $500-$749.9m, 5,000, 13.2% $400-$499.9m, 5,000, 13.2% $ m, 11,000, 28.9% $300-$399.9m, 9,000, 23.7% $150m $150-$199.9m $ m $300-$399.9m $400-$499.9m $500-$749.9m $750m Source: 1/27/17
58 New SF House Sales 100.0% 90.0% 92.4% 80.0% 70.0% 60.0% 65.8% 50.0% 40.0% 30.0% 34.2% 20.0% 10.0% 0.0% 7.6% % of Sales: < $400m % of Sales: > $400 New SF Sales: 2002 December 2016 The sales share of $400 thousand plus SF houses is presented above. Since the beginning of 2012, the upper priced houses have and are garnering a greater percentage of sales. Several reasons are offered by industry analysts; 1) builders can realize a profit on higher priced houses; 2) historically low interest rates have indirectly resulted in increasing house prices; and 3) purchasers of upper end houses fared better financially coming out of the Great Recession. Source: 1/27/17
59 Railroad Lumber & Wood Shipments vs. U.S. New SF House Sales 10,000 LHS: Lumber shipments in thousands RHS: SF Sales 900 9, , , , ,000 4, , , ,000 - Data are average weekly originations for each month, are not seasonally adjusted, and do not include intermodal. AAR Lumber & Wood Shipments (U.S. + Canada) New SF Sales Sources: Association of American Railroads (AAR), Rail Time Indicators report 1/6/17; U.S. DOC-Construction; 1/27/17 Return Return to TOC TOC
60 Railroad Lumber & Wood Shipments vs. U.S. New SF House Sales: 1-year offset 10,000 9,000 LHS: Lumber shipments in thousands RHS: SF Sales ,000 7,000 6,000 5,000 4,000 3,000 2, ,000 - Data are average weekly originations for each month, are not seasonally adjusted, and do not include intermodal. AAR Lumber & Wood Shipments (U.S. + Canada) New SF Sales (1-yr. offset) In this graph, initially January 2007 lumber shipments are contrasted with January 2008 new SF sales through December 2016 new SF sales. The purpose is to discover if lumber shipments relate to future new SF house sales. Also, it is realized that lumber and wood products are trucked; however, to our knowledge comprehensive trucking data is not available. Sources: Association of American Railroads (AAR), Rail Time Indicators report 1/6/17; U.S. DOC-Construction; 1/27/17 Return Return to TOC TOC
61 December 2016 Construction Spending 2016 December Total Private Residential Construction: $466.9 billion (SAAR) 0.5% more than the revised November estimate of $464.8 billion (SAAR) 3.7% greater than the December 2015 estimate of $450.1 billion (SAAR) December SF construction: $250.4 billion (SAAR) 0.5% more than November: $249.0 billion (SAAR) 0.3% greater than December 2015: $249.7 billion (SAAR) December MF construction: $63.7 billion (SAAR) 2.8% more than November: $61.9 billion (SAAR) 11.7% greater than December 2015: $57.1 billion (SAAR) December Improvement C construction: $152.8 billion (SAAR) -0.6% less than November: $153.8 billion (SAAR) 6.8% more than December 2015: $143.4 billion (SAAR) C The US DOC does not report improvement spending directly, this is a monthly estimation for 2016: ((Total Private Spending (SF spending + MF spending)). All data are SAARs and reported in nominal US$. Source: 2/1/17
62 Total Construction Spending (nominal): 1993 December SAAR; in millions of US dollars Total Private Nominal Construction Spending: $466,938 bil , , ,725 Total Residential Spending (nominal) SF Spending (nominal) MF Spending (nominal) Remodeling Spending (nominal) Reported in nominal US$. The US DOC does not report improvement spending directly, this is a monthly estimation for Source: 2/1/17
63 Total Construction Spending (adjusted): * $800,000 $700,000 Total Private Adjusted Construction Spending SAAR; in millions of US dollars (adj.) $600,000 $500,000 $400,000 $300,000 $200,000 $100,000 $0 Total Residential Spending (adj.) SF Spending (adj.) MF Spending (adj.) Remodeling Spending (adj.) Reported in adjusted US$: (adjusted for inflation, BEA Table 1.1.9); *January-November 2016 reported in nominal US$. Source: 2/1/17
64 Construction Spending Shares: 1993 to November SF, MF, & RR: Percent of Total Residential Spending SF % MF % RR % Total Residential Spending: 1993 through 2006 SF spending average: 69.2 % MF spending average: 7.5 %; Residential remodeling (RR) spending average: 23.3 % (SAAR). Note: 1993 to 2015 (adjusted for inflation, BEA Table 1.1.9); January-November 2016 reported in nominal US$. Source: and 2/1/17
65 Construction Spending & Starts: 2010 to December 2016 $300,000 LHS: New SF spending, SAAR; in millions of U.S. dollars RHS: New SF starts, SAAR; in thousands $250, $250, $200, $150, $100, $50, $0 Jan 2010 May 2010 Sep 2010 Jan 2011 May 2011 Sep 2011 Jan 2012 May 2012 Sep 2012 Jan 2013 May 2013 Sep 2013 Jan 2014 May 2014 Sep 2014 Jan 2015 May 2015 Sep 2015 Jan 2016 May 2016 Sep New SF Spending New SF Starts New SF Residential contrasted against New SF Starts: 2010 through 2016 In the above graph, new SF construction spending is compared to new SF starts. Generally, as SF starts increase so does spending. However, there are other factors involved: house size, amenities, lot price, location, etc. Note that 2016 spending is reported in nominal dollars. Source: and : 1/17/17-2/1/17
66 Construction Spending & Starts: 2016 $260,000 LHS: New SF spending, SAAR; in millions of U.S. dollars RHS: New SF starts, SAAR; in thousands 900 $255, $250,000 $250, $245, $240,000 $235, $230,000 Jan 2016 Feb 2016 Mar 2016 Apr 2016 May 2016 Jun 2016 Jul 2016 Aug 2016 Sep 2016 Oct 2016 Nov 2016 Dec New SF Spending New SF Starts New SF Residential contrasted against New SF Starts: 2016 As presented above, spending decoupled from starts in December. Given that it is one-month of data, we should pay attention to this relationship going forward. Note that 2016 spending is reported in nominal dollars. Source: and : 1/17/17-2/1/17
67 Remodeling New Benchmark Data Modestly Lowers Remodeling Market Size Projections The latest LIRA release projects national spending for home remodeling and repairs will grow to $317 billion in 2017, an increase of 6.7 percent from last year. Compared to last quarter s LIRA release, the updated LIRA now shows lower and less cyclical growth in homeowner improvement and repair spending in 2014 and 2015, a somewhat lower market size estimate, and also more modest projections for remodeling market growth in According to Joint Center tabulations of the AHS, spending in 2014 and 2015 was not quite as robust as the LIRA model predicted, growing 11.3 percent from $250 billion in 2013 to $278 billion in 2015 compared to LIRA estimated growth of 14.3 percent over this time period. As seen in Figure 1, the lower growth in remodeling spending in 2014 and 2015 has implications for the size of the market projected by the LIRA model for 2016 and Previously, the LIRA estimated a homeowner improvement and repair market size of $305 billion in 2016 and projected spending growing to $326 billion by the third quarter of this year. Now with the replacement of AHS-based benchmark data for previously modeled benchmark estimates, the LIRA model indicates remodeling activity reached $297 billion in 2016 and projects spending will reach $317 billion this year. The implication of slightly slower growth in actual remodeling and repair spending is a reduction in market size projections for 2017 of 2.9 percent or $9.5 billion. Incidentally, the more modest growth projected by the LIRA for 2017 compared to the prior release is not related to the addition of the new historical benchmark data. The LIRA projections revise routinely as the year-overyear trends in the LIRA inputs are updated or revised. Abbe Will, Research Analyst, JCHS Source: 1/19/17

68 Remodeling Source: 1/19/17
69 Existing House Sales National Association of Realtors (NAR ) December 2016 sales: million houses sold (SAAR) Distressed house sales: 7% of total sales (5% foreclosures and 2% short-sales); 6% in November and 8% in December All-cash sales: 21% and 21% in November, and 24% (December 2015). Individual investors still purchase a considerable portion of all cash sale houses 15% in December; 12% in November and 15% in December % of investors paid cash in December. Source: NAR 1/24/17
70 * All sales data: SAAR Existing House Sales Existing Sales* Median Price Mean Price Month's Supply December 5,490,000 $232,200 $274, November 5,650,000 $234,400 $276, ,450,000 $223,200 $266, M/M change -2.8% -0.9% -0.9% -7.7% Y/Y change 0.7% 4.0% 3.0% -7.7% NE Sales MW Sales S Sales W Sales December 760,000 1,280,000 2,250,000 1,200,000 November 810,000 1,330,000 2,250,000 1,260, ,000 1,250,000 2,240,000 1,220,000 M/M change -6.2% -3.8% 0.0% -4.8% Y/Y change 2.7% 2.4% 0.4% -1.6% Source: NAR 1/24/17
71 Total Existing House Sales SAAR; in thousands U.S. NE MW S W Source: NAR 1/24/17
72 Changes in Existing House Sales Source: NAR 1/24/17
73 First-Time Purchasers National Association of Realtors (NAR ) 32% of sales in December % in November 2016 and 32% in December American Enterprise Institute International Center on Housing Risk Credit remains readily available for first-time buyers, as risk levels set new series highs in October. The first-time buyer NMRI stood at 15.9% in October, up 0.2 percentage point from a year earlier, and well above the Repeat Primary Homebuyer NMRI of 8.6%. Nonbanks continue to account for a rising share of the purchase market. The gap in riskiness between banks and nonbanks, which boosted overall risk due to high nonbank MRI, continues to widen. Fueled by solid job gains, low mortgage rates, and high and growing leverage, the national seller s market is now in its 52nd month. The FHA hit a dubious milestone this month as First-Time Buyers using FHA had a Mortgage Risk Index of 25 percent, up from 21 percent in Helping fuel this increase was the 47 percent of First-Time Buyers with a total pre-tax debt-to-income ratio in excess of 43 percent. Edward Pinto, Codirector, American Enterprise Institute s (AEI s) International Center on Housing Risk Sources: 1/24/17; 1/25/17
74 First-Time Purchasers Urban Institute In October 2016, the first-time homebuyer share of GSE purchase loans continued to edge down slowly to 42.6 percent. The FHA has always been more focused on first-time homebuyers, with its first-time homebuyer share hovering around 80 percent and now stood at 82.2 percent in October 2016, down from the peak of 83.3 percent in May The table shows that based on mortgages originated in October 2016, the average first-time homebuyer was more likely than an average repeat buyer to take out a smaller loan and have a lower credit score and higher LTV and DTI, thus requiring a higher interest rate. Laurie Goodman et al., Codirector, Housing Finance Policy Center Sources: 1/31/17
75 Mortgage Credit Availability Higher Index = More Credit Available Lower Index = Less Credit Available Mortgage Credit Availability Increases in January The MCAI increased 1.1 percent to in January. A decline in the MCAI indicates that lending standards are tightening, while increases in the index are indicative of loosening credit. The index was benchmarked to 100 in March Of the four component indices, the Jumbo MCAI saw the greatest increase in availability over the month (up 4.7 percent), followed by the Conventional MCAI (up 2.3 percent), and the Government MCAI (up 0.2 percent). The Conforming MCAI decreased over the month (down 0.1 percent). Mortgage credit availability increased for the fifth consecutive month in January, driven by increased availability of jumbo loan programs. We saw a particular increase in agency jumbo programs that focus on loans in high cost areas that exceed the baseline conforming loan limit of $424,000 but which are still eligible for purchase by the GSEs. While the change in GSE loan limits may have had an indirect impact on the jumbo MCAI, there were other factors at play as several investors rolled out new jumbo loan programs in January. Lynn Fisher, Vice President of Research and Economics, Mortgage Bankers Association (MBA) Source: 2/7/17

 as compared to the production nonsupervisory sector (bottom).")
76 Housing Affordability Average Hourly Earnings & Purchase Only House Price Index For the every day American, housing affordability is problematic. As presented above, affordability is much better for the professional business sector (top) as compared to the production nonsupervisory sector (bottom). Source: 2/3/17
77 Housing Affordability 2017 Housing Forecast: Affordability Benefits South, Midwest while Western Growth Slows Affordability will be the name of the game over the course of 2017, as the past few years of relatively impressive price growth have pushed home prices closer to the peak levels of 2006, with several markets reaching above and beyond to all time highs. The national housing market will continue to grow, albeit markedly slower than in past years, with national home prices moderately increasing to the tune of 2.4%. However, western growth will be greatly limited due to a widespread lack of affordability in almost all of the major markets in the region, a key reason for its tempered growth over the course of Contrastingly, the traditionally lower priced and more affordable regions of the South and Midwest will set the pace for growth over the next year, while the luxury markets of the Northeast will again struggle to make impressive gains. In combination with affordability concerns already plaguing demand in some markets, the potential for additional interest rate increases over the coming year, as well as any potential market shake-ups due to the new presidential administration, could further jeopardize the housing market s now moderating recovery. We ll be on deck throughout the next year monitoring housing markets across the nation, but for now, our models are predicting softer growth for Alex Villacorta, Ph.D., Vice President of Research and Analytics, Clear Capital Source: 1/12/17
78 Housing Affordability Graph 1. National and Regional Annual Price Growth. Data through December Source: Clear Capital Source: 1/12/17

79 Housing Affordability National Housing Affordability Over Time Home prices are still very affordable by historical standards, despite increases over the last four years. Even if interest rates rose to 5.5 percent, affordability would be at the long term historical average. Laurie Goodman et al., Codirector, Housing Finance Policy Center Sources: CoreLogic, US Census, Freddie Mac, and Urban Institute Source: 1/31/17
80 In summary: Summary December s housing data were mixed. New SF starts and permits were negative. New SF sales decreased substantially; yet, were barely less than one-year ago. The lower-price tier categories faltered once again; the market needs consistent improvement in these categories to drive the overall housing construction market upward. Existing sales declined and increased very slightly on a yearover-year basis. New housing forecasts are similar from 2016; however, SF starts are projected to be somewhat more than 2106 s estimates. Housing, in the majority of categories, continues to be substantially less than their historical averages. The new SF housing sector is where the majority of forest products are used and this housing sector has room for improvement. Pros: Cons: 1) Historically low interest rates are still in effect, though incrementally rising; 2) As a result, housing affordability is good for most of but not all of the U.S.; 3) Select builders are beginning to focus on entry-level houses. 1) Lot availability and building regulations (according to several sources); 2) Changing attitudes towards SF ownership 3) Gentrification; 4) Job creation is improving and consistent but some economists question the quantity and types of jobs being created; 5) Debt: Corporate; personal; government United States and globally. 6) Other global uncertainties.
The Virginia Tech U.S. Forest Service June 2018 Housing Commentary: Section I
 The Virginia Tech U.S. Forest Service June Housing Commentary: Section I Urs Buehlmann Department of Sustainable Biomaterials College of Natural Resources & Environment Virginia Tech Blacksburg, VA 540.231.9759
The Virginia Tech U.S. Forest Service November 2018 Housing Commentary: Section I
 The Virginia Tech U.S. Forest Service November 2018 Housing Commentary: Section I Urs Buehlmann Department of Sustainable Biomaterials College of Natural Resources & Environment Virginia Tech Blacksburg,
The Virginia Tech U.S. Forest Service April 2018 Housing Commentary: Section I
 The Virginia Tech U.S. Forest Service April Housing Commentary: Section I Urs Buehlmann Department of Sustainable Biomaterials College of Natural Resources & Environment Virginia Tech Blacksburg, VA 540.231.9759
The Virginia Tech U.S. Forest Service January 2019 Housing Commentary: Section I
 The Virginia Tech U.S. Forest Service January 2019 Housing Commentary: Section I Urs Buehlmann Department of Sustainable Biomaterials College of Natural Resources & Environment Virginia Tech Blacksburg,
The Virginia Tech U.S. Forest Service November 2017 Housing Commentary: Section I
 The Virginia Tech U.S. Forest Service November 2017 Housing Commentary: Section I Urs Buehlmann Department of Sustainable Biomaterials College of Natural Resources & Environment Virginia Tech Blacksburg,
The Virginia Tech U.S. Forest Service October 2018 Housing Commentary: Section I
 The Virginia Tech U.S. Forest Service October 218 Housing Commentary: Section I Urs Buehlmann Department of Sustainable Biomaterials College of Natural Resources & Environment Virginia Tech Blacksburg,
The Virginia Tech U.S. Forest Service November 2015 Housing Commentary: Part A
 The Virginia Tech U.S. Forest Service November Housing Commentary: Part A Urs Buehlmann Department of Sustainable Biomaterials College of Natural Resources & Environment Virginia Tech Blacksburg, VA 54.231.9759
The Virginia Tech U.S. Forest Service July 2018 Housing Commentary: Section I
 The Virginia Tech U.S. Forest Service July 218 Housing Commentary: Section I Urs Buehlmann Department of Sustainable Biomaterials College of Natural Resources & Environment Virginia Tech Blacksburg, VA
The Virginia Tech U.S. Forest Service September 2016 Housing Commentary: Section I
 The Virginia Tech U.S. Forest Service September Housing Commentary: Section I Urs Buehlmann Department of Sustainable Biomaterials College of Natural Resources & Environment Virginia Tech Blacksburg, VA
The Virginia Tech U.S. Forest Service September 2017 Housing Commentary: Section I
 The Virginia Tech U.S. Forest Service September 2017 Housing Commentary: Section I Urs Buehlmann Department of Sustainable Biomaterials College of Natural Resources & Environment Virginia Tech Blacksburg,
The Virginia Tech U.S. Forest Service March 2017 Housing Commentary: Section I
 The Virginia Tech U.S. Forest Service March 217 Housing Commentary: Section I Urs Buehlmann Department of Sustainable Biomaterials College of Natural Resources & Environment Virginia Tech Blacksburg, VA
Real Estate Trends and Outlook
 Real Estate Trends and Outlook Lawrence Yun, Ph.D. Chief Economist NATIONAL ASSOCIATION OF REALTORS Presentation at NAR Region XII Conference Coeur d Alene, ID March 5, 2015 GDP Burst in 2014 Q2, Q3, Q4
Economic and Housing Market Outlook
 Economic and Housing Market Outlook By Lawrence Yun, Ph.D. Chief Economist, National Association of REALTORS Presentations At Raleigh Regional Association of REALTORS At Orange-Chatham Association of REALTORS
Economic & Real Estate Outlook. Tax Reform. Michigan 4/26/18
 Economic & Real Estate Outlook By Lawrence Yun, Ph.D. Chief Economist, National Association of REALTORS Presentations at Michigan REALTORS Broker Summit Plymouth, MI April 25, 2018 Tax Reform Mortgage
Economic & Housing Market Outlook
 Economic & Housing Market Outlook By Lawrence Yun, Ph.D. Chief Economist, National Association of REALTORS Presentations to NAR Annual Conference Boston, MA November 2, 2018 Existing Home Sales Since
Housing Market Outlook
 Housing Market Outlook By Lawrence Yun, Ph.D. Chief Economist, National Association of REALTORS Presentation at National Conference of State Legislatures Washington, DC December 7, 2018 Very Long Economic
Economic and Real Estate Market Outlook
 Economic and Real Estate Market Outlook By Lawrence Yun, Ph.D. Chief Economist, National Association of REALTORS Presentation at Miami International Congress Miami, FL November 1, 2016 Lifetime Wealth
Economic & Housing Outlook
 Economic & Housing Outlook By Lawrence Yun, Ph.D. Chief Economist, National Association of REALTORS Presentation at Northern Arizona Association of REALTORS November 30, 2017 Tax Reform Mortgage interest
GEORGE RATIU Director, Quantitative & Commercial Research National Association of REALTORS
 GEORGE RATIU Director, Quantitative & Commercial Research National Association of REALTORS 2015 CCIM Commercial Real Estate Outlook Conference Wednesday, January 21, 2015 Coral Gables, FL Where Are We
Welcome to the 10 th Annual Real Estate Symposium for The Lake of the Ozarks. October 5th, 2017 Osage National Golf Resort
 Welcome to the 10 th Annual Real Estate Symposium for The Lake of the Ozarks October 5th, 2017 Osage National Golf Resort Economic and Real Estate Market Outlook October, 2017 Steve Snook, Senior Business
Real Estate Markets in a Tentative Economic Landscape
 Real Estate Markets in a Tentative Economic Landscape GEORGE RATIU Director, Quantitative & Commercial Research National Association of REALTORS Bay Area Real Estate Council Annual Economic Outlook Tampa,
NEWS RELEASE FOR WIRE TRANSMISSION: 8:30 A.M. EDT, FRIDAY, APRIL 17, William Zeile: (202) BEA 09-14
 BEA 09-14") NEWS RELEASE FOR WIRE TRANSMISSION: 8:30 A.M. EDT, FRIDAY, APRIL 17, 2009 William Zeile: (202) 606-9893 BEA 09-14 Summary Estimates for Multinational Companies: Employment, Sales, and Capital Expenditures
NEWS RELEASE FOR WIRE TRANSMISSION: 8:30 A.M. EDT, FRIDAY, APRIL 17, 2009 William Zeile: (202) 606-9893 BEA 09-14 Summary Estimates for Multinational Companies: Employment, Sales, and Capital Expenditures
SAN DIEGO S QUARTERLY ECONOMIC SNAPSHOT
 SAN DIEGO S QUARTERLY ECONOMIC SNAPSHOT August 2017 highlights in THIS ISSUE Every quarter Regional EDC analyzes key economic indicators that are important to understanding the regional economy and the
The 2013 Hilliard Lyons INVESTKentucky Equity Conference
 The 2013 Hilliard Lyons INVESTKentucky Equity Conference Keynote Address William Ford Ph.D. Weatherford Chair of Finance Middle Tennessee State University THE ECONOMIC OUTLOOK FOR THE U.S. & KENTUCKY ECONOMY
NATIONAL INSTITUTE OF ECONOMIC AND SOCIAL RESEARCH ESTIMATES OF MONTHLY GDP. Embargo until hours on 11 th January 2013
 NATIONAL INSTITUTE OF ECONOMIC AND SOCIAL RESEARCH ESTIMATES OF MONTHLY GDP Embargo until 15.00 hours on 11 th January 2013 Our monthly estimates of GDP suggest that output declined by 0.3 per cent in
January 2018 Industrial Production
 Japan's Economy 28 February 2018 (No. of pages: 6) Japanese report: 28 Feb 2018 January 2018 Industrial Production Jan-Mar period expected to see lull in production growth trend Economic Research Dept.
Taking the Measure of St. Louis
 Taking the Measure of St. Louis The views expressed here are those of the speakers and do not necessarily represent the views of the Federal Reserve Bank of St. Louis or of the Federal Reserve System.
economy City of Rohnert Park : Local Economic Report EDB Sonoma County
 EDB Sonoma County Economic Development Board economy 2010-11 City of Rohnert Park : Local Economic Report E c o n o m i c D e v e l o p m e n t B o a r d 4 0 1 C o l l e g e Av e n u e S u i t e D S a
THE ECONOMIC OUTLOOK FOR THE U.S. AND THE CONSTRUCTION INDUSTRY
 THE ECONOMIC OUTLOOK FOR THE U.S. AND THE CONSTRUCTION INDUSTRY by William F. Ford, Ph.D. Weatherford Chair of Finance Middle Tennessee State University presented to The Roofing Industry Alliance for Progress
The State of the Erie Economy
 The State of the Erie Economy Presentation to Presque Isle CPCU Society Chapter September 14, 2017 Kenneth Louie The Economic Research Institute of Erie Sam and Irene Black School of Business Penn State
2019 Business Journal. Chris Raad
 2019 Business Journal Chris Raad Tax Reform Mortgage interest deduction?... $750,000 Property tax deduction? SALT at $10,000 Tax Cut for nearly all However, many will not itemize and do standard deduction
ECONOMIC SNAPSHOT. A Summary of the San Diego Regional Economy UNEMPLOYMENT
 A Summary of the San Diego Regional Economy UNEMPLOYMENT San Diego Regional EDC analyzes key economic metrics that are important to understanding the regional economy and San Diego's standing relative
Lunchtime Data Talk. Housing Finance Policy Center. Housing Data: Home Sales, Affordability, and Realtor/Builder Activity
 Housing Finance Policy Center Lunchtime Data Talk Housing Data: Home Sales, Affordability, and Realtor/Builder Activity Lawrence Yun, National Association of Realtors David Crowe, National Association
SAN DIEGO S QUARTERLY ECONOMIC SNAPSHOT
 SAN DIEGO S QUARTERLY ECONOMIC SNAPSHOT November 2017 SAN DIEGO HIGHLIGHTS IN THIS ISSUE Every quarter San Diego Regional EDC analyzes key economic indicators that are important to understanding the regional
Robotics Market Update
 Robotics Market Update The Outlook in North America Jeff Burnstein President Robotic Industries Association North American Economic Outlook The Great Recession of 2008-09 Financial meltdown in US caused
Charles S. Gascon Regional Economist, Senior Coordinator
 Generated: July 2018 Charles S. Gascon Regional Economist, Senior Coordinator Education MBA, Washington University, 2012 M.A. Economics, State University of New York at Albany, 2006 B.S. Managerial Economics,
areiusa.com DALLAS-FORT WORTH MARKET REPORT
 areiusa.com DALLAS-FORT WORTH MARKET REPORT Overview The Dallas-Fort Worth real estate market is not slowing down as it flips the calendar to 2019. People are migrating to the area at impressive rates
How U.S. Employment Is Changing
 December 1, 211 How U.S. Employment Is Changing Stephen P. A. Brown and Hui Liu During the most recent recession, U.S. employment fell by 7,49 million jobs (5.4 percent). During the first 8 months of the
SAN DIEGO S QUARTERLY ECONOMIC SNAPSHOT
 SAN DIEGO S QUARTERLY ECONOMIC SNAPSHOT December 2018 SAN DIEGO HIGHLIGHTS IN THIS ISSUE Every quarter San Diego Regional EDC analyzes key economic indicators that are important to understanding the regional
ECONOMIC SNAPSHOT. A Summary of the San Diego Regional Economy UNEMPLOYMENT
 A Summary of the San Diego Regional Economy Brought to you by San Diego Regional EDC analyzes key economic metrics that are important to understanding the regional economy and San Diego s standing relative
BACCARAT: A LONGITUDINAL MICRO-STUDY
 BACCARAT: A LONGITUDINAL MICRO-STUDY FIELD RESULTS FROM ONE ATLANTIC CITY CASINO, JANUARY 2004 TO JUNE 2010 CENTER FOR GAMING RESEARCH, JULY 2010 Baccarat is the most important game in the world s biggest
SAN DIEGO S QUARTERLY ECONOMIC SNAPSHOT
 SAN DIEGO S QUARTERLY ECONOMIC SNAPSHOT February 2018 SAN DIEGO HIGHLIGHTS IN THIS ISSUE Every quarter San Diego Regional EDC analyzes key economic indicators that are important to understanding the regional
1Q04 Update: Silicon Demand Will Move to a Full Recovery
 Gartner Dataquest Alert 1Q04 Update: Silicon Demand Will Move to a Full Recovery Our latest silicon demand forecast indicates that wafer demand in 2003 will increase 9 percent over 2002. While the forecast
Dr. Jeffrey Michael. Executive Director, Center for Business and Policy Research University of the Pacific
 2019 San Joaquin County Economic Outlook Dr. Jeffrey Michael Executive Director, Center for Business and Policy Research University of the Pacific Outline Population Growth and Migration California and
The State of Innovation. Orlando Saez
 The State of Innovation Orlando Saez Separating fact from myth Myth Illinois is hostile to businesses. Fact Illinois is a good place to do business, and it s getting better everyday. Illinois Economy Highlights
Inflation and exchange rate developments: The re-valued currency after one month John Robertson September 02, 2008
 Inflation and exchange rate developments: The re-valued currency after one month John Robertson September 02, 2008 Despite the valiant efforts of optimists to endorse government s claims of changes for
Adopted March 17, 2009 (Ordinance 09-15)
") ECONOMIC ELEMENT of the PINELLAS COUNTY COMPREHENSIVE PLAN Prepared By: The Pinellas County Planning Department as staff to the LOCAL PLANNING AGENCY for THE BOARD OF COUNTY COMMISSIONERS OF PINELLAS COUNTY,
ECONOMIC ELEMENT of the PINELLAS COUNTY COMPREHENSIVE PLAN Prepared By: The Pinellas County Planning Department as staff to the LOCAL PLANNING AGENCY for THE BOARD OF COUNTY COMMISSIONERS OF PINELLAS COUNTY,
St. George Mega Trends
 St. George Mega Trends Image Source: http://www.nps.gov/zion/photosmultimedia/index.htm Arthur C. Nelson, Ph.D., FAICP Presidential Professor & Director of Metropolitan Research University of Utah St.
ECONOMIC SNAPSHOT. A Summary of the San Diego Regional Economy UNEMPLOYMENT
 A Summary of the San Diego Regional Economy Brought to you by San Diego Regional EDC analyzes key economic metrics that are important to understanding the regional economy and San Diego s standing relative
THE U.S. SEMICONDUCTOR INDUSTRY:
 THE U.S. SEMICONDUCTOR INDUSTRY: KEY CONTRIBUTOR TO U.S. ECONOMIC GROWTH Matti Parpala 1 August 2014 The U.S. Semiconductor Industry: Key Contributor To U.S. Economic Growth August 2014 1 INTRO The U.S.
Yorkville Seasoned MLP Investment Team Recognized Experts
 Yorkville Seasoned MLP Investment Team Recognized Experts Investing & Researching MLPs Since Early 1990s One of the Longest Audited MLP Strategy Track Records Performance Recognition (Morningstar, Pensions
ECONOMIC SNAPSHOT. A Summary of the San Diego Regional Economy UNEMPLOYMENT
 A Summary of the San Diego Regional Economy Brought to you by analyzes key economic metrics that are important to understanding the regional economy and San Diego s standing relative to other major metropolitan
Bayport Securitisation (RF) Ltd Investor Report May 2013
 Ltd Investor Report May 2013") Bayport Securitisation (RF) Ltd Investor Report May 2013 Financial statistics for the period ended May 2013 May 13 Apr 13 Mar 13 Feb 13 Jan 13 Dec 12 Nov 12 Oct 12 Sep 12 Aug 12 Jul 12 Jun 12 Performance
Bayport Securitisation (RF) Ltd Investor Report May 2013 Financial statistics for the period ended May 2013 May 13 Apr 13 Mar 13 Feb 13 Jan 13 Dec 12 Nov 12 Oct 12 Sep 12 Aug 12 Jul 12 Jun 12 Performance
Bayport Securitisation (RF) Ltd Investor Report February 2013
 Ltd Investor Report February 2013") Bayport Securitisation (RF) Ltd Investor Report February 2013 Financial statistics for the period ended February 2013 Feb 13 Jan 13 Dec 12 Nov 12 Oct 12 Sep 12 Aug 12 Jul 12 Jun 12 May 12 Apr 12 Mar 12
Bayport Securitisation (RF) Ltd Investor Report February 2013 Financial statistics for the period ended February 2013 Feb 13 Jan 13 Dec 12 Nov 12 Oct 12 Sep 12 Aug 12 Jul 12 Jun 12 May 12 Apr 12 Mar 12
The Casey Report. E.B. Tucker
 The Casey Report E.B. Tucker How to profit from collapse Everyone knows what s already happened Few people can figure out what happens next Think about incentives What will people do next? These people
St. George Mega Trends
 St. George Mega Trends Arthur C. Nelson, Ph.D., FAICP Presidential Professor & Director of Metropolitan Research University of Utah St. George Chamber of Commerce January 31, 2009 Source: http://www.nps.gov/zion/photosmultimedia/index.htm
Cattle and Beef Markets: Short and Long Run Challenges and Opportunities
 Cattle and Beef Markets: Short and Long Run Challenges and Opportunities Derrell S. Peel Breedlove Professor of Agribusiness and Extension Livestock Marketing Specialist Oklahoma State University Major
III. THE REGIONAL FRAMEWORK
 THE SAN DIEGO REGIONAL ECONOMY III. THE REGIONAL FRAMEWORK The San Diego region, comprised solely of San Diego County, is one of California s most dynamic regions. The efforts of the University within
MMBA SECONDARY MARKET AND LOAN SERVICING CONFERENCE
 MMBA SECONDARY MARKET AND LOAN SERVICING CONFERENCE May 13, 2013 Presented by Timothy M. Warren Jr. Chief Executive Officer The Warren Group Agenda Brief Overview of The Warren Group Market Conditions
Second Quarter CY 2012 Results. August 2, 2012
 Second Quarter CY 2012 Results August 2, 2012 1 Safe Harbor Disclosure Please review our SEC filings on Form 10-K and Form 10-Q The statements contained in this presentation that are not historical facts
The Construction Market in Europe: A Supplier s Point of View
 The Construction Market in Europe: A Supplier s Point of View Dr. Walter Nussbaumer Abstract After the 2009 recession and the 2010 stagnation, recovery took place in 2011 when the World Construction Industry
August 7, 2014 Heiwa Corporation
 August 7, 2014 Heiwa Corporation Contents Overview 3 1 st Quarter Results of FY Ending March 2015 4 Full-year Plan for FY2015 12 < Supplementary Information > Market Environment (Pachinko and Pachislot
ECONOMIC ELEMENT. of the PINELLAS COUNTY COMPREHENSIVE PLAN. Prepared By: The Pinellas County Planning Department. as staff to the
 ECONOMIC ELEMENT of the PINELLAS COUNTY COMPREHENSIVE PLAN Prepared By: The Pinellas County Planning Department as staff to the LOCAL PLANNING AGENCY for THE BOARD OF COUNTY COMMISSIONERS OF PINELLAS COUNTY,
3Q03 Silicon Wafer Update: Demand Continues Recovery
 Gartner Dataquest Alert 3Q03 Silicon Wafer Update: Demand Continues Recovery The latest silicon forecast indicates that silicon wafer demand will grow 10 percent in 2003 over the previous year. This is
Colliers International Real Estate Trends2018
 Colliers International Real Estate Trends2018 Colliers International Silicon Valley Market Recap San Jose, California - February 13, 2018 - In its 19th consecutive year, last week Colliers International
BAYPORT SECURITISATION (RF) LTD INVESTOR REPORT DECEMBER 2014
 LTD INVESTOR REPORT DECEMBER 2014") BAYPORT SECURITISATION (RF) LTD INVESTOR REPORT DECEMBER 2014 Financial statistics for the period ended December 2014 Dec 14 Nov 14 Oct 14 Sept 14 Aug 14 Jul 14 Jun 14 May 14 Apr 14 Mar 14 Feb 14 Jan 14
BAYPORT SECURITISATION (RF) LTD INVESTOR REPORT DECEMBER 2014 Financial statistics for the period ended December 2014 Dec 14 Nov 14 Oct 14 Sept 14 Aug 14 Jul 14 Jun 14 May 14 Apr 14 Mar 14 Feb 14 Jan 14
USG CORPORATION + U.S. CHAMBER OF COMMERCE. Q4 Commercial. Construction Index. powered by
 D Q4 Commercial USG CORPORATION + U.S. CHAMBER OF COMMERCE 2018 Construction Index powered by THE USG CORPORATION + U.S. CHAMBER OF COMMERCE COMMERCIAL CONSTRUCTION INDEX Throughout 2018, USG Corporation
Confirms 2013 Financial Guidance
 Confirms 2013 Financial Guidance PROVIDENCE, R.I.--(BUSINESS WIRE)--Jul. 17, 2013-- Textron Inc. (NYSE: TXT) today reported second quarter 2013 income from continuing operations of $0.40 per share, compared
Silicon Wafer Demand Forecast Update, 4Q03
 Forecast Analysis Silicon Wafer Demand Forecast Update, 4Q03 Abstract: Silicon wafer demand in 2003 will register an 8 percent increase over 2002. Demand will enter an expansion phase in the second quarter
ECONOMIC SNAPSHOT. A Summary of the San Diego Regional Economy UNEMPLOYMENT
 A Summary of the San Diego Regional Economy Brought to you by San Diego Regional EDC analyzes key economic metrics that are important to understanding the regional economy and San Diego s standing relative
Investing in Regional Sustainability Norris Lozano, PDC
 Investing in Regional Sustainability Norris Lozano, PDC Regional Leaders Seminar Series Institute of Metropolitan Studies Portland, OR May 10, 2004 1 The Portland Development Commission Housing Infrastructure
deal done. Here folks get to do that first deal with help. Attend an introduction meeting to see if we can help.
 Our Investing community invites you to visit one of our locations to find out how you can start Learning & Working with our seasoned professionals. Real Estate Investing isn t AMAZING!. It is a process
Life Sciences Outlook. Westchester County 2016
 Life Sciences Outlook Westchester County 2016 Westchester County Just a short distance from Manhattan, Westchester County is an ideal location to many firms looking to attract and retain talent. The access
Assessing the Feasibility of Wind Power Production for the University of Rhode Island s Bay Campus
 University of Rhode Island DigitalCommons@URI Senior Honors Projects Honors Program at the University of Rhode Island 2009 Assessing the Feasibility of Wind Power Production for the University of Rhode
State Content Standards for New Mexico
 Episode 101 What Is a Biz Kid? Episode 102 What Is Money? Episode 103 How Do You Get Money? Episode 104 What Can You Do with Money? Episode 105 Money Moves Episode 106 Taking Charge of Your Financial Future
Past, Present and Future U.S. Lamb Market, 2013
 Past, Present and Future U.S. Lamb Market, 2013 Tim Petry Livestock Economist www.ag.ndsu.edu/livestockeconomics It was the best of times, it was the worst of times Source: Chapter 1, A Tale of Two Cities
2017 Chairm an Bob Adamson
 2017 Chairm an Bob Adamson 21 st Annual Economic Summit Brought to you by: No rt h e rn Virg in ia Asso c ia t io n o f Re a lt o rs In partnership with: George Mason University s: Ce n t e r fo r Re g
Do Mid-Cap Private Equity Funds Have an Advantage in Today s Markets?
 Do Mid-Cap Private Equity Funds Have an Advantage in Today s Markets? Richard Cashin, Managing Partner, One Equity Partners Ellis Jones, CEO, Wasserstein & Co. John Mapes, Managing Partner, Aurora Capital
National Population Estimates: March 2009 quarter
 Image description. Hot Off The Press. End of image description. Embargoed until 10:45am 15 May 2009 National Population Estimates: March 2009 quarter Highlights The estimated resident population of New
Italian Americans by the Numbers: Definitions, Methods & Raw Data
 Tom Verso (January 07, 2010) The US Census Bureau collects scientific survey data on Italian Americans and other ethnic groups. This article is the eighth in the i-italy series Italian Americans by the
Textron Reports Second Quarter 2014 Income from Continuing Operations of $0.51 per Share, up 27.5%; Revenues up 23.5%
 Textron Reports Second Quarter 2014 Income from Continuing Operations of $0.51 per Share, up 27.5%; Revenues up 23.5% 07/16/2014 PROVIDENCE, R.I.--(BUSINESS WIRE)-- Textron Inc. (NYSE: TXT) today reported
BOSTON OFFICE MARKET. Inside... FIRST QUARTER 2017 OFFICESTATUS FINANCIAL DISTRICT BOSTON
 BOSTON OFFICE MARKET FIRST QUARTER 2017 OFFICESTATUS FINANCIAL DISTRICT BOSTON Inside...»»Tenants absorb 224,000 square feet during the first quarter of 2017.»»Class A product in Boston CBD contributed
2Q 2016 Results. Mermaid Maritime Plc. August 2016
 Mermaid Maritime Plc 2Q 2016 Results August 2016 Disclaimer: The information contained in this document is intended only for use during the presentation and should not be disseminated or distributed to
2012 ACCE Industry Advisory Board Best Practices Positioning Your Firm After the Great Recession
 2012 ACCE Industry Advisory Board Best Practices Positioning Your Firm After the Great Recession 2012 FMI Corporation 0 The Great Recession 2012 FMI Corporation 1 FMI Corporation 2010 1 Market Truths You
Panel Discussion: Regional Economic and Transit Ridership Trends
 Finance Committee Information Item III-B September 8, 2016 Panel Discussion: Regional Economic and Transit Ridership Trends Page 32 of 37 Washington Metropolitan Area Transit Authority Board Action/Information
Oft-overlooked SBA program appears poised for comeback
 Oft-overlooked SBA program appears poised for comeback By John Reosti Published July 12 2018, 1:48pm EDT A largely overlooked Small Business Administration program may be slowly gaining traction. Bankers
Korea s SME Policy Paradigm
 Transition of Korea s SME Policy Paradigm Young Tae Kim Contents I Introduction of Korea SMBA II Current Status of Korean SMEs III Recent Business Environment Changes IV SME Policy Direction I Introduction
How New Jersey's Economy Benefits from International Trade & Investment
 How New Jersey's Economy Benefits from International Trade & Investment With more than 95 percent of the world s population and 80 percent of the world s purchasing power outside the United States, future
Silicon Valley Venture Capital Survey Second Quarter 2018
 fenwick & west Silicon Valley Venture Capital Survey Second Quarter 2018 Full Analysis Silicon Valley Venture Capital Survey Second Quarter 2018 fenwick & west Full Analysis Cynthia Clarfield Hess, Mark
2013 venture capital trends summary
 213 venture capital trends summary Prepared by: Hitesh Kothari, Director, McGladrey LLP hitesh.kothari@mcgladrey.com August 213 Fundraising by venture capital funds In the first half of 213, 88 venture
Textron Reports Third Quarter 2014 Income from Continuing Operations of $0.57 per Share, up 62.9%; Revenues up 18.1%
 Textron Reports Third Quarter Income from Continuing Operations of $0.57 per Share, up 62.9%; Revenues up 18.1% 10/17/ PROVIDENCE, R.I.--(BUSINESS WIRE)-- Textron Inc. (NYSE: TXT) today reported third
The Florida Turnaround Story
 The Florida Turnaround Story In 2010, Florida was in a free fall. Florida lost more than 800,000 jobs, the real estate market had collapsed and tourism was on the decline. State debt had grown by about
XT: Explore Technology LAUNCHING STUDENTS INTO TECHNOLOGY-BASED MAJORS AT VIRGINIA TECH
 XT: Explore Technology LAUNCHING STUDENTS INTO TECHNOLOGY-BASED MAJORS AT VIRGINIA TECH The XT factor: what drives you? THIS MAY NOT BE THE EASIEST QUESTION TO ANSWER. THERE CAN BE SEVERAL THINGS THAT
CITY OF SONOMA CITY PROFILE REPORT 2017
 CITY OF SONOMA CITY PROFILE REPORT 2017 Report developed by the Sonoma County Economic Development Board in partnership with the City of Sonoma and the Sonoma Valley Chamber of Commerce ECONOMIC DEVELOPMENT
RESHAPING METRO WASHINGTON
 RESHAPING METRO WASHINGTON Arthur C. Nelson, Ph.D., FAICP Presidential Professor and Director Metropolitan Research Center University of Utah Urban Land Institute May 21, 2009 Photo: Arthur C. Nelson,
261 Gorham Road South Portland, ME Company Profile
 Company Profile Preservation Management, Inc. (PMI) has been providing comprehensive residential and commercial property management services since 1990. Over the last two decades PMI has grown to manage
Energy MLP Strategy. PORTFOLIO MANAGER COMMENTARY Fourth Quarter Key Takeaways
 Fourth Quarter 2017 Energy MLP Strategy Key Takeaways Michael Clarfeld, CFA Managing Director, Portfolio Manager Global crude oil demand growth is outstripping global supply growth driving inventory reductions
Dollars and Sense. John Nolan Vice President Steel Dynamics, Inc. Fort Wayne, IN USA
 Dollars and Sense John Nolan Vice President Steel Dynamics, Inc. Fort Wayne, IN USA Federal Reserve Coalition for a Sound Dollar American Iron and Steel Institute Steel Manufacturers Association Salomon
Objectives ECONOMIC GROWTH CHAPTER
 9 ECONOMIC GROWTH CHAPTER Objectives After studying this chapter, you will able to Describe the long-term growth trends in the United States and other countries and regions Identify the main sources of
We Value Your Business
 We Value Your Business 1 Freemium Business Model Description Fred Wilson, Venture Capitalist Give your service away for free, possibly ad supported but maybe not, acquire a lot of customers very efficiently