The Virginia Tech U.S. Forest Service June 2018 Housing Commentary: Section I
|
|
|
- Gervase Gregory
- 5 years ago
- Views:
Transcription


1 The Virginia Tech U.S. Forest Service June Housing Commentary: Section I Urs Buehlmann Department of Sustainable Biomaterials College of Natural Resources & Environment Virginia Tech Blacksburg, VA buehlmann@gmail.com Delton Alderman Forest Products Marketing Unit Forest Products Laboratory U.S. Forest Service Madison, WI dalderman@fs.fed.us Virginia Polytechnic Institute and State University VCE-CNRE25NP Virginia Cooperative Extension programs and employment are open to all, regardless of age, color, disability, gender, gender identity, gender expression, national origin, political affiliation, race, religion, sexual orientation, genetic information, veteran status, or any other basis protected by law. An equal opportunity/affirmative action employer. Issued in furtherance of Cooperative Extension work, Virginia Polytechnic Institute and State University, Virginia State University, and the U.S. Department of Agriculture cooperating. Edwin J. Jones, Director, Virginia Cooperative Extension, Virginia Tech, Blacksburg; M. Ray McKinnie, Administrator, 1890 Extension Program, Virginia State University, Petersburg.
2 Table of Contents Slide 3: Opening Remarks Slide 4: Housing Scorecard Slide 5: Wood Use in Construction Slide 8: New Housing Starts Slide 13: Regional Housing Starts Slide 22: New Housing Permits Slide 25: Regional New Housing Permits Slide 32: Housing Under Construction Slide 34: Regional Under Construction Slide 39: Housing Completions Slide 44: Regional Housing Completions Slide 46: New Single-Family House Sales Slide 49: Regional SF House Sales & Price Slide 56: New SF Sales-Population Ratio Slide 65: Construction Spending Slide 68: Construction Spending Shares Slide 72: Remodeling Slide 76: Existing House Sales Slide 78: First-Time Purchasers Slide 79: Affordability Slide 82: Summary Slide 83: Virginia Tech Disclaimer Slide 84: USDA Disclaimer This report is a free monthly service of Virginia Tech. Past issues are available at: To request the commentary, please buehlmann@gmail.com or dalderman@fs.fed.us
3 Opening Remarks There is no sugar coating June s housing data it was ugly. Total permits and starts, including singlefamily permits were negative on a monthly and year-over-year basis. Single-family monthly start data was barely positive. Housing under construction was negative on a monthly basis. Housing completions indicated no change, but single-family completions were negative on a month-over-month basis. New single-family sales improved month-over-month and were fairly robust on a year-over-year basis. Existing sales continued their declining trend. New single-family construction spending indicated minimal positive change on a monthly basis. The August 9th Atlanta Fed GDPNow residential investment spending model projects an aggregate -2.3% decline for Quarter Three. New private permanent site expenditures were projected for a -7.9% decrease; the improvement spending forecast was a 4.9% increase; and the manufactured/mobile housing projection was a -11.1% decline (all: quarterly log change and seasonally adjusted annual rate) 1. This month s housing quotation regards findings from the The State of United States Housing report: The average number of single-family homes for sale during 2017 was lower than at any point since 1982; One in three homeowners is age 65 or over; Only one in three renters has more than $10,000 in assets; Only 11 percent of the population moved in 2017; Households headed by immigrants accounted for 47 percent of household growth between 2010 and 2016; In 2017, the homeownership rate for year olds was 8 percentage points below the 1988 rate; The black/white homeownership rate gap was 29.2 percentage points in 2017; Between 1990 and 2016, the number of units renting for $800 (in real terms) declined by 2.5 million units; The real median income of renter households rose by less than one percent since 1990; and More than 38.1 million households roughly one-third of all households are costburdened. 2 Daniel McCue, Senior Research Associate, Joint Center for Housing Studies, Harvard University. This month s commentary also contains applicable housing data, home ownership, building products; and economic information. Section I contains data and commentary and Section II includes regional Federal Reserve analysis, private indicators, and demographic and economic commentary. Sources: 1 8/9/18; 2 8/8/18
4 June Housing Scorecard M/M M/M = month-over-month; Y/Y = year-over-year; NC = no change Y/Y Housing Starts 12.3% 4.2% Single-Family Starts 9.1% 0.2% Housing Permits 2.2% 3.0% Single-Family Permits 0.8% 4.6% Housing Under Construction 0.5% 4.9% Single-Family Under Construction 0.2% 11.5% Housing Completions NC 0.0% 2.2% Single-Family Completions 2.3% 5.3% New Single-Family House Sales 5.3% 2.4% Private Residential Construction Spending 0.5% 8.8% Single-Family Construction Spending 0.4% 6.8% Existing House Sales 1 0.6% 2.2% Sources: U.S. Department of Commerce-Construction; 1 FRED: Federal Reserve Bank of St. Louis


5 New Construction Percentage of Wood Products Consumption 32% 68% 51% 49% All Sawnwood: Total New Housing Other sectors Structural panels: Total New Housing Other sectors 22% 78% Non-structural panels: Total New Housing Other sectors Source: U.S. Forest Service. Howard, J. and D. McKeever U.S. Forest Products Annual Market Review and Prospects,

6 New SF Construction Percentage of Wood Products Consumption 75% 25% 60% 40% All Sawnwood: New SF Housing Other sectors Structural panels: New SF Housing 14% 86% Non-structural panels: New SF Housing Other sectors Source: U.S. Forest Service. Howard, J. and D. McKeever U.S. Forest Products Annual Market Review and Prospects,

7 Repair and Remodeling s Percentage of Wood Products Consumption 14% 23% 86% 77% Non-structural panels: RR Other sectors All Sawnwood: RR Other sectors 21% 79% Structural panels: RR Other sectors Source: U.S. Forest Service. Howard, J. and D. McKeever U.S. Forest Products Annual Market Review and Prospects,
8 New Housing Starts Total Starts* SF Starts MF 2-4 Starts** MF 5 Starts June 1,173, ,000 11, ,000 May 1,337, ,000 12, , ,225, ,000 6, ,000 M/M change Y/Y change * All start data are presented at a seasonally adjusted annual rate (SAAR). ** US DOC does not report 2 to 4 multifamily starts directly, this is an estimation ((Total starts (SF + 5 unit MF)). Source: 7/18/18
9 Total Housing Starts 2,000 1,800 1,600 1,400 1,200 1, SAAR = Seasonally adjusted annual rate; in thousands Total Starts 1,173,000 Total SF 858, % Total 2-4 MF 11, % Total 5 MF 304, % Total starts 58-year average: 1,439 m units SF starts 58-year average: 1,022 m units MF starts 53-year average: 420 m units Jan Feb SF Starts 2-4 MF Starts 5 MF Starts Mar Apr May Jun US DOC does not report 2 to 4 multifamily starts directly, this is an estimation: ((Total starts (SF + 5 unit MF)). * Percentage of total starts. Source: 7/18/18
10 New SF Starts to 54 population/sf starts: 1/1/59 to 7/1/07 ratio: to 54 year old classification: 6/18 ratio: Total non-institutionalized/start ratio: 1/1/59 to 7/1/07: Total: 6/18 ratio: Ratio: SF Housing Starts/Civilian Noninstitutional Population Ratio: SF Housing Starts/Civilian Noninstitutional Population (20-54) New SF starts adjusted for the US population From June 1959 to July 2007, the long-term ratio of new SF starts to the total US non-institutionalized population was ; in June it was a sizeable decrease from May (0.0037). The long-term ratio of non-institutionalized population, aged 20 to 54 is ; in June was also a substantial increase change from May (0.0064). From a population worldview, new SF construction is less than what is necessary for changes in population (i.e., under-building). Sources: and The Federal Reserve Bank of St. Louis; 7/18/18
11 Total Housing Starts: Six-Month Average 1,400 1,350 Total Starts SAAR; in thousands 1,300 1,296 1,250 1,200 1,173 1,150 1,100 1,050 1,000 Total Starts: (monthly) Total Starts: 6-month Ave. Source: 7/18/18
12 SF Housing Starts: Six-Month Average 1,000 SF Starts SAAR; in thousands SF Starts: (monthly) SF Starts: 6-month Ave. Source: 7/18/18
13 New Housing Starts by Region 1,200 SAAR; in thousands 1, Total Regional Starts Total NE 96, % Total MW 156, % Total S 601, % Total W 320, % Jan Feb Mar Apr May Jun Total NE Starts Total MW Starts Total S Starts Total W Starts NE = Northeast, MW = Midwest, S = South, W = West US DOC does not report 2 to 4 multi-family completions directly, this is an estimation (Total completions SF completions). * Percentage of total starts. Source: 7/18/18
14 New Housing Starts by Region NE Total NE SF NE MF** June 96,000 67,000 29,000 May 103,000 65,000 38, ,000 63,000 97,000 M/M change Y/Y change MW Total MW SF MW MF June 156, ,000 44,000 May 243, ,000 85, , ,000 69,000 M/M change Y/Y change All data are SAAR; S = South and W = West. ** US DOC does not report multifamily starts directly, this is an estimation (Total starts SF starts). Source: 7/18/18
15 New Housing Starts by Region S Total S SF S MF** June 601, , ,000 May 661, , , , ,000 78,000 M/M change Y/Y change W Total W SF W MF June 320, , ,000 May 330, , , , , ,000 M/M change Y/Y change All data are SAAR; S = South and W = West. ** US DOC does not report multifamily starts directly, this is an estimation (Total starts SF starts). Source: 7/18/18
16 Total SF Housing Starts by Region 900 SAAR; in thousands Total SF Starts by Region Total NE 67, % Total MW 112, % Total S 466, % Total W 213, % Jan Feb Mar Apr May Jun * Percentage of total starts. NE SF Starts MW SF Starts S SF Starts W SF Starts NE = Northeast, MW = Midwest, S = South, W = West US DOC does not report 2 to 4 multi-family completions directly, this is an estimation (Total completions SF completions). Source: 7/18/18
17 Nominal & SAAR SF Starts LHS: SAAR; in thousands RHS: Non-adjusted; in thousands June 2017 and June New SF Starts (adj) Apparent Expansion Factor New SF Starts (non-adj) Nominal and Adjusted New SF Monthly Starts Presented above is nominal (non-adjusted) new SF start data contrasted against SAAR data. The apparent expansion factor is the ratio of the unadjusted number of houses started in the US to the seasonally adjusted number of houses started in the US (i.e., to the sum of the seasonally adjusted values for the four regions). U.S. DOC-Construction Source: 7/18/18
18 MF Housing Starts by Region SAAR; in thousands Total MF Starts by Region Total NE 29, % Total MW 44, % Total S 135, % Total W 107, % Jan Feb Mar Apr May Jun NE MF Starts MW MF Starts S MF Starts W MF Starts NE = Northeast, MW = Midwest, S = South, W = West US DOC does not report 2 to 4 multi-family completions directly, this is an estimation (Total completions SF completions). * Percentage of total starts. Source: 7/18/18
19 SF & MF Housing Starts (%) 100.0% 90.0% 80.0% 70.0% 78.5% 73.1% 60.0% 50.0% 40.0% 30.0% 20.0% 21.5% 26.9% 10.0% 0.0% Single-Family Starts: % Multi-Family Starts: % Source: 7/18/18
20 Railroad Lumber & Wood Shipments vs. U.S. SF Housing Starts 10,000 LHS: Lumber shipments carloads (weekly average/month) RHS: SF Starts-in thousands 1,400 9,000 1,200 8,000 7,000 1,000 6, ,000 4, , ,000 1,000 0 Data are average weekly originations for each month, are not seasonally adjusted, and do not include intermodal. AAR Lumber & Wood Shipments (U.S. + Canada) SF Starts Sources: Association of American Railroads (AAR), Rail Time Indicators report 7/6/18; U.S. DOC-Construction; 7/18/18
21 Railroad Lumber & Wood Shipments vs. U.S. SF Housing Starts: 6-month Offset 10,000 LHS: Lumber shipments carloads (weekly average/month) RHS: SF Starts-in thousands 1,400 9,000 1,200 8,000 7,000 1,000 6, ,000 4, , ,000 1, Data are average weekly originations for each month, are not seasonally adjusted, and do not include intermodal. AAR 0 Lumber & Wood Shipments (U.S. + Canada) SF Starts (6-mo. offset) In this graph, January 2007 lumber shipments are contrasted with July 2007 SF starts, and continuing through June SF starts. The purpose is to discover if lumber shipments relate to future single-family starts. Also, it is realized that lumber and wood products are trucked; however, to our knowledge comprehensive trucking data is not available. Sources: Association of American Railroads (AAR), Rail Time Indicators report 7/6/18; U.S. DOC-Construction; 7/18/18
22 New Housing Permits Total Permits* SF Permits MF 2-4 unit Permits MF 5 unit Permits June 1,273, ,000 36, ,000 May 1,301, ,000 34, , ,312, ,000 37, ,000 M/M change Y/Y change * All permit data are presented at a seasonally adjusted annual rate (SAAR). Source: 7/18/18
23 Total New Housing Permits 1,800 SAAR; in thousands 1,600 1,400 1,200 Total Permits 1,273,000 Total SF 850, % Total 2-4 MF 36, % Total 5 MF 387, % 1, SF Permits 2-4 MF Permits 5 MF Permits NE = Northeast, MW = Midwest, S = South, W = West US DOC does not report 2 to 4 multi-family completions directly, this is an estimation (Total completions SF completions). * Percentage of total permits. Source: 7/18/18
24 Nominal & SAAR SF Permits LHS: SAAR; in thousands RHS: Non-adjusted; in thousands June 2017 and June New SF Permits (adj) Apparent Expansion Factor New SF Permits (non-adj) Nominal and Adjusted New SF Monthly Permits Presented above is nominal (non-adjusted) new SF start data contrasted against SAAR data. The apparent expansion factor is the ratio of the unadjusted number of houses started in the US to the seasonally adjusted number of houses started in the US (i.e., to the sum of the seasonally adjusted values for the four regions). U.S. DOC-Construction Source: 7/18/18
25 New Housing Permits by Region NE Total* NE SF NE MF** June 112,000 54,000 58,000 May 134,000 57,000 77, ,000 55,000 50,000 M/M change Y/Y change MW Total* MW SF MW MF** June 170, ,000 53,000 May 209, ,000 87, , ,000 92,000 M/M change Y/Y change * All data are SAAR ** US DOC does not report multifamily starts directly, this is an estimation (Total starts SF starts). Source: 7/18/18
26 New Housing Permits by Region S Total* S SF S MF** June 664, , ,000 May 625, , , , , ,000 M/M change Y/Y change W Total* W SF W MF** June 327, , ,000 May 333, , , , , ,000 M/M change Y/Y change All data are SAAR ** US DOC does not report multifamily starts directly, this is an estimation (Total starts SF starts). Source: 7/18/18
27 Total Housing Permits by Region 1,200 SAAR; in thousands 1, Total Regional Permits Total NE 112, % Total MW 170, % Total S 664, % Total W 327, % Jan Feb Mar Apr May Jun NE Permits MW Permits S Permits W Permits NE = Northeast, MW = Midwest, S = South, W = West US DOC does not report 2 to 4 multi-family completions directly, this is an estimation (Total completions SF completions). * Percentage of total permits. Source: 7/18/18
28 SF Housing Permits by Region 900 SAAR; in thousands Total SF Permits Total NE 54, % Total MW 117, % Total S 477, % Total W 202, % Jan Feb Mar Apr May Jun * Percentage of total permits. NE SF Permits MW SF Permits S SF Permits W SF Permits NE = Northeast, MW = Midwest, S = South, W = West US DOC does not report 2 to 4 multi-family completions directly, this is an estimation (Total completions SF completions). Source: 7/18/18
29 MF Housing Permits by Region SAAR; in thousands Total MF Permits Total NE 58, % Total MW 53, % Total S 187, % Total W 125, % Jan Feb Mar Apr May Jun * Percentage of total permits. NE MF Permits MW MF Permits S MF Permits W MF Permits NE = Northeast, MW = Midwest, S = South, W = West US DOC does not report 2 to 4 multi-family completions directly, this is an estimation (Total completions SF completions). Source: 7/18/18
30 Railroad Lumber & Wood Shipments vs. U.S. SF Housing Permits 10,000 LHS: Lumber shipments carloads (weekly average/month) RHS: SF permits-in thousands 1,200 9,000 8,000 1,000 7, ,000 5, ,000 3, ,000 1,000 0 Data are average weekly originations for each month, are not seasonally adjusted, and do not include intermodal. AAR Lumber & Wood Shipments (U.S. + Canada) SF Permits Sources: Association of American Railroads (AAR), Rail Time Indicators report 7/6/18; U.S. DOC-Construction; 7/18/18
31 Railroad Lumber & Wood Shipments vs. U.S. SF Housing Permits: 3-month Offset 10,000 LHS: Lumber shipments carloads (weekly average/month) RHS: SF Starts-in thousands 1,200 9,000 8,000 1,000 7, ,000 5, ,000 3, ,000 1,000 0 Data are average weekly originations for each month, are not seasonally adjusted, and do not include intermodal. AAR Lumber & Wood Shipments (U.S. + Canada) SF Permits (3-mo. offset) In this graph, January 2007 lumber shipments are contrasted with June 2007 SF permits, continuing through June. The purpose is to discover if lumber shipments relate to future single-family permits. Also, it is realized that lumber and wood products are trucked; however, to our knowledge comprehensive trucking data is not available. Sources: Association of American Railroads (AAR), Rail Time Indicators report 7/6/18; U.S. DOC-Construction; 7/18/18
32 New Housing Under Construction (HUC) Total Under Construction* SF Under Construction MF 2-4 unit** Under Construction All housing under construction data are presented at a seasonally adjusted annual rate (SAAR). ** US DOC does not report 2-4 multifamily units under construction directly, this is an estimation ((Total under construction (SF + 5 unit MF)). MF 5 unit Under Construction June 1,121, ,000 12, ,000 May 1,127, ,000 12, , ,069, ,000 9, ,000 M/M change Y/Y change Source: 7/18/18
33 Total Housing Under Construction 1, SAAR; in thousands Total HUC 1,121,000 Total SF 515, % Total 2-4 MF 12, % Total 5 MF 594, % Jan Feb Mar Apr May Jun SF Under Construction 2-4 MF Under Construction 5 MF Under Construction NE = Northeast, MW = Midwest, S = South, W = West US DOC does not report 2 to 4 multi-family completions directly, this is an estimation (Total completions SF completions). * Percentage of total housing under construction units. Source: 7/18/18
34 New Housing Under Construction by Region NE Total NE SF NE MF** June 185,000 55, ,000 May 184,000 54, , ,000 51, ,000 M/M change Y/Y change MW Total MW SF MW MF June 155,000 82,000 73,000 May 155,000 82,000 73, ,000 77,000 76,000 M/M change Y/Y change All data are SAAR; NE = Northeast and MW = Midwest. ** US DOC does not report multifamily units under construction directly, this is an estimation (Total under construction SF under construction). Source: 7/18/18
35 New Housing Under Construction by Region S Total S SF S MF** June 452, , ,000 May 454, , , , , ,000 M/M change Y/Y change W Total W SF W MF June 329, , ,000 May 334, , , , , ,000 M/M change Y/Y change All data are SAAR; S = South and W = West. ** US DOC does not report multifamily units under construction directly, this is an estimation (Total under construction SF under construction). Source: 7/18/18
36 Total Housing Under Construction by Region 700 SAAR; in thousands Total Regional HUC Total NE 185, % Total MW 155, % Total S 452, % Total W 329, % Jan Feb Mar Apr May Jun NE Under Construction MW Under Construction S Under Construction W Under Construction NE = Northeast, MW = Midwest, S = South, W = West US DOC does not report 2 to 4 multi-family completions directly, this is an estimation (Total completions SF completions). * Percentage of total housing under construction units. Source: 7/18/18
37 SF Housing Under Construction by Region 450 SAAR; in thousands Total SF HUC Total NE 55, % Total MW 82, % Total S 242, % Total W 136, % Jan Feb Mar Apr May Jun NE SF Under Construction MW SF Under Construction S SF Under Construction W SF Under Construction NE = Northeast, MW = Midwest, S = South, W = West US DOC does not report 2 to 4 multi-family completions directly, this is an estimation (Total completions SF completions). * Percentage of total housing under construction units. Source: 7/18/18
38 MF Housing Under Construction by Region SAAR; in thousands Total MF HUC Total NE 130, % Total MW 73, % Total S 210, % Total W 193, % Jan Feb Mar Apr May Jun NE MF Under Construction MW MF Under Construction S MF Under Construction W MF Under Construction NE = Northeast, MW = Midwest, S = South, W = West US DOC does not report 2 to 4 multi-family completions directly, this is an estimation (Total completions SF completions). * Percentage of total housing under construction units. Source: 7/18/18
39 New Housing Completions Total Completions* SF Completions MF 2-4 unit** Completions MF 5 unit Completions June 1,261, ,000 6, ,000 May 1,261, ,000 12, , ,234, ,000 11, ,000 M/M change 0.0% -2.3% -50.0% 7.1% Y/Y change 2.2% 5.3% -45.5% -2.7% * All completion data are presented at a seasonally adjusted annual rate (SAAR). ** US DOC does not report multifamily completions directly, this is an estimation ((Total completions (SF + 5 unit MF)). Source: 7/18/18
40 Total Housing Completions 1,800 SAAR; in thousands 1,600 1,400 1,200 Total Completions 1,261,000 Total SF 862, % Total 2-4 MF 6, % Total 5 MF 393, % 1, Jan Feb Mar Apr May Jun * Percentage of total housing completions Total SF Completions Total 2-4 MF Completions Total 5 MF Completions US DOC does not report 2 to 4 multi-family completions directly, this is an estimation (Total completions SF completions). Source: 7/18/18
41 Total Housing Completions by Region 1, SAAR; in thousands Total Regional Completions Total NE 98, % Total MW 166, % Total S 618, % Total W 379, % Jan Feb Mar Apr May Jun NE Completions MW Completions S Completions W Completions NE = Northeast, MW = Midwest, S = South, W = West US DOC does not report 2 to 4 multi-family completions directly, this is an estimation (Total completions SF completions). * Percentage of total housing completions Source: 7/18/18
42 New Housing Completions by Region NE Total NE SF NE MF** June 98,000 51,000 47,000 May 92,000 49,000 43, ,000 61,000 73,000 M/M change 6.5% 4.1% 9.3% Y/Y change -26.9% -16.4% -35.6% MW Total MW SF MW MF June 166, ,000 52,000 May 172, ,000 29, , ,000 92,000 M/M change -3.5% -20.3% 79.3% Y/Y change -24.2% -10.2% -43.5% All data are SAAR; NE = Northeast and MW = Midwest. ** US DOC does not report multifamily units under construction directly, this is an estimation (Total under construction SF under construction). Source: 7/18/18
43 New Housing Completions by Region S Total S SF S MF** June 618, , ,000 May 684, , , , , ,000 M/M change -9.6% -7.1% -15.5% Y/Y change 13.0% 4.5% 42.6% W Total W SF W MF June 379, , ,000 May 313, , , , , ,000 M/M change 21.1% 19.3% -50.2% Y/Y change 13.5% 22.8% -1.6% All data are SAAR; S = South and W = West. ** US DOC does not report multifamily units under construction directly, this is an estimation (Total under construction SF under construction). Source: 7/18/18
44 Total Housing SF Completions by Region SAAR; in thousands Total SF Completions Total NE 51, % Total MW 114, % Total S 444, % Total W 253, % Jan Feb Mar Apr May Jun NE SF Completions MW SF Completions S SF Completions W SF Completions NE = Northeast, MW = Midwest, S = South, W = West US DOC does not report 2 to 4 multi-family completions directly, this is an estimation (Total completions SF completions). * Percentage of total housing completions Source: 7/18/18
45 New Housing MF Completions by Region SAAR; in thousands Total MF Completions Total NE 47, % Total MW 52, % Total S 174, % Total W 126, % Jan Feb Mar Apr May Jun NE MF Completions MW MF Completions S MF Completions W MF Completions NE = Northeast, MW = Midwest, S = South, W = West US DOC does not report 2 to 4 multi-family completions directly, this is an estimation (Total completions SF completions). * Percentage of total housing completions All data are SAAR; NE = Northeast and MW = Midwest; * Percentage of total housing completions. Source: 7/18/18
46 New Single-Family House Sales New SF Sales* Median Price Mean Price * All new sales data are presented at a seasonally adjusted annual rate (SAAR) 1 and housing prices are adjusted at irregular intervals 2. New SF sales were much less than the consensus forecast of 668 m 3. The past three month s new SF sales data were revised: March initial: 694 m revised to 672 m; April initial: 662 m revised to 641 m. May initial: 689 m revised to 666 m Month's Supply June 631,000 $302,100 $363, May 666,000 $309,700 $365, ,000 $315,200 $370, M/M change -5.3% -2.5% -0.5% 7.5% Y/Y change 2.4% -4.2% -2.0% 7.5% Sources: 1 7/25/18; /25/18
47 New SF House Sales 1,400 SAAR; in thousands 1,200 1, average: 650,963 units average: 633,895 units June : 631, Total New SF Sales Source: 7/25/18
48 New SF Housing Sales: Six-month average & monthly 800 SAAR; in thousands Six-month SF Sales Average New SF Sales (monthly) Source: 7/25/18
49 New SF House Sales by Region and Price Category $150m $150 - $199.9m 1 All data are SAAR 2 Houses for which sales price were not reported have been distributed proportionally to those for which sales price was report ed; 3 Detail may not add to total because of rounding. 4 Housing prices are adjusted at irregular intervals. $ m $300 - $399.9m $400 - $499.9m $500 - $749.9m $750m June 1,2,3,4 2,000 7,000 20,000 13,000 6,000 7,000 3,000 May 2,000 9,000 19,000 15,000 7,000 7,000 4, ,000 5,000 19,000 14,000 7,000 8,000 2,000 M/M change 0.0% -22.2% 5.3% -13.3% -14.3% 0.0% -25.0% Y/Y change 0.0% 40.0% 5.3% -7.1% -14.3% -12.5% 50.0% New SF sales: % 3.5% 12.3% 35.1% 22.8% 10.5% 12.3% 5.3% NE SF Sales MW SF Sales S SF Sales W SF Sales June 52,000 71, , ,000 May 38,000 82, , , ,000 66, , ,000 M/M change 36.8% -13.4% -7.7% -5.2% Y/Y change 20.9% 7.6% 8.1% -15.0% Sources: 1,2,3 7/25/18; 4
50 New SF House Sales May New SF Sales* $750m $500-$749.9m $400-$499.9m 3,000 6,000 7,000 New SF Sales: % $150m 3.5% $ m 12.3% $ m 35.1% $300-$399.9m 22.8% $400-$499.9m 10.5% $500-$749.9m 12.3% $750m 5.3% $300-$399.9m 13,000 $ m 20,000 $150-$199.9m 7,000 $150m 2,000-5,000 10,000 15,000 20,000 25,000 * Total new sales by price category and percent. Source: 7/25/18
51 New SF House Sales by Region 700 SAAR; in thousands Total SF Sales Total NE 52, % Total MW 71, % Total S 361, % Total W 147, % * Percentage of total new sales. NE SF Sales MW SF Sales S SF Sales W SF Sales Source: 7/25/18
52 New SF House Sales by Price Category ; in thousands, and thousands of dollars; SAAR 2017 Total New SF Sales*: 612 m units < $150 $150-$ $ $300-$399.9 $400-$499.9 $500-$749.9 > $750 * Sales tallied by price category. Source: 6/25/18
53 New SF House Sales 100.0% 90.0% 92.4% 80.0% 75.3% 70.0% 60.0% 50.0% 40.0% 30.0% 20.0% 24.7% 10.0% 0.0% 7.6% % of Sales: < $400m % of Sales: > $400m New SF Sales $400m houses: 2002 June The sales share of $400 thousand plus SF houses is presented above 1, 2. Since the beginning of 2012, the upper priced houses have and are garnering a greater percentage of sales. A decreasing spread indicates that more high-end luxury homes are being sold. Several reasons are offered by industry analysts; 1) builders can realize a profit on higher priced houses; 2) historically low interest rates have indirectly resulted in increasing house prices; and 3) purchasers of upper end houses fared better financially coming out of the Great Recession. Source: /25/18
54 New SF House Sales 100.0% 90.0% 92.5% LHS: < $200m; thousands of units; SAAR RHS: > $500m; thousands of units; SAAR 80.0% 70.0% 60.0% 50.0% 40.0% 52.6% 47.4% 30.0% 20.0% 10.0% 0.0% 7.5% Jan Feb Mar Apr May Jun < $ m (%) > $500m (%) New SF Sales: < $ 200m and > $500m: 2002 to June The number of < $200 thousand plus SF houses has declined dramatically since , 2. Subsequently, from 2012 onward, the > $500 thousand class has soared (on a percentage basis) in contrast to the < $200m class. One of the most oft mentioned reasons for this occurrence is builder margins. Note: Sales values not adjusted for inflation. Source: /25/18
55 New SF House Sales to 54 year old population/new SF sales: 1/1/63 to 12/31/07 ratio: to 54: 6/18 ratio: Total US non-institutionalized population/new SF sales: 1/1/63 to 12/31/07 ratio: All new SF sales: 6/18 ratio: Ratio of New SF Sales/Civilian Noninstitutional Population Ratio of New SF Sales/Civilian Noninstitutional Population (20-54) New SF sales adjusted for the US population From June 1963 to November 2007, the long-term ratio of new house sales to the total US noninstitutionalized population was ; in June it was an decrease from May (0.0026). The non-institutionalized population, aged 20 to 54 long-term ratio is ; in June it was also a decline from May (0.0045). All are non-adjusted data. From a population viewpoint, construction is less than what is necessary for changes in the population (i.e., under-building). Sources: and The Federal Reserve Bank of St. Louis; 7/25/18
56 Railroad Lumber & Wood Shipments vs. U.S. SF House Sales 10,000 LHS: Lumber shipments carloads (weekly average/month) RHS: New SF Sales-in thousands 900 9, , , ,000 5,000 4, , , ,000 0 Data are average weekly originations for each month, are not seasonally adjusted, and do not include intermodal. AAR Lumber & Wood Shipments (U.S. + Canada) New SF Sales Sources: Association of American Railroads (AAR), Rail Time Indicators report 7/6/18; U.S. DOC-Construction; 7/25/18
57 Railroad Lumber & Wood Shipments vs. U.S. SF Housing Sales: 1-year Offset 10,000 LHS: Lumber shipments carloads (weekly average/month) RHS: New SF Sales-in thousands 900 9, , , ,000 5,000 4, , , ,000 0 Data are average weekly originations for each month, are not seasonally adjusted, and do not include intermodal. AAR Lumber & Wood Shipments (U.S. + Canada) New SF Sales (1-yr. offset) In this graph, January 2007 lumber shipments are contrasted with January 2008 SF sales, and continuing through June. The purpose is to discover if lumber shipments relate to future single-family sales. Also, it is realized that lumber and wood products are trucked; however, to our knowledge comprehensive trucking data is not available. Sources: Association of American Railroads (AAR), Rail Time Indicators report 7/6/18; U.S. DOC-Construction; 7/25/18
58 Nominal vs. SAAR New SF House Sales 800 LHS: Nominal & Expansion Factors Nominal & SF data, in thousands RHS: New SF SAAR Contrast of June 2017 and June Nominal and Adjusted New SF Monthly Sales New SF sales (adj) Apparent Expansion Factor New SF sales (non-adj) Presented above is nominal (non-adjusted) new SF sales data contrasted against SAAR data. The apparent expansion factor is the ratio of the unadjusted number of houses sold in the US to the seasonally adjusted number of houses sold in the US (i.e., to the sum of the seasonally adjusted values for the four regions). U.S. DOC-Construction Source: 7/25/18
59 New SF House Sales New SF Houses Sold During Period Total Not started Under Construction Completed May 631, , , ,000 April 666, , , , , , , ,000 M/M change -5.3% 8.3% -7.0% -13.5% Y/Y change 2.4% -2.0% 6.1% 2.9% Total percentage 30.9% 35.7% 33.4% New SF Houses Sold During Period In June, a substantial portion of new sales 30.9% have not been started. * Not SAAR Source: 7/25/18
60 New SF House Sales Thousands of units; not SAAR Sold During the Period Not started Under Construction Completed Not SAAR Source: 7/25/18
61 New SF House Sales Total Not started Under Construction Completed May 301,000 61, ,000 60,000 April 296,000 54, ,000 59, ,000 50, ,000 61,000 M/M change 1.7% 13.0% -1.6% 1.7% Y/Y change 9.9% 22.0% 9.8% -1.6% Total percentage 20.3% 59.8% 19.9% Not SAAR New SF Houses for Sale at the end of the Period Source: 7/25/18
62 New SF House Sales Thousands of units; not SAAR For Sale at End of the Period Not started Under construction Completed Not SAAR Source: 7/25/18
63 New SF House Sales New SF Houses for Sale at the end of the Period by Region* Total NE MW S W May 303,000 22,000 39, ,000 75,000 April 295,000 23,000 39, ,000 74, ,000 25,000 35, ,000 63,000 M/M change 2.7% -4.3% 0.0% 0.6% 1.4% Y/Y change 10.6% -12.0% 11.4% 12.9% 19.0% * Not SAAR Source: 7/25/18
64 New SF Houses Sale at End of Period by Region Thousands of units; not SAAR For sale at end of period 303,000 Northeast 22, % Midwest 39, % South 157, % West 75, % NE MW S W Source: 7/25/18
65 June Construction Spending Total Private Residential* * Millions ** The US DOC does not report improvement spending directly, this is a monthly estimation for 2017: ((Total Private Spending (SF spending + MF spending)). All data are SAARs and reported in nominal US$. SF MF Improvement** June $568,295 $287,416 $59,884 $220,995 May $570,919 $288,573 $61,612 $220, $522,118 $269,085 $58,837 $194,196 M/M change -0.5% -0.4% -2.8% 0.1% Y/Y change 8.8% 6.8% 1.8% 13.8% Source: 7/1/18
66 Total Construction Spending (nominal): 1993 June $700,000 SAAR; in millions of nominal US dollars $600,000 Total Private Nominal Construction Spending: $568,295 bil $500,000 $400,000 $300,000 $200,000 $100,000 $0 Total Residential Spending (nominal) MF Spending (nominal) SF Spending (nominal) Remodeling Spending (nominal) Reported in nominal US$. The US DOC does not report improvement spending directly, this is a monthly estimation for. Source: 7/1/18
67 Total Construction Spending (adjusted): 1993-* $800,000 SAAR; in millions of US dollars (adj.) $700,000 $600,000 $500,000 $400,000 $300,000 $200,000 $100,000 $0 Total Residential Spending (adj.) SF Spending (adj.) MF Spending (adj.) Remodeling Spending (adj.) Reported in adjusted US$: (adjusted for inflation, BEA Table 1.1.9); *January to June reported in nominal US$. Source: 7/1/18
68 Construction Spending Shares: 1993 to June 80.0 SF, MF, & RR: Percent of Total Residential Spending (adj.) SF % MF % RR % Total Residential Spending: 1993 through 2006 SF spending average: 69.2% MF spending average: 7.5 % Residential remodeling (RR) spending average: 23.3 % (SAAR). Note: 1993 to 2016 (adjusted for inflation, BEA Table 1.1.9); June-June 2017 reported in nominal US$. Source: and 71/18
69 Adjusted Construction Spending: Y/Y Percentage Change, 1993 to June SF Spending-nom.: Y/Y % change MF Spending-nom.: Y/Y % change Remodeling Spending-nom.: Y/Y % change Residential Construction Spending: Percentage Change, 1993 to June Presented above is the percentage change of inflation adjusted Y/Y construction spending. All spending measures declined, on a percentage basis, year-over-year. Source: 7/1/18
70 Adjusted Construction Spending: Y/Y Percentage Change, 2000 to June Total Residential Spending Y/Y % change (adj.) MF Spending Y/Y % change (adj.) SF Spending Y/Y % change (adj.) Remodeling Spending Y/Y % change (adj.) Source: 7/1/18
71 Total Adjusted Construction Spending: Y/Y Percentage Change, 1993 to June Total Residential Spending Y/Y % change (adj.) MF Spending Y/Y % change (adj.) SF Spending Y/Y % change (adj.) Remodeling Spending Y/Y % change (adj.) Residential Construction Spending: Percentage Change, 1993 to June Total, MF, and remodeling spending rebounded strongly however, SF appears to have leveled-off. Source: and 71/18
72 Remodeling Metrostudy Robust Outlook For Residential Remodeling Through Mid-Year 2019 Homeowners are expected to increase spending on improvements and repairs at a solid clip over the coming year, according to our latest Leading Indicator of Remodeling Activity (LIRA). The LIRA projects that annual growth in homeowner remodeling expenditure will taper somewhat in the first half of 2019, but still remain around 7 percent. A growing economy and stronger job market are boosting owners willingness to invest in home improvements. Rising home values and increased home equity levels are also encouraging more owners to do larger upgrade and replacement projects. Although the projected growth for remodeling activity remains strong, the low inventory of existing homes for sale is holding back even larger gains, since significant remodeling and repair often occurs around the time of a sale. Even so, annual spending on residential improvements and repairs by homeowners is expected to reach nearly $350 billion by the middle of next year. Abbe Will, Research Associate & Associate Project Director, Remodeling Futures, Harvard Joint Center for Housing Studies Source: 7/19/18
73 Remodeling Source: 7/19/18
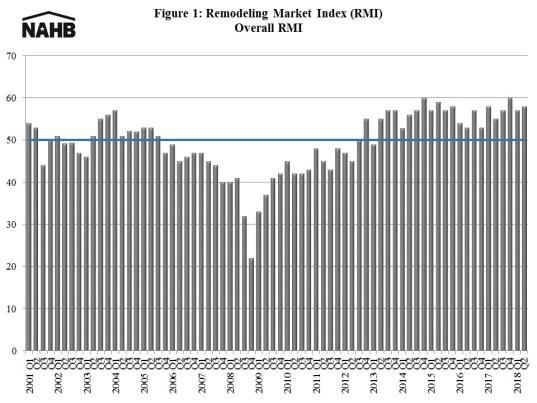
74 Remodeling NAHB Remodeling Confidence Increases Despite Rising Costs The Remodeling Market Index (RMI) rose one point to 58 in the second quarter of, according to the National Association of Home Builders (NAHB). A RMI reading above 50 indicates that more remodelers report market activity is higher than report it is lower compared to the prior quarter. The RMI has been above 50 for 21 consecutive quarters (Figure 1). The RMI is a composite measure of current market conditions and future market indicators. In the second quarter, current market conditions decreased one point to 57. Among its three major components, major additions and alterations waned one point to 55, minor additions and alterations decreased two points to 58, and the home maintenance and repair component rose two points to 59. Meanwhile, future market indicators gained four points to 59 in the second quarter. Among its components, calls for bids fell two points to 55, amount of work committed for the next three months increased two points to 56, the backlog of remodeling jobs jumped nine points to 66 and appointments for proposals rose seven points to 61. The increase in this quarter s RMI reflects a strong remodeling industry supported by continued economic growth. While the market is strong, remodelers are still facing supplyside challenges such as rising material costs and labor shortages. Carmel Ford, Economist, NAHB Source: 7/19/18
75 Remodeling Source: 7/19/18
76 * All sales data: SAAR Existing House Sales National Association of Realtors June sales: thousand Existing Sales* Median Price Mean Price Month's Supply June 5,380,000 $276,900 $314, May 5,410,000 $265,100 $303, ,500,000 $263,300 $303, M/M -0.6% 4.5% 3.7% 4.9% Y/Y change -2.2% 5.2% 3.8% 2.4% NE Sales MW Sales S Sales W Sales June 720,000 1,270,000 2,250,000 1,140,000 May 680,000 1,260,000 2,300,000 1,170, ,000 1,310,000 2,240,000 1,200,000 M/M change 5.9% 0.8% -2.2% -2.6% Y/Y change -4.0% -3.1% 0.4% -5.0% Source: 7/24/18
77 Total Existing House Sales 8,000 7,000 6,000 5,000 SAAR; in thousands Total Existing Sales 5,380,000 Total NE 720, % Total MW 1,270, % Total S 2,250, % Total W 1,140, % 4,000 3,000 2,000 1,000 0 U.S. NE MW S W Sources: & 7/24/18
78 First-Time Purchasers Urban Institute In April, the first-time homebuyer share of GSE purchase loans was 49.3 percent, its highest level in recent history. The FHA has always been more focused on first-time homebuyers, with its first-time homebuyer share hovering around 80 percent; it stood at 83.5 percent in April. The bottom table shows that based on mortgages originated in April, the average first-time homebuyer was more likely than an average repeat buyer to take out a smaller loan and have a lower credit score and higher LTV and DTI, thus requiring a higher interest rate. Laurie Goodman, et al., Co-director, Housing Finance Policy Center Sources: 7/25/18
79 Housing Affordability National Housing Affordability Over Time Urban Institute Home prices remain affordable by historic standards, despite price increases over the last five years and the recent interest rate hikes. As of April, with 20% down, the share of median income needed for the monthly mortgage payment stood at 23%; with 3.5% down, it is 26%. If interest rates rise to 5.3%, the housing expenses to income share with both a 20 percent and a 3.5 percent down payment would be the same as the averages (24 and 28 percent, respectively)..... Bing Lai, Research Associate, Housing Finance Policy Center Sources: 7/25/18
80 Mortgage Credit Availability Source: Mortgage Bankers Association; Powered by Ellie Mae s AllRegs Market Clarity Source: Mortgage Bankers Association; Powered by Ellie Mae s AllRegs Market Clarity Mortgage Credit Availability Increased in July Mortgage credit availability increased in July according to the Mortgage Credit Availability Index (MCAI), a report from the Mortgage Bankers Association (MBA) which analyzes data from Ellie Mae's AllRegs Market Clarity business information tool. The MCAI increased 1.7 percent to in July. A decline in the MCAI indicates that lending standards are tightening, while increases in the index are indicative of loosening credit. The index was benchmarked to 100 in March The Conventional MCAI increased (up 4.2 percent) and the Government MCAI decreased (down 0.4 percent). Of the component indices of the Conventional MCAI, the Jumbo MCAI increased by 5.8 percent while the Conforming MCAI increased by 2.0 percent.. Credit availability continued to expand, driven by an increase in conventional credit supply. More than half of the programs added were for jumbo loans, pushing the jumbo index to its fourth straight increase, and to its highest level since we started collecting these data. There was also continued growth in the conforming non-jumbo space, which reached its highest level since October Joel Kan, Vice President of Economic and Industry Forecasting, MBA Source: 8/7/18
81 Mortgage Credit Source: 7/2/18
The Virginia Tech U.S. Forest Service April 2018 Housing Commentary: Section I
 The Virginia Tech U.S. Forest Service April Housing Commentary: Section I Urs Buehlmann Department of Sustainable Biomaterials College of Natural Resources & Environment Virginia Tech Blacksburg, VA 540.231.9759
The Virginia Tech U.S. Forest Service November 2018 Housing Commentary: Section I
 The Virginia Tech U.S. Forest Service November 2018 Housing Commentary: Section I Urs Buehlmann Department of Sustainable Biomaterials College of Natural Resources & Environment Virginia Tech Blacksburg,
The Virginia Tech U.S. Forest Service July 2018 Housing Commentary: Section I
 The Virginia Tech U.S. Forest Service July 218 Housing Commentary: Section I Urs Buehlmann Department of Sustainable Biomaterials College of Natural Resources & Environment Virginia Tech Blacksburg, VA
The Virginia Tech U.S. Forest Service January 2019 Housing Commentary: Section I
 The Virginia Tech U.S. Forest Service January 2019 Housing Commentary: Section I Urs Buehlmann Department of Sustainable Biomaterials College of Natural Resources & Environment Virginia Tech Blacksburg,
The Virginia Tech U.S. Forest Service October 2018 Housing Commentary: Section I
 The Virginia Tech U.S. Forest Service October 218 Housing Commentary: Section I Urs Buehlmann Department of Sustainable Biomaterials College of Natural Resources & Environment Virginia Tech Blacksburg,
The Virginia Tech U.S. Forest Service November 2017 Housing Commentary: Section I
 The Virginia Tech U.S. Forest Service November 2017 Housing Commentary: Section I Urs Buehlmann Department of Sustainable Biomaterials College of Natural Resources & Environment Virginia Tech Blacksburg,
The Virginia Tech U.S. Forest Service September 2017 Housing Commentary: Section I
 The Virginia Tech U.S. Forest Service September 2017 Housing Commentary: Section I Urs Buehlmann Department of Sustainable Biomaterials College of Natural Resources & Environment Virginia Tech Blacksburg,
The Virginia Tech U.S. Forest Service December 2016 Housing Commentary: Section I
 The Virginia Tech U.S. Forest Service December 2016 Housing Commentary: Section I Urs Buehlmann Department of Sustainable Biomaterials College of Natural Resources & Environment Virginia Tech Blacksburg,
The Virginia Tech U.S. Forest Service September 2016 Housing Commentary: Section I
 The Virginia Tech U.S. Forest Service September Housing Commentary: Section I Urs Buehlmann Department of Sustainable Biomaterials College of Natural Resources & Environment Virginia Tech Blacksburg, VA
The Virginia Tech U.S. Forest Service November 2015 Housing Commentary: Part A
 The Virginia Tech U.S. Forest Service November Housing Commentary: Part A Urs Buehlmann Department of Sustainable Biomaterials College of Natural Resources & Environment Virginia Tech Blacksburg, VA 54.231.9759
The Virginia Tech U.S. Forest Service March 2017 Housing Commentary: Section I
 The Virginia Tech U.S. Forest Service March 217 Housing Commentary: Section I Urs Buehlmann Department of Sustainable Biomaterials College of Natural Resources & Environment Virginia Tech Blacksburg, VA
Real Estate Trends and Outlook
 Real Estate Trends and Outlook Lawrence Yun, Ph.D. Chief Economist NATIONAL ASSOCIATION OF REALTORS Presentation at NAR Region XII Conference Coeur d Alene, ID March 5, 2015 GDP Burst in 2014 Q2, Q3, Q4
Economic and Housing Market Outlook
 Economic and Housing Market Outlook By Lawrence Yun, Ph.D. Chief Economist, National Association of REALTORS Presentations At Raleigh Regional Association of REALTORS At Orange-Chatham Association of REALTORS
Economic & Housing Market Outlook
 Economic & Housing Market Outlook By Lawrence Yun, Ph.D. Chief Economist, National Association of REALTORS Presentations to NAR Annual Conference Boston, MA November 2, 2018 Existing Home Sales Since
Housing Market Outlook
 Housing Market Outlook By Lawrence Yun, Ph.D. Chief Economist, National Association of REALTORS Presentation at National Conference of State Legislatures Washington, DC December 7, 2018 Very Long Economic
Economic & Housing Outlook
 Economic & Housing Outlook By Lawrence Yun, Ph.D. Chief Economist, National Association of REALTORS Presentation at Northern Arizona Association of REALTORS November 30, 2017 Tax Reform Mortgage interest
Welcome to the 10 th Annual Real Estate Symposium for The Lake of the Ozarks. October 5th, 2017 Osage National Golf Resort
 Welcome to the 10 th Annual Real Estate Symposium for The Lake of the Ozarks October 5th, 2017 Osage National Golf Resort Economic and Real Estate Market Outlook October, 2017 Steve Snook, Senior Business
Economic & Real Estate Outlook. Tax Reform. Michigan 4/26/18
 Economic & Real Estate Outlook By Lawrence Yun, Ph.D. Chief Economist, National Association of REALTORS Presentations at Michigan REALTORS Broker Summit Plymouth, MI April 25, 2018 Tax Reform Mortgage
Economic and Real Estate Market Outlook
 Economic and Real Estate Market Outlook By Lawrence Yun, Ph.D. Chief Economist, National Association of REALTORS Presentation at Miami International Congress Miami, FL November 1, 2016 Lifetime Wealth
economy City of Rohnert Park : Local Economic Report EDB Sonoma County
 EDB Sonoma County Economic Development Board economy 2010-11 City of Rohnert Park : Local Economic Report E c o n o m i c D e v e l o p m e n t B o a r d 4 0 1 C o l l e g e Av e n u e S u i t e D S a
THE ECONOMIC OUTLOOK FOR THE U.S. AND THE CONSTRUCTION INDUSTRY
 THE ECONOMIC OUTLOOK FOR THE U.S. AND THE CONSTRUCTION INDUSTRY by William F. Ford, Ph.D. Weatherford Chair of Finance Middle Tennessee State University presented to The Roofing Industry Alliance for Progress
GEORGE RATIU Director, Quantitative & Commercial Research National Association of REALTORS
 GEORGE RATIU Director, Quantitative & Commercial Research National Association of REALTORS 2015 CCIM Commercial Real Estate Outlook Conference Wednesday, January 21, 2015 Coral Gables, FL Where Are We
Real Estate Markets in a Tentative Economic Landscape
 Real Estate Markets in a Tentative Economic Landscape GEORGE RATIU Director, Quantitative & Commercial Research National Association of REALTORS Bay Area Real Estate Council Annual Economic Outlook Tampa,
The State of the Erie Economy
 The State of the Erie Economy Presentation to Presque Isle CPCU Society Chapter September 14, 2017 Kenneth Louie The Economic Research Institute of Erie Sam and Irene Black School of Business Penn State
Lunchtime Data Talk. Housing Finance Policy Center. Housing Data: Home Sales, Affordability, and Realtor/Builder Activity
 Housing Finance Policy Center Lunchtime Data Talk Housing Data: Home Sales, Affordability, and Realtor/Builder Activity Lawrence Yun, National Association of Realtors David Crowe, National Association
SAN DIEGO S QUARTERLY ECONOMIC SNAPSHOT
 SAN DIEGO S QUARTERLY ECONOMIC SNAPSHOT November 2017 SAN DIEGO HIGHLIGHTS IN THIS ISSUE Every quarter San Diego Regional EDC analyzes key economic indicators that are important to understanding the regional
ECONOMIC SNAPSHOT. A Summary of the San Diego Regional Economy UNEMPLOYMENT
 A Summary of the San Diego Regional Economy UNEMPLOYMENT San Diego Regional EDC analyzes key economic metrics that are important to understanding the regional economy and San Diego's standing relative
2012 ACCE Industry Advisory Board Best Practices Positioning Your Firm After the Great Recession
 2012 ACCE Industry Advisory Board Best Practices Positioning Your Firm After the Great Recession 2012 FMI Corporation 0 The Great Recession 2012 FMI Corporation 1 FMI Corporation 2010 1 Market Truths You
SAN DIEGO S QUARTERLY ECONOMIC SNAPSHOT
 SAN DIEGO S QUARTERLY ECONOMIC SNAPSHOT August 2017 highlights in THIS ISSUE Every quarter Regional EDC analyzes key economic indicators that are important to understanding the regional economy and the
USG CORPORATION + U.S. CHAMBER OF COMMERCE. Q4 Commercial. Construction Index. powered by
 D Q4 Commercial USG CORPORATION + U.S. CHAMBER OF COMMERCE 2018 Construction Index powered by THE USG CORPORATION + U.S. CHAMBER OF COMMERCE COMMERCIAL CONSTRUCTION INDEX Throughout 2018, USG Corporation
2019 Business Journal. Chris Raad
 2019 Business Journal Chris Raad Tax Reform Mortgage interest deduction?... $750,000 Property tax deduction? SALT at $10,000 Tax Cut for nearly all However, many will not itemize and do standard deduction
National Population Estimates: March 2009 quarter
 Image description. Hot Off The Press. End of image description. Embargoed until 10:45am 15 May 2009 National Population Estimates: March 2009 quarter Highlights The estimated resident population of New
Dr. Jeffrey Michael. Executive Director, Center for Business and Policy Research University of the Pacific
 2019 San Joaquin County Economic Outlook Dr. Jeffrey Michael Executive Director, Center for Business and Policy Research University of the Pacific Outline Population Growth and Migration California and
The 2013 Hilliard Lyons INVESTKentucky Equity Conference
 The 2013 Hilliard Lyons INVESTKentucky Equity Conference Keynote Address William Ford Ph.D. Weatherford Chair of Finance Middle Tennessee State University THE ECONOMIC OUTLOOK FOR THE U.S. & KENTUCKY ECONOMY
ECONOMIC SNAPSHOT. A Summary of the San Diego Regional Economy UNEMPLOYMENT
 A Summary of the San Diego Regional Economy Brought to you by analyzes key economic metrics that are important to understanding the regional economy and San Diego s standing relative to other major metropolitan
NEWS RELEASE FOR WIRE TRANSMISSION: 8:30 A.M. EDT, FRIDAY, APRIL 17, William Zeile: (202) BEA 09-14
 BEA 09-14") NEWS RELEASE FOR WIRE TRANSMISSION: 8:30 A.M. EDT, FRIDAY, APRIL 17, 2009 William Zeile: (202) 606-9893 BEA 09-14 Summary Estimates for Multinational Companies: Employment, Sales, and Capital Expenditures
NEWS RELEASE FOR WIRE TRANSMISSION: 8:30 A.M. EDT, FRIDAY, APRIL 17, 2009 William Zeile: (202) 606-9893 BEA 09-14 Summary Estimates for Multinational Companies: Employment, Sales, and Capital Expenditures
ECONOMIC SNAPSHOT. A Summary of the San Diego Regional Economy UNEMPLOYMENT
 A Summary of the San Diego Regional Economy Brought to you by San Diego Regional EDC analyzes key economic metrics that are important to understanding the regional economy and San Diego s standing relative
NATIONAL INSTITUTE OF ECONOMIC AND SOCIAL RESEARCH ESTIMATES OF MONTHLY GDP. Embargo until hours on 11 th January 2013
 NATIONAL INSTITUTE OF ECONOMIC AND SOCIAL RESEARCH ESTIMATES OF MONTHLY GDP Embargo until 15.00 hours on 11 th January 2013 Our monthly estimates of GDP suggest that output declined by 0.3 per cent in
Key Census Bureau Economic Programs and Tools
 Key Census Bureau Economic Programs and Tools NY State Data Center Annual Affiliate Meeting May 11, 2017 Presented by: Andrew W. Hait U.S. Census Bureau Outline Overview of Census Economic Data The 2017
SAN DIEGO S QUARTERLY ECONOMIC SNAPSHOT
 SAN DIEGO S QUARTERLY ECONOMIC SNAPSHOT December 2018 SAN DIEGO HIGHLIGHTS IN THIS ISSUE Every quarter San Diego Regional EDC analyzes key economic indicators that are important to understanding the regional
BACCARAT: A LONGITUDINAL MICRO-STUDY
 BACCARAT: A LONGITUDINAL MICRO-STUDY FIELD RESULTS FROM ONE ATLANTIC CITY CASINO, JANUARY 2004 TO JUNE 2010 CENTER FOR GAMING RESEARCH, JULY 2010 Baccarat is the most important game in the world s biggest
DATA APPENDIX TO UNDERSTANDING THE IMPACT OF IMMIGRATION ON CRIME
 DATA APPENDIX TO UNDERSTANDING THE IMPACT OF IMMIGRATION ON CRIME A. Crime Data All measures of crime are based on agency level data on the number of crimes reported to the police, as compiled by the Federal
SAN DIEGO S QUARTERLY ECONOMIC SNAPSHOT
 SAN DIEGO S QUARTERLY ECONOMIC SNAPSHOT February 2018 SAN DIEGO HIGHLIGHTS IN THIS ISSUE Every quarter San Diego Regional EDC analyzes key economic indicators that are important to understanding the regional
January 2018 Industrial Production
 Japan's Economy 28 February 2018 (No. of pages: 6) Japanese report: 28 Feb 2018 January 2018 Industrial Production Jan-Mar period expected to see lull in production growth trend Economic Research Dept.
Charles S. Gascon Regional Economist, Senior Coordinator
 Generated: July 2018 Charles S. Gascon Regional Economist, Senior Coordinator Education MBA, Washington University, 2012 M.A. Economics, State University of New York at Albany, 2006 B.S. Managerial Economics,
Adopted March 17, 2009 (Ordinance 09-15)
") ECONOMIC ELEMENT of the PINELLAS COUNTY COMPREHENSIVE PLAN Prepared By: The Pinellas County Planning Department as staff to the LOCAL PLANNING AGENCY for THE BOARD OF COUNTY COMMISSIONERS OF PINELLAS COUNTY,
ECONOMIC ELEMENT of the PINELLAS COUNTY COMPREHENSIVE PLAN Prepared By: The Pinellas County Planning Department as staff to the LOCAL PLANNING AGENCY for THE BOARD OF COUNTY COMMISSIONERS OF PINELLAS COUNTY,
St. George Mega Trends
 St. George Mega Trends Arthur C. Nelson, Ph.D., FAICP Presidential Professor & Director of Metropolitan Research University of Utah St. George Chamber of Commerce January 31, 2009 Source: http://www.nps.gov/zion/photosmultimedia/index.htm
Taking the Measure of St. Louis
 Taking the Measure of St. Louis The views expressed here are those of the speakers and do not necessarily represent the views of the Federal Reserve Bank of St. Louis or of the Federal Reserve System.
America s Cooperative Electric Utilities The Nation s Consumer Owned Electric Utility Network
 America s Cooperative Electric Utilities The Nation s Consumer Owned Electric Utility Network Electric cooperatives are an integral part of the $391 billion U.S. electric utility industry. They play a
Testing the Progress Out of Poverty Index: Triangulation of the PPI with Key Informant Wealth Ranking Exercises and SILC Financial Diaries Data
 Testing the Progress Out of Poverty Index: Triangulation of the PPI with Key Informant Wealth Ranking Exercises and SILC Financial Diaries Data Expanding Financial Inclusion Project Catholic Relief Services
Financial Wellness Assessment
 Financial Wellness Assessment This assessment is designed to gauge financial wellness and serve as a tool in the financial coaching process. Its purpose is to encourage open conversation about money and
St. George Mega Trends
 St. George Mega Trends Image Source: http://www.nps.gov/zion/photosmultimedia/index.htm Arthur C. Nelson, Ph.D., FAICP Presidential Professor & Director of Metropolitan Research University of Utah St.
XT: Explore Technology LAUNCHING STUDENTS INTO TECHNOLOGY-BASED MAJORS AT VIRGINIA TECH
 XT: Explore Technology LAUNCHING STUDENTS INTO TECHNOLOGY-BASED MAJORS AT VIRGINIA TECH The XT factor: what drives you? THIS MAY NOT BE THE EASIEST QUESTION TO ANSWER. THERE CAN BE SEVERAL THINGS THAT
3Q03 Silicon Wafer Update: Demand Continues Recovery
 Gartner Dataquest Alert 3Q03 Silicon Wafer Update: Demand Continues Recovery The latest silicon forecast indicates that silicon wafer demand will grow 10 percent in 2003 over the previous year. This is
THE TOP 100 CITIES PRIMED FOR SMART CITY INNOVATION
 THE TOP 100 CITIES PRIMED FOR SMART CITY INNOVATION Identifying U.S. Urban Mobility Leaders for Innovation Opportunities 6 March 2017 Prepared by The Top 100 Cities Primed for Smart City Innovation 1.
THE U.S. SEMICONDUCTOR INDUSTRY:
 THE U.S. SEMICONDUCTOR INDUSTRY: KEY CONTRIBUTOR TO U.S. ECONOMIC GROWTH Matti Parpala 1 August 2014 The U.S. Semiconductor Industry: Key Contributor To U.S. Economic Growth August 2014 1 INTRO The U.S.
The Casey Report. E.B. Tucker
 The Casey Report E.B. Tucker How to profit from collapse Everyone knows what s already happened Few people can figure out what happens next Think about incentives What will people do next? These people
Italian Americans by the Numbers: Definitions, Methods & Raw Data
 Tom Verso (January 07, 2010) The US Census Bureau collects scientific survey data on Italian Americans and other ethnic groups. This article is the eighth in the i-italy series Italian Americans by the
Textron Reports Third Quarter 2014 Income from Continuing Operations of $0.57 per Share, up 62.9%; Revenues up 18.1%
 Textron Reports Third Quarter Income from Continuing Operations of $0.57 per Share, up 62.9%; Revenues up 18.1% 10/17/ PROVIDENCE, R.I.--(BUSINESS WIRE)-- Textron Inc. (NYSE: TXT) today reported third
Capcom Co., Ltd. Tokyo and Osaka Exchanges, First Section, rd Quarter Report Fiscal year ending March 31, 2010
 Capcom Co., Ltd. Tokyo and Osaka Exchanges, First Section, 9697 3rd Quarter Report Fiscal year ending March 31, 2010 Precautions Concerning Forward-looking Statements Strategies, plans, outlooks and other
SEMICONDUCTOR INDUSTRY ASSOCIATION FACTBOOK
 Factbook 2014 SEMICONDUCTOR INDUSTRY ASSOCIATION FACTBOOK INTRODUCTION The data included in the 2014 SIA Factbook helps demonstrate the strength and promise of the U.S. semiconductor industry and why it
SBA Mission Who We Are
 SBA Mission Who We Are SBA Small Business Administration Independent agency of the Federal Gov t established in 1953 SBA helps make the American dream of business ownership a reality. Mission We empower
ECONOMIC ELEMENT. of the PINELLAS COUNTY COMPREHENSIVE PLAN. Prepared By: The Pinellas County Planning Department. as staff to the
 ECONOMIC ELEMENT of the PINELLAS COUNTY COMPREHENSIVE PLAN Prepared By: The Pinellas County Planning Department as staff to the LOCAL PLANNING AGENCY for THE BOARD OF COUNTY COMMISSIONERS OF PINELLAS COUNTY,
NAB QUARTERLY SME SURVEY 2018 Q2
 EMBARGOED UNTIL: 11:3AM AEST, 26 JULY 18 NAB QUARTERLY SME SURVEY 18 Q2 SME BUSINESS CONDITIONS EASE SLIGHTLY IN MID 18 NAB Australian Economics SME business conditions eased in 18 Q2 but remain relatively
1Q 2016 Results. Mermaid Maritime Plc. May 23, 2016
 Mermaid Maritime Plc 1Q 2016 Results May 23, 2016 Disclaimer: The information contained in this document is intended only for use during the presentation and should not be disseminated or distributed to
Canadian Consumer Confidence Index A TNS News Release April 18, 2013
 Canadian Consumer Confidence Index A TNS News Release April 18, 2013 Canadian Consumer Confidence Sinks Again Amid Continued Uncertainty over Housing, Jobs News Release Consumer Confidence Indices Overview
ECONOMIC SNAPSHOT. A Summary of the San Diego Regional Economy UNEMPLOYMENT
 A Summary of the San Diego Regional Economy Brought to you by San Diego Regional EDC analyzes key economic metrics that are important to understanding the regional economy and San Diego s standing relative
BUSINESS EMPLOYMENT DYNAMICS
 BUSINESS EMPLOYMENT DYNAMICS First Quarter 2018 Office of Research Kurt Westby, Commissioner Andrew Condon, Director of Research WETHERSFIELD, November 7th, 2018 - (BED) data published quarterly by the
2018 U.S. Ceramic Tile Market Update
 FOR IMMEDIATE RELEASE: Contact: Andrew Whitmire April 8, 2019 T: 864-646-8453 ext. 102 2018 U.S. Ceramic Tile Market Update U.S. Tile Consumption Overview: Total U.S. ceramic tile consumption for 2018
State Content Standards for New Mexico
 Episode 101 What Is a Biz Kid? Episode 102 What Is Money? Episode 103 How Do You Get Money? Episode 104 What Can You Do with Money? Episode 105 Money Moves Episode 106 Taking Charge of Your Financial Future
MMBA SECONDARY MARKET AND LOAN SERVICING CONFERENCE
 MMBA SECONDARY MARKET AND LOAN SERVICING CONFERENCE May 13, 2013 Presented by Timothy M. Warren Jr. Chief Executive Officer The Warren Group Agenda Brief Overview of The Warren Group Market Conditions
National Population Estimates: June 2011 quarter
 National Population Estimates: June 2011 quarter Embargoed until 10:45am 12 August 2011 Highlights The estimated resident population of New Zealand was 4.41 million at 30 June 2011. Population growth was
ROSE GARDEN MEDICAL PLAZA University Blvd., Jacksonville, FL 32216
 AVAILABLE SF: LEASE RATE: FREE BASE RENT LOT SIZE: 4,685 SF $18.00 SF/Yr (NNN) 1 Month Per Lease Year 1.0 Acres PROPERTY OVERVIEW Beautifully upgraded single story medical office building near Memorial
Objective 3.1: Provide or stimulate provision by the private sector of affordable housing units.
 3. HOUSING ELEMENT The purpose of this element is to provide plans and policies that will assist the City in meeting identified or projected deficits in the supply of housing, correcting substandard or
Revised Course Outlines & Pattern of Examinations in the subject of Economics for BA/B.Sc. w.e.f. 1 st Annual Examinations 2018 & onwards
 Annexure - 1 Revised Course Outlines & Pattern of Examinations in the subject of Economics for BA/B.Sc. w.e.f. 1 st Annual Examinations 2018 & onwards Paper A: Microeconomics &Basic Mathematical Economics
ECONOMIC SNAPSHOT. A Summary of the San Diego Regional Economy UNEMPLOYMENT
 A Summary of the San Diego Regional Economy Brought to you by San Diego Regional EDC analyzes key economic metrics that are important to understanding the regional economy and San Diego s standing relative
1. Job offers to BA recipients Job offers for BA recipients on graduation: percent with at least one job Percent 100
 1. Job offers to BA recipients Job offers for BA recipients on graduation: percent with at least one job 1 8 6 4 2 1988 1989 199 1991 1992 1993 1994 1995 1996 1998 1999 2 21 at least one job 56 67.3 68.1
BANKING & MONETARY STATISTICS
 Supplement to BANKING & MONETARY STATISTICS SECTION 11 Currency BOARD OF GOVERNORS OF THE FEDERAL RESERVE SYSTEM Preface In 1 the Board of Governors published Banking and Monetary Statistics to make available
How U.S. Employment Is Changing
 December 1, 211 How U.S. Employment Is Changing Stephen P. A. Brown and Hui Liu During the most recent recession, U.S. employment fell by 7,49 million jobs (5.4 percent). During the first 8 months of the
Robotics Market Update
 Robotics Market Update The Outlook in North America Jeff Burnstein President Robotic Industries Association North American Economic Outlook The Great Recession of 2008-09 Financial meltdown in US caused
Textron Reports Second Quarter 2014 Income from Continuing Operations of $0.51 per Share, up 27.5%; Revenues up 23.5%
 Textron Reports Second Quarter 2014 Income from Continuing Operations of $0.51 per Share, up 27.5%; Revenues up 23.5% 07/16/2014 PROVIDENCE, R.I.--(BUSINESS WIRE)-- Textron Inc. (NYSE: TXT) today reported
ble of Contents This is a licensed product of Ken Research and should not be copied
 ble of Contents 1 TABLE OF CONTENTS 1. India Paints Industry Introduction 1.1. Indian Paint Industry Value Chain 2. India Paints Industry Market Size, FY 2006-FY 2012 2.1. By Revenue, FY 2006-FY 2012 2.2.
Dr. Greg Hallman Director, Real Estate Finance and Investment Center (REFIC) McCombs School of Business University of Texas at Austin
 McCombs School of Business University of Texas at Austin") Dr. Greg Hallman Director, Real Estate Finance and Investment Center (REFIC) McCombs School of Business University of Texas at Austin POWERPOINT PARTNER } The US Economy today, with a close look at jobs
Dr. Greg Hallman Director, Real Estate Finance and Investment Center (REFIC) McCombs School of Business University of Texas at Austin POWERPOINT PARTNER } The US Economy today, with a close look at jobs
INNOVATION IN HOUSING
 Chapter One INNOVATION IN HOUSING Housing in the United States comes in varied forms depending on land, climate, and available resources. Over time, changes in design, materials, building techniques, financing,
2018 Indiana VENTURE REPORT
 218 Indiana VENTURE REPORT Content Overview................................ 2 Indiana s Growing Economy................. 3 Indiana s Value for Business................. 3 National Venture Capital Trends..............
IPI grew moderately at 2.2% in August
 Dr. Mohd Afzanizam Abdul Rashid Chief Economist 03-2088 8075 afzanizam@bankislam.com.my Shafiz Jamaluddin Analyst 03-2088 8399 shafiz@bankislam.com.my Nor Jannah Abdullah Analyst 03-2088 8399 norjannah@bankislam.com.my
Korea s SME Policy Paradigm
 Transition of Korea s SME Policy Paradigm Young Tae Kim Contents I Introduction of Korea SMBA II Current Status of Korean SMEs III Recent Business Environment Changes IV SME Policy Direction I Introduction
The Construction Market in Europe: A Supplier s Point of View
 The Construction Market in Europe: A Supplier s Point of View Dr. Walter Nussbaumer Abstract After the 2009 recession and the 2010 stagnation, recovery took place in 2011 when the World Construction Industry
Executive Summary. Introduction:
 Recommendations for British Columbia s 2013 Budget AME BC s Pre-Budget Submission to the Select Standing Committee on Finance and Government Services - October 18, 2012 Introduction: Executive Summary
Small Business, Entrepreneurship, and Economic Recovery
 U.S. Department of Commerce Minority Business Development Agency Small Business, Entrepreneurship, and Economic Recovery Ivonne Cunarro Co- Hosted by the Kauffman Foundation, Federal Reserve Bank of Atlanta,
RESHAPING METRO WASHINGTON
 RESHAPING METRO WASHINGTON Arthur C. Nelson, Ph.D., FAICP Presidential Professor and Director Metropolitan Research Center University of Utah Urban Land Institute May 21, 2009 Photo: Arthur C. Nelson,
THE PENINSULA ECONOMY
 Economic Update THE PENINSULA ECONOMY June 2016 SILICON VALLEY INSTITUTE for REGIONAL STUDIES Prepared by Stephen Levy This publication is one in a series of periodic updates on the local economy published
III. THE REGIONAL FRAMEWORK
 THE SAN DIEGO REGIONAL ECONOMY III. THE REGIONAL FRAMEWORK The San Diego region, comprised solely of San Diego County, is one of California s most dynamic regions. The efforts of the University within
How new is the new VCE Economics Study Design?
 A TEACHER S GUIDE Implementing the new VCE Economics Study Design with the Economics Down Under series From January 2017, teachers will be working with an exciting and new VCE Economics Study Design for
Life Sciences Outlook
 Life Sciences Outlook Raleigh- 2013-2014 Mid-tier biotech and specialty pharmaceuticals drive demand Across North America, activity and demand within the life sciences industry seems to have shifted from
Produced by the BPDA Research Division:
 Produced by the BPDA Research Division: Alvaro Lima Director Jonathan Lee Deputy Director Christina Kim Research Manager Phillip Granberry Senior Researcher/Demographer Matthew Resseger Senior Researcher/Economist
Dollar Tree for Sale N. Monroe St. Tallahassee, FL
 Dollar Tree for Sale 3706 N. Monroe St. Tallahassee, FL Table of Contents FOR FURTHER INFORMATION Joe Boyd office 843.973.8283 mobile 843.906.7751 email joe@twinriverscap.com 3706 N. Monroe St. Tallahassee,
Simulated Statistics for the Proposed By-Division Design In the Consumer Price Index October 2014
 Simulated Statistics for the Proposed By-Division Design In the Consumer Price Index October 2014 John F Schilp U.S. Bureau of Labor Statistics, Office of Prices and Living Conditions 2 Massachusetts Avenue
Cattle and Beef Markets: Short and Long Run Challenges and Opportunities
 Cattle and Beef Markets: Short and Long Run Challenges and Opportunities Derrell S. Peel Breedlove Professor of Agribusiness and Extension Livestock Marketing Specialist Oklahoma State University Major
Washington, D.C. Metro Area November 2018 Housing Market Update
 Washington, D.C. Metro Area November 2018 Housing Market Update Washington D.C. Metro prices of $449,900 at record November level; sales continue to cool; for the first time since early 2016, inventories