The Virginia Tech U.S. Forest Service January 2019 Housing Commentary: Section I
|
|
|
- Junior Snow
- 5 years ago
- Views:
Transcription

1 The Virginia Tech U.S. Forest Service January 2019 Housing Commentary: Section I Urs Buehlmann Department of Sustainable Biomaterials College of Natural Resources & Environment Virginia Tech Blacksburg, VA buehlmann@gmail.com Delton Alderman Forest Products Marketing Unit Forest Products Laboratory U.S. Forest Service Madison, WI dalderman@fs.fed.us 2018 Virginia Polytechnic Institute and State University VCE-CNRE NP Virginia Cooperative Extension programs and employment are open to all, regardless of age, color, disability, gender, gender identity, gender expression, national origin, political affiliation, race, religion, sexual orientation, genetic information, veteran status, or any other basis protected by law. An equal opportunity/affirmative action employer. Issued in furtherance of Cooperative Extension work, Virginia Polytechnic Institute and State University, Virginia State University, and the U.S. Department of Agriculture cooperating. Edwin J. Jones, Director, Virginia Cooperative Extension, Virginia Tech, Blacksburg; M. Ray McKinnie, Administrator, 1890 Extension Program, Virginia State University, Petersburg.
2 Table of Contents Slide 3: Opening Remarks Slide 4: Housing Scorecard Slide 5: Wood Use in Construction Slide 8: New Housing Forecasts Slide 12: New Housing Starts Slide 17: Regional Housing Starts Slide 26: New Housing Permits Slide 29: Regional New Housing Permits Slide 36: Housing Under Construction Slide 38: Regional Under Construction Slide 43: Housing Completions Slide 48: Regional Housing Completions Slide 50: New Single-Family House Sales Slide 53: Regional SF House Sales & Price Slide 60: New SF Sales-Population Ratio Slide 70: Construction Spending Slide 73: Construction Spending Shares Slide 84: Existing House Sales Slide 89: Affordability Slide 92: First-Time Purchasers Slide 95: State of the Housing Market Slide 96: Summary Slide 97: Virginia Tech Disclaimer Slide 98: USDA Disclaimer This report is a free monthly service of Virginia Tech. Past issues are available at: To request the commentary, please buehlmann@gmail.com or dalderman@fs.fed.us
3 Opening Remarks January housing data suggests a tepid housing construction and sales markets. January housing data was decidedly mixed, with month-over-month increases and year-over-year declines in total starts and permits. Most problematic was the continued decline in single-family permits, as well as construction spending total and single-family. Housing under construction and completions data were solid. Existing sales continued their downward trend. The March 13th Atlanta Fed GDPNow model for Q1: 2019 projects an aggregate 0.6% increase for residential investment spending. New private permanent site expenditures were projected at a 13.1% decrease; the improvement spending forecast was a 8.5% increase; and the manufactured/mobile housing projection was a 15.5% increase (all: quarterly log change and seasonally adjusted annual rate) 1. All things must pass. For five years now, the housing-market story has been a story of strong demand and limited supply. Now, demand has been abated by unrelenting price gains, higher mortgage rates and a widespread sense that homes have become unaffordable, which is keeping some would-be homebuyers on the sidelines. Thankfully, for mortgage originators and the country as a whole, supply remains tight in most areas, so an outright housing bust isn t expected. What is the most likely scenario for 2019? Sales may decline by 3 to 6 percent, and home-price growth will be slower. National home prices could still grow 2 to 4 percent next year, so long as the U.S. continues to have a constrained housing supply and ample job opportunities. Thankfully, a soft landing is a lot more likely than a crash since two engines are still going strong, for the moment at least. Job growth remains robust with total employment at record highs. The housing shortage is not going away anytime soon: New home sales and builders incentives to break ground on additional housing have been hampered by higher fixed costs such as local assessment fees, a labor shortage and tariffs. New residential construction is around 1.3 million new units a year, while trend demand is likely somewhere between 1.5 million and 1.7 million new units a year. Another way to see how the country is underbuilt is by looking at today s residential fixed investment as a percentage of gross domestic product. It s now 3.9 percent compared to the historical average of 4.6 percent. 2 Ralph DeFranco, Global Chief Economist, Mortgage Group, Arch Capital Services Inc. This month s commentary contains applicable housing data: Section I contains data and commentary and Section II includes regional Federal Reserve analysis, private indicators, and demographic and economic commentary. Sources: 1 3/22/19; 2 2/5/19
4 January 2019 Housing Scorecard M/M M/M = month-over-month; Y/Y = year-over-year; NC = no change Y/Y Housing Starts 18.6% 7.8% Single-Family (SF) Starts 25.1% 4.5% Housing Permits 1.4% 1.5% SF Permits 2.1% 6.7% Housing Under Construction 0.4% 3.6% SF Under Construction 0.6% 8.0% Housing Completions 27.6% 2.1% SF Completions 30.2% 6.2% New SF House Sales 6.9% 4.1% Private Residential Construction Spending 0.3% 5.6% SF Construction Spending 0.7% 7.2% Existing House Sales 1 1.2% 8.5% Sources: U.S. Department of Commerce-Construction; 1 FRED: Federal Reserve Bank of St. Louis
5 New Construction s Percentage of Wood Products Consumption 36% 56% 69% All Sawnwood Structural panels Non-structural panels Source: U.S. Forest Service. Howard, J. and D. McKeever U.S. Forest Products Annual Market Review and Prospects,
6 New SF Construction Percentage of Wood Products Consumption 14% 86% Non-structural panels: New Housing Other markets 60% 40% Structural panels: New housing Other markets 25% All Sawnwood: New housing 75% Other markets Source: U.S. Forest Service. Howard, J. and D. McKeever U.S. Forest Products Annual Market Review and Prospects,
7 Repair and Remodeling s Percentage of Wood Products Consumption 14% Non-structural panels: Remodeling 23% All Sawnwood: Remodeling 86% Other markets 77% Other markets 21% Structural panels: Remodeling 79% Other markets Source: U.S. Forest Service. Howard, J. and D. McKeever U.S. Forest Products Annual Market Review and Prospects,
8 2019 Housing Forecasts* * All in thousands of units Total starts, range: 1,134 to 1,400 Median: 1,283 SF starts, range: 815 to 920 Median: 900 New SF house sales, range: 618 to 688 Median: 637 Organization Total Starts SF Starts APA - The Engineered Wood Association a 1, John Burns Real Estate Consulting LLC b 1,290 Bank of Montreal (BOM) c 1,240 Blue Chip Economic Indicators d 1,332 Deloitte e 1,160 Dodge Data & Analytics f 1, Forest2Market g 1,259 New SF House Sales Fannie Mae h 1, Freddie Mac i 1, Goldman Sachs j 1, Mortgage Bankers Association (MBA) k 1,
9 2019 Housing Forecasts* * All in thousands of units Organization Total Starts Single- Family Starts National Association of Homebuilders l 1, New House Sales National Association of Realtors m 1, PNC Financial Services Group n 1,285 RISI o 1, Royal Bank of Canada (RBC) p 1,313 Scotiabank q 1,250 TD Economics r 1,240 The Federal Reserve Bank of Chicago s 1,280 UCLA Ziman Center for Real Estate t 1,310 Urban Institute u 1,400 Wells Fargo LLC v 1, Zelmann & Associates w 915
10 References a-random Lengths, Volume 75, Issue 1 (1/4/19). Random Lengths Publications, Inc. Eugene, OR. 12 pps. b- 12/19/18 c- d- e- f- g- h- i- j- k- January 2019 l-random Lengths, Volume 75, Issue 1. Random Lengths Publications, Inc. Eugene, OR. 12 pps. m- o- p- q- n- r- s- t- u- v pdf w-
11 2019 Housing Forecasts* Total starts, range: 1,134 to 1,400 Median: 1,280 Single-family starts, range: 815 to 920 Median: 900 New SF house sales, range: 618 to 688 Median: Housing Forecasts* Total starts, range: 1,248 to 1,320 Median: 1,280 Single-family starts, range: 850 to 981 Median: 912 New SF house sales, range: 653 to 700 Median: Housing Forecasts* * All in thousands of units Total starts, range: 1,170 to 1,500 Median: 1,271 Single-family starts, range: 795 to 893 Median: 856 New SF house sales, range: 610 to 680 Median: 642
12 New Housing Starts Total Starts* SF Starts MF 2-4 Starts** MF 5 Starts January 1,230, ,000 15, ,000 December 1,037, ,000 19, , ,334, ,000 13, ,000 M/M change Y/Y change * All start data are presented at a seasonally adjusted annual rate (SAAR). ** US DOC does not report 2 to 4 multifamily starts directly, this is an estimation ((Total starts (SF + 5 unit MF)). Source: 3/8/19
13 Total Housing Starts 2,000 1,800 1,600 1,400 1,200 1, SAAR = Seasonally adjusted annual rate; in thousands Total Starts 1,230,000 Total SF 926, % Total 2-4 MF 15, % Total 5 MF 289, % Total starts 58-year average: 1,439 m units SF starts 58-year average: 1,022 m units MF starts 53-year average: 420 m units US DOC does not report 2 to 4 multifamily starts directly, this is an estimation: ((Total starts (SF + Total MF)). * Percentage of total starts. SF Starts 2-4 MF Starts 5 MF Starts Source: 3/8/19
14 New SF Starts to 54 population/sf starts: 1/1/59 to 7/1/07 ratio: to 54 year old classification: 10/19 ratio: Total non-institutionalized/start ratio: 1/1/59 to 7/1/07: Total: 10/19 ratio: Ratio: SF Housing Starts/Civilian Noninstitutional Population Ratio: SF Housing Starts/Civilian Noninstitutional Population (20-54) New SF starts adjusted for the US population From January 1959 to January 2007, the long-term ratio of new SF starts to the total US non-institutionalized population was ; in January 2018 it was an increase from December (0.0029). The long-term ratio of non-institutionalized population, aged 20 to 54 is ; in January 2018 was also an increase from December (0.0050). From a population worldview, new SF construction is less than what is necessary for changes in population (i.e., under-building). Sources: and The Federal Reserve Bank of St. Louis; 3/8/19
15 Total Housing Starts: Six-Month Average 1,400 1,350 Total Starts SAAR; in thousands 1,300 1,250 1,200 1,230 1,200 1,150 1,100 1,050 1,000 Total Starts: (monthly) Total Starts: 6-month Ave. Source: 3/8/19
16 SF Housing Starts: Six-Month Average 1,000 SF Starts SAAR; in thousands SF Starts: (monthly) SF Starts: 6-month Ave. Source: 3/8/19
17 New Housing Starts by Region 1,200 SAAR; in thousands 1, Total Regional Starts Total NE 149, % Total MW 116, % Total S 700, % Total W 265, % Total NE Starts Total MW Starts Total S Starts Total W Starts NE = Northeast, MW = Midwest, S = South, W = West US DOC does not report 2 to 4 multi-family completions directly, this is an estimation (Total completions SF completions). * Percentage of total starts. Source: 3/8/19
18 New Housing Starts by Region NE Total NE SF NE MF** January 149,000 83,000 66,000 December 94,000 50,000 44, ,000 62,000 54,000 M/M change Y/Y change MW Total MW SF MW MF January 116, ,000 7,000 December 123,000 92,000 31, , ,000 23,000 M/M change Y/Y change All data are SAAR; NE = Northeast and MW = Midwest. ** US DOC does not report multifamily starts directly, this is an estimation (Total starts SF starts). Source: 3/8/19
19 New Housing Starts by Region S Total S SF S MF** January 700, , ,000 December 615, , , , , ,000 M/M change Y/Y change W Total W SF W MF January 265, ,000 52,000 December 205, ,000 58, , , ,000 M/M change Y/Y change All data are SAAR; S = South and W = West. ** US DOC does not report multifamily starts directly, this is an estimation (Total starts SF starts). Source: 3/8/19
20 Total SF Housing Starts by Region SAAR; in thousands Total SF Starts by Region Total NE 83, % Total MW 109, % Total S 521, % Total W 213, % NE = Northeast, MW = Midwest, S = South, W = West US DOC does not report 2 to 4 multi-family completions directly, this is an estimation (Total completions SF completions). * Percentage of total starts. NE SF Starts MW SF Starts S SF Starts W SF Starts Source: 3/8/19
21 1, LHS: SAAR; in thousands Nominal & SAAR SF Starts RHS: Non-adjusted; in thousands January 2017 and January New SF Starts (adj) Apparent Expansion Factor New SF Starts (non-adj) Nominal and Adjusted New SF Monthly Starts Presented above is nominal (non-adjusted) new SF start data contrasted against SAAR data. The apparent expansion factor is the ratio of the unadjusted number of houses started in the US to the seasonally adjusted number of houses started in the US (i.e., to the sum of the seasonally adjusted values for the four regions). U.S. DOC-Construction Source: 3/8/19
22 MF Housing Starts by Region SAAR; in thousands Total MF Starts by Region Total NE 66, % Total MW 7, % Total S 179, % Total W 52, % NE MF Starts MW MF Starts S MF Starts W MF Starts NE = Northeast, MW = Midwest, S = South, W = West US DOC does not report 2 to 4 multi-family completions directly, this is an estimation (Total completions SF completions). * Percentage of total starts. Source: 3/8/19
23 SF vs. MF Housing Starts (%) 100.0% 90.0% 80.0% 70.0% 78.5% 75.3% 60.0% 50.0% 40.0% 30.0% 20.0% 21.5% 24.7% 10.0% 0.0% Single-Family Starts: % Multi-Family Starts: % Source: 3/8/19
24 Railroad Lumber & Wood Shipments vs. U.S. SF Housing Starts 10,000 LHS: Lumber shipments carloads (weekly average/month) RHS: SF Starts-in thousands 1,400 9,000 1,200 8,000 7,000 1,000 6, ,000 4, , ,000 1,000 0 Data are average weekly originations for each month, are not seasonally adjusted, and do not include intermodal. AAR Lumber & Wood Shipments (U.S. + Canada) SF Starts Sources: Association of American Railroads (AAR), Rail Time Indicators report 2/7/19; U.S. DOC-Construction; 3/8/19
25 Railroad Lumber & Wood Shipments vs. U.S. SF Housing Starts: 6-month Offset 10,000 LHS: Lumber shipments carloads (weekly average/month) RHS: SF Starts-in thousands 1,400 9,000 8,000 1,200 7,000 1,000 6, ,000 4, , ,000 1,000 0 Data are average weekly originations for each month, are not seasonally adjusted, and do not include intermodal. AAR Lumber & Wood Shipments (U.S. + Canada) SF Starts (6-mo. offset) In this graph, January 2007 lumber shipments are contrasted with January 2007 SF starts, and continuing through January 2018 SF starts. The purpose is to discover if lumber shipments relate to future single -family starts. Also, it is realized that lumber and wood products are trucked; however, to our knowledge comprehensive trucking data is not available. Sources: Association of American Railroads (AAR), Rail Time Indicators report 2/7/19; U.S. DOC-Construction; 3/8/19
26 New Housing Permits Total Permits* SF Permits MF 2-4 unit Permits * All permit data are presented at a seasonally adjusted annual rate (SAAR). MF 5 unit Permits January 1,345, ,000 51, ,000 December 1,326, ,000 37, , ,366, ,000 45, ,000 M/M change Y/Y change Source: 3/8/19
27 Total New Housing Permits 1,800 1,600 1,400 1,200 SAAR; in thousands Total Permits 1,345,000 Total SF 812, % Total 2-4 MF 51, % Total 5 MF 482, % 1, NE = Northeast, MW = Midwest, S = South, W = West US DOC does not report 2 to 4 multi-family completions directly, this is an estimation (Total completions SF completions). * Percentage of total permits. SF Permits 2-4 MF Permits 5 MF Permits Source: 3/8/19
28 Nominal & SAAR SF Permits 1, LHS: SAAR; in thousands RHS: Non-adjusted; in thousands January 2017 and January New SF Permits (adj) Apparent Expansion Factor New SF Permits (non-adj) Nominal and Adjusted New SF Monthly Permits Presented above is nominal (non-adjusted) new SF start data contrasted against SAAR data. The apparent expansion factor is the ratio of the unadjusted number of houses started in the US to the seasonally adjusted number of houses started in the US (i.e., to the sum of the seasonally adjusted values for the four regions). U.S. DOC-Construction Source: 3/8/19
29 New Housing Permits by Region NE Total* NE SF NE MF** January 139,000 56,000 83,000 December 110,000 57,000 53, ,000 48,000 67,000 M/M change Y/Y change MW Total* MW SF MW MF** January 193, ,000 81,000 December 145, ,000 35, , ,000 52,000 M/M change Y/Y change All data are SAAR ** US DOC does not report multifamily starts directly, this is an estimation (Total starts SF starts). Source: 3/8/19
30 New Housing Permits by Region S Total* S SF S MF** January 664, , ,000 December 688, , , , , ,000 M/M change Y/Y change W Total* W SF W MF** January 349, , ,000 December 383, , , , , ,000 M/M change Y/Y change * All data are SAAR ** US DOC does not report multifamily starts directly, this is an estimation (Total starts SF starts). Source: 3/8/19
31 Total Housing Permits by Region 1,200 SAAR; in thousands 1, Total Regional Permits Total NE 139, % Total MW 193, % Total S 664, % Total W 349, % NE Permits MW Permits S Permits W Permits NE = Northeast, MW = Midwest, S = South, W = West US DOC does not report 2 to 4 multi-family completions directly, this is an estimation (Total completions SF completions). * Percentage of total permits. Source: 3/8/19
32 SF Housing Permits by Region SAAR; in thousands Total SF Permits Total NE 56, % Total MW 112, % Total S 449, % Total W 195, % * Percentage of total permits. NE SF Permits MW SF Permits S SF Permits W SF Permits NE = Northeast, MW = Midwest, S = South, W = West US DOC does not report 2 to 4 multi-family completions directly, this is an estimation (Total completions SF completions). Source: 3/8/19
33 MF Housing Permits by Region SAAR; in thousands Total MF Permits Total NE 83, % Total MW 81, % Total S 215, % Total W 154, % * Percentage of total permits. NE MF Permits MW MF Permits S MF Permits W MF Permits NE = Northeast, MW = Midwest, S = South, W = West US DOC does not report 2 to 4 multi-family completions directly, this is an estimation (Total completions SF completions). Source: 3/8/19
34 Railroad Lumber & Wood Shipments vs. U.S. SF Housing Permits 10,000 LHS: Lumber shipments carloads (weekly average/month) RHS: SF permits-in thousands 1,200 9,000 8,000 1,000 7, ,000 5, ,000 3, ,000 1,000 0 Data are average weekly originations for each month, are not seasonally adjusted, and do not include intermodal. AAR Lumber & Wood Shipments (U.S. + Canada) SF Permits Sources: Association of American Railroads (AAR), Rail Time Indicators report 2/7/19; U.S. DOC-Construction; 3/8/19
35 Railroad Lumber & Wood Shipments vs. U.S. SF Housing Permits: 3-month Offset 10,000 LHS: Lumber shipments carloads (weekly average/month) RHS: SF Starts-in thousands 1,200 9,000 8,000 1,000 7, ,000 5, ,000 3, ,000 1,000 0 Data are average weekly originations for each month, are not seasonally adjusted, and do not include intermodal. AAR Lumber & Wood Shipments (U.S. + Canada) SF Permits (3-mo. offset) In this graph, January 2007 lumber shipments are contrasted with January 2007 SF permits, continuing through January The purpose is to discover if lumber shipments relate to future single -family permits. Also, it is realized that lumber and wood products are trucked; however, to our knowledge comprehensive trucking data is not available. Sources: Association of American Railroads (AAR), Rail Time Indicators report 2/7/19; U.S. DOC-Construction; 3/8/19
36 New Housing Under Construction (HUC) Total Under Construction* SF Under Construction MF 2-4 unit** Under Construction All housing under construction data are presented at a seasonally adjusted annual rate (SAAR). ** US DOC does not report 2-4 multifamily units under construction directly, this is an estimation ((Total under construction (SF + 5 unit MF)). MF 5 unit Under Construction January 1,157, ,000 14, ,000 December 1,152, ,000 13, , ,117, ,000 11, ,000 M/M change Y/Y change Source: 3/8/19
37 Total Housing Under Construction 1, SAAR; in thousands Total HUC 1,157,000 Total SF 542, % Total 2-4 MF 14, % Total 5 MF 601, % SF Under Construction 2-4 MF Under Construction 5 MF Under Construction NE = Northeast, MW = Midwest, S = South, W = West US DOC does not report 2 to 4 multi-family completions directly, this is an estimation (Total completions SF completions). * Percentage of total housing under construction units. Source: 3/8/19
38 New Housing Under Construction by Region NE Total NE SF NE MF** January 191,000 65, ,000 December 188,000 63, , ,000 53, ,000 M/M change Y/Y change MW Total MW SF MW MF January 156,000 83,000 73,000 December 154,000 81,000 73, ,000 82,000 70,000 M/M change Y/Y change All data are SAAR; NE = Northeast and MW = Midwest. ** US DOC does not report multifamily units under construction directly, this is an estimation (Total under construction SF under construction). Source: 3/8/19
39 New Housing Under Construction by Region S Total S SF S MF** January 484, , ,000 December 476, , , , , ,000 M/M change Y/Y change W Total W SF W MF January 326, , ,000 December 334, , , , , ,000 M/M change Y/Y change All data are SAAR; S = South and W = West. ** US DOC does not report multifamily units under construction directly, this is an estimation (Total under construction SF under construction). Source: 3/8/19
40 Total Housing Under Construction by Region SAAR; in thousands Total Regional HUC Total NE 191, % Total MW 156, % Total S 484, % Total W 326, % NE Under Construction MW Under Construction S Under Construction W Under Construction NE = Northeast, MW = Midwest, S = South, W = West US DOC does not report 2 to 4 multi-family completions directly, this is an estimation (Total completions SF completions). * Percentage of total housing under construction units. Source: 3/8/19
41 SF Housing Under Construction by Region SAAR; in thousands Total SF HUC Total NE 65, % Total MW 83, % Total S 252, % Total W 142, % NE SF Under Construction S SF Under Construction MW SF Under Construction W SF Under Construction NE = Northeast, MW = Midwest, S = South, W = West US DOC does not report 2 to 4 multi-family completions directly, this is an estimation (Total completions SF completions). * Percentage of total housing under construction units. Source: 3/8/19
42 MF Housing Under Construction by Region SAAR; in thousands Total MF HUC Total NE 126, % Total MW 73, % Total S 232, % Total W 184, % NE MF Under Construction S MF Under Construction MW MF Under Construction W MF Under Construction NE = Northeast, MW = Midwest, S = South, W = West US DOC does not report 2 to 4 multi-family completions directly, this is an estimation (Total completions SF completions). * Percentage of total housing under construction units. Source: 3/8/19
43 New Housing Completions Total Completions* SF Completions MF 2-4 unit** Completions MF 5 unit Completions January 1,244, ,000 3, ,000 December 975, ,000 11, , ,218, ,000 11, ,000 M/M change 27.6% 30.2% -72.7% 24.8% Y/Y change 2.1% 6.4% -72.7% -6.0% * All completion data are presented at a seasonally adjusted annual rate (SAAR). ** US DOC does not report multifamily completions directly, this is an estimation ((Total completions (SF + 5 unit MF)). Source: 3/8/19
44 Total Housing Completions 1,800 1,600 1,400 1,200 SAAR; in thousands Total Completions 1,244,000 Total SF 914, % Total 2-4 MF 3, % Total 5 MF 327, % 1, Total SF Completions Total 2-4 MF Completions Total 5 MF Completions US DOC does not report 2 to 4 multi-family completions directly, this is an estimation (Total completions SF completions). * Percentage of total housing completions Source: 3/8/19
45 Total Housing Completions by Region 1, SAAR; in thousands Total Regional Completions Total NE 124, % Total MW 110, % Total S 620, % Total W 390, % NE Completions MW Completions S Completions W Completions NE = Northeast, MW = Midwest, S = South, W = West US DOC does not report 2 to 4 multi-family completions directly, this is an estimation (Total completions SF completions). * Percentage of total housing completions Source: 3/8/19
46 Total Housing SF Completions by Region SAAR; in thousands Total SF Completions Total NE 47, % Total MW 106, % Total S 480, % Total W 281, % NE SF Completions MW SF Completions S SF Completions W SF Completions NE = Northeast, MW = Midwest, S = South, W = West US DOC does not report 2 to 4 multi-family completions directly, this is an estimation (Total completions SF completions). * Percentage of total housing completions Source: 3/8/19
47 New Housing Completions by Region NE Total NE SF NE MF** January 124,000 47,000 77,000 December 71,000 44,000 27, ,000 60,000 54,000 M/M change 74.6% 6.8% 185.2% Y/Y change 8.8% -21.7% 42.6% MW Total MW SF MW MF January 110, ,000 4,000 December 118,000 96,000 22, , ,000 37,000 M/M change -6.8% 10.4% -81.8% Y/Y change -34.9% -19.7% -89.2% All data are SAAR; NE = Northeast and MW = Midwest. ** US DOC does not report multifamily units under construction directly, this is an estimation (Total under construction SF under construction). Source: 3/8/19
48 New Housing Completions by Region S Total S SF S MF** January 620, , ,000 December 502, , , , , ,000 M/M change 23.5% 29.4% 6.9% Y/Y change 4.0% 7.9% -7.3% W Total W SF W MF January 390, , ,000 December 284, ,000 93, , , ,000 M/M change 37.3% 47.1% 17.2% Y/Y change 15.0% 26.6% -6.8% All data are SAAR; S = South and W = West. ** US DOC does not report multifamily units under construction directly, this is an estimation (Total under construction SF under construction). Source: 3/8/19
49 New Housing MF Completions by Region 250 SAAR; in thousands 200 Total MF Completions Total NE 77, % Total MW 4, % Total S 140, % Total W 109, % NE MF Completions MW MF Completions S MF Completions W MF Completions NE = Northeast, MW = Midwest, S = South, W = West US DOC does not report 2 to 4 multi-family completions directly, this is an estimation (Total completions SF completions). * Percentage of total housing completions All data are SAAR; NE = Northeast and MW = Midwest; * Percentage of total housing completions. Source: 3/8/19
50 New Single-Family House Sales New SF Sales* Median Price Mean Price * All new sales data are presented at a seasonally adjusted annual rate (SAAR) 1 and housing prices are adjusted at irregular intervals 2. New SF sales were less than the consensus forecast 3 of 612 m. The past three month s new SF sales data also were revised: October initial: 544 m revised to 552 m; November initial: 657 m revised to 628 m; January initial: 621 m revised to 652 m. Month's Supply January 607,000 $317,200 $373, December 652,000 $319,100 $374, ,000 $329,600 $377, M/M change -6.9% -0.6% -0.2% 4.8% Y/Y change -4.1% -3.8% -1.2% 17.9% Sources: 1 3/14/19; /14/19
51 New SF House Sales 1,400 SAAR; in thousands 1,200 1, average: 650,963 units average: 633,895 units January 2019: 607, Total New SF Sales Source: 3/14/19
52 New SF Housing Sales: Six-month average & monthly 800 SAAR; in thousands Six-month SF Sales Average New SF Sales (monthly) Source: 3/14/19
53 New SF House Sales by Region and Price Category NE SF Sales MW SF Sales S SF Sales W SF Sales January 31,000 50, , ,000 December 35,000 70, , , ,000 86, , ,000 M/M change -11.4% -28.6% -15.1% 27.8% Y/Y change -11.4% -41.9% 6.2% -3.2% $150m 1 All data are SAAR 2 Houses for which sales price were not reported have been distributed proportionally to those for which sales price was report ed; 3 Detail may not add to total because of rounding. 4 Housing prices are adjusted at irregular intervals. $150 - $199.9m $ m $300 - $399.9m $400 - $499.9m $500 - $749.9m $750m January 1,2,3,4 1,000 3,000 17,000 13,000 5,000 5,000 2,000 December 3,000 4,000 15,000 11,000 7,000 7,000 2, ,000 6,000 13,000 12,000 7,000 7,000 2,000 M/M change -66.7% -25.0% 13.3% 18.2% -28.6% -28.6% 0.0% Y/Y change -50.0% -50.0% 30.8% 8.3% -28.6% -28.6% 0.0% New SF sales: % 2.2% 6.7% 37.8% 28.9% 11.1% 11.1% 4.4% Sources: 1,2,3 3/14/19; 4
54 New SF House Sales January New SF Sales* $750m $500-$749.9m $400-$499.9m 2,000 5,000 5,000 New SF Sales: % $150m 2.2% $ m 6.7% $ m 37.8% $300-$399.9m 28.9% $400-$499.9m 11.1% $500-$749.9m 11.1% $750m 4.4% 13,000 $300-$399.9m $ m 17,000 $150-$199.9m 3,000 $150m 1,000-2,000 4,000 6,000 8,000 10,000 12,000 14,000 16,000 18,000 * Total new sales by price category and percent. Source: 3/14/19
55 New SF House Sales by Region 700 SAAR; in thousands Total SF Sales Total NE 31, % Total MW 50, % Total S 342, % Total W 184, % NE SF Sales MW SF Sales S SF Sales W SF Sales * Percentage of total new sales. Source: 3/14/19
56 New SF House Sales by Price Category ; in thousands, and thousands of dollars; SAAR 2018 Total New SF Sales*: 627 m units < $150 $ $ $300-$ $400-$ $500-$ > $750 0 * Sales tallied by price category Source: 3/14/19
57 New SF House Sales 100.0% 90.0% 92.4% 80.0% 74.5% 70.0% 60.0% 50.0% 40.0% 30.0% 20.0% 25.5% 10.0% 0.0% 7.6% % of Sales: $400m % of Sales: $400m New SF Sales $400m houses: 2002 January 2019 The sales share of $400 thousand plus SF houses is presented above 1, 2. Since the beginning of 2012, the upper priced houses have and are garnering a greater percentage of sales. A decreasing spread indicates that more high-end luxury homes are being sold. Several reasons are offered by industry analysts; 1) builders can realize a profit on higher priced houses; 2) historically low interest rates have indirectly resulted in increasing house prices; and 3) purchasers of upper end houses fared better financially coming out of the Great Recession. Source: /14/19
58 New SF House Sales 100.0% 90.0% 92.5% 80.0% 70.0% 63.6% 60.0% 50.0% 40.0% 30.0% 36.4% 20.0% 10.0% 0.0% 7.5% New SF Sales: $ 200m and $500m: 2002 to January 2019 The number of $200 thousand plus SF houses has declined dramatically since , 2. Subsequently, from 2012 onward, the $500 thousand class has soared (on a percentage basis) in contrast to the $200m class. One of the most oft mentioned reasons for this occurrence is builder net margins. Note: Sales values are not adjusted for inflation. < $ m (%) > $500m (%) Source: /14/19
59 New SF House Sales by Square Feet of Floor Area in thousands of units; SAAR ,400 sq ft 4,000 sq ft New SF Sales: 1,400 square feet and 4,000 square feet: 1999 to 2017 The number of SF houses sold ( 4,000 sq ft) has risen dramatically since Some of the most oft mentioned reasons for this is builder net margins; regulations, and finance availability. Source: ; 11/28/18
60 New SF House Sales to 54 year old population/new SF sales: 1/1/63 to 12/31/07 ratio: to 54: 1/19 ratio: Total US non-institutionalized population/new SF sales: 1/1/63 to 12/31/07 ratio: All new SF sales: 1/19 ratio: Ratio of New SF Sales/Civilian Noninstitutional Population Ratio of New SF Sales/Civilian Noninstitutional Population (20-54) New SF sales adjusted for the US population From January 1963 to January 2007, the long-term ratio of new house sales to the total US non-institutionalized population was ; in January 2018 it was a decrease from December (0.0025). The noninstitutionalized population, aged 20 to 54 long-term ratio is ; in January 2018 it was also a decline from December (0.0044). All are non-adjusted data. From a population viewpoint, construction is less than what is necessary for changes in the population (i.e., under-building). Sources: and The Federal Reserve Bank of St. Louis; 3/14/19
61 Railroad Lumber & Wood Shipments vs. U.S. SF House Sales 10,000 LHS: Lumber shipments carloads (weekly average/month) RHS: New SF Sales-in thousands 900 9, , , ,000 5,000 4, , , ,000 0 Data are average weekly originations for each month, are not seasonally adjusted, and do not include intermodal. AAR Lumber & Wood Shipments (U.S. + Canada) New SF Sales Sources: Association of American Railroads (AAR), Rail Time Indicators report 2/7/19; U.S. DOC-Construction; 3/14/19
62 Railroad Lumber & Wood Shipments vs. U.S. SF Housing Sales: 1-year Offset 10,000 LHS: Lumber shipments carloads (weekly average/month) RHS: New SF Sales-in thousands 900 9, , , ,000 5,000 4, , , ,000 0 Data are average weekly originations for each month, are not seasonally adjusted, and do not include intermodal. AAR Lumber & Wood Shipments (U.S. + Canada) New SF Sales (1-yr. offset) In this graph, January 2007 lumber shipments are contrasted with January 2008 SF sales, and continuing through January The purpose is to discover if lumber shipments relate to future single-family sales. Also, it is realized that lumber and wood products are trucked; however, to our knowledge comprehensive trucking data is not available. Sources: Association of American Railroads (AAR), Rail Time Indicators report 2/7/19; U.S. DOC-Construction; 3/14/19
63 Nominal vs. SAAR New SF House Sales 800 LHS: Nominal & Expansion Factors Nominal & SF data, in thousands RHS: New SF SAAR Contrast of January 2018 and January New SF sales (adj) Apparent Expansion Factor New SF sales (non-adj) Nominal and Adjusted New SF Monthly Sales Presented above is nominal (non-adjusted) new SF sales data contrasted against SAAR data. The apparent expansion factor is the ratio of the unadjusted number of houses sold in the US to the seasonally adjusted number of houses sold in the US (i.e., to the sum of the seasonally adjusted values for the four regions). U.S. DOC-Construction Source: 3/14/19
64 New SF House Sales New SF Houses Sold During Period Total Not started Under Construction New SF Houses Sold During Period Completed January 607, , , ,000 December 652, , , , , , , ,000 M/M change -6.9% -26.8% 11.3% 0.9% Y/Y change -4.1% 8.3% -16.2% -0.9% Total percentage 30.1% 32.5% 37.4% In January 2018, a substantial portion of new sales, 30.1% have not been started; an decrease from December. * Not SAAR Source: 3/14/19
65 New SF House Sales 600 Thousands of units; not SAAR New SF Houses Sold During Period Total Not started Under Construction Completed 607, , , , Not started Under Construction Completed Not SAAR Source: 3/14/19
66 Not SAAR New SF House Sales New SF Houses for Sale at the end of the Period Total Not started Under Construction Completed January 336,000 69, ,000 70,000 December 341,000 74, ,000 70, ,000 53, ,000 63,000 M/M change -1.5% -6.8% 0.0% 0.0% Y/Y change 13.9% 30.2% 10.1% 11.1% Total percentage 20.5% 58.6% 20.8% Source: 3/14/19
67 New SF House Sales Thousands of units; not SAAR New SF Houses for Sale at the end of the Period Total Not started Under Construction Completed 336,000 69, ,000 70, Not started Under construction Completed Not SAAR Source: 3/14/19
68 New SF House Sales New SF Houses for Sale at the end of the Period by Region* Total NE MW S W January 336,000 27,000 42, ,000 91,000 December 341,000 28,000 42, ,000 94, ,000 24,000 39, ,000 75,000 M/M change -1.5% -3.6% 0.0% -0.6% -3.2% Y/Y change 14.3% 12.5% 7.7% 12.8% 21.3% * Not SAAR Source: 3/14/19
69 New SF Houses Sale at End of Period by Region Thousands of units; not SAAR For sale at end of period 336,000 Northeast 27, % Midwest 42, % South 176, % West 91, % NE MW S W Source: 3/14/19
70 January 2019 Construction Spending * billion. ** The US DOC does not report improvement spending directly, this is a monthly estimation: ((Total Private Spending (SF spending + MF spending)). All data are SAARs and reported in nominal US$. Total Private Residential* SF MF Improvement** January $511,375 $264,416 $65,651 $181,308 December $512,930 $266,305 $64,773 $181, $541,810 $284,831 $58,190 $198,789 M/M change -0.3% -0.7% 1.4% -0.3% Y/Y change -5.6% -7.2% 12.8% -8.8% Source: 3/13/19
71 Total Construction Spending (nominal): 1993 January 2019 $700,000 $600,000 SAAR; in millions Total Private Nominal Construction Spending: $ bil $500,000 $400,000 $300,000 $200,000 $100,000 $0 Total Residential Spending (nominal) MF Spending (nominal) SF Spending (nominal) Remodeling Spending (nominal) Reported in nominal US$. The US DOC does not report improvement spending directly, this is a monthly estimation for Source: 3/13/19
72 Total Construction Spending (adjusted): * $800,000 SAAR; in millions of US dollars (adj.) $700,000 $600,000 $500,000 $400,000 $300,000 $200,000 $100,000 $0 Total Residential Spending (adj.) SF Spending (adj.) MF Spending (adj.) Remodeling Spending (adj.) Reported in adjusted US$: (adjusted for inflation, BEA Table 1.1.9); *January 2019 reported in nominal US$. Source: 3/13/19
73 percent 67.3 Construction Spending Shares: 1993 to January 2019 SF, MF, & RR: Percent of Total Residential Spending (adj.) SF % MF % RR % Total Residential Spending: 1993 through 2006 SF spending average: 69.2% MF spending average: 7.5 % Residential remodeling (RR) spending average: 23.3 % (SAAR). Note: 1993 to 2017 (adjusted for inflation, BEA Table 1.1.9); Jan-January 2018 reported in nominal US$. Source: and 3/13/19
74 Adjusted Construction Spending: Y/Y Percentage Change, 1993 to January SF Spending-nom.: Y/Y % change MF Spending-nom.: Y/Y % change Remodeling Spending-nom.: Y/Y % change Nominal Residential Construction Spending: Y/Y percentage change, 1993 to January 2019 Presented above is the percentage change of inflation adjusted Y/Y construction spending. Only remodeling expenditures were positive on a percentage basis, year-over-year. January 2019 reported in nominal dollars Source: 3/13/19
75 Adjusted Construction Spending: Y/Y Percentage Change, 2000 to January Total Residential Spending Y/Y % change (adj.) MF Spending Y/Y % change (adj.) SF Spending Y/Y % change (adj.) Remodeling Spending Y/Y % change (adj.) Adjusted dollar values; except January 2019 reported in nominal dollars. Source: and 3/13/19
76 Total Adjusted Construction Spending: Y/Y Percentage Change, 1993 to January Total Residential Spending Y/Y % change (adj.) Inflation Adjusted Residential Construction Spending: MF Spending Y/Y % change (adj.) SF Spending Y/Y % change (adj.) Remodeling Spending Y/Y % change (adj.) Y/Y percentage change, 1993 to January 2019 Remodeling expenditures were positive in January, with Total, SF, and MF all negative. January 2019 reported in nominal dollars. Source: and 3/13/19
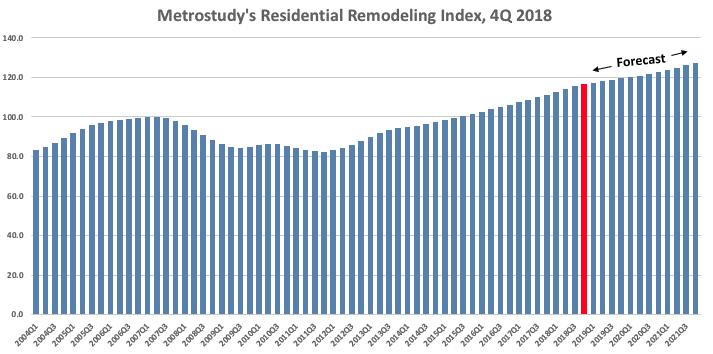
77 Remodeling Remodeling Outlook Remains Positive for 2019, RRI Finds Index posted strong year-to-year increase, however moderate gains are expected over the next 24 months. Big ticket residential remodeling activity nationwide in the fourth quarter of 2018 rose 4.8% from the year-earlier period, Metrostudy announced in their release of the latest Residential Remodeling Index (RRI). The index reached an all-time high of in the quarter, a 0.8% increase from the third quarter of The RRI value means that the economic conditions known to influence remodeling activity are 16.7% better than the old peak in early 2007, just before the Great Recession. The growth of the RRI from the third quarter marks the 27th consecutive quarter of year-overyear growth for the index. The forecast projects continued growth in the RRI over the next several years, but growth in 2019 and 2020 is expected to be at slower rates compared to the past several years of the index. The moderate gains projected will be closely tied to the maturation of the housing cycle, according to Metrostudy. Vincent Salandro, Assistant Editor, Remodeling The remodeling market remains busy as the nation continues to see strong job growth and record levels of home equity, especially in equity rich coastal markets. We expect continued growth for the industry in 2019, with some stabilization, mostly due to the slowing in existing home sales, which will sap some potential. Mark Boud, Chief Economist, Metrostudy Source: 2/19/19
78 Remodeling Remodeling Outlook Remains Positive for 2019, RRI Finds Index posted strong year-to-year increase, however moderate gains are expected over the next 24 months. Boud says the housing cycle is running to the late innings as homeowners begin display responsiveness to higher mortgage rates. Continued rising mortgage rates over the next several years are projected to dampen home sales and persuade homeowners to stay put and renovate in their current homes, Boud said. The RRI is based on a statistical model that takes into account data such as household-level remodeling permits, employment statistics, and a market s economic health. It uses that model to predict the number and dollar volume of home improvement and replacement projects worth at least $1,000. Metrostudy projects the number of remodeling projects worth $1,000 or more will rise to 12.9 million, a 3.1% increase year-over-year. Big-ticket exterior projects and siding projects are projected to have the biggest increases from The inflation-adjusted value of bigticket remodeling projects in 2018 is predicted to increase 4.7% to $203.5 billion. According to Metrostudy, 379 of the 381 metro areas surveyed will see growth in project volume for 2019 and these markets will experience an average growth of 3.0%. Vincent Salandro, Assistant Editor, Remodeling Source: 2/19/19
79 Remodeling Source: 2/19/19
80 Remodeling Source: 2/13/19

81 Remodeling Source: 2/13/19
82 Remodeling Source: 3/15/19
83 Remodeling Source: 3/15/19
84 * All sales data: SAAR Existing House Sales National Association of Realtors January 2019 sales: thousand Existing Sales* Median Price Mean Price Month's Supply January 4,940,000 $247,500 $286, December 5,000,000 $254,700 $293, ,400,000 $240,800 $282, M/M -1.2% -2.8% -2.4% 5.4% Y/Y change -8.5% 2.8% 1.5% 14.7% Source: 2/21/19
85 Existing House Sales 8,000 7,000 6,000 SAAR; in thousands Total Existing Sales 4,940,000 Total NE 700, % Total MW 1,160, % Total S 2,080, % Total W 1,000, % 5,000 4,000 3,000 2,000 1,000 0 U.S. NE MW S W Source: 2/21/19
86 U.S. Housing Prices Source: FHFA U.S. House Prices Rise 1.1 Percent in Fourth Quarter U.S. house prices rose 1.1 percent in the fourth quarter of 2018 according to the Federal Housing Finance Agency (FHFA) House Price Index (HPI). House prices rose 5.7 percent from the fourth quarter of 2017 to the fourth quarter of FHFA s seasonally adjusted monthly index for January was up 0.3 percent from November. Stefanie Johnson and Corinne Russell, FHFA House prices rose throughout 2018 but at a slower rate than in recent years. In the fourth quarter, house price appreciation hit one of the lowest levels in the past four years. Dr. William Doerner, Supervisory Economist, FHFA Source: 2/26/19 Return Return to TOC
87 U.S. Housing Prices The S&P CoreLogic Case-Shiller U.S. National Home Price NSA Index, covering all nine U.S. census divisions, reported a 4.7% annual gain in January, down from 5.1% in the previous month. The 10-City Composite annual increase came in at 3.8%, down from 4.2% in the previous month. The 20-City Composite posted a 4.2% year-over-year gain, down from 4.6% in the previous month. Annual Gains Fall to 4.7% to End 2018 According to S&P CoreLogic Case-Shiller Index The annual rate of price increases continues to fall. Even at the reduced pace of 4.7% per year, home prices continue to outpace wage gains of 3.5% to 4% and inflation of about 2%. A decline in interest rates in the fourth quarter was not enough to offset the impact of rising prices on home sales. The monthly number of existing single family homes sold dropped throughout 2018, reaching an annual rate of 4.45 million in January. The 2018 full year sales pace was 4.74 million. Regional patterns continue to shift. Seattle and Portland, OR experienced the fastest price increases of any city from late 2016 to the spring of 2018; in January, they ranked 11th and 16th. Currently, the cities with the fastest price increases are Las Vegas and Phoenix. These are a reminder of how prices rose and collapsed in the financial crisis 12 years ago. Despite their recent gains, Las Vegas and Phoenix are the furthest below their 2006 peaks of any city followed in the S&P CoreLogic Case-Shiller Indices. David Blitzer, Managing Director and Chairman of the Index Committee, S&P Dow Jones Indices Source: 2/26/19 Return Return to TOC
88 S&P/Case-Shiller Home Price Indices City Composite 10-City Composite U.S. National Home Price Index January 2018 shows that the rate of home price increases across the U.S. has continued to slow Las Vegas, Phoenix and Atlanta reported the highest year-over-year gains among the 20 cities. In January, Las Vegas led the way with an 11.4% year-over-year price increase, followed by Phoenix with an 8.0% increase and Atlanta with a 5.9% increase. Three of the 20 cities reported greater price increases in the year ending January 2018 versus the year ending November Soogyung Jordan, Global Head of Communications, S&P CoreLogic Source: 2/26/19 Return Return to TOC
89 Housing Affordability National Housing Affordability Over Time Urban Institute Home prices remain affordable by historic standards, despite price increases over the last 6.5 years and interest rate increases. As of January 2019, with a 20 percent down payment, the share of median income needed for the monthly mortgage payment stood at 23.1 percent; with 3.5 down, it is 26.6 percent. As of January, the median housing expenses to income ratio was in line with the average. As shown in the bottom picture, mortgage affordability varies widely by MSA. Bing Lai, Research Associate, Housing Finance Policy Center Sources: 2/27/19

90 Housing Affordability Affordability Worsens in a Seller s Market AEI Housing Market Indicators Nominal Price-to-Income Ratio* has retraced 53% of the drop from the 2006 peak to the 2012 trough. Combination of a continued highly accommodative monetary policy and easier lending promotes further capital flows into real estate, increasing the potential for economic damage as highly leveraged lending fuels a cyclically volatile housing sector. Edward Pinto and Tobias Peter, Center on Housing Markets and Finance, AEI * Calculated as median house price divided by median household income. Source: 2/25/19
91 Mortgage Credit Availability Mortgage Credit Availability Increased in February Mortgage credit availability increased in January according to the Mortgage Credit Availability Index (MCAI), a report from the Mortgage Bankers Association (MBA) which analyzes data from Ellie Mae's AllRegs Market Clarity business information tool. The MCAI rose 0.6 percent to in February. A decline in the MCAI indicates that lending standards are tightening, while increases in the index are indicative of loosening credit. The index was benchmarked to 100 in March The Conventional MCAI increased (1.1 percent), while the Government MCAI increased slightly (0.1 percent). Of the component indices of the Conventional MCAI, the Jumbo MCAI increased by 2.2 percent while the Conforming MCAI decreased by 0.2 percent. Credit availability increased in February as a result of new jumbo offerings brought to the market, both for agency jumbo and non-agency jumbo programs. We also saw some expansion in credit for borrowers with lower credit scores and higher LTVs, although credit availability for government programs remains tighter following the scaling back of VA refinance programs. Mike Fratantoni, Senior and Chief Economist, MBA Source: 3/7/19
92 First-Time Purchasers Urban Institute First-Time Homebuyer Share In November 2018, the first time homebuyer (FTHB) share of purchase loans increased very slightly for FHA and conventional mortgages. The FTHB share for FHA, which has always been more focused on first time homebuyers, stood at 82.5 percent in November The GSE FTHB share in November 2018 was 47.9 percent. The bottom table shows that based on mortgages originated in November 2018, the average FTHB was more likely than an average repeat buyer to take out a smaller loan, have a lower credit score, and higher LTV and higher DTI, thus paying a higher interest rate. Laurie Goodman, et al., Codirector, Housing Finance Policy Center Sources: 2/27/19
93 First-Time Purchasers Purchase Loan NMRI: Credit Easing Continues AEI Housing Market Indicators The composite NMRI for purchase loans jumped 0.5 ppt from elevated levels a year ago. The first-time buyer index jumped 0.6 ppt, primarily due to FHA being up 1.7 ppts. The repeat buyer index was up 0.3 ppt. Rising prices are having a disparate impact on buyers, benefiting repeat buyers through as set appreciation, and hurting FTBs who have to take on more leverage. Edward Pinto and Tobias Peter, Center on Housing Markets and Finance, AEI Source: 2/25/19
94 First-Time Purchasers Leverage Fueled Housing Demand Pauses Due to Higher Rates AEI Housing Market Indicators While still being up 25 percent from 5 years ago, purchase volume in November 2018 declined 5.1 percent from a year earlier. First-time buyer volume was down 3.6 percent, while repeat buyer volume was down 7.0%. Greater access to credit is allowing first-time buyers to offset higher mortgage rates and higher house prices, while repeat buyers, with less access to credit, are electing to drop out of the market in larger numbers. Edward Pinto and Tobias Peter, Center on Housing Markets and Finance, AEI Source: 2/25/19
 inventory in January, which is traditionally the month with the greatest inventory and lowest sales, stood at 5.6 mo., up 0.7 mo. from a year ago.")
95 Housing Market Supply-Demand Imbalance in the Market Is Driving Prices Up AEI Housing Market Indicators The supply-demand imbalance persists. The NAR s not-seasonally adjusted months (mo.) inventory in January, which is traditionally the month with the greatest inventory and lowest sales, stood at 5.6 mo., up 0.7 mo. from a year ago. While this metric has started to increase over the past 5 mo., it is still averaging below 6 mo., the demarcation between a buyer s and seller s market, and it will fall back with the beginning of the spring buying season. Thus, it is too soon to project a return of a buyer s market. Instead, we expect the seller s market to modestly strengthen. This means further credit easing will continue to be capitalized into higher home prices. According to the FHFA, not-seasonally adjusted home prices rose 5.8% in November year-over-year, down from 6.8% a year ago. The chart above shows the strong inverse relationship between supply and prices. Edward Pinto and Tobias Peter, Center on Housing Markets and Finance, AEI Source: 2/25/19
The Virginia Tech U.S. Forest Service November 2018 Housing Commentary: Section I
 The Virginia Tech U.S. Forest Service November 2018 Housing Commentary: Section I Urs Buehlmann Department of Sustainable Biomaterials College of Natural Resources & Environment Virginia Tech Blacksburg,
The Virginia Tech U.S. Forest Service April 2018 Housing Commentary: Section I
 The Virginia Tech U.S. Forest Service April Housing Commentary: Section I Urs Buehlmann Department of Sustainable Biomaterials College of Natural Resources & Environment Virginia Tech Blacksburg, VA 540.231.9759
The Virginia Tech U.S. Forest Service June 2018 Housing Commentary: Section I
 The Virginia Tech U.S. Forest Service June Housing Commentary: Section I Urs Buehlmann Department of Sustainable Biomaterials College of Natural Resources & Environment Virginia Tech Blacksburg, VA 540.231.9759
The Virginia Tech U.S. Forest Service July 2018 Housing Commentary: Section I
 The Virginia Tech U.S. Forest Service July 218 Housing Commentary: Section I Urs Buehlmann Department of Sustainable Biomaterials College of Natural Resources & Environment Virginia Tech Blacksburg, VA
The Virginia Tech U.S. Forest Service November 2017 Housing Commentary: Section I
 The Virginia Tech U.S. Forest Service November 2017 Housing Commentary: Section I Urs Buehlmann Department of Sustainable Biomaterials College of Natural Resources & Environment Virginia Tech Blacksburg,
The Virginia Tech U.S. Forest Service October 2018 Housing Commentary: Section I
 The Virginia Tech U.S. Forest Service October 218 Housing Commentary: Section I Urs Buehlmann Department of Sustainable Biomaterials College of Natural Resources & Environment Virginia Tech Blacksburg,
The Virginia Tech U.S. Forest Service September 2017 Housing Commentary: Section I
 The Virginia Tech U.S. Forest Service September 2017 Housing Commentary: Section I Urs Buehlmann Department of Sustainable Biomaterials College of Natural Resources & Environment Virginia Tech Blacksburg,
The Virginia Tech U.S. Forest Service December 2016 Housing Commentary: Section I
 The Virginia Tech U.S. Forest Service December 2016 Housing Commentary: Section I Urs Buehlmann Department of Sustainable Biomaterials College of Natural Resources & Environment Virginia Tech Blacksburg,
The Virginia Tech U.S. Forest Service November 2015 Housing Commentary: Part A
 The Virginia Tech U.S. Forest Service November Housing Commentary: Part A Urs Buehlmann Department of Sustainable Biomaterials College of Natural Resources & Environment Virginia Tech Blacksburg, VA 54.231.9759
The Virginia Tech U.S. Forest Service September 2016 Housing Commentary: Section I
 The Virginia Tech U.S. Forest Service September Housing Commentary: Section I Urs Buehlmann Department of Sustainable Biomaterials College of Natural Resources & Environment Virginia Tech Blacksburg, VA
The Virginia Tech U.S. Forest Service March 2017 Housing Commentary: Section I
 The Virginia Tech U.S. Forest Service March 217 Housing Commentary: Section I Urs Buehlmann Department of Sustainable Biomaterials College of Natural Resources & Environment Virginia Tech Blacksburg, VA
Real Estate Trends and Outlook
 Real Estate Trends and Outlook Lawrence Yun, Ph.D. Chief Economist NATIONAL ASSOCIATION OF REALTORS Presentation at NAR Region XII Conference Coeur d Alene, ID March 5, 2015 GDP Burst in 2014 Q2, Q3, Q4
Welcome to the 10 th Annual Real Estate Symposium for The Lake of the Ozarks. October 5th, 2017 Osage National Golf Resort
 Welcome to the 10 th Annual Real Estate Symposium for The Lake of the Ozarks October 5th, 2017 Osage National Golf Resort Economic and Real Estate Market Outlook October, 2017 Steve Snook, Senior Business
THE ECONOMIC OUTLOOK FOR THE U.S. AND THE CONSTRUCTION INDUSTRY
 THE ECONOMIC OUTLOOK FOR THE U.S. AND THE CONSTRUCTION INDUSTRY by William F. Ford, Ph.D. Weatherford Chair of Finance Middle Tennessee State University presented to The Roofing Industry Alliance for Progress
Economic and Housing Market Outlook
 Economic and Housing Market Outlook By Lawrence Yun, Ph.D. Chief Economist, National Association of REALTORS Presentations At Raleigh Regional Association of REALTORS At Orange-Chatham Association of REALTORS
Economic & Housing Market Outlook
 Economic & Housing Market Outlook By Lawrence Yun, Ph.D. Chief Economist, National Association of REALTORS Presentations to NAR Annual Conference Boston, MA November 2, 2018 Existing Home Sales Since
ECONOMIC SNAPSHOT. A Summary of the San Diego Regional Economy UNEMPLOYMENT
 A Summary of the San Diego Regional Economy UNEMPLOYMENT San Diego Regional EDC analyzes key economic metrics that are important to understanding the regional economy and San Diego's standing relative
The 2013 Hilliard Lyons INVESTKentucky Equity Conference
 The 2013 Hilliard Lyons INVESTKentucky Equity Conference Keynote Address William Ford Ph.D. Weatherford Chair of Finance Middle Tennessee State University THE ECONOMIC OUTLOOK FOR THE U.S. & KENTUCKY ECONOMY
USG CORPORATION + U.S. CHAMBER OF COMMERCE. Q4 Commercial. Construction Index. powered by
 D Q4 Commercial USG CORPORATION + U.S. CHAMBER OF COMMERCE 2018 Construction Index powered by THE USG CORPORATION + U.S. CHAMBER OF COMMERCE COMMERCIAL CONSTRUCTION INDEX Throughout 2018, USG Corporation
economy City of Rohnert Park : Local Economic Report EDB Sonoma County
 EDB Sonoma County Economic Development Board economy 2010-11 City of Rohnert Park : Local Economic Report E c o n o m i c D e v e l o p m e n t B o a r d 4 0 1 C o l l e g e Av e n u e S u i t e D S a
GEORGE RATIU Director, Quantitative & Commercial Research National Association of REALTORS
 GEORGE RATIU Director, Quantitative & Commercial Research National Association of REALTORS 2015 CCIM Commercial Real Estate Outlook Conference Wednesday, January 21, 2015 Coral Gables, FL Where Are We
SAN DIEGO S QUARTERLY ECONOMIC SNAPSHOT
 SAN DIEGO S QUARTERLY ECONOMIC SNAPSHOT November 2017 SAN DIEGO HIGHLIGHTS IN THIS ISSUE Every quarter San Diego Regional EDC analyzes key economic indicators that are important to understanding the regional
SAN DIEGO S QUARTERLY ECONOMIC SNAPSHOT
 SAN DIEGO S QUARTERLY ECONOMIC SNAPSHOT August 2017 highlights in THIS ISSUE Every quarter Regional EDC analyzes key economic indicators that are important to understanding the regional economy and the
SAN DIEGO S QUARTERLY ECONOMIC SNAPSHOT
 SAN DIEGO S QUARTERLY ECONOMIC SNAPSHOT December 2018 SAN DIEGO HIGHLIGHTS IN THIS ISSUE Every quarter San Diego Regional EDC analyzes key economic indicators that are important to understanding the regional
Economic and Real Estate Market Outlook
 Economic and Real Estate Market Outlook By Lawrence Yun, Ph.D. Chief Economist, National Association of REALTORS Presentation at Miami International Congress Miami, FL November 1, 2016 Lifetime Wealth
Housing Market Outlook
 Housing Market Outlook By Lawrence Yun, Ph.D. Chief Economist, National Association of REALTORS Presentation at National Conference of State Legislatures Washington, DC December 7, 2018 Very Long Economic
NEWS RELEASE FOR WIRE TRANSMISSION: 8:30 A.M. EDT, FRIDAY, APRIL 17, William Zeile: (202) BEA 09-14
 BEA 09-14") NEWS RELEASE FOR WIRE TRANSMISSION: 8:30 A.M. EDT, FRIDAY, APRIL 17, 2009 William Zeile: (202) 606-9893 BEA 09-14 Summary Estimates for Multinational Companies: Employment, Sales, and Capital Expenditures
NEWS RELEASE FOR WIRE TRANSMISSION: 8:30 A.M. EDT, FRIDAY, APRIL 17, 2009 William Zeile: (202) 606-9893 BEA 09-14 Summary Estimates for Multinational Companies: Employment, Sales, and Capital Expenditures
1Q04 Update: Silicon Demand Will Move to a Full Recovery
 Gartner Dataquest Alert 1Q04 Update: Silicon Demand Will Move to a Full Recovery Our latest silicon demand forecast indicates that wafer demand in 2003 will increase 9 percent over 2002. While the forecast
Dr. Jeffrey Michael. Executive Director, Center for Business and Policy Research University of the Pacific
 2019 San Joaquin County Economic Outlook Dr. Jeffrey Michael Executive Director, Center for Business and Policy Research University of the Pacific Outline Population Growth and Migration California and
Silicon Wafer Demand Forecast Update, 4Q03
 Forecast Analysis Silicon Wafer Demand Forecast Update, 4Q03 Abstract: Silicon wafer demand in 2003 will register an 8 percent increase over 2002. Demand will enter an expansion phase in the second quarter
ECONOMIC SNAPSHOT. A Summary of the San Diego Regional Economy UNEMPLOYMENT
 A Summary of the San Diego Regional Economy Brought to you by San Diego Regional EDC analyzes key economic metrics that are important to understanding the regional economy and San Diego s standing relative
3Q03 Silicon Wafer Update: Demand Continues Recovery
 Gartner Dataquest Alert 3Q03 Silicon Wafer Update: Demand Continues Recovery The latest silicon forecast indicates that silicon wafer demand will grow 10 percent in 2003 over the previous year. This is
XT: Explore Technology LAUNCHING STUDENTS INTO TECHNOLOGY-BASED MAJORS AT VIRGINIA TECH
 XT: Explore Technology LAUNCHING STUDENTS INTO TECHNOLOGY-BASED MAJORS AT VIRGINIA TECH The XT factor: what drives you? THIS MAY NOT BE THE EASIEST QUESTION TO ANSWER. THERE CAN BE SEVERAL THINGS THAT
Economic & Real Estate Outlook. Tax Reform. Michigan 4/26/18
 Economic & Real Estate Outlook By Lawrence Yun, Ph.D. Chief Economist, National Association of REALTORS Presentations at Michigan REALTORS Broker Summit Plymouth, MI April 25, 2018 Tax Reform Mortgage
SAN DIEGO S QUARTERLY ECONOMIC SNAPSHOT
 SAN DIEGO S QUARTERLY ECONOMIC SNAPSHOT February 2018 SAN DIEGO HIGHLIGHTS IN THIS ISSUE Every quarter San Diego Regional EDC analyzes key economic indicators that are important to understanding the regional
Economic & Housing Outlook
 Economic & Housing Outlook By Lawrence Yun, Ph.D. Chief Economist, National Association of REALTORS Presentation at Northern Arizona Association of REALTORS November 30, 2017 Tax Reform Mortgage interest
Real Estate Markets in a Tentative Economic Landscape
 Real Estate Markets in a Tentative Economic Landscape GEORGE RATIU Director, Quantitative & Commercial Research National Association of REALTORS Bay Area Real Estate Council Annual Economic Outlook Tampa,
2012 ACCE Industry Advisory Board Best Practices Positioning Your Firm After the Great Recession
 2012 ACCE Industry Advisory Board Best Practices Positioning Your Firm After the Great Recession 2012 FMI Corporation 0 The Great Recession 2012 FMI Corporation 1 FMI Corporation 2010 1 Market Truths You
The State of the Erie Economy
 The State of the Erie Economy Presentation to Presque Isle CPCU Society Chapter September 14, 2017 Kenneth Louie The Economic Research Institute of Erie Sam and Irene Black School of Business Penn State
Taking the Measure of St. Louis
 Taking the Measure of St. Louis The views expressed here are those of the speakers and do not necessarily represent the views of the Federal Reserve Bank of St. Louis or of the Federal Reserve System.
2018 U.S. Ceramic Tile Market Update
 FOR IMMEDIATE RELEASE: Contact: Andrew Whitmire April 8, 2019 T: 864-646-8453 ext. 102 2018 U.S. Ceramic Tile Market Update U.S. Tile Consumption Overview: Total U.S. ceramic tile consumption for 2018
How U.S. Employment Is Changing
 December 1, 211 How U.S. Employment Is Changing Stephen P. A. Brown and Hui Liu During the most recent recession, U.S. employment fell by 7,49 million jobs (5.4 percent). During the first 8 months of the
U.S. Economic, Office and Industrial Market Overview and Outlook. July 16, 2014
 2014 U.S. Economic, Office and Industrial Market Overview and Outlook July 16, 2014 U.S. Economic Overview U.S. GDP Growth Persistent Despite 1Q Polar Vortex Annualized Quarterly Percent Change 10% 5%
National Population Estimates: March 2009 quarter
 Image description. Hot Off The Press. End of image description. Embargoed until 10:45am 15 May 2009 National Population Estimates: March 2009 quarter Highlights The estimated resident population of New
Dollar Tree for Sale N. Monroe St. Tallahassee, FL
 Dollar Tree for Sale 3706 N. Monroe St. Tallahassee, FL Table of Contents FOR FURTHER INFORMATION Joe Boyd office 843.973.8283 mobile 843.906.7751 email joe@twinriverscap.com 3706 N. Monroe St. Tallahassee,
Dollar Tree for Sale N. Monroe St. Tallahassee, FL
 Dollar Tree for Sale 3706 N. Monroe St. Tallahassee, FL Table of Contents FOR FURTHER INFORMATION Joe Boyd office 843.973.8283 mobile 843.906.7751 email joe@twinriverscap.com 3706 N. Monroe St. Tallahassee,
Click to edit Master title style The State of the Venture Capital Industry Click to edit Master text styles
 The State of the Venture Capital Industry Bobby Franklin President Third & level CEO of NVCA Southeast Venture Conference March 16 Overview Click Venture to edit capital Master stats text at-a-glance styles
ECONOMIC SNAPSHOT. A Summary of the San Diego Regional Economy UNEMPLOYMENT
 A Summary of the San Diego Regional Economy Brought to you by San Diego Regional EDC analyzes key economic metrics that are important to understanding the regional economy and San Diego s standing relative
Charles S. Gascon Regional Economist, Senior Coordinator
 Generated: July 2018 Charles S. Gascon Regional Economist, Senior Coordinator Education MBA, Washington University, 2012 M.A. Economics, State University of New York at Albany, 2006 B.S. Managerial Economics,
ECONOMIC SNAPSHOT. A Summary of the San Diego Regional Economy UNEMPLOYMENT
 A Summary of the San Diego Regional Economy Brought to you by analyzes key economic metrics that are important to understanding the regional economy and San Diego s standing relative to other major metropolitan
Washington, D.C. Metro Area November 2018 Housing Market Update
 Washington, D.C. Metro Area November 2018 Housing Market Update Washington D.C. Metro prices of $449,900 at record November level; sales continue to cool; for the first time since early 2016, inventories
MMBA SECONDARY MARKET AND LOAN SERVICING CONFERENCE
 MMBA SECONDARY MARKET AND LOAN SERVICING CONFERENCE May 13, 2013 Presented by Timothy M. Warren Jr. Chief Executive Officer The Warren Group Agenda Brief Overview of The Warren Group Market Conditions
ECONOMIC SNAPSHOT. A Summary of the San Diego Regional Economy UNEMPLOYMENT
 A Summary of the San Diego Regional Economy Brought to you by San Diego Regional EDC analyzes key economic metrics that are important to understanding the regional economy and San Diego s standing relative
Dollar Tree for Sale N. Monroe St. Tallahassee, FL. Representative Photo
 Dollar Tree for Sale 3706 N. Monroe St. Tallahassee, FL Representative Photo Table of Contents FOR FURTHER INFORMATION Joe Boyd office 843.973.8283 mobile 843.906.7751 email joe@twinriverscap.com 3706
Family Dollar. 823 E. Washington St. Suffolk, VA
 Family Dollar 823 E. Washington St. Suffolk, VA Table of Contents FOR FURTHER INFORMATION Joe Boyd office 843.722.9925 x 21 mobile 843.906.7751 web joe@twinriverscap.com 823 E. Washington St. Suffolk,
Freight: A View From the Street
 Equity Research September 2017 Freight: A View From the Street NEARS Conference, Pittsburgh, PA September 26-28, 2017 Jason H. Seidl, Managing Director 646.562.1404 jason.seidl@cowen.com Matt Elkott, Vice
2007 Major Business Expansion Activity in Southern California
 2007 Major Business Expansion Activity in Los Angeles Economic Development Corporation The Kyser Center for Economic Research Written by Candice Flor Hynek Jack Kyser Nancy D. Sidhu, Ph.D. March 2008 444
Technology and Industry Outlook Country Studies and Outlook Division (DSTI/CSO)
") OECD Science, Technology and Industry Outlook 2012 Directorate for Science Technology and Industry Directorate for Science, Technology and Industry Country Studies and Outlook Division (DSTI/CSO) What
OECD Science, Technology and Industry Outlook 2012 Directorate for Science Technology and Industry Directorate for Science, Technology and Industry Country Studies and Outlook Division (DSTI/CSO) What
ECONOMIC ELEMENT. of the PINELLAS COUNTY COMPREHENSIVE PLAN. Prepared By: The Pinellas County Planning Department. as staff to the
 ECONOMIC ELEMENT of the PINELLAS COUNTY COMPREHENSIVE PLAN Prepared By: The Pinellas County Planning Department as staff to the LOCAL PLANNING AGENCY for THE BOARD OF COUNTY COMMISSIONERS OF PINELLAS COUNTY,
Silicon Wafer Demand Outlook: Forecast Update, 2Q03
 Research Brief Silicon Wafer Demand Outlook: Forecast Update, 2Q03 Abstract: The latest silicon wafer demand outlook predicts about 6 percent growth in 2003, nearly the same as the previous forecast. However,
The Construction Market in Europe: A Supplier s Point of View
 The Construction Market in Europe: A Supplier s Point of View Dr. Walter Nussbaumer Abstract After the 2009 recession and the 2010 stagnation, recovery took place in 2011 when the World Construction Industry
Capital Planning Retreat Economic Outlook Alan E. Maguire
 Capital Planning Retreat Economic Outlook Alan E. Maguire Chandler-Gilbert Estrella Mountain GateWay Glendale Mesa Paradise Valley Phoenix Rio Salado Scottsdale South Mountain Economic Outlook Where are
2017 R&D Trends Forecast Results from the Industrial Research Institute s Annual Survey
 FEATURE ARTICLE 2017 R&D Trends Forecast Results from the Industrial Research Institute s Annual Survey Slowing economies slow R&D investments and mute optimism. The Industrial Research Institute The Industrial
Fall State of the Industry Report UF SID MARTIN FLORIDA BIODATABASE
 Fall 2015 State of the Industry Report UF SID MARTIN FLORIDA BIODATABASE Industry Overview The expansion of Florida s biotech industry remains resilient with an overall growth rate of 92% in the number
THE U.S. SEMICONDUCTOR INDUSTRY:
 THE U.S. SEMICONDUCTOR INDUSTRY: KEY CONTRIBUTOR TO U.S. ECONOMIC GROWTH Matti Parpala 1 August 2014 The U.S. Semiconductor Industry: Key Contributor To U.S. Economic Growth August 2014 1 INTRO The U.S.
Adopted March 17, 2009 (Ordinance 09-15)
") ECONOMIC ELEMENT of the PINELLAS COUNTY COMPREHENSIVE PLAN Prepared By: The Pinellas County Planning Department as staff to the LOCAL PLANNING AGENCY for THE BOARD OF COUNTY COMMISSIONERS OF PINELLAS COUNTY,
ECONOMIC ELEMENT of the PINELLAS COUNTY COMPREHENSIVE PLAN Prepared By: The Pinellas County Planning Department as staff to the LOCAL PLANNING AGENCY for THE BOARD OF COUNTY COMMISSIONERS OF PINELLAS COUNTY,
Colliers International Real Estate Trends2018
 Colliers International Real Estate Trends2018 Colliers International Silicon Valley Market Recap San Jose, California - February 13, 2018 - In its 19th consecutive year, last week Colliers International
Italian Americans by the Numbers: Definitions, Methods & Raw Data
 Tom Verso (January 07, 2010) The US Census Bureau collects scientific survey data on Italian Americans and other ethnic groups. This article is the eighth in the i-italy series Italian Americans by the
Industries, United States Agriculture. Forest Products. Laboratory 1. Resource Bulletin FPL-12 December 1983
 United States Department of Wood Used In U.S. Agriculture Forest Service Manufacturing Forest Products Industries, 1977 Laboratory 1 Resource Bulletin FPL-12 December 1983 By DAVID B. McKEEVER, Research
BOSTON OFFICE MARKET. Inside... FIRST QUARTER 2017 OFFICESTATUS FINANCIAL DISTRICT BOSTON
 BOSTON OFFICE MARKET FIRST QUARTER 2017 OFFICESTATUS FINANCIAL DISTRICT BOSTON Inside...»»Tenants absorb 224,000 square feet during the first quarter of 2017.»»Class A product in Boston CBD contributed
2013 venture capital trends summary
 213 venture capital trends summary Prepared by: Hitesh Kothari, Director, McGladrey LLP hitesh.kothari@mcgladrey.com August 213 Fundraising by venture capital funds In the first half of 213, 88 venture
Silicon Valley Venture Capital Survey Second Quarter 2018
 fenwick & west Silicon Valley Venture Capital Survey Second Quarter 2018 Full Analysis Silicon Valley Venture Capital Survey Second Quarter 2018 fenwick & west Full Analysis Cynthia Clarfield Hess, Mark
Energy MLP Strategy. PORTFOLIO MANAGER COMMENTARY Fourth Quarter Key Takeaways
 Fourth Quarter 2017 Energy MLP Strategy Key Takeaways Michael Clarfeld, CFA Managing Director, Portfolio Manager Global crude oil demand growth is outstripping global supply growth driving inventory reductions
Life Sciences Outlook. Westchester County 2016
 Life Sciences Outlook Westchester County 2016 Westchester County Just a short distance from Manhattan, Westchester County is an ideal location to many firms looking to attract and retain talent. The access
Life Sciences Outlook
 Life Sciences Outlook Raleigh- 2013-2014 Mid-tier biotech and specialty pharmaceuticals drive demand Across North America, activity and demand within the life sciences industry seems to have shifted from
COLUMBUS 2020 A REGIONAL GROWTH STRATEGY FOR CENTRAL OHIO
 COLUMBUS 2020 A REGIONAL GROWTH STRATEGY FOR CENTRAL OHIO Vision To achieve the strongest decade of growth in the Columbus Region s history Mission To strengthen the economic base of the 11-county Columbus
SFSA CASTEEL REPORTER a monthly publication Steel Founders' Society of America
 SFSA CASTEEL REPORTER a monthly publication Steel Founders' Society of America serving SFSA steel casting industry Members 780 McArdle Drive Unit G, Crystal Lake IL 60014 815-455-8240 Fax: 815-455-8241
THE PORT OF VIRGINIA:
 THE PORT OF VIRGINIA: A CATALYST FOR COMMERCE JOHN F. REINHART CEO AND EXECUTIVE DIRECTOR August 23, 2016 Stewards of Tomorrow 1 OUR TERMINALS VIRGINIA INLAND PORT RICHMOND MARINE TERMINAL NEWPORT NEWS
Dr. Greg Hallman Director, Real Estate Finance and Investment Center (REFIC) McCombs School of Business University of Texas at Austin
 McCombs School of Business University of Texas at Austin") Dr. Greg Hallman Director, Real Estate Finance and Investment Center (REFIC) McCombs School of Business University of Texas at Austin POWERPOINT PARTNER } The US Economy today, with a close look at jobs
Dr. Greg Hallman Director, Real Estate Finance and Investment Center (REFIC) McCombs School of Business University of Texas at Austin POWERPOINT PARTNER } The US Economy today, with a close look at jobs
AT&T Strip Center for Sale Value-Add Opportunity Whiskey Rd. Aiken, SC
 AT&T Strip Center for Sale Value-Add Opportunity 2141 Whiskey Rd. Aiken, SC Table of Contents FOR FURTHER INFORMATION Joe Boyd office 843.973.8283 mobile 843.906.7751 web joe@twinriverscap.com AT&T Center
Barrick Gold versus Newmont: Comparing Miners in 2018 and
 Barrick Gold versus Newmont: Comparing Miners in 2018 and Beyond By Annie Gilroy Apr 05, 2018. 09:15 PM Barrick Gold versus Newmont: Comparing Miners in 2018 and Beyond Newmont Mining overtakes Barrick
Moving Ahead. Third-quarter Technology venture capital investment increased 33 percent yearover-year. percent quarter-over-quarter.
 Moving Ahead Third-quarter Technology venture capital investment increased 33 percent yearover-year but decreased 6 percent quarter-over-quarter October 2 PwC US venture capital funding for the Technology
1. Job offers to BA recipients Job offers for BA recipients on graduation: percent with at least one job Percent 100
 1. Job offers to BA recipients Job offers for BA recipients on graduation: percent with at least one job 1 8 6 4 2 1988 1989 199 1991 1992 1993 1994 1995 1996 1998 1999 2 21 at least one job 56 67.3 68.1
Life Sciences Outlook. New York City 2016
 Life Sciences Outlook City 2016 City is emerging as a leading destination for biotech startups and the larger life sciences industry. Investors have committed millions of dollars throughout the city and
Unit 1: The Economic Fundamentals Weeks How does scarcity impact the decisions individuals and societies must make?
 Economics Teacher: Vida Unit 1: The Economic Fundamentals Weeks 1-4 Essential Questions 1. How does scarcity impact the decisions individuals and societies must make? 2. What roles do individuals and businesses
America s Cooperative Electric Utilities The Nation s Consumer Owned Electric Utility Network
 America s Cooperative Electric Utilities The Nation s Consumer Owned Electric Utility Network Electric cooperatives are an integral part of the $391 billion U.S. electric utility industry. They play a
New Family Dollar NN Investment Property for Sale Rare 10+ Year Lease N. Hill St. Griffin (Atlanta MSA), GA
, GA") New Family Dollar NN Investment Property for Sale Rare 10+ Year Lease 1642 N. Hill St. Griffin (Atlanta MSA), GA Table of Contents FOR FURTHER INFORMATION Joe Boyd office 843.973.8283 mobile 843.906.7751
New Family Dollar NN Investment Property for Sale Rare 10+ Year Lease 1642 N. Hill St. Griffin (Atlanta MSA), GA Table of Contents FOR FURTHER INFORMATION Joe Boyd office 843.973.8283 mobile 843.906.7751
AT&T Strip Center for Sale 100% Leased Whiskey Rd. Aiken, SC
 AT&T Strip Center for Sale 100% Leased 2141 Whiskey Rd. Aiken, SC Table of Contents FOR FURTHER INFORMATION Joe Boyd office 843.973.8283 mobile 843.906.7751 web joe@twinriverscap.com AT&T Center 2141 Whiskey
BUSINESS EMPLOYMENT DYNAMICS
 BUSINESS EMPLOYMENT DYNAMICS First Quarter 2018 Office of Research Kurt Westby, Commissioner Andrew Condon, Director of Research WETHERSFIELD, November 7th, 2018 - (BED) data published quarterly by the
State of Venture Capital in the Southeast Q Executive Summary Pacing vs. 2016*
 Executive Summary Venture capital in the U.S. continues to flow at historically high levels, largely driven by later stage deals, with total invested capital on pace through August for an all-time record
Recapping NAI Global Annual Leadership Summit and Global Market Outlook Philadelphia, PA (March 26-28, 2018) Words and Photos by Gary Marsh
 Words and Photos by Gary Marsh") Recapping NAI Global Annual Leadership Summit and Global Market Outlook Philadelphia, PA (March 26-28, 2018) Words and Photos by Gary Marsh Approximately 175 Principals, Directors and Managers from over
Recapping NAI Global Annual Leadership Summit and Global Market Outlook Philadelphia, PA (March 26-28, 2018) Words and Photos by Gary Marsh Approximately 175 Principals, Directors and Managers from over
Memo to the Planning Commission HEARING DATE: APRIL 28, 2016
 Memo to the Planning Commission HEARING DATE: APRIL 28, 2016 Date: April 20, 2016 Hearing Title: Informational Overview of San Francisco Job and Office Trends 1985-2015 and Update on Office Development
The Surprising Design Of Market Economies (Constructs) By Alex Marshall
 By Alex Marshall") The Surprising Design Of Market Economies (Constructs) By Alex Marshall Jun 13, 2013 In The Surprising Design of Market Economies, urban journalist Alex Marshall shows how in fact it always takes government
The Surprising Design Of Market Economies (Constructs) By Alex Marshall Jun 13, 2013 In The Surprising Design of Market Economies, urban journalist Alex Marshall shows how in fact it always takes government
PROSPECTS FOR GROWTH IN THE SECOND MACHINE AGE. Erik Brynjolfsson DECEMBER 4, MIT Initiative on the Digital Economy
 PROSPECTS FOR GROWTH IN THE SECOND MACHINE AGE Erik Brynjolfsson MIT Initiative on the Digital Economy http://digital.mit.edu/erik DECEMBER 4, 25 Copyright Erik Brynjolfsson. Agenda GDP, Profits, Investment.
The CTA Consumer Sentiment Indexes
 The CTA Consumer Sentiment Indexes The CTA Consumer Sentiment Indexes represent more than ten years of research into cutting-edge methods for measuring consumer expectations about the future. The indexes
January 2018 Industrial Production
 Japan's Economy 28 February 2018 (No. of pages: 6) Japanese report: 28 Feb 2018 January 2018 Industrial Production Jan-Mar period expected to see lull in production growth trend Economic Research Dept.
Commercial Investment Portfolio Sale
 Commercial Investment Portfolio Sale Key Highlights >> Three-property portfolio sale in Downtown Columbia, South Carolina >> Four buildings totaling ±37,200 SF >> Family leased & managed for 50+ years
Economic Trends Affecting Hospitality Sellers in Today s Turbulent Marketplace
 Economic Trends Affecting Hospitality Sellers in Today s Turbulent Marketplace webinar will be begin shortly. If you need technical assistance with the webcast, contact us at hsmai@commpartners.com and
Florida Venture Factbook
 S E AT T L E SAN FRANCISCO NEW YORK LONDON Florida Venture Factbook 2019 pitchbook.com US + 1 206.623.1986 UK + 44 (0)207.190.9809 demo@pitchbook.com PG 1 Dear Attendee, On behalf of the Florida Venture
Executive Summary. Introduction:
 Recommendations for British Columbia s 2013 Budget AME BC s Pre-Budget Submission to the Select Standing Committee on Finance and Government Services - October 18, 2012 Introduction: Executive Summary