The Virginia Tech U.S. Forest Service April 2018 Housing Commentary: Section I
|
|
|
- Georgiana Cooper
- 5 years ago
- Views:
Transcription


1 The Virginia Tech U.S. Forest Service April Housing Commentary: Section I Urs Buehlmann Department of Sustainable Biomaterials College of Natural Resources & Environment Virginia Tech Blacksburg, VA buehlmann@gmail.com Delton Alderman Forest Products Marketing Unit Forest Products Laboratory U.S. Forest Service Madison, WI dalderman@fs.fed.us Virginia Polytechnic Institute and State University VCE-CNRE 19NP Virginia Cooperative Extension programs and employment are open to all, regardless of age, color, disability, gender, gender identity, gender expression, national origin, political affiliation, race, religion, sexual orientation, genetic information, veteran status, or any other basis protected by law. An equal opportunity/affirmative action employer. Issued in furtherance of Cooperative Extension work, Virginia Polytechnic Institute and State University, Virginia State University, and the U.S. Department of Agriculture cooperating. Edwin J. Jones, Director, Virginia Cooperative Extension, Virginia Tech, Blacksburg; M. Ray McKinnie, Administrator, 1890 Extension Program, Virginia State University, Petersburg.
2 Table of Contents Slide 3: Opening Remarks Slide 4: Housing Scorecard Slide 5: Wood Use in Construction Slide 8: New Housing Starts Slide 13: Regional Housing Starts Slide 22: New Housing Permits Slide 25: Regional New Housing Permits Slide 32: Housing Under Construction Slide 34: Regional Under Construction Slide 39: Housing Completions Slide 44: Regional Housing Completions Slide 46: New Single-Family House Sales Slide 49: Regional SF House Sales & Price Slide 56: New SF Sales-Population Ratio Slide 66: Construction Spending Slide 69: Construction Spending Shares Slide 75: Existing House Sales Slide 86: First-Time Purchasers Slide 87: Affordability Slide 97: Summary Slide 98: Virginia Tech Disclaimer Slide 99: USDA Disclaimer This report is a free monthly service of Virginia Tech. Past issues are available at: To request the commentary, please buehlmann@gmail.com or dalderman@fs.fed.us
3 Opening Remarks April s aggregate housing data was tepid on a monthly basis; yet, on yearly comparison all data are strong to robust with the exception being existing sales. Total housing starts and permits, and new singlefamily sales declined on a month-over-month basis; yet, were robust on a yearly basis. New single-family construction spending indicated no change on a monthly basis. Regionally, data were mixed across all sectors. The June 8th Atlanta Fed GDPNow residential investment spending model projects an aggregate 1.4% for Quarter Two. New private permanent site expenditures were projected for a - 0.2% decline; the improvement spending forecast was a 4.5% increase; and the manufactured/mobile housing projection was a -19.4% decline (all: quarterly log change and seasonally adjusted annual rate). 1 We remain confident that, despite a first quarter hiccup, economic growth will pick up through the rest of. There are signs that consumer spending is poised to strengthen in the months ahead, and we believe recent fiscal policy actions are likely to contribute to growth this year. Come 2019, however, we expect the fiscal boost to fade, and we adjusted our forecast lower accordingly. We also note mounting downside risks to our projections, including growth-constraining protectionist trade policies and rising oil prices, among others. Meanwhile, housing s upward grind should continue, despite a lackluster first quarter. We expect home sales to post modest gains both this year and next, as prices rise and affordability declines amid low for-sale inventory. 2 Doug Duncan, Chief Economist, Fannie Mae This month s commentary also contains applicable housing data, home ownership, building products, and economic information. Section I contains data and commentary and Section II includes Federal Reserve analysis, private indicators, and demographic and economic commentary. Sources: 1 6/8/18; 2 5/17/18
4 April Housing Scorecard M/M M/M = month-over-month; Y/Y = year-over-year; NC = no change Y/Y Housing Starts 3.7% 10.5% Single-Family Starts 0.1% 7.2% Housing Permits 1.8% 7.7% Single-Family Permits 0.9% 7.9% Housing Under Construction NC 0.0% 4.7% Single-Family Under Construction 1.0% 11.4% Housing Completions 2.8% 14.8% Single-Family Completions 4.0% 5.5% New Single-Family House Sales 1.5% 11.6% Private Residential Construction Spending 4.5% 9.5% Single-Family Construction Spending NC 0.0% 9.6% Existing House Sales 1 2.5% 1.4% Sources: U.S. Department of Commerce-Construction; 1 FRED: Federal Reserve Bank of St. Louis


5 New Construction Percentage of Wood Products Consumption 32% 68% 51% 49% All Sawnwood: Total New Housing Other sectors Structural panels: Total New Housing Other sectors 22% 78% Non-structural panels: Total New Housing Other sectors Source: U.S. Forest Service. Howard, J. and D. McKeever U.S. Forest Products Annual Market Review and Prospects,

6 New SF Construction Percentage of Wood Products Consumption 75% 25% 60% 40% All Sawnwood: New SF Housing Other sectors Structural panels: New SF Housing 14% 86% Non-structural panels: New SF Housing Other sectors Source: U.S. Forest Service. Howard, J. and D. McKeever U.S. Forest Products Annual Market Review and Prospects,


7 Repair and Remodeling s Percentage of Wood Products Consumption 14% 23% 86% 77% Non-structural panels: RR Other sectors All Sawnwood: RR Other sectors 21% 79% Structural panels: RR Other sectors Source: U.S. Forest Service. Howard, J. and D. McKeever U.S. Forest Products Annual Market Review and Prospects,
8 New Housing Starts Total Starts* SF Starts MF 2-4 Starts** MF 5 Starts April 1,287, ,000 19, ,000 March 1,336, ,000 15, , ,165, ,000 17, ,000 M/M change Y/Y change * All start data are presented at a seasonally adjusted annual rate (SAAR). ** US DOC does not report 2 to 4 multifamily starts directly, this is an estimation ((Total starts (SF + 5 unit MF)). Source: 5/16/18
9 Total Housing Starts 2,000 1,800 1,600 1,400 1,200 1, SAAR = Seasonally adjusted annual rate; in thousands Total Starts 1,287,000 Total SF 894, % Total 2-4 MF 19, % Total 5 MF 374, % Total starts 58-year average: 1,439 m units SF starts 58-year average: 1,022 m units MF starts 53-year average: 420 m units Jan SF Starts 2-4 MF Starts 5 MF Starts Feb Mar Apr US DOC does not report 2 to 4 multifamily starts directly, this is an estimation: ((Total starts (SF + 5 unit MF)). * Percentage of total starts. Source: 5/16/18
10 New SF Starts to 54 population/sf starts: 1/1/59 to 7/1/07 ratio: to 54 year old classification: 4/18 ratio: Total non-institutionalized/start ratio: 1/1/59 to 7/1/07: Total: 4/18 ratio: Ratio: SF Housing Starts/Civilian Noninstitutional Population Ratio: SF Housing Starts/Civilian Noninstitutional Population (20-54) New SF starts adjusted for the US population From April 1959 to July 2007, the long-term ratio of new SF starts to the total US non-institutionalized population was ; in April 2017 it was no change from March (0.0035). The long-term ratio of noninstitutionalized population, aged 20 to 54 is ; in April 2017 was also no change from March (0.0061). From a population worldview, construction is less than what is necessary for changes in population (i.e., under-building). Sources: and The Federal Reserve Bank of St. Louis; 5/16/18
11 Total Housing Starts: Six-Month Average 1,400 1,350 Total Starts SAAR; in thousands 1,300 1,250 1,287 1,290 1,200 1,150 1,100 1,050 1,000 Total Starts: (monthly) Total Starts: 6-month Ave. Source: 5/16/18
12 SF Housing Starts: Six-Month Average 1,000 SF Starts SAAR; in thousands SF Starts: (monthly) SF Starts: 6-month Ave. Source: 5/16/18
13 New Housing Starts by Region 1,200 SAAR; in thousands 1, Total Regional Starts Total NE 114, % Total MW 164, % Total S 663, % Total W 346, % Jan Feb Mar Apr Total NE Starts Total MW Starts Total S Starts Total W Starts NE = Northeast, MW = Midwest, S = South, W = West US DOC does not report 2 to 4 multi-family completions directly, this is an estimation (Total completions SF completions). * Percentage of total starts. Source: 5/16/18
14 New Housing Starts by Region NE Total NE SF NE MF** April 114,000 56,000 58,000 March 124,000 62,000 62, ,000 47,000 38,000 M/M change Y/Y change MW Total MW SF MW MF April 164, ,000 58,000 March 196, ,000 45, , ,000 76,000 M/M change Y/Y change All data are SAAR; S = South and W = West. ** US DOC does not report multifamily starts directly, this is an estimation (Total starts SF starts). Source: 5/16/18
15 New Housing Starts by Region S Total S SF S MF** April 663, , ,000 March 623, , , , , ,000 M/M change Y/Y change W Total W SF W MF April 346, , ,000 March 393, , , , , ,000 M/M change Y/Y change All data are SAAR; S = South and W = West. ** US DOC does not report multifamily starts directly, this is an estimation (Total starts SF starts). Source: 5/16/18
16 Total SF Housing Starts by Region SAAR; in thousands Total SF Starts by Region Total NE 56, % Total MW 106, % Total S 518, % Total W 214, % Jan Feb Mar Apr * Percentage of total starts. NE SF Starts MW SF Starts S SF Starts W SF Starts NE = Northeast, MW = Midwest, S = South, W = West US DOC does not report 2 to 4 multi-family completions directly, this is an estimation (Total completions SF completions). Source: 5/16/18
17 Nominal & SAAR SF Starts LHS: SAAR; in thousands RHS: Non-adjusted; in thousands April 2017 and April New SF Starts (adj) Apparent Expansion Factor New SF Starts (non-adj) Nominal and Adjusted New SF Monthly Starts Presented above is nominal (non-adjusted) new SF start data contrasted against SAAR data. The apparent expansion factor is the ratio of the unadjusted number of houses started in the US to the seasonally adjusted number of houses started in the US (i.e., to the sum of the seasonally adjusted values for the four regions). U.S. DOC-Construction Source: 5/16/18
18 MF Housing Starts by Region SAAR; in thousands Total MF Starts by Region Total NE 58, % Total MW 45, % Total S 145, % Total W 132, % Jan Feb Mar Apr NE MF Starts MW MF Starts S MF Starts W MF Starts NE = Northeast, MW = Midwest, S = South, W = West US DOC does not report 2 to 4 multi-family completions directly, this is an estimation (Total completions SF completions). * Percentage of total starts. Source: 5/16/18
19 SF & MF Housing Starts (%) 100.0% 90.0% 80.0% 70.0% 78.5% 69.5% 60.0% 50.0% 40.0% 30.0% 20.0% 21.5% 29.1% 10.0% 0.0% Single-Family Starts: % Multi-Family Starts: % Source: 5/16/18
20 Railroad Lumber & Wood Shipments vs. U.S. SF Housing Starts 10,000 LHS: Lumber shipments carloads (weekly average/month) RHS: SF Starts-in thousands 1,400 9,000 1,200 8,000 7,000 1,000 6, ,000 4, , ,000 1,000 0 Data are average weekly originations for each month, are not seasonally adjusted, and do not include intermodal. AAR Lumber & Wood Shipments (U.S. + Canada) SF Starts Sources: Association of American Railroads (AAR), Rail Time Indicators report 5/4/18; U.S. DOC-Construction; 5/16/18
21 Railroad Lumber & Wood Shipments vs. U.S. SF Housing Starts: 6-month Offset 10,000 LHS: Lumber shipments carloads (weekly average/month) RHS: SF Starts-in thousands 1,400 9,000 8,000 1,200 7,000 1,000 6, ,000 4, , ,000 1,000 0 Data are average weekly originations for each month, are not seasonally adjusted, and do not include intermodal. AAR Lumber & Wood Shipments (U.S. + Canada) SF Starts (6-mo. offset) In this graph, January 2007 lumber shipments are contrasted with July 2007 SF starts, and continuing through April SF starts. The purpose is to discover if lumber shipments relate to future single -family starts. Also, it is realized that lumber and wood products are trucked; however, to our knowledge comprehensive trucking data is not available. Sources: Association of American Railroads (AAR), Rail Time Indicators report 5/4/18; U.S. DOC-Construction; 5/16/18
22 New Housing Permits Total Permits* SF Permits MF 2-4 unit Permits MF 5 unit Permits April 1,352, ,000 43, ,000 March 1,377, ,000 40, , ,255, ,000 36, ,000 M/M change -1.8% 0.9% 7.5% -7.4% Y/Y change 7.7% 7.9% 19.4% 6.4% * All permit data are presented at a seasonally adjusted annual rate (SAAR). Source: 5/16/18
23 Total New Housing Permits 1,800 SAAR; in thousands 1,600 1,400 1,200 Total Permits 1,352,000 Total SF 859, % Total 2-4 MF 43, % Total 5 MF 450, % 1, SF Permits 2-4 MF Permits 5 MF Permits NE = Northeast, MW = Midwest, S = South, W = West US DOC does not report 2 to 4 multi-family completions directly, this is an estimation (Total completions SF completions). * Percentage of total permits. Source: 5/16/18
24 Nominal & SAAR SF Permits LHS: SAAR; in thousands RHS: Non-adjusted; in thousands April 2017 and April New SF Permits (adj) Apparent Expansion Factor New SF Permits (non-adj) Nominal and Adjusted New SF Monthly Permits Presented above is nominal (non-adjusted) new SF start data contrasted against SAAR data. The apparent expansion factor is the ratio of the unadjusted number of houses started in the US to the seasonally adjusted number of houses started in the US (i.e., to the sum of the seasonally adjusted values for the four regions). U.S. DOC-Construction Source: 5/16/18
25 New Housing Permits by Region NE Total* NE SF NE MF** April 92,000 49,000 43,000 March 135,000 51,000 84, ,000 51,000 69,000 M/M change -31.9% -3.9% -48.8% Y/Y change -23.3% -3.9% -37.7% MW Total* MW SF MW MF** April 194, ,000 72,000 March 203, ,000 84, , ,000 72,000 M/M change -4.4% 2.5% -14.3% Y/Y change 0.5% 0.8% 0.0% * All data are SAAR ** US DOC does not report multifamily starts directly, this is an estimation (Total starts SF starts). Source: 5/16/18
26 New Housing Permits by Region S Total* S SF S MF** April 730, , ,000 March 652, , , , , ,000 M/M change 12.0% 4.8% 28.6% Y/Y change 22.3% 10.9% 51.8% W Total* W SF W MF** April 336, , ,000 March 387, , , , , ,000 M/M change -13.2% -6.7% -22.2% Y/Y change -2.6% 8.8% -17.1% All data are SAAR ** US DOC does not report multifamily starts directly, this is an estimation (Total starts SF starts). Source: 5/16/18
27 Total Housing Permits by Region 1,200 SAAR; in thousands 1, Total Regional Permits Total NE 92, % Total MW 194, % Total S 730, % Total W 336, % Jan Feb Mar Apr NE Permits MW Permits S Permits W Permits NE = Northeast, MW = Midwest, S = South, W = West US DOC does not report 2 to 4 multi-family completions directly, this is an estimation (Total completions SF completions). * Percentage of total permits. Source: 5/16/18
28 SF Housing Permits by Region 900 SAAR; in thousands Total SF Permits Total NE 49, % Total MW 122, % Total S 478, % Total W 210, % Jan Feb Mar Apr * Percentage of total permits. NE SF Permits MW SF Permits S SF Permits W SF Permits NE = Northeast, MW = Midwest, S = South, W = West US DOC does not report 2 to 4 multi-family completions directly, this is an estimation (Total completions SF completions). Source: 5/16/18
29 MF Housing Permits by Region SAAR; in thousands Total MF Permits Total NE 43, % Total MW 122, % Total S 252, % Total W 126, % Jan Feb Mar * Percentage of total permits. NE MF Permits MW MF Permits S MF Permits W MF Permits NE = Northeast, MW = Midwest, S = South, W = West US DOC does not report 2 to 4 multi-family completions directly, this is an estimation (Total completions SF completions). Source: 5/16/18
30 Railroad Lumber & Wood Shipments vs. U.S. SF Housing Permits 10,000 LHS: Lumber shipments carloads (weekly average/month) RHS: SF permits-in thousands 1,200 9,000 8,000 1,000 7, ,000 5, ,000 3, ,000 1,000 - Data are average weekly originations for each month, are not seasonally adjusted, and do not include intermodal. AAR Lumber & Wood Shipments (U.S. + Canada) SF Permits Sources: Association of American Railroads (AAR), Rail Time Indicators report 5/4/18; U.S. DOC-Construction; 5/16/18
31 Railroad Lumber & Wood Shipments vs. U.S. SF Housing Permits: 3-month Offset 10,000 LHS: Lumber shipments carloads (weekly average/month) RHS: SF Starts-in thousands 1,200 9,000 8,000 1,000 7, ,000 5, ,000 3, ,000 1,000 - Data are average weekly originations for each month, are not seasonally adjusted, and do not include intermodal. AAR Lumber & Wood Shipments (U.S. + Canada) SF Permits (3-mo. offset) In this graph, January 2007 lumber shipments are contrasted with April 2007 SF permits, continuing through April. The purpose is to discover if lumber shipments relate to future single-family permits. Also, it is realized that lumber and wood products are trucked; however, to our knowledge comprehensive trucking data is not available. Sources: Association of American Railroads (AAR), Rail Time Indicators report 5/4/18; U.S. DOC-Construction; 5/16/18
32 New Housing Under Construction (HUC) Total Under Construction* SF Under Construction MF 2-4 unit** Under Construction All housing under construction data are presented at a seasonally adjusted annual rate (SAAR). ** US DOC does not report 2-4 multifamily units under construction directly, this is an estimation ((Total under construction (SF + 5 unit MF)). MF 5 unit Under Construction April 1,124, ,000 12, ,000 March 1,124, ,000 11, , ,074, ,000 10, ,000 M/M change 0.0% 1.0% 9.1% -1.0% Y/Y change 4.7% 11.4% 20.0% -0.7% Source: 5/16/18
33 Total Housing Under Construction 1, SAAR; in thousands Total HUC 1,124,000 Total SF 510, % Total 2-4 MF 12, % Total 5 MF 602, % Jan Feb Mar Apr SF Under Construction 2-4 MF Under Construction 5 MF Under Construction NE = Northeast, MW = Midwest, S = South, W = West US DOC does not report 2 to 4 multi-family completions directly, this is an estimation (Total completions SF completions). * Percentage of total housing under construction units. Source: 5/16/18
34 New Housing Under Construction by Region NE Total NE SF NE MF** April 186,000 53, ,000 March 186,000 52, , ,000 51, ,000 M/M change 0.0% 1.9% -0.7% Y/Y change -1.6% 3.9% -3.6% MW Total MW SF MW MF April 150,000 81,000 69,000 March 155,000 83,000 72, ,000 74,000 77,000 M/M change -3.2% -2.4% -4.2% Y/Y change -0.7% 9.5% -10.4% All data are SAAR; NE = Northeast and MW = Midwest. ** US DOC does not report multifamily units under construction directly, this is an estimation (Total under construction SF under construction). Source: 5/16/18
35 New Housing Under Construction by Region S Total S SF S MF** April 452, , ,000 March 450, , , , , ,000 M/M change 0.4% 3.0% -2.3% Y/Y change 1.3% 8.2% -5.3% W Total W SF W MF April 336, , ,000 March 333, , , , , ,000 M/M change 0.9% -0.7% 2.1% Y/Y change 16.7% 22.1% 13.1% All data are SAAR; S = South and W = West. ** US DOC does not report multifamily units under construction directly, this is an estimation (Total under construction SF under construction). Source: 5/16/18
36 Total Housing Under Construction by Region SAAR; in thousands Total HUC 1,124,000 Total SF 510, % Total 2-4 MF 12, % Total 5 MF 602, % Jan Feb Mar Apr NE Under Construction MW Under Construction S Under Construction W Under Construction NE = Northeast, MW = Midwest, S = South, W = West US DOC does not report 2 to 4 multi-family completions directly, this is an estimation (Total completions SF completions). * Percentage of total housing under construction units. Source: 5/16/18
37 SF Housing Under Construction by Region 450 SAAR; in thousands Total Regional HUC Total NE 186, % Total MW 150, % Total S 452, % Total W 336, % Jan Feb Mar Apr NE SF Under Construction MW SF Under Construction S SF Under Construction W SF Under Construction NE = Northeast, MW = Midwest, S = South, W = West US DOC does not report 2 to 4 multi-family completions directly, this is an estimation (Total completions SF completions). * Percentage of total housing under construction units. Source: 5/16/18
38 MF Housing Under Construction by Region SAAR; in thousands Total SF HUC Total NE 53, % Total MW 81, % Total S 238, % Total W 138, % Jan NE MF Under Construction MW MF Under Construction Feb Mar Apr S MF Under Construction W MF Under Construction NE = Northeast, MW = Midwest, S = South, W = West US DOC does not report 2 to 4 multi-family completions directly, this is an estimation (Total completions SF completions). * Percentage of total housing under construction units. Source: 5/16/18
39 New Housing Completions Total Completions* SF Completions MF 2-4 unit** Completions MF 5 unit Completions April 1,257, ,000 12, ,000 March 1,223, ,000 11, , ,095, ,000 22, ,000 M/M change 2.8% -4.0% 9.1% 18.7% Y/Y change 14.8% 5.5% -45.5% 43.6% * All completion data are presented at a seasonally adjusted annual rate (SAAR). ** US DOC does not report multifamily completions directly, this is an estimation ((Total completions (SF + 5 unit MF)). Source: 5/16/18
40 Total Housing Completions 1,800 1,600 1,400 1,200 SAAR; in thousands Total Completions 1,257,000 Total SF 820, % Total 2-4 MF 12, % Total 5 MF 425, % 1, Jan Feb Mar Apr * Percentage of total housing completions Total SF Completions Total 2-4 MF Completions Total 5 MF Completions US DOC does not report 2 to 4 multi-family completions directly, this is an estimation (Total completions SF completions). Source: 5/16/18
41 Total Housing Completions by Region 1, SAAR; in thousands Total Regional Completions Total NE 122, % Total MW 194, % Total S 641, % Total W 300, % Jan Feb Mar Apr NE Completions MW Completions S Completions W Completions NE = Northeast, MW = Midwest, S = South, W = West US DOC does not report 2 to 4 multi-family completions directly, this is an estimation (Total completions SF completions). * Percentage of total housing completions Source: 5/16/18
42 New Housing Completions by Region NE Total NE SF NE MF** April 122,000 51,000 71,000 March 153,000 64,000 89, ,000 60,000 27,000 M/M change -20.3% -20.3% -20.2% Y/Y change 40.2% -15.0% 163.0% MW Total MW SF MW MF April 194, ,000 64,000 March 156, ,000 45, , ,000 55,000 M/M change 24.4% 17.1% 42.2% Y/Y change 7.2% 3.2% 16.4% All data are SAAR; NE = Northeast and MW = Midwest. ** US DOC does not report multifamily units under construction directly, this is an estimation (Total under construction SF under construction). Source: 5/16/18
43 New Housing Completions by Region S Total S SF S MF** April 641, , ,000 March 591, , , , , ,000 M/M change 8.5% -8.4% 70.1% Y/Y change 8.1% 0.0% 28.6% W Total W SF W MF April 300, ,000 86,000 March 323, , , , ,000 68,000 M/M change -7.1% -0.5% -20.4% Y/Y change 28.2% 28.9% 26.5% All data are SAAR; S = South and W = West. ** US DOC does not report multifamily units under construction directly, this is an estimation (Total under construction SF under construction). Source: 5/16/18
44 Total Housing SF Completions by Region SAAR; in thousands Total SF Completions Total NE 51, % Total MW 130, % Total S 425, % Total W 214, % Jan Feb Mar Apr NE SF Completions MW SF Completions S SF Completions W SF Completions NE = Northeast, MW = Midwest, S = South, W = West US DOC does not report 2 to 4 multi-family completions directly, this is an estimation (Total completions SF completions). * Percentage of total housing completions Source: 5/16/18
45 New Housing MF Completions by Region SAAR; in thousands Total MF Completions Total NE 71, % Total MW 64, % Total S 216, % Total W 86, % Jan Feb Mar Apr NE MF Completions MW MF Completions S MF Completions W MF Completions NE = Northeast, MW = Midwest, S = South, W = West US DOC does not report 2 to 4 multi-family completions directly, this is an estimation (Total completions SF completions). * Percentage of total housing completions All data are SAAR; NE = Northeast and MW = Midwest; * Percentage of total housing completions. Source: 5/16/18
46 New Single-Family House Sales New SF Sales* Median Price Mean Price * All new sales data are presented at a seasonally adjusted annual rate (SAAR) 1 and housing prices are adjusted at irregular intervals 2. New SF sales were less than the consensus forecast (677 m) 3. The past three month s new SF sales data were revised: January initial: 593 m revised to 633 m; February initial: 618 m revised to 659 m; March initial: 694 m revised to 672 m. Month's Supply April 662,000 $312,400 $407, March 672,000 $335,400 $366, ,000 $311,100 $365, M/M change -1.5% -6.9% 11.3% 1.9% Y/Y change 11.6% 0.4% 11.3% 0.0% Sources: 1 5/23/18; /23/18
47 New SF House Sales 1,400 SAAR; in thousands 1,200 1, average: 650,963 units April : 662, average: 633,895 units Total New SF Sales Source: 5/23/18
48 New SF Housing Sales: Six-month average & monthly SAAR; in thousands Six-month SF Sales Average New SF Sales (monthly) Source: 5/23/18
49 New SF House Sales by Region and Price Category NE SF Sales MW SF Sales S SF Sales W SF Sales April 40,000 91, , ,000 March 36,000 91, , , ,000 72, , ,000 M/M change 11.1% 0.0% 0.3% -7.9% Y/Y change 5.3% 26.4% 6.0% 18.9% $150m $150 - $199.9m 1 All data are SAAR 2 Houses for which sales price were not reported have been distributed proportionally to those for which sales price was report ed; 3 Detail may not add to total because of rounding. 4 Housing prices are adjusted at irregular intervals. $ m $300 - $399.9m $400 - $499.9m $500 - $749.9m $750m April 1,2,3,4 3,000 6,000 20,000 11,000 9,000 8,000 7,000 March 3,000 6,000 18,000 19,000 10,000 8,000 3, ,000 5,000 21,000 12,000 9,000 6,000 3,000 M/M change 0.0% 0.0% 11.1% -42.1% -10.0% 0.0% 133.3% Y/Y change 200.0% 20.0% -4.8% -8.3% 0.0% 33.3% 133.3% % of New SF sales 4.7% 9.4% 31.3% 17.2% 14.1% 12.5% 10.9% Sources: 1,2,3 5/23/18; 4
50 New SF House Sales April New SF Sales* $750m $500-$749.9m $400-$499.9m 7,000 8,000 9,000 New SF Sales: % $150m 4.7% $ m 9.4% $ m 31.3% $300-$399.9m 17.2% $400-$499.9m 14.1% $500-$749.9m 12.5% $750m 10.9% $300-$399.9m 11,000 $ m 20,000 $ m 6,000 $150m 3, ,000 10,000 15,000 20,000 25,000 * Total new sales by price category and percent. Source: 5/23/18
51 New SF House Sales by Region 700 SAAR; in thousands Total SF Sales Total NE 40, % Total MW 91, % Total S 355, % Total W 176, % * Percentage of total new sales. NE SF Sales MW SF Sales S SF Sales W SF Sales Source: 5/23/18
52 New SF House Sales by Price Category ; in thousands, and thousands of dollars; SAAR 2017 Total New SF Sales*: 612 m units < $150 $150-$ $ $300-$399.9 $400-$499.9 $500-$749.9 > $750 * Sales tallied by price category. Source: 5/23/18
53 New SF House Sales 100.0% 90.0% 92.4% 80.0% 70.0% 60.0% 65.1% 50.0% 40.0% 34.9% 30.0% 20.0% 10.0% 0.0% 7.6% % of Sales: < $400m % of Sales: > $400m New SF Sales $400m houses: 2002 April The sales share of $400 thousand plus SF houses is presented above 1, 2. Since the beginning of 2012, the upper priced houses have and are garnering a greater percentage of sales. A decreasing spread indicates that more high-end luxury homes are being sold. Several reasons are offered by industry analysts; 1) builders can realize a profit on higher priced houses; 2) historically low interest rates have indirectly resulted in increasing house prices; and 3) purchasers of upper end houses fared better financially coming out of the Great Recession. Source: /23/18
54 100.0% 90.0% 92.5% New SF House Sales LHS: < $200m; SAAR RHS: > $500m; SAAR 80.0% 70.0% 60.0% 62.5% 50.0% 40.0% 30.0% 37.5% 20.0% 10.0% 0.0% 7.5% Jan Feb Mar Apr < $ m (%) > $500m (%) New SF Sales: < $ 200m and > $500m: 2002 to April The number of < $200 thousand plus SF houses has declined dramatically since , 2. Subsequently, from 2012 onward, the > $500 thousand class has soared (on a percentage basis) in contrast to the < $200m class. One of the most oft mentioned reasons for this occurrence is builder margins. Note: Sales values not adjusted for inflation. Source: /23/18
55 New SF House Sales 35.0% 30.0% 25.0% 20.0% 15.0% 10.9% 10.0% 5.0% 0.0% Apr-18 < $150 $150-$199.9 $ $300-$399.9 $400-$499.9 $500-$749.9 > $750 New SF Total Sales Percentages Sales of SF houses in the greater than or equivalent to $ category, for the first-time since data reporting exceeded 10% of all new SF sales. The question, will this be revised downward in the upcoming months? Source: 5/23/18
56 New SF House Sales to 54 year old population/new SF sales: 1/1/63 to 12/31/07 ratio: to 54: 4/18 ratio: Total US non-institutionalized population/new SF sales: 1/1/63 to 12/31/07 ratio: All new SF sales: 4/18 ratio: Ratio of New SF Sales/Civilian Noninstitutional Population Ratio of New SF Sales/Civilian Noninstitutional Population (20-54) New SF sales adjusted for the US population From April 1963 to November 2007, the long-term ratio of new house sales to the total US non-institutionalized population was ; in April it was no change from March. The non-institutionalized population, aged 20 to 54 long-term ratio is ; in April it was a slight decrease from March (0.0046). All are non-adjusted data. From a population viewpoint, construction is less than what is necessary for changes in the population (i.e., under-building). Sources: and The Federal Reserve Bank of St. Louis; 5/23/18
57 Railroad Lumber & Wood Shipments vs. U.S. SF House Sales 10,000 LHS: Lumber shipments carloads (weekly average/month) RHS: New SF Sales-in thousands 900 9, , , ,000 5,000 4, , , ,000 0 Data are average weekly originations for each month, are not seasonally adjusted, and do not include intermodal. AAR Lumber & Wood Shipments (U.S. + Canada) New SF Sales Sources: Association of American Railroads (AAR), Rail Time Indicators report 5/4/18; U.S. DOC-Construction; 5/23/18
58 Railroad Lumber & Wood Shipments vs. U.S. SF Housing Sales: 1-year Offset 10,000 LHS: Lumber shipments carloads (weekly average/month) RHS: New SF Sales-in thousands 900 9, , , ,000 5,000 4, , , ,000 0 Data are average weekly originations for each month, are not seasonally adjusted, and do not include intermodal. AAR Lumber & Wood Shipments (U.S. + Canada) New SF Sales (1-yr. offset) In this graph, January 2007 lumber shipments are contrasted with January 2008 SF sales, and continuing through April. The purpose is to discover if lumber shipments relate to future single -family sales. Also, it is realized that lumber and wood products are trucked; however, to our knowledge comprehensive trucking data is not available. Sources: Association of American Railroads (AAR), Rail Time Indicators report 5/4/18; U.S. DOC-Construction; 5/23/18
59 Nominal vs. SAAR New SF House Sales 800 LHS: Nominal & Expansion Factors Nominal & SF data, in thousands RHS: New SF SAAR Contrast of April 2017 and April New SF sales (adj) Apparent Expansion Factor New SF sales (non-adj) Nominal and Adjusted New SF Monthly Sales Presented above is nominal (non-adjusted) new SF sales data contrasted against SAAR data. The apparent expansion factor is the ratio of the unadjusted number of houses sold in the US to the seasonally adjusted number of houses sold in the US (i.e., to the sum of the seasonally adjusted values for the four regions). U.S. DOC-Construction Source: 5/23/18
60 New SF House Sales New SF Houses Sold During Period Total Not started Under Construction Completed April 662, , , ,000 March 672, , , , , , , ,000 M/M change -1.5% 22.1% -5.3% -15.0% Y/Y change 11.6% 19.5% 3.1% 14.1% Total percentage 33.4% 34.9% 31.7% New SF Houses Sold During Period In April, a substantial portion of new sales 33.4% have not been started. Source: 5/23/18
61 New SF House Sales Thousands of units; not SAAR Sold During the Period Not started Under Construction Completed Source: 5/23/18
62 New SF House Sales New SF Houses for Sale at the end of the Period Total Not started Under Construction Completed April 300,000 61, ,000 62,000 March 298,000 57, ,000 62, ,000 46, ,000 58,000 M/M change 0.7% 7.0% -1.1% 0.0% Y/Y change 14.5% 32.6% 12.0% 6.9% Total percentage 20.3% 59.0% 20.7% Source: 5/23/18
63 New SF House Sales Thousands of units; not SAAR For Sale at End of the Period Not started Under construction Completed Source: 5/23/18
64 New SF House Sales New SF Houses for Sale at the end of the Period by Region* Total NE MW S W April 294,000 21,000 38, ,000 76,000 March 293,000 23,000 39, ,000 74, ,000 25,000 35, ,000 63,000 M/M change 0.3% -8.7% -2.6% 1.3% 2.7% Y/Y change 12.2% -16.0% 8.6% 14.4% 20.6% * Not SAAR Source: 5/23/18
65 New SF Houses Sale at End of Period by Region 300 Thousands of units; not SAAR For sale at end of period 294,000 Northeast 21, % Midwest 38, % South 159, % West 76, % NE MW S W Source: 5/23/18
66 April Construction Spending Total Private Residential* * Millions ** The US DOC does not report improvement spending directly, this is a monthly estimation for 2017: ((Total Private Spending (SF spending + MF spending)). All data are SAARs and reported in nominal US$. SF MF Improvement** April $556,294 $285,703 $61,955 $208,636 March $532,432 $285,587 $59,820 $187, $507,841 $260,738 $64,553 $182,550 M/M change 4.5% 0.0% 3.6% 11.6% Y/Y change 9.5% 9.6% -4.0% 14.3% Source: 6/1/18
67 Total Construction Spending (nominal): 1993 April $700,000 SAAR; in millions of nominal US dollars $600,000 Total Private Nominal Construction Spending: $556,294 mil $500,000 $400,000 $300,000 $200,000 $100,000 $0 Total Residential Spending (nominal) MF Spending (nominal) SF Spending (nominal) Remodeling Spending (nominal) Reported in nominal US$. The US DOC does not report improvement spending directly, this is a monthly estimation for. Source: 6/1/18
68 Total Construction Spending (adjusted): 1993-* $800,000 SAAR; in millions of US dollars (adj.) $700,000 $600,000 $500,000 $400,000 $300,000 $200,000 $100,000 $0 Total Residential Spending (adj.) SF Spending (adj.) MF Spending (adj.) Remodeling Spending (adj.) Reported in adjusted US$: (adjusted for inflation, BEA Table 1.1.9); *January to April reported in nomina l US$. Source: 6/1/18
69 Construction Spending Shares: 1993 to April 80.0 SF, MF, & RR: Percent of Total Residential Spending (adj.) SF % MF % RR % Total Residential Spending: 1993 through 2006 SF spending average: 69.2% MF spending average: 7.5 % Residential remodeling (RR) spending average: 23.3 % (SAAR). Note: 1993 to 2016 (adjusted for inflation, BEA Table 1.1.9); April-April 2017 reported in nominal US$. Source: and 6/1/18
70 Adjusted Construction Spending: Y/Y Percentage Change, 1993 to April SF Spending-nom.: Y/Y % change MF Spending-nom.: Y/Y % change Remodeling Spending-nom.: Y/Y % change Residential Construction Spending: Percentage Change, 1993 to April Presented above is the percentage change of inflation adjusted Y/Y construction spending. All spending measures declined, on a percentage basis, year-over-year. Source: 6/1/18
71 Adjusted Construction Spending: Y/Y Percentage Change, 2000 to April Total Residential Spending Y/Y % change (adj.) MF Spending Y/Y % change (adj.) SF Spending Y/Y % change (adj.) Remodeling Spending Y/Y % change (adj.) Source: 6/1/18
72 Total Adjusted Construction Spending: Y/Y Percentage Change, 1993 to April Total Residential Spending Y/Y % change (adj.) MF Spending Y/Y % change (adj.) SF Spending Y/Y % change (adj.) Remodeling Spending Y/Y % change (adj.) Residential Construction Spending: Percentage Change, 1993 to April Total, MF, and remodeling spending rebounded strongly however, SF appears to have leveled-off. Source: and 6/1/18
73 Remodeling Metrostudy Remodeling Activity, Already a Record-Setter, Will Grow Even More in, RRI Finds Index as of 1Q18 up 5.2% over year earlier; good times forecast for 2019, too. Big-ticket remodeling activity, already enjoying record economic conditions, is growing at its fastest pace in four years and should rise 5.1% this year alone, Metrostudy said today as it released its latest Residential Remodeling Index (RRI). The RRI as of the first quarter of stood as 112.9, its highest reading ever. That number means the economic conditions known to influence remodeling activity are 12.9% better than the old peak in early 2007, just before the Great Recession. The RRI has shown year-over-year gains for 24 consecutive quarters, and as of 1Q18 it was 5.2% above the year-earlier level the highest such annual growth since the first quarter of 2014 and was 1.4% better than it was just three months prior. The index is based on a statistical model that takes into account such data as household level remodeling permits, employment statistics, and a market s economic health. It then uses that model to predict the number and dollar volume of home improvement and replacement projects worth at least $1,000. Metrostudy a sister company to REMODELING now predicts the number of remodeling projects worth $1,000 and above nationwide will rise 5% this year to $12.55 million, while the value of those projects will climb 6.5% to $194.2 billion. And after the index climbs 5.1% this year, it should go up another 2.7% in 2019, the data operation believes. Actual rates this year will vary among the nation s 381 Metropolitan Statistical Areas, but 370 of them will see growth and the average will be about 4.2%. Craig Webb, Metrostudy Source: 5/17/18

74 Remodeling Metrostudy Remodeling activity is being driven by solid gains in employment and rising home values, factors that are giving homeowners the confidence to invest in their homes. Americans are not only undertaking a greater number of remodeling projects, but larger and more expensive ones. And as a reflection of the long, slow economic expansion that we have been in, many more Americans are just now initiating replacement-type projects that had been deferred during the recovery from the Great Recession. We expect another strong year for the remodeling industry in, and are waiting to see what effect recent tax cuts have on the economy. Early surveys suggest some Americans are increasing their remodeling budgets due to their taxes being lowered. Mark Boud, Chief Economist, Metrostudy Source: 5/17/18
75 * All sales data: SAAR Existing House Sales National Association of Realtors April sales: 5,460 thousand Existing Sales* Median Price Mean Price Month's Supply April 5,460,000 $257,900 $297, March 5,600,000 $249,800 $289, ,540,000 $245,000 $287, M/M -2.5% 3.2% 2.9% 14.3% Y/Y change -1.4% 5.3% 3.3% -4.8% NE Sales MW Sales S Sales W Sales April 650,000 1,290,000 2,330,000 1,190,000 March 680,000 1,290,000 2,400,000 1,230, ,000 1,330,000 2,280,000 1,200,000 M/M change -4.4% 0.0% -2.9% -3.3% Y/Y change -11.0% -3.0% 2.2% -0.8% Source: 5/24//18
76 Total Existing House Sales 8,000 7,000 6,000 5,000 SAAR; in thousands Total Existing Sales 5,460,000 Total NE 650, % Total MW 1,290, % Total S 2,330, % Total W 1,190, % 4,000 3,000 2,000 1,000 0 U.S. NE MW S W Sources: & 5/24/18

77 Home Ownership A 5-Year Delay in Homeownership, Other Big Shifts Generational definitions of millennial tend to be too broad. As our company s housing demographer, I am responsible for bringing clarity on these categories to our clients. Here are two great charts and five interesting conclusions on household formation and homeownership today. Chris Porter, Chief Demographer, John Burns Real Estate Consulting, LLC Sources: Source: 5/14/18 6/1/18
78 Home Ownership A 5-Year Delay in Homeownership, Other Big Shifts Household formation rises an average of 5.4% per year during your 20s. 13% of 20-year-olds head a household today, compared to 67% of 30-year-olds and 79% of 36- year-olds¹. Homeownership rises an average of 3.0% per year during your 20s. Only 8% of 20- year-old householders own a home today, compared to 38% of 30-year-olds and 52% of 36-year-olds². Significant shifts occurred from the peak of the last cycle in 2006 to 2016, the latest available data. Young adults are: 5% more likely to be living with parents at age % of 36-year-olds live with parents/relatives at age 36, compared to just 10% of 36-year-olds ten years prior. Forming households two years later. 50% of young adults now head a home by age 26, compared to 50% heading a home by age 24 in Buying a home five years later. Homeownership reaches 50% by age 36 today, compared to 50% homeownership at age of 31 in Chris Porter, Chief Demographer, John Burns Real Estate Consulting, LLC ¹ We consider couples living together to both be heading a home. ² The percentage of people owning a home is actually lower, as homeownership rates are the percentage of households who own and not the percent of people who own. Sources: 6/1/18 Source: 5/14/18

79 Home Ownership Sources: 6/1/18 Source: 5/14/18
80 Home Ownership A 5-Year Delay in Homeownership, Other Big Shifts Remember that 2006 had levels of homeownership that may never be achieved again. So what to do with all of this? Make better housing demand conclusions. Know the life experiences of your target tenant or buyer. Don t consider all millennials to be the same. The 1990s Connectors born in 1995 owned just over 56,000 homes in 2016, while the 1980s Sharers born in 1985 owned more than 800,000 homes. Simplify your decision-making using our rule. 4 disruptors. Government policies, economic cycles, new technologies, and shifts in social acceptability have made dramatic changes to household formation and homeownership. Government policies, new technologies, and societal shifts seem to be changing more rapidly than ever. 5 life stages. Each of those disruptors is impacting people differently whether they are young adults, families, or older. The emergence of ride sharing has impacted young adults much differently than families and retirees. 6 questions. Use our rule to maximize your revenue by clarifying the who, what, when, where, why, and how you will succeed. Chris Porter, Chief Demographer, John Burns Real Estate Consulting, LLC Source: 5/14/18
81 Home Ownership Yielding To Slowing Household Formations Experts from Freddie Mac and Metrostudy share insight into household formations. For generations, U.S. household formations have followed a distinct timeline: Children move out of parents homes to go to college, leave college, rent their own place, get married, buy a home, and years later buy a move-up home. Today, these timelines are changing. New generations are starting households later in life. Leonard Kiefer, deputy chief economist at Freddie Mac, speaks to some of the impediments to household formation in this short video. Yielding To Slowing Household Formations At the same time that buyers are slowing down their timeline for purchase, builders are slowing down construction. Kiefer attributes that to lack of land and labor, and doesn t see a quick solution for either. Jennifer Castenson, Director of Thought Leadership Content, Hanley Wood Source: 5/2/18
82 Home Ownership Source: US Census Bureau Yielding To Slowing Household Formations Paige Shipp, regional director at Metrostudy, also shows that even as new household formations continue to increase, millennial household formation is slower than previous generations. Why? Millennials rent longer than previous generations due to higher levels of debt, and enjoying a renter s lifestyle, Shipp says. They also are facing the highest rental prices in history, which makes it hard to save for a down payment. And, they were scarred by watching friends and families go through the recession, making them a very pessimistic group. Finally, rapid housing price appreciation has limited the options available for them to move into a first-time product. Jennifer Castenson, Director of Thought Leadership Content, Hanley Wood Source: 5/2/18

83 Home Ownership Yielding To Slowing Household Formations Now, not only are millennial emerging as home buyers, but they are also choosing at staggering rates to buy new over resale. In this Metrostudy and Neustar chart, the green bars show that millennials are dominating new-home sales, with nearly 52% of all newhome sales. As Kiefer points out, there is not a lot of entry-level product for this group to move into, even though the Metrostudy numbers show it s their preference. Kiefer anticipates that the demand will build to a point that builders start to focus on this product in the next three to four years. Jennifer Castenson, Director of Thought Leadership Content, Hanley Wood Source: 5/2/18
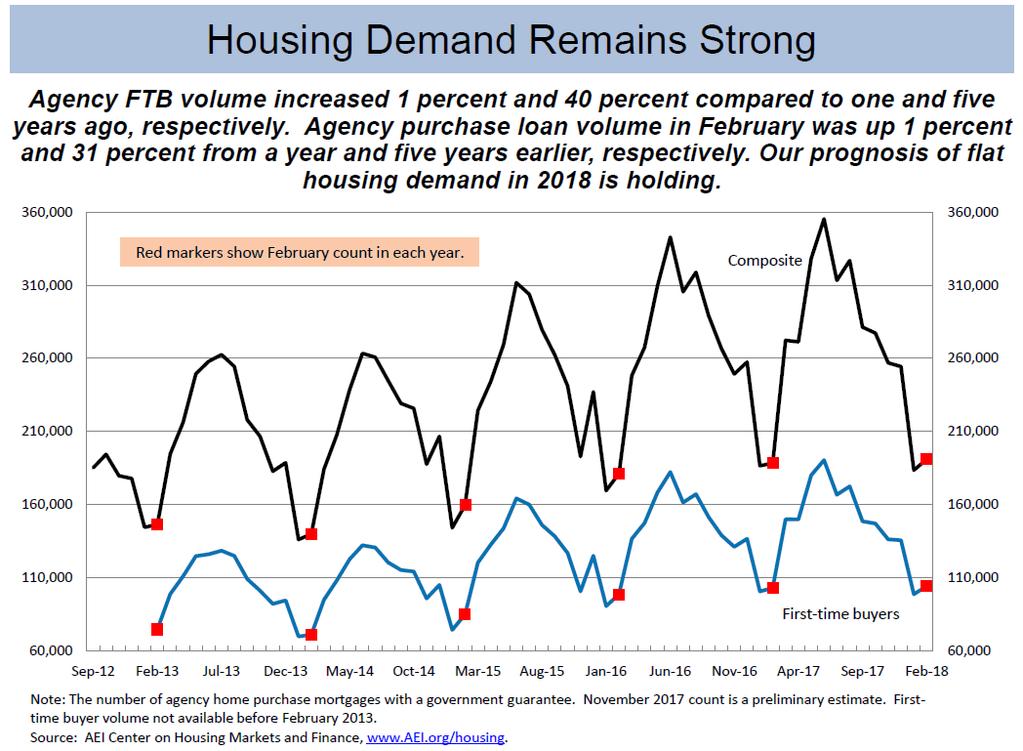
 for February was up.5 ppt from a year ago and up 2.3 ppts from February 2013.")
84 First-Time Purchasers AEI International Center on Housing Risk Mortgage Risk Index release of January data First-time buyer (FTB) mortgage risk jumped in February, helping FTBs overcome rising prices driven by dwindling inventories of homes for sale. The FTB National Mortgage Risk Index (FBMRI) for February was up.5 ppt from a year ago and up 2.3 ppts from February Setting a new series high, FHA s First-time Buyer MRI stood at 27.6% in February, up 2.3 ppts from a year earlier. FHA and Fannie Mae s outsized monthly risk increases are making entry-level homes less affordable, since in a seller s market, prices rise faster than incomes as long as the marginal buyer, who sets the price for all, has access to higher leverage. FTB volume by count also rose 1% from already elevated levels a year ago. Edward Pinto and Tobias Peter, AEI International Center on Housing Risk Source: 5/29/18
85 First-Time Purchasers Source: 5/29/18
86 First-Time Purchasers Urban Institute In February, the first-time homebuyer share of GSE purchase loans was 48.9 percent, its highest level in recent history. The FHA has always been more focused on first-time homebuyers, with its first-time homebuyer share hovering around 80 percent; it stood at 82.2 percent in February. the average first-time homebuyer was more likely than an average repeat buyer to take out a smaller loan and have a lower credit score and higher LTV and DTI, thus requiring a higher interest rate. Laurie Goodman, et al., Co-director, Housing Finance Policy Center Sources: 5/23/18
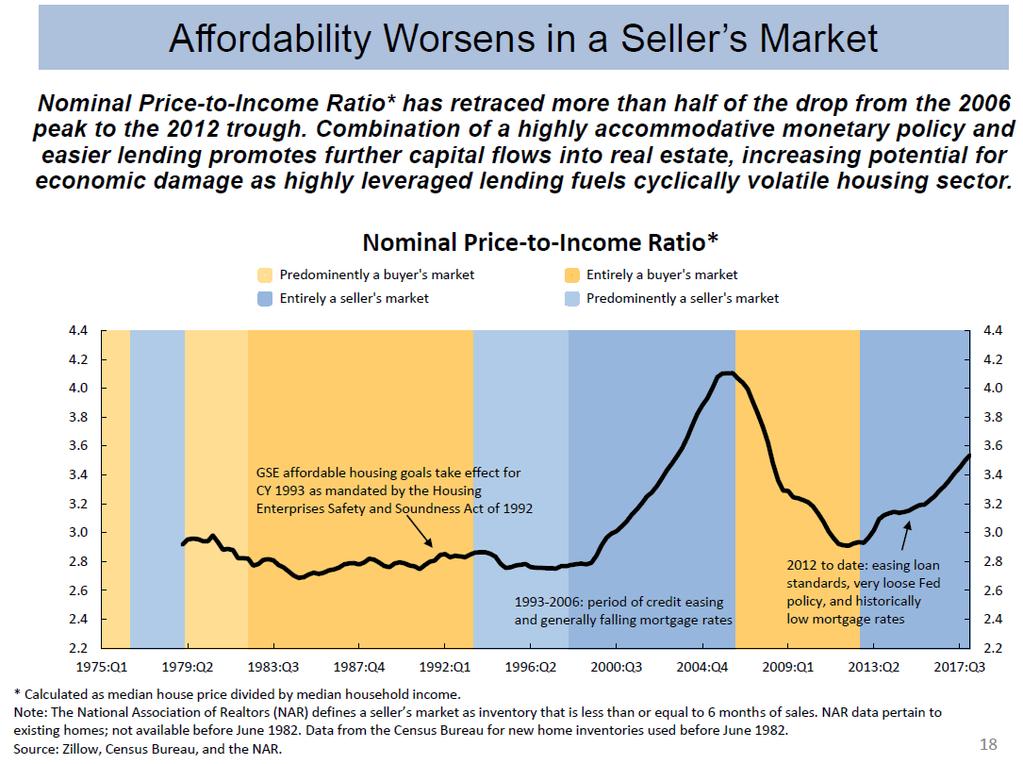
87 Housing Affordability National Housing Affordability Over Time Urban Institute Home prices remain affordable by historic standards, despite increases over the last five years and the recent interest rate hikes. As of March, the share of median income needed for the monthly mortgage payment with a 20% down payment stood at 22 percent. With a 3.5% down payment, the share of income is higher, at 26 percent in March. If interest rates rise to 5.5%, the housing expenses to income share with both a 20 percent and a 3.5 percent down payment would be equivalent to the averages (24 and 28 percent, respectively)..... Bing Lai, Research Associate, Housing Finance Policy Center Sources: 5/23/18
88 Housing Affordability Source: 5/29/18
89 Mortgage Credit Availability Source: Mortgage Bankers Association; Powered by Ellie Mae s AllRegs Market Clarity Source: Mortgage Bankers Association; Powered by Ellie Mae s AllRegs Market Clarity Mortgage Credit Availability Unchanged in April Mortgage credit availability increased in May according to the Mortgage Credit Availability Index (MCAI), a report from the Mortgage Bankers Association (MBA) which analyzes data from Ellie Mae's AllRegs Market Clarity business information tool. The MCAI increased 1.5 percent to in May. A decline in the MCAI indicates that lending standards are tightening, while increases in the index are indicative of loosening credit. The index was benchmarked to 100 in March The Conventional MCAI increased (up 2.0 percent) and the Government MCAI increased (up 1.0 percent). Of the component indices of the Conventional MCAI, the Jumbo MCAI increased by 2.2 percent while the Conforming MCAI increased by 1.9 percent. The expansion of offerings across all loan types drove credit availability to its highest level in three months. In particular, the conventional index and jumbo index both rose to their highest levels since March This was mainly caused by increased investor interest in jumbo loans and high balance conforming loans. Joel Kan, Vice President of Research and Economics, MBA Source: 6/12/18
90 Mortgage Credit Source: 5/29/18
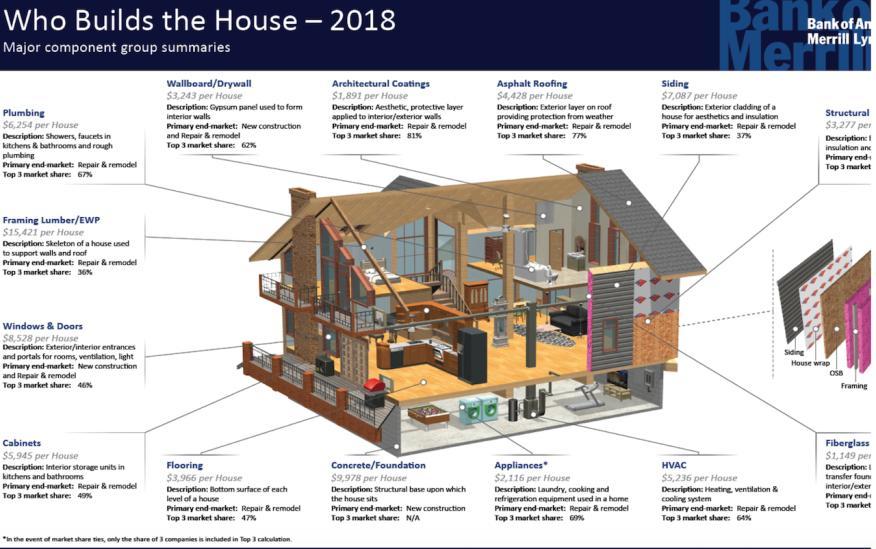
91 United States Housing Building Products -- averaging $80,566 per New Home -- Under Price Pressure Curious to look at the math of how $55 billion in annual building materials expenses roll up and break down in the new-home market, account for a quarter of a home's price tag, and add up to $105 billion in remodeling materials and products each year? A new Bank of America Merrill Lynch report -- Who Builds the House [note, subscriber content] -- subjects both the new residential and remodeling market places to a fascinating market sizing research exercise, aggregating and averaging data in such a way as to show a model for materials and products input costs. Although America's thousands of home builders don't buy, build, or model their businesses on averages, estimates, or aggregates, the analysis of 14 major product and materials component groups is helpful in revealing why all the fuss about price inflation pressures as builders work to subtract costs and offer lower-priced home models. The fascinating snapshot schematic from the report looks like this (following slide): John McManus, Editorial and Digital Content Director, Builder, Hanley Wood Sources: 5/16/18
92 United States Housing Building Products -- averaging $80,566 per New Home -- Under Price Pressure We estimate that the value of content in an average US single-family new home has grown at a compounded annual growth rate (CAGR) of 3.6% from $23,073 in 1982 to $80,566 in Our $80,566 estimate includes $2,047 of content attributable to an other category, which is an aggregate of sundry items outside of the 14 major groups. Materials constitute roughly 25% of the sale price of a new house, with the 2017 median sale price reaching $321,000 according to the US Census Bureau. This foots fairly well with our $80,566 content estimate ($80,566/25% = $322,264). We estimate an overall opportunity for building products content (excluding labor) in the US new single-family home construction market of roughly $55bn. We derive our $55bn estimate by multiplying the residential new construction exposure of each component group by its total addressable market and aggregating the results. This approach is backstopped by multiplying our estimated dollar content per home of $80,566 by 2017 new home sales of 614K and by 2017 single family starts of 851K, which implies a residential new construction market range of $49bn-$69bn. Further, the report sizes market share for the building products and materials supplier leaders in each of its 14 separate component categories, essentially diagramming market leaders in each part of the a home's construction. All in, the report notes that the top three players in each of the 14 products and materials components of a home, own 60% or more of the market, and that consolidation continues. John McManus, Editorial and Digital Content Director, Builder, Hanley Wood Sources: 5/16/18
93 United States Housing Sources: 5/16/18
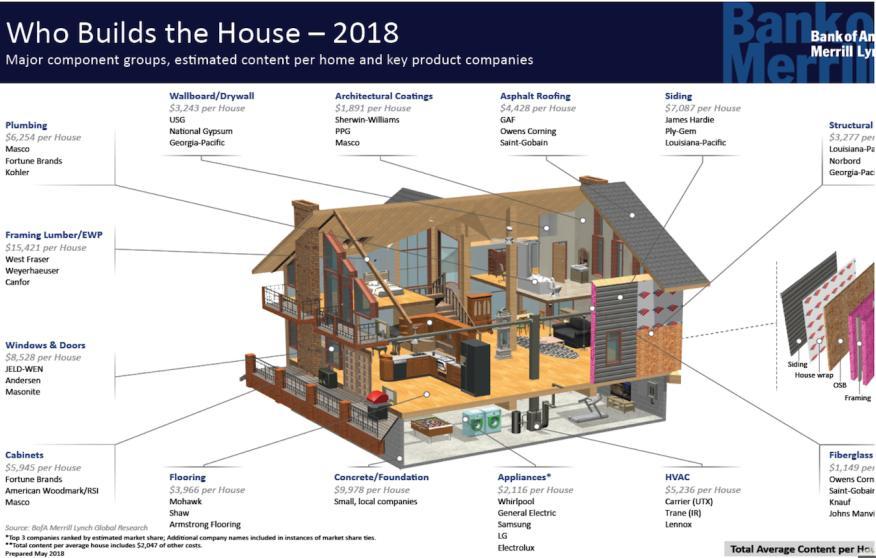
94 United States Housing Sources: 5/16/18
The Virginia Tech U.S. Forest Service June 2018 Housing Commentary: Section I
 The Virginia Tech U.S. Forest Service June Housing Commentary: Section I Urs Buehlmann Department of Sustainable Biomaterials College of Natural Resources & Environment Virginia Tech Blacksburg, VA 540.231.9759
The Virginia Tech U.S. Forest Service November 2018 Housing Commentary: Section I
 The Virginia Tech U.S. Forest Service November 2018 Housing Commentary: Section I Urs Buehlmann Department of Sustainable Biomaterials College of Natural Resources & Environment Virginia Tech Blacksburg,
The Virginia Tech U.S. Forest Service January 2019 Housing Commentary: Section I
 The Virginia Tech U.S. Forest Service January 2019 Housing Commentary: Section I Urs Buehlmann Department of Sustainable Biomaterials College of Natural Resources & Environment Virginia Tech Blacksburg,
The Virginia Tech U.S. Forest Service July 2018 Housing Commentary: Section I
 The Virginia Tech U.S. Forest Service July 218 Housing Commentary: Section I Urs Buehlmann Department of Sustainable Biomaterials College of Natural Resources & Environment Virginia Tech Blacksburg, VA
The Virginia Tech U.S. Forest Service November 2017 Housing Commentary: Section I
 The Virginia Tech U.S. Forest Service November 2017 Housing Commentary: Section I Urs Buehlmann Department of Sustainable Biomaterials College of Natural Resources & Environment Virginia Tech Blacksburg,
The Virginia Tech U.S. Forest Service October 2018 Housing Commentary: Section I
 The Virginia Tech U.S. Forest Service October 218 Housing Commentary: Section I Urs Buehlmann Department of Sustainable Biomaterials College of Natural Resources & Environment Virginia Tech Blacksburg,
The Virginia Tech U.S. Forest Service September 2017 Housing Commentary: Section I
 The Virginia Tech U.S. Forest Service September 2017 Housing Commentary: Section I Urs Buehlmann Department of Sustainable Biomaterials College of Natural Resources & Environment Virginia Tech Blacksburg,
The Virginia Tech U.S. Forest Service December 2016 Housing Commentary: Section I
 The Virginia Tech U.S. Forest Service December 2016 Housing Commentary: Section I Urs Buehlmann Department of Sustainable Biomaterials College of Natural Resources & Environment Virginia Tech Blacksburg,
The Virginia Tech U.S. Forest Service November 2015 Housing Commentary: Part A
 The Virginia Tech U.S. Forest Service November Housing Commentary: Part A Urs Buehlmann Department of Sustainable Biomaterials College of Natural Resources & Environment Virginia Tech Blacksburg, VA 54.231.9759
The Virginia Tech U.S. Forest Service September 2016 Housing Commentary: Section I
 The Virginia Tech U.S. Forest Service September Housing Commentary: Section I Urs Buehlmann Department of Sustainable Biomaterials College of Natural Resources & Environment Virginia Tech Blacksburg, VA
The Virginia Tech U.S. Forest Service March 2017 Housing Commentary: Section I
 The Virginia Tech U.S. Forest Service March 217 Housing Commentary: Section I Urs Buehlmann Department of Sustainable Biomaterials College of Natural Resources & Environment Virginia Tech Blacksburg, VA
Real Estate Trends and Outlook
 Real Estate Trends and Outlook Lawrence Yun, Ph.D. Chief Economist NATIONAL ASSOCIATION OF REALTORS Presentation at NAR Region XII Conference Coeur d Alene, ID March 5, 2015 GDP Burst in 2014 Q2, Q3, Q4
Economic and Housing Market Outlook
 Economic and Housing Market Outlook By Lawrence Yun, Ph.D. Chief Economist, National Association of REALTORS Presentations At Raleigh Regional Association of REALTORS At Orange-Chatham Association of REALTORS
Welcome to the 10 th Annual Real Estate Symposium for The Lake of the Ozarks. October 5th, 2017 Osage National Golf Resort
 Welcome to the 10 th Annual Real Estate Symposium for The Lake of the Ozarks October 5th, 2017 Osage National Golf Resort Economic and Real Estate Market Outlook October, 2017 Steve Snook, Senior Business
Economic & Housing Outlook
 Economic & Housing Outlook By Lawrence Yun, Ph.D. Chief Economist, National Association of REALTORS Presentation at Northern Arizona Association of REALTORS November 30, 2017 Tax Reform Mortgage interest
Housing Market Outlook
 Housing Market Outlook By Lawrence Yun, Ph.D. Chief Economist, National Association of REALTORS Presentation at National Conference of State Legislatures Washington, DC December 7, 2018 Very Long Economic
Economic & Housing Market Outlook
 Economic & Housing Market Outlook By Lawrence Yun, Ph.D. Chief Economist, National Association of REALTORS Presentations to NAR Annual Conference Boston, MA November 2, 2018 Existing Home Sales Since
Economic & Real Estate Outlook. Tax Reform. Michigan 4/26/18
 Economic & Real Estate Outlook By Lawrence Yun, Ph.D. Chief Economist, National Association of REALTORS Presentations at Michigan REALTORS Broker Summit Plymouth, MI April 25, 2018 Tax Reform Mortgage
THE ECONOMIC OUTLOOK FOR THE U.S. AND THE CONSTRUCTION INDUSTRY
 THE ECONOMIC OUTLOOK FOR THE U.S. AND THE CONSTRUCTION INDUSTRY by William F. Ford, Ph.D. Weatherford Chair of Finance Middle Tennessee State University presented to The Roofing Industry Alliance for Progress
Taking the Measure of St. Louis
 Taking the Measure of St. Louis The views expressed here are those of the speakers and do not necessarily represent the views of the Federal Reserve Bank of St. Louis or of the Federal Reserve System.
3Q03 Silicon Wafer Update: Demand Continues Recovery
 Gartner Dataquest Alert 3Q03 Silicon Wafer Update: Demand Continues Recovery The latest silicon forecast indicates that silicon wafer demand will grow 10 percent in 2003 over the previous year. This is
Economic and Real Estate Market Outlook
 Economic and Real Estate Market Outlook By Lawrence Yun, Ph.D. Chief Economist, National Association of REALTORS Presentation at Miami International Congress Miami, FL November 1, 2016 Lifetime Wealth
The State of the Erie Economy
 The State of the Erie Economy Presentation to Presque Isle CPCU Society Chapter September 14, 2017 Kenneth Louie The Economic Research Institute of Erie Sam and Irene Black School of Business Penn State
ECONOMIC SNAPSHOT. A Summary of the San Diego Regional Economy UNEMPLOYMENT
 A Summary of the San Diego Regional Economy UNEMPLOYMENT San Diego Regional EDC analyzes key economic metrics that are important to understanding the regional economy and San Diego's standing relative
NATIONAL INSTITUTE OF ECONOMIC AND SOCIAL RESEARCH ESTIMATES OF MONTHLY GDP. Embargo until hours on 11 th January 2013
 NATIONAL INSTITUTE OF ECONOMIC AND SOCIAL RESEARCH ESTIMATES OF MONTHLY GDP Embargo until 15.00 hours on 11 th January 2013 Our monthly estimates of GDP suggest that output declined by 0.3 per cent in
GEORGE RATIU Director, Quantitative & Commercial Research National Association of REALTORS
 GEORGE RATIU Director, Quantitative & Commercial Research National Association of REALTORS 2015 CCIM Commercial Real Estate Outlook Conference Wednesday, January 21, 2015 Coral Gables, FL Where Are We
January 2018 Industrial Production
 Japan's Economy 28 February 2018 (No. of pages: 6) Japanese report: 28 Feb 2018 January 2018 Industrial Production Jan-Mar period expected to see lull in production growth trend Economic Research Dept.
economy City of Rohnert Park : Local Economic Report EDB Sonoma County
 EDB Sonoma County Economic Development Board economy 2010-11 City of Rohnert Park : Local Economic Report E c o n o m i c D e v e l o p m e n t B o a r d 4 0 1 C o l l e g e Av e n u e S u i t e D S a
SAN DIEGO S QUARTERLY ECONOMIC SNAPSHOT
 SAN DIEGO S QUARTERLY ECONOMIC SNAPSHOT November 2017 SAN DIEGO HIGHLIGHTS IN THIS ISSUE Every quarter San Diego Regional EDC analyzes key economic indicators that are important to understanding the regional
1Q04 Update: Silicon Demand Will Move to a Full Recovery
 Gartner Dataquest Alert 1Q04 Update: Silicon Demand Will Move to a Full Recovery Our latest silicon demand forecast indicates that wafer demand in 2003 will increase 9 percent over 2002. While the forecast
The 2013 Hilliard Lyons INVESTKentucky Equity Conference
 The 2013 Hilliard Lyons INVESTKentucky Equity Conference Keynote Address William Ford Ph.D. Weatherford Chair of Finance Middle Tennessee State University THE ECONOMIC OUTLOOK FOR THE U.S. & KENTUCKY ECONOMY
2019 Business Journal. Chris Raad
 2019 Business Journal Chris Raad Tax Reform Mortgage interest deduction?... $750,000 Property tax deduction? SALT at $10,000 Tax Cut for nearly all However, many will not itemize and do standard deduction
Silicon Wafer Demand Forecast Update, 4Q03
 Forecast Analysis Silicon Wafer Demand Forecast Update, 4Q03 Abstract: Silicon wafer demand in 2003 will register an 8 percent increase over 2002. Demand will enter an expansion phase in the second quarter
Dr. Jeffrey Michael. Executive Director, Center for Business and Policy Research University of the Pacific
 2019 San Joaquin County Economic Outlook Dr. Jeffrey Michael Executive Director, Center for Business and Policy Research University of the Pacific Outline Population Growth and Migration California and
SAN DIEGO S QUARTERLY ECONOMIC SNAPSHOT
 SAN DIEGO S QUARTERLY ECONOMIC SNAPSHOT December 2018 SAN DIEGO HIGHLIGHTS IN THIS ISSUE Every quarter San Diego Regional EDC analyzes key economic indicators that are important to understanding the regional
BUSINESS EMPLOYMENT DYNAMICS
 BUSINESS EMPLOYMENT DYNAMICS First Quarter 2018 Office of Research Kurt Westby, Commissioner Andrew Condon, Director of Research WETHERSFIELD, November 7th, 2018 - (BED) data published quarterly by the
National Population Estimates: March 2009 quarter
 Image description. Hot Off The Press. End of image description. Embargoed until 10:45am 15 May 2009 National Population Estimates: March 2009 quarter Highlights The estimated resident population of New
NEWS RELEASE FOR WIRE TRANSMISSION: 8:30 A.M. EDT, FRIDAY, APRIL 17, William Zeile: (202) BEA 09-14
 BEA 09-14") NEWS RELEASE FOR WIRE TRANSMISSION: 8:30 A.M. EDT, FRIDAY, APRIL 17, 2009 William Zeile: (202) 606-9893 BEA 09-14 Summary Estimates for Multinational Companies: Employment, Sales, and Capital Expenditures
NEWS RELEASE FOR WIRE TRANSMISSION: 8:30 A.M. EDT, FRIDAY, APRIL 17, 2009 William Zeile: (202) 606-9893 BEA 09-14 Summary Estimates for Multinational Companies: Employment, Sales, and Capital Expenditures
ECONOMIC SNAPSHOT. A Summary of the San Diego Regional Economy UNEMPLOYMENT
 A Summary of the San Diego Regional Economy Brought to you by San Diego Regional EDC analyzes key economic metrics that are important to understanding the regional economy and San Diego s standing relative
Real Estate Markets in a Tentative Economic Landscape
 Real Estate Markets in a Tentative Economic Landscape GEORGE RATIU Director, Quantitative & Commercial Research National Association of REALTORS Bay Area Real Estate Council Annual Economic Outlook Tampa,
SEMICONDUCTOR INDUSTRY ASSOCIATION FACTBOOK
 Factbook 2014 SEMICONDUCTOR INDUSTRY ASSOCIATION FACTBOOK INTRODUCTION The data included in the 2014 SIA Factbook helps demonstrate the strength and promise of the U.S. semiconductor industry and why it
Silicon Valley Venture Capital Survey Second Quarter 2018
 fenwick & west Silicon Valley Venture Capital Survey Second Quarter 2018 Full Analysis Silicon Valley Venture Capital Survey Second Quarter 2018 fenwick & west Full Analysis Cynthia Clarfield Hess, Mark
Energy MLP Strategy. PORTFOLIO MANAGER COMMENTARY Fourth Quarter Key Takeaways
 Fourth Quarter 2017 Energy MLP Strategy Key Takeaways Michael Clarfeld, CFA Managing Director, Portfolio Manager Global crude oil demand growth is outstripping global supply growth driving inventory reductions
The Construction Market in Europe: A Supplier s Point of View
 The Construction Market in Europe: A Supplier s Point of View Dr. Walter Nussbaumer Abstract After the 2009 recession and the 2010 stagnation, recovery took place in 2011 when the World Construction Industry
2012 ACCE Industry Advisory Board Best Practices Positioning Your Firm After the Great Recession
 2012 ACCE Industry Advisory Board Best Practices Positioning Your Firm After the Great Recession 2012 FMI Corporation 0 The Great Recession 2012 FMI Corporation 1 FMI Corporation 2010 1 Market Truths You
Canadian Consumer Confidence Index A TNS News Release April 18, 2013
 Canadian Consumer Confidence Index A TNS News Release April 18, 2013 Canadian Consumer Confidence Sinks Again Amid Continued Uncertainty over Housing, Jobs News Release Consumer Confidence Indices Overview
USG CORPORATION + U.S. CHAMBER OF COMMERCE. Q4 Commercial. Construction Index. powered by
 D Q4 Commercial USG CORPORATION + U.S. CHAMBER OF COMMERCE 2018 Construction Index powered by THE USG CORPORATION + U.S. CHAMBER OF COMMERCE COMMERCIAL CONSTRUCTION INDEX Throughout 2018, USG Corporation
Technology and Industry Outlook Country Studies and Outlook Division (DSTI/CSO)
") OECD Science, Technology and Industry Outlook 2012 Directorate for Science Technology and Industry Directorate for Science, Technology and Industry Country Studies and Outlook Division (DSTI/CSO) What
OECD Science, Technology and Industry Outlook 2012 Directorate for Science Technology and Industry Directorate for Science, Technology and Industry Country Studies and Outlook Division (DSTI/CSO) What
Commercial Investment Portfolio Sale
 Commercial Investment Portfolio Sale Key Highlights >> Three-property portfolio sale in Downtown Columbia, South Carolina >> Four buildings totaling ±37,200 SF >> Family leased & managed for 50+ years
SAN DIEGO S QUARTERLY ECONOMIC SNAPSHOT
 SAN DIEGO S QUARTERLY ECONOMIC SNAPSHOT February 2018 SAN DIEGO HIGHLIGHTS IN THIS ISSUE Every quarter San Diego Regional EDC analyzes key economic indicators that are important to understanding the regional
Silicon Wafer Demand Outlook: Forecast Update, 2Q03
 Research Brief Silicon Wafer Demand Outlook: Forecast Update, 2Q03 Abstract: The latest silicon wafer demand outlook predicts about 6 percent growth in 2003, nearly the same as the previous forecast. However,
2014 PRODUCTION FORECASTS FOR THE GLOBAL ELECTRONICS AND INFORMATION TECHNOLOGY INDUSTRIES
 PRODUCTION FORECASTS FOR THE GLOBAL ELECTRONICS AND INFORMATION TECHNOLOGY INDUSTRIES December 24, JAPAN ELECTRONICS AND INFORMATION TECHNOLOGY INDUSTRIES ASSOCIATION FOREWORD For the Japanese economy,
THE U.S. SEMICONDUCTOR INDUSTRY:
 THE U.S. SEMICONDUCTOR INDUSTRY: KEY CONTRIBUTOR TO U.S. ECONOMIC GROWTH Matti Parpala 1 August 2014 The U.S. Semiconductor Industry: Key Contributor To U.S. Economic Growth August 2014 1 INTRO The U.S.
Dr. Greg Hallman Director, Real Estate Finance and Investment Center (REFIC) McCombs School of Business University of Texas at Austin
 McCombs School of Business University of Texas at Austin") Dr. Greg Hallman Director, Real Estate Finance and Investment Center (REFIC) McCombs School of Business University of Texas at Austin POWERPOINT PARTNER } The US Economy today, with a close look at jobs
Dr. Greg Hallman Director, Real Estate Finance and Investment Center (REFIC) McCombs School of Business University of Texas at Austin POWERPOINT PARTNER } The US Economy today, with a close look at jobs
2017 R&D Trends Forecast Results from the Industrial Research Institute s Annual Survey
 FEATURE ARTICLE 2017 R&D Trends Forecast Results from the Industrial Research Institute s Annual Survey Slowing economies slow R&D investments and mute optimism. The Industrial Research Institute The Industrial
ECONOMIC SNAPSHOT. A Summary of the San Diego Regional Economy UNEMPLOYMENT
 A Summary of the San Diego Regional Economy Brought to you by analyzes key economic metrics that are important to understanding the regional economy and San Diego s standing relative to other major metropolitan
THE TOP 100 CITIES PRIMED FOR SMART CITY INNOVATION
 THE TOP 100 CITIES PRIMED FOR SMART CITY INNOVATION Identifying U.S. Urban Mobility Leaders for Innovation Opportunities 6 March 2017 Prepared by The Top 100 Cities Primed for Smart City Innovation 1.
BACCARAT: A LONGITUDINAL MICRO-STUDY
 BACCARAT: A LONGITUDINAL MICRO-STUDY FIELD RESULTS FROM ONE ATLANTIC CITY CASINO, JANUARY 2004 TO JUNE 2010 CENTER FOR GAMING RESEARCH, JULY 2010 Baccarat is the most important game in the world s biggest
ECONOMIC SNAPSHOT. A Summary of the San Diego Regional Economy UNEMPLOYMENT
 A Summary of the San Diego Regional Economy Brought to you by San Diego Regional EDC analyzes key economic metrics that are important to understanding the regional economy and San Diego s standing relative
XT: Explore Technology LAUNCHING STUDENTS INTO TECHNOLOGY-BASED MAJORS AT VIRGINIA TECH
 XT: Explore Technology LAUNCHING STUDENTS INTO TECHNOLOGY-BASED MAJORS AT VIRGINIA TECH The XT factor: what drives you? THIS MAY NOT BE THE EASIEST QUESTION TO ANSWER. THERE CAN BE SEVERAL THINGS THAT
Charles S. Gascon Regional Economist, Senior Coordinator
 Generated: July 2018 Charles S. Gascon Regional Economist, Senior Coordinator Education MBA, Washington University, 2012 M.A. Economics, State University of New York at Albany, 2006 B.S. Managerial Economics,
Seeing things clearly: the reality of VR for women. Exploring virtual reality opportunities for media and technology companies
 Seeing things clearly: the reality of VR for women Exploring virtual reality opportunities for media and technology companies Our survey of adult men and women in the UK suggests that women are less likely
ECONOMIC SNAPSHOT. A Summary of the San Diego Regional Economy UNEMPLOYMENT
 A Summary of the San Diego Regional Economy Brought to you by San Diego Regional EDC analyzes key economic metrics that are important to understanding the regional economy and San Diego s standing relative
Canada s Engineering and Applied Science Technicians and Technologists. Assessing Their Economic Contribution
 Canada s Engineering and Applied Science Technicians and Technologists. Assessing Their Economic Contribution REPORT APRIL 2016 For the exclusive use of Eric Morin, ericm@aset.ab.ca, ASET. Canada s Engineering
Silicon Valley Venture Capital Survey Third Quarter 2017
 fenwick & west Silicon Valley Venture Capital Survey Third Quarter 2017 Full Analysis Silicon Valley Venture Capital Survey Third Quarter 2017 fenwick & west Full Analysis Cynthia Clarfield Hess, Mark
Contents. Illustrations
 Copyright IDSA 2001 Contents Executive Summary 3 1.0 Introduction 4 2.0 Direct Effects of Consumer Demand for Computer and Video Games 6 2.1 Sectors and Industries Directly Affected and Included 6 Information
Freight: A View From the Street
 Equity Research September 2017 Freight: A View From the Street NEARS Conference, Pittsburgh, PA September 26-28, 2017 Jason H. Seidl, Managing Director 646.562.1404 jason.seidl@cowen.com Matt Elkott, Vice
Italian Americans by the Numbers: Definitions, Methods & Raw Data
 Tom Verso (January 07, 2010) The US Census Bureau collects scientific survey data on Italian Americans and other ethnic groups. This article is the eighth in the i-italy series Italian Americans by the
Robotics Market Update
 Robotics Market Update The Outlook in North America Jeff Burnstein President Robotic Industries Association North American Economic Outlook The Great Recession of 2008-09 Financial meltdown in US caused
SAN DIEGO S QUARTERLY ECONOMIC SNAPSHOT
 SAN DIEGO S QUARTERLY ECONOMIC SNAPSHOT August 2017 highlights in THIS ISSUE Every quarter Regional EDC analyzes key economic indicators that are important to understanding the regional economy and the
Technology transfer industry shows gains
 Technology transfer industry shows gains in patents filed and granted, university-created startups and commercial products; slippage in federal research funding cited Highlights of AUTM s Canadian Licensing
State of Venture Capital in the Southeast Q Executive Summary Pacing vs. 2016*
 Executive Summary Venture capital in the U.S. continues to flow at historically high levels, largely driven by later stage deals, with total invested capital on pace through August for an all-time record
MSMES: OPPORTUNITIES AND CHALLENGES FOR THE SDG AGENDA
 MSMES: OPPORTUNITIES AND CHALLENGES FOR THE SDG AGENDA Global Symposium on the role of micro-, small- and medium-sized enterprises (MSMEs) in the achievement of Sustainable Development Goals (SDGs) UN
National Population Estimates: June 2011 quarter
 National Population Estimates: June 2011 quarter Embargoed until 10:45am 12 August 2011 Highlights The estimated resident population of New Zealand was 4.41 million at 30 June 2011. Population growth was
Dollar Tree for Sale N. Monroe St. Tallahassee, FL
 Dollar Tree for Sale 3706 N. Monroe St. Tallahassee, FL Table of Contents FOR FURTHER INFORMATION Joe Boyd office 843.973.8283 mobile 843.906.7751 email joe@twinriverscap.com 3706 N. Monroe St. Tallahassee,
III. THE REGIONAL FRAMEWORK
 THE SAN DIEGO REGIONAL ECONOMY III. THE REGIONAL FRAMEWORK The San Diego region, comprised solely of San Diego County, is one of California s most dynamic regions. The efforts of the University within
2013 venture capital trends summary
 213 venture capital trends summary Prepared by: Hitesh Kothari, Director, McGladrey LLP hitesh.kothari@mcgladrey.com August 213 Fundraising by venture capital funds In the first half of 213, 88 venture
Dollar Tree for Sale N. Monroe St. Tallahassee, FL
 Dollar Tree for Sale 3706 N. Monroe St. Tallahassee, FL Table of Contents FOR FURTHER INFORMATION Joe Boyd office 843.973.8283 mobile 843.906.7751 email joe@twinriverscap.com 3706 N. Monroe St. Tallahassee,
Executive Summary and Table of Contents
 UK UPSTREAM OIL & GAS SECTOR REPORT 2012/13 Executive Summary and Table of Contents Focused, cutting edge information on the UK Upstream oil and gas industry. Providing detailed and robust analysis of
Second Quarter CY 2012 Results. August 2, 2012
 Second Quarter CY 2012 Results August 2, 2012 1 Safe Harbor Disclosure Please review our SEC filings on Form 10-K and Form 10-Q The statements contained in this presentation that are not historical facts
How U.S. Employment Is Changing
 December 1, 211 How U.S. Employment Is Changing Stephen P. A. Brown and Hui Liu During the most recent recession, U.S. employment fell by 7,49 million jobs (5.4 percent). During the first 8 months of the
The 2006 Minnesota Internet Study Broadband enters the mainstream
 CENTER for RURAL POLICY and DEVELOPMENT April 2007 The 2006 Minnesota Study enters the mainstream A PDF of this report can be downloaded from the Center s web site at www.ruralmn.org. 2007 Center for Policy
1Q 2016 Results. Mermaid Maritime Plc. May 23, 2016
 Mermaid Maritime Plc 1Q 2016 Results May 23, 2016 Disclaimer: The information contained in this document is intended only for use during the presentation and should not be disseminated or distributed to
Key Census Bureau Economic Programs and Tools
 Key Census Bureau Economic Programs and Tools NY State Data Center Annual Affiliate Meeting May 11, 2017 Presented by: Andrew W. Hait U.S. Census Bureau Outline Overview of Census Economic Data The 2017
Life Sciences Outlook. Westchester County 2016
 Life Sciences Outlook Westchester County 2016 Westchester County Just a short distance from Manhattan, Westchester County is an ideal location to many firms looking to attract and retain talent. The access
America s Cooperative Electric Utilities The Nation s Consumer Owned Electric Utility Network
 America s Cooperative Electric Utilities The Nation s Consumer Owned Electric Utility Network Electric cooperatives are an integral part of the $391 billion U.S. electric utility industry. They play a
Mars Generation National Opinion Poll
 Mars Generation National Opinion Poll Measuring U.S. Citizen Support for the Exploration of Mars Report by: Explore Mars, Inc. Survey conducted by: Phillips & Company Sponsored by: The Boeing Company March
Venture Capital Research Report Q4 2017
 Venture Capital Research Report Q4 2017 As of February 9, 2018 Executive Summary VC market in the US Regional share of investment VC market in the SF Bay Area Annual VC investment in the SF Bay Area VC
Cattle and Beef Markets: Short and Long Run Challenges and Opportunities
 Cattle and Beef Markets: Short and Long Run Challenges and Opportunities Derrell S. Peel Breedlove Professor of Agribusiness and Extension Livestock Marketing Specialist Oklahoma State University Major
Click to edit Master title style The State of the Venture Capital Industry Click to edit Master text styles
 The State of the Venture Capital Industry Bobby Franklin President Third & level CEO of NVCA Southeast Venture Conference March 16 Overview Click Venture to edit capital Master stats text at-a-glance styles
IPI grew moderately at 2.2% in August
 Dr. Mohd Afzanizam Abdul Rashid Chief Economist 03-2088 8075 afzanizam@bankislam.com.my Shafiz Jamaluddin Analyst 03-2088 8399 shafiz@bankislam.com.my Nor Jannah Abdullah Analyst 03-2088 8399 norjannah@bankislam.com.my
Florida Venture Factbook
 S E AT T L E SAN FRANCISCO NEW YORK LONDON Florida Venture Factbook 2019 pitchbook.com US + 1 206.623.1986 UK + 44 (0)207.190.9809 demo@pitchbook.com PG 1 Dear Attendee, On behalf of the Florida Venture
St. George Mega Trends
 St. George Mega Trends Image Source: http://www.nps.gov/zion/photosmultimedia/index.htm Arthur C. Nelson, Ph.D., FAICP Presidential Professor & Director of Metropolitan Research University of Utah St.
SFSA CASTEEL REPORTER a monthly publication Steel Founders' Society of America
 SFSA CASTEEL REPORTER a monthly publication Steel Founders' Society of America serving SFSA steel casting industry Members 780 McArdle Drive Unit G, Crystal Lake IL 60014 815-455-8240 Fax: 815-455-8241
State Content Standards for New Mexico
 Episode 101 What Is a Biz Kid? Episode 102 What Is Money? Episode 103 How Do You Get Money? Episode 104 What Can You Do with Money? Episode 105 Money Moves Episode 106 Taking Charge of Your Financial Future
Textron Reports Third Quarter 2014 Income from Continuing Operations of $0.57 per Share, up 62.9%; Revenues up 18.1%
 Textron Reports Third Quarter Income from Continuing Operations of $0.57 per Share, up 62.9%; Revenues up 18.1% 10/17/ PROVIDENCE, R.I.--(BUSINESS WIRE)-- Textron Inc. (NYSE: TXT) today reported third
1. Job offers to BA recipients Job offers for BA recipients on graduation: percent with at least one job Percent 100
 1. Job offers to BA recipients Job offers for BA recipients on graduation: percent with at least one job 1 8 6 4 2 1988 1989 199 1991 1992 1993 1994 1995 1996 1998 1999 2 21 at least one job 56 67.3 68.1
Small Business Landscape 2016: Cause for Cautious Optimism
 Small Business Landscape 2016: Cause for Cautious Optimism Executive Summary With 90% of U.S. companies characterized as small-business enterprises and 30% of all working Americans employed at companies
Saying. I Do to a. Franchise
 Saying I Do to a Franchise 1 Saying I Do To A Franchise Like marriage, buying a franchise is a long-term commitment. Before you say yes, make sure you understand what it takes to be successful. The Commitment
U.S. Employment Growth and Tech Investment: A New Link
 U.S. Employment Growth and Tech Investment: A New Link Rajeev Dhawan and Harold Vásquez-Ruíz Economic Forecasting Center J. Mack Robinson College of Business Georgia State University Preliminary Draft