The Virginia Tech U.S. Forest Service July 2018 Housing Commentary: Section I
|
|
|
- Melvyn Richard
- 5 years ago
- Views:
Transcription


1 The Virginia Tech U.S. Forest Service July 218 Housing Commentary: Section I Urs Buehlmann Department of Sustainable Biomaterials College of Natural Resources & Environment Virginia Tech Blacksburg, VA buehlmann@gmail.com Delton Alderman Forest Products Marketing Unit Forest Products Laboratory U.S. Forest Service Madison, WI dalderman@fs.fed.us 218 Virginia Polytechnic Institute and State University VCE-CNRE29NP Virginia Cooperative Extension programs and employment are open to all, regardless of age, color, disability, gender, gender identity, gender expression, national origin, political affiliation, race, religion, sexual orientation, genetic information, veteran status, or any other basis protected by law. An equal opportunity/affirmative action employer. Issued in furtherance of Cooperative Extension work, Virginia Polytechnic Institute and State University, Virginia State University, and the U.S. Department of Agriculture cooperating. Edwin J. Jones, Director, Virginia Cooperative Extension, Virginia Tech, Blacksburg; M. Ray McKinnie, Administrator, 189 Extension Program, Virginia State University, Petersburg.
2 Table of Contents Slide 3: Opening Remarks Slide 4: Housing Scorecard Slide 5: Wood Use in Construction Slide 8: New Housing Starts Slide 13: Regional Housing Starts Slide 22: New Housing Permits Slide 25: Regional New Housing Permits Slide 32: Housing Under Construction Slide 34: Regional Under Construction Slide 39: Housing Completions Slide 44: Regional Housing Completions Slide 46: New Single-Family House Sales Slide 49: Regional SF House Sales & Price Slide 56: New SF Sales-Population Ratio Slide 67: Construction Spending Slide 7: Construction Spending Shares Slide 74: Remodeling Slide 83: Existing House Sales Slide 85: House Ownership Slide 93: First-Time Purchasers Slide 94: Affordability Slide 95: Summary Slide 97: Virginia Tech Disclaimer Slide 98: USDA Disclaimer This report is a free monthly service of Virginia Tech. Past issues are available at: To request the commentary, please buehlmann@gmail.com or dalderman@fs.fed.us
3 Opening Remarks July housing data rebounded in the majority of categories; yet, the aggregate housing market appears to be in a sluggish mode. Total permits and starts, including single-family permits and starts inched into positive territory. Total starts were negative on a year-over-year basis. Housing under construction also crept into positive territory on a monthly basis. Total and single-family housing completions were negative on a month-over-month basis. New single-family sales declined month-over-month and were robust on a year-over-year basis. Existing sales continued their declining trend, monthly and yearly. New single-family construction spending indicated a minimal negative change on a monthly basis. The September 14th Atlanta Fed GDPNow residential investment spending model projects an aggregate -.7% decline for September 218. New private permanent site expenditures were projected for a -5.% decrease; the improvement spending forecast was a 4.7% increase; and the manufactured/mobile housing projection was a -15.9% decline (all: quarterly log change and seasonally adjusted annual rate) 1. The recent acceleration in overall economic growth has done precious little to promote a stronger housing recovery. Home sales, new home construction and outlays for renovations and repairs were collectively a net drag on overall growth during the first half of the year, even as real GDP growth ramped up to a 4.1 percent pace during the second quarter. The disconnect between a strengthening economy and struggling housing sector has been a common theme throughout this expansion and, unfortunately, is a theme that is likely to continue. 2 Mark Vitner, Senior Economist, Charlie Dougherty, Economist, and Matthew Honnold, Economic Analyst; Economics Group, Wells Fargo LLC This month s commentary also contains applicable housing data, house ownership, and economic information. Section I contains data and commentary and Section II includes regional Federal Reserve analysis, private indicators, and demographic and economic commentary. Sources: 1 9/14/18; 2 8/9/18
4 July 218 Housing Scorecard M/M M/M = month-over-month; Y/Y = year-over-year; NC = no change Y/Y Housing Starts.9% 1.4% Single-Family Starts.9% 2.7% Housing Permits 1.5% 4.2% Single-Family Permits 1.9% 6.4% Housing Under Construction.1% 4.8% Single-Family Under Construction 1.% 12.5% Housing Completions 1.7%.8% Single-Family Completions 5.2% 3.9% New Single-Family House Sales 1.7% 12.8% Private Residential Construction Spending.6% 6.7% Single-Family Construction Spending.3% 6.% Existing House Sales 1.7% 1.5% Sources: U.S. Department of Commerce-Construction; 1 FRED: Federal Reserve Bank of St. Louis
5 New Construction s Percentage of Wood Products Consumption 36% 56% 69% All Sawnwood Structural panels Non-structural panels Source: U.S. Forest Service. Howard, J. and D. McKeever U.S. Forest Products Annual Market Review and Prospects,
6 New SF Construction Percentage of Wood Products Consumption 14% 86% Non-structural panels: New Housing Other markets 6% 4% Structural panels: New housing Other markets 25% All Sawnwood: New housing 75% Other markets Source: U.S. Forest Service. Howard, J. and D. McKeever U.S. Forest Products Annual Market Review and Prospects,
7 Repair and Remodeling s Percentage of Wood Products Consumption 14% Non-structural panels: Remodeling 23% All Sawnwood: Remodeling 86% Other markets 77% Other markets 21% Structural panels: Remodeling 79% Other markets Source: U.S. Forest Service. Howard, J. and D. McKeever U.S. Forest Products Annual Market Review and Prospects,
8 New Housing Starts Total Starts* SF Starts MF 2-4 Starts** MF 5 Starts July 1,168, 862, 3, 33, June 1,158, 854, 1, 294, 217 1,185, 839, 11, 335, M/M change Y/Y change * All start data are presented at a seasonally adjusted annual rate (SAAR). ** US DOC does not report 2 to 4 multifamily starts directly, this is an estimation ((Total starts (SF + 5 unit MF)). Source: 8/16/18
9 Total Housing Starts 2, 1,8 1,6 1,4 1,2 1, 8 SAAR = Seasonally adjusted annual rate; in thousands Total Starts 1,168, Total SF 862, 73.8% Total 2-4 MF 3,.3% Total 5 MF 33, 25.9% Total starts 58-year average: 1,439 m units SF starts 58-year average: 1,22 m units MF starts 53-year average: 42 m units US DOC does not report 2 to 4 multifamily starts directly, this is an estimation: ((Total starts (SF + 5 unit MF)). * Percentage of total starts. SF Starts 2-4 MF Starts 5 MF Starts Source: 8/16/18
10 New SF Starts to 54 population/sf starts: 1/1/59 to 7/1/7 ratio:.13 2 to 54 year old classification: 7/18 ratio: Total non-institutionalized/start ratio: 1/1/59 to 7/1/7:.66 Total: 7/18 ratio:.33 Ratio: SF Housing Starts/Civilian Noninstitutional Population Ratio: SF Housing Starts/Civilian Noninstitutional Population (2-54) New SF starts adjusted for the US population From July 1959 to July 27, the long-term ratio of new SF starts to the total US non-institutionalized population was.66; in July 218 it was.33 no change from June (.33). The long-term ratio of noninstitutionalized population, aged 2 to 54 is.13; in July 218 was.58 also no change from June (.58). From a population worldview, new SF construction is less than what is necessary for changes in population (i.e., under-building). Sources: and The Federal Reserve Bank of St. Louis; 8/16/18
11 Total Housing Starts: Six-Month Average 1,4 1,35 Total Starts SAAR; in thousands 1,3 1,25 1,258 1, ,15 1,1 1,5 1, Total Starts: (monthly) Total Starts: 6-month Ave. Source: 8/16/18
12 SF Housing Starts: Six-Month Average 1, SF Starts SAAR; in thousands SF Starts: (monthly) SF Starts: 6-month Ave. Source: 8/16/18
13 New Housing Starts by Region 1,2 1, 8 SAAR; in thousands Total Regional Starts Total NE 97, 8.3% Total MW 173, 14.8% Total S 636, 54.5% Total W 262, 22.4% NE = Northeast, MW = Midwest, S = South, W = West US DOC does not report 2 to 4 multi-family completions directly, this is an estimation (Total completions SF completions). * Percentage of total starts. Total NE Starts Total MW Starts Total S Starts Total W Starts Source: 8/16/18
14 New Housing Starts by Region NE Total NE SF NE MF** July 97, 66, 31, June 11, 7, 31, , 68, 51, M/M change Y/Y change MW Total MW SF MW MF July 173, 137, 36, June 155, 112, 43, , 116, 45, M/M change Y/Y change All data are SAAR; S = South and W = West. ** US DOC does not report multifamily starts directly, this is an estimation (Total starts SF starts). Source: 8/16/18
15 New Housing Starts by Region S Total S SF S MF** July 636, 46, 176, June 576, 451, 125, , 462, 149, M/M change Y/Y change W Total W SF W MF July 262, 199, 63, June 326, 221, 15, , 193, 11, M/M change Y/Y change All data are SAAR; S = South and W = West. ** US DOC does not report multifamily starts directly, this is an estimation (Total starts SF starts). Source: 8/16/18
16 Total SF Housing Starts by Region 9 SAAR; in thousands Total SF Starts by Region Total NE 66, 5.7% Total MW 137, 11.7% Total S 46, 39.4% Total W 199, 17.% NE = Northeast, MW = Midwest, S = South, W = West US DOC does not report 2 to 4 multi-family completions directly, this is an estimation (Total completions SF completions). * Percentage of total starts. NE SF Starts MW SF Starts S SF Starts W SF Starts Source: 8/16/18
17 Nominal & SAAR SF Starts 1, LHS: SAAR; in thousands RHS: Non-adjusted; in thousands July 217 and July New SF Starts (adj) Apparent Expansion Factor New SF Starts (non-adj) Nominal and Adjusted New SF Monthly Starts Presented above is nominal (non-adjusted) new SF start data contrasted against SAAR data. The apparent expansion factor is the ratio of the unadjusted number of houses started in the US to the seasonally adjusted number of houses started in the US (i.e., to the sum of the seasonally adjusted values for the four regions). U.S. DOC-Construction Source: 8/16/18
18 MF Housing Starts by Region SAAR; in thousands Total MF Starts by Region Total NE 31, 2.7% Total MW 36, 3.1% Total S 176, 15.1% Total W 63, 5.4% 1 5 NE MF Starts MW MF Starts S MF Starts W MF Starts NE = Northeast, MW = Midwest, S = South, W = West US DOC does not report 2 to 4 multi-family completions directly, this is an estimation (Total completions SF completions). * Percentage of total starts. Source: 8/16/18
19 SF & MF Housing Starts (%) 1.% 9.% 8.% 7.% 78.5% 73.8% 6.% 5.% 4.% 3.% 2.% 21.5% 26.2% 1.%.% Single-Family Starts: % Multi-Family Starts: % Source: 8/16/18
20 Railroad Lumber & Wood Shipments vs. U.S. SF Housing Starts 1, LHS: Lumber shipments carloads (weekly average/month) RHS: SF Starts-in thousands 1,4 9, 1,2 8, 7, 1, 6, 8 5, 4, 6 3, 4 2, 1, Data are average weekly originations for each month, are not seasonally adjusted, and do not include intermodal. AAR 2 Lumber & Wood Shipments (U.S. + Canada) SF Starts Sources: Association of American Railroads (AAR), Rail Time Indicators report 8/3/18; U.S. DOC-Construction; 8/16/18
21 Railroad Lumber & Wood Shipments vs. U.S. SF Housing Starts: 6-month Offset 1, LHS: Lumber shipments carloads (weekly average/month) RHS: SF Starts-in thousands 1,4 9, 8, 1,2 7, 1, 6, 8 5, 4, 6 3, 4 2, 1, Data are average weekly originations for each month, are not seasonally adjusted, and do not include intermodal. AAR 2 Lumber & Wood Shipments (U.S. + Canada) SF Starts (6-mo. offset) In this graph, January 27 lumber shipments are contrasted with July 27 SF starts, and continuing through July 218 SF starts. The purpose is to discover if lumber shipments relate to future single -family starts. Also, it is realized that lumber and wood products are trucked; however, to our knowledge comprehensive trucking data is not available. Sources: Association of American Railroads (AAR), Rail Time Indicators report 8/3/18; U.S. DOC-Construction; 8/16/18
22 New Housing Permits Total Permits* SF Permits MF 2-4 unit Permits MF 5 unit Permits July 1,311, 869, 32, 41, June 1,292, 853, 36, 43, 217 1,258, 817, 42, 399, M/M change Y/Y change * All permit data are presented at a seasonally adjusted annual rate (SAAR). Source: 8/16/18
23 Total New Housing Permits 1,8 SAAR; in thousands 1,6 1,4 1,2 Total Permits 1,311, Total SF 869, 66.3% Total 2-4 MF 32, 2.4% Total 5 MF 41, 31.3% 1, SF Permits 2-4 MF Permits 5 MF Permits NE = Northeast, MW = Midwest, S = South, W = West US DOC does not report 2 to 4 multi-family completions directly, this is an estimation (Total completions SF completions). * Percentage of total permits. Source: 8/16/18
24 Nominal & SAAR SF Permits LHS: SAAR; in thousands RHS: Non-adjusted; in thousands July 217 and July New SF Permits (adj) Apparent Expansion Factor New SF Permits (non-adj) Nominal and Adjusted New SF Monthly Permits Presented above is nominal (non-adjusted) new SF start data contrasted against SAAR data. The apparent expansion factor is the ratio of the unadjusted number of houses started in the US to the seasonally adjusted number of houses started in the US (i.e., to the sum of the seasonally adjusted values for the four regions). U.S. DOC-Construction Source: 8/16/18
25 New Housing Permits by Region NE Total* NE SF NE MF** June 112, 54, 58, May 134, 57, 77, , 55, 5, M/M change Y/Y change MW Total* MW SF MW MF** June 17, 117, 53, May 29, 122, 87, , 12, 92, M/M change Y/Y change * All data are SAAR ** US DOC does not report multifamily starts directly, this is an estimation (Total starts SF starts). Source: 8/16/18
26 New Housing Permits by Region S Total* S SF S MF** June 664, 477, 187, May 625, 458, 167, , 447, 196, M/M change Y/Y change W Total* W SF W MF** June 327, 22, 125, May 333, 26, 127, , 191, 161, M/M change Y/Y change All data are SAAR ** US DOC does not report multifamily starts directly, this is an estimation (Total starts SF starts). Source: 8/16/18
27 Total Housing Permits by Region 1,2 SAAR; in thousands 1, 8 Total Regional Permits Total NE 112, 8.8% Total MW 17, 13.4% Total S 664, 52.2% Total W 327, 25.7% Jan Feb Mar Apr May Jun NE Permits MW Permits S Permits W Permits NE = Northeast, MW = Midwest, S = South, W = West US DOC does not report 2 to 4 multi-family completions directly, this is an estimation (Total completions SF completions). * Percentage of total permits. Source: 8/16/18
28 SF Housing Permits by Region 9 SAAR; in thousands Total SF Permits Total NE 54, 4.2% Total MW 117, 9.2% Total S 477, 37.5% Total W 22, 15.9% Jan 218 Feb 218 Mar 218 Apr 218 May 218 Jun 218 * Percentage of total permits. NE SF Permits MW SF Permits S SF Permits W SF Permits NE = Northeast, MW = Midwest, S = South, W = West US DOC does not report 2 to 4 multi-family completions directly, this is an estimation (Total completions SF completions). Source: 8/16/18
29 MF Housing Permits by Region SAAR; in thousands Total MF Permits Total NE 58, 4.6% Total MW 53, 4.2% Total S 187, 14.7% Total W 125, 9.8% Jan 218 Feb 218 Mar 218 Apr 218 May 218 Jun 218 * Percentage of total permits. NE MF Permits MW MF Permits S MF Permits W MF Permits NE = Northeast, MW = Midwest, S = South, W = West US DOC does not report 2 to 4 multi-family completions directly, this is an estimation (Total completions SF completions). Source: 8/16/18
30 Railroad Lumber & Wood Shipments vs. U.S. SF Housing Permits 1, LHS: Lumber shipments carloads (weekly average/month) RHS: SF permits-in thousands 1,2 9, 8, 1, 7, 8 6, 5, 6 4, 3, 4 2, 1, Data are average weekly originations for each month, are not seasonally adjusted, and do not include intermodal. AAR 2 Lumber & Wood Shipments (U.S. + Canada) SF Permits Sources: Association of American Railroads (AAR), Rail Time Indicators report 8/3/18; U.S. DOC-Construction; 8/16/18
31 Railroad Lumber & Wood Shipments vs. U.S. SF Housing Permits: 3-month Offset 1, LHS: Lumber shipments carloads (weekly average/month) RHS: SF Starts-in thousands 1,2 9, 8, 1, 7, 8 6, 5, 6 4, 3, 4 2, 1, Data are average weekly originations for each month, are not seasonally adjusted, and do not include intermodal. AAR 2 Lumber & Wood Shipments (U.S. + Canada) SF Permits (3-mo. offset) In this graph, January 27 lumber shipments are contrasted with July 27 SF permits, continuing through July 218. The purpose is to discover if lumber shipments relate to future single-family permits. Also, it is realized that lumber and wood products are trucked; however, to our knowledge comprehensive trucking data is not available. Sources: Association of American Railroads (AAR), Rail Time Indicators report 8/3/18; U.S. DOC-Construction; 8/16/18
32 New Housing Under Construction (HUC) Total Under Construction* SF Under Construction MF 2-4 unit** Under Construction All housing under construction data are presented at a seasonally adjusted annual rate (SAAR). ** US DOC does not report 2-4 multifamily units under construction directly, this is an estimation ((Total under construction (SF + 5 unit MF)). MF 5 unit Under Construction July 1,122, 521, 12, 589, June 1,121, 516, 12, 593, 217 1,71, 463, 9, 599, M/M change Y/Y change Source: 8/16/18
33 Total Housing Under Construction 1, SAAR; in thousands Total HUC 1,122, Total SF 521, 46.4% Total 2-4 MF 12, 1.1% Total 5 MF 589, 52.5% SF Under Construction 2-4 MF Under Construction 5 MF Under Construction NE = Northeast, MW = Midwest, S = South, W = West US DOC does not report 2 to 4 multi-family completions directly, this is an estimation (Total completions SF completions). * Percentage of total housing under construction units. Source: 8/16/18
34 New Housing Under Construction by Region NE Total NE SF NE MF** July 184, 57, 127, June 187, 56, 131, , 5, 136, M/M change Y/Y change MW Total MW SF MW MF July 153, 83, 7, June 154, 82, 72, , 78, 75, M/M change Y/Y change All data are SAAR; NE = Northeast and MW = Midwest. ** US DOC does not report multifamily units under construction directly, this is an estimation (Total under construction SF under construction). Source: 8/16/18
35 New Housing Under Construction by Region S Total S SF S MF** July 458, 245, 213, June 451, 242, 29, , 221, 22, M/M change Y/Y change W Total W SF W MF July 327, 136, 191, June 329, 136, 193, , 114, 177, M/M change Y/Y change All data are SAAR; S = South and W = West. ** US DOC does not report multifamily units under construction directly, this is an estimation (Total under construction SF under construction). Source: 8/16/18
36 Total Housing Under Construction by Region SAAR; in thousands Total Regional HUC Total NE 184, 16.4% Total MW 153, 16.4% Total S 458, 4.8% Total W 327, 29.1% NE Under Construction MW Under Construction S Under Construction W Under Construction NE = Northeast, MW = Midwest, S = South, W = West US DOC does not report 2 to 4 multi-family completions directly, this is an estimation (Total completions SF completions). * Percentage of total housing under construction units. Source: 8/16/18
37 SF Housing Under Construction by Region SAAR; in thousands Total SF HUC Total NE 57, 5.1% Total MW 83, 7.4% Total S 245, 21.8% Total W 136, 12.1% NE SF Under Construction MW SF Under Construction S SF Under Construction W SF Under Construction NE = Northeast, MW = Midwest, S = South, W = West US DOC does not report 2 to 4 multi-family completions directly, this is an estimation (Total completions SF completions). * Percentage of total housing under construction units. Source: 8/16/18
38 MF Housing Under Construction by Region 25 2 SAAR; in thousands Total MF HUC Total NE 127, 11.3% Total MW 7, 6.2% Total S 213, 19.% Total W 191, 17.% NE MF Under Construction MW MF Under Construction S MF Under Construction W MF Under Construction NE = Northeast, MW = Midwest, S = South, W = West US DOC does not report 2 to 4 multi-family completions directly, this is an estimation (Total completions SF completions). * Percentage of total housing under construction units. Source: 8/16/18
39 New Housing Completions Total Completions* SF Completions MF 2-4 unit** Completions MF 5 unit Completions June 1,188, 814, 3, 371, May 1,29, 859, 7, 343, 217 1,197, 847, 7, 343, M/M change -1.7% -5.2% -57.1% 8.2% Y/Y change -.8% -3.9% -57.1% 8.2% * All completion data are presented at a seasonally adjusted annual rate (SAAR). ** US DOC does not report multifamily completions directly, this is an estimation ((Total completions (SF + 5 unit MF)). Source: 8/16/18
40 Total Housing Completions 1,8 1,6 1,4 1,2 SAAR; in thousands Total Completions 1,188, Total SF 814, 68.5% Total 2-4 MF 3,.3% Total 5 MF 371, 31.2% 1, US DOC does not report 2 to 4 multi-family completions directly, this is an estimation (Total completions SF completions). * Percentage of total housing completions Total SF Completions Total 2-4 MF Completions Total 5 MF Completions Source: 8/16/18
41 Total Housing Completions by Region 1, SAAR; in thousands Total Regional Completions Total NE 126, 1.6% Total MW 184, 15.5% Total S 565, 47.6% Total W 313, 26.3% NE = Northeast, MW = Midwest, S = South, W = West US DOC does not report 2 to 4 multi-family completions directly, this is an estimation (Total completions SF completions). * Percentage of total housing completions NE Completions MW Completions S Completions W Completions Source: 8/16/18
42 New Housing Completions by Region NE Total NE SF NE MF** June 126, 49, 77, May 76, 48, 28, , 75, 31, M/M change 65.8% 2.1% 175.% Y/Y change 18.9% -34.7% 148.4% MW Total MW SF MW MF June 184, 131, 53, May 171, 118, 53, , 16, 65, M/M change 7.6% 11.%.% Y/Y change 7.6% 23.6% -18.5% All data are SAAR; NE = Northeast and MW = Midwest. ** US DOC does not report multifamily units under construction directly, this is an estimation (Total under construction SF under construction). Source: 8/16/18
43 New Housing Completions by Region S Total S SF S MF** June 565, 428, 137, May 61, 441, 16, , 474, 166, M/M change -6.% -2.9% -14.4% Y/Y change -11.7% -9.7% -17.5% W Total W SF W MF June 313, 26, 17, May 361, 252, 19, , 192, 88, M/M change -13.3% -18.3% -1.8% Y/Y change 11.8% 7.3% 21.6% All data are SAAR; S = South and W = West. ** US DOC does not report multifamily units under construction directly, this is an estimation (Total under construction SF under construction). Source: 8/16/18
44 Total Housing SF Completions by Region 9 8 SAAR; in thousands Total SF Completions Total NE 49, 4.1% Total MW 131, 11.% Total S 428, 36.% Total W 26, 17.3% NE SF Completions MW SF Completions S SF Completions W SF Completions NE = Northeast, MW = Midwest, S = South, W = West US DOC does not report 2 to 4 multi-family completions directly, this is an estimation (Total completions SF completions). * Percentage of total housing completions Source: 8/16/18
45 New Housing MF Completions by Region 25 2 SAAR; in thousands Total MF Completions Total NE 77, 6.5% Total MW 53, 4.5% Total S 137, 11.5% Total W 17, 9.% NE MF Completions MW MF Completions S MF Completions W MF Completions NE = Northeast, MW = Midwest, S = South, W = West US DOC does not report 2 to 4 multi-family completions directly, this is an estimation (Total completions SF completions). * Percentage of total housing completions All data are SAAR; NE = Northeast and MW = Midwest; * Percentage of total housing completions. Source: 8/16/18
46 New Single-Family House Sales New SF Sales* Median Price Mean Price * All new sales data are presented at a seasonally adjusted annual rate (SAAR) 1 and housing prices are adjusted at irregular intervals 2. New SF sales were much less than the consensus forecast of 649 m 3. The past three month s new SF sales data were revised: April initial: 662 m revised to 633 m; May initial: 689 m revised to 654 m. June initial: 631 m revised to 638 m Month's Supply July 627, $328,7 $394,3 5.9 June 638, $31, $369, , $322,9 $372,4 6. M/M change -1.7% 6.% 6.7% 3.5% Y/Y change 12.8% 1.8% 5.9% -1.7% Sources: 1 8/23/18; /byshoweventfull.asp; 8/23/18
47 New SF House Sales 1,4 SAAR; in thousands 1,2 1, average: 65,963 units average: 633,895 units July 218: 631, 2 Total New SF Sales Source: 8/23/18
48 New SF Housing Sales: Six-month average & monthly 8 SAAR; in thousands Six-month SF Sales Average New SF Sales (monthly) Source: 8/23/18
49 New SF House Sales by Region and Price Category NE SF Sales MW SF Sales S SF Sales W SF Sales July 21, 78, 355, 173, June 44, 71, 367, 156, , 66, 33, 146, M/M change -52.3% 9.9% -3.3% 1.9% Y/Y change -48.8% 18.2% 17.2% 18.5% $15m $15 - $199.9m $ m $3 - $399.9m $4 - $499.9m 1 All data are SAAR 2 Houses for which sales price were not reported have been distributed proportionally to those for which sales price was report ed; 3 Detail may not add to total because of rounding. 4 Housing prices are adjusted at irregular intervals. $5 - $749.9m $75m July 1,2,3,4 1, 5, 15, 17, 6, 5, 4, June 2, 6, 21, 13, 8, 7, 2, 217 1, 5, 14, 13, 7, 5, 3, M/M change -5.% -16.7% -28.6% 3.8% -25.% -28.6% 1.% Y/Y change.%.% 7.1% 3.8% -14.3%.% 33.3% New SF sales: % 1.9% 9.4% 28.3% 32.1% 11.3% 9.4% 7.5% Sources: 1,2,3 8/23/18; 4
50 New SF House Sales July New SF Sales* $75m $5-$749.9m $4-$499.9m 4, 5, 6, New SF Sales: % $15m 1.9% $ m 9.4% $ m 28.3% $3-$399.9m 32.1% $4-$499.9m 11.3% $5-$749.9m 9.4% $75m 7.5% $3-$399.9m 17, $ m 15, $15-$199.9m 5, $15m 1, - 2, 4, 6, 8, 1, 12, 14, 16, 18, * Total new sales by price category and percent. Source: 8/23/18
51 New SF House Sales by Region 7 SAAR; in thousands 6 5 Total SF Sales Total NE 21, 3.3% Total MW 78, 12.4% Total S 355, 56.6% Total W 173, 27.6% NE SF Sales MW SF Sales S SF Sales W SF Sales * Percentage of total new sales. Source: 8/23/18
52 New SF House Sales by Price Category ; in thousands, and thousands of dollars; SAAR Total New SF Sales*: 612 m units Sales_Cat!#REF! Sales_Cat!#REF! 25 $ $3-$399.9 $4-$ $5-$749.9 > $75 * Sales tallied by price category Source: 8/23/18
53 New SF House Sales 1.% 9.% 92.4% 8.% 7.% 71.7% 6.% 5.% 4.% 3.% 2.% 28.3% 1.%.% 7.6% % of Sales: $4m % of Sales: $4m New SF Sales $4m houses: 22 July 218 The sales share of $4 thousand plus SF houses is presented above 1, 2. Since the beginning of 212, the upper priced houses have and are garnering a greater percentage of sales. A decreasing spread indicates that more high-end luxury homes are being sold. Several reasons are offered by industry analysts; 1) builders can realize a profit on higher priced houses; 2) historically low interest rates have indirectly resulted in increasing house prices; and 3) purchasers of upper end houses fared better financially coming out of the Great Recession. Source: /23/18
54 New SF House Sales 1.% 9.% 92.5% LHS: $2m; thousands of units; SAAR RHS: $5m; thousands of units; SAAR 8.% 7.% 6.% 5.% 4.% 52.6% 47.4% 3.% 2.% 1.%.% 7.5% Jan 218 Feb 218 Mar 218 Apr 218 May 218 Jun 218 < $ m (%) > $5m (%) New SF Sales: $ 2m and $5m: 22 to July 218 The number of $2 thousand plus SF houses has declined dramatically since 22 1, 2. Subsequently, from 212 onward, the $5 thousand class has soared (on a percentage basis) in contrast to the $2m class. One of the most oft mentioned reasons for this occurrence is builder margins. Note: Sales values not adjusted for inflation. Source: /23/18
55 New SF House Sales 4 Number of houses (in thousands) by square feet ,8 sq ft 3, sq ft New SF Sales by Square Feet: 1,8 and 3,: 1999 to 217 The number of 1,8 square foot SF houses has declined markedly since From 211 onward the number of 3, square foot SF house market has risen substantially. Source: 1
56 New SF House Sales 8.% 7.% 69.2% 6.% 62.1% 5.% 4.% 37.9% 3.% 3.8% 2.% 1.%.% ,8 sq ft (%) 3, sq ft (%) New SF Sales by Square Feet: 1,8 and 3,: 1999 to 217 Source: 1
57 New SF House Sales to 54 year old population/new SF sales: 1/1/63 to 12/31/7 ratio:.62 2 to 54: 7/18 ratio: Total US non-institutionalized population/new SF sales: 1/1/63 to 12/31/7 ratio:.39 All new SF sales: 7/18 ratio:.24 Ratio of New SF Sales/Civilian Noninstitutional Population Ratio of New SF Sales/Civilian Noninstitutional Population (2-54) New SF sales adjusted for the US population From July 1963 to November 27, the long-term ratio of new house sales to the total US non-institutionalized population was.39; in July 218 it was.24 a decrease from May (.25). The non-institutionalized population, aged 2 to 54 long-term ratio is.62; in July 218 it was.42 also a decline from May (.43). All are non-adjusted data. From a population viewpoint, construction is less than what is necessary for changes in the population (i.e., under-building). Sources: and The Federal Reserve Bank of St. Louis; 8/23/18
58 Railroad Lumber & Wood Shipments vs. U.S. SF House Sales 1, LHS: Lumber shipments carloads (weekly average/month) RHS: New SF Sales-in thousands 9 9, 8 8, 7 7, 6 6, 5, 4, 5 4 3, 3 2, 2 1, Data are average weekly originations for each month, are not seasonally adjusted, and do not include intermodal. AAR 1 Lumber & Wood Shipments (U.S. + Canada) New SF Sales Sources: Association of American Railroads (AAR), Rail Time Indicators report 8/3/18; U.S. DOC-Construction; 8/23/18
59 Railroad Lumber & Wood Shipments vs. U.S. SF Housing Sales: 1-year Offset 1, LHS: Lumber shipments carloads (weekly average/month) RHS: New SF Sales-in thousands 9 9, 8 8, 7 7, 6 6, 5, 4, 5 4 3, 3 2, 2 1, Data are average weekly originations for each month, are not seasonally adjusted, and do not include intermodal. AAR 1 Lumber & Wood Shipments (U.S. + Canada) New SF Sales (1-yr. offset) In this graph, January 27 lumber shipments are contrasted with January 28 SF sales, and continuing through July 218. The purpose is to discover if lumber shipments relate to future single-family sales. Also, it is realized that lumber and wood products are trucked; however, to our knowledge comprehensive trucking data is not available. Sources: Association of American Railroads (AAR), Rail Time Indicators report 8/3/18; U.S. DOC-Construction; 8/23/18
60 Nominal vs. SAAR New SF House Sales 8 LHS: Nominal & Expansion Factors Nominal & SF data, in thousands RHS: New SF SAAR Contrast of July 217 and July New SF sales (adj) Apparent Expansion Factor New SF sales (non-adj) Nominal and Adjusted New SF Monthly Sales Presented above is nominal (non-adjusted) new SF sales data contrasted against SAAR data. The apparent expansion factor is the ratio of the unadjusted number of houses sold in the US to the seasonally adjusted number of houses sold in the US (i.e., to the sum of the seasonally adjusted values for the four regions). U.S. DOC-Construction Source: 8/23/18
61 New SF House Sales New SF Houses Sold During Period Total Not started Under Construction Completed June 627, 212, 23, 185, July 638, 174, 241, 223, , 166, 198, 192, M/M change -1.7% 21.8% -4.6% -17.% Y/Y change 12.8% 27.7% 16.2% -3.6% Total percentage 33.8% 36.7% 29.5% New SF Houses Sold During Period In July 218, a substantial portion of new sales 33.8% have not been started. * Not SAAR Source: 8/23/18
62 New SF House Sales 6 5 Thousands of units; not SAAR Sold During the Period Not started Under Construction Completed Not SAAR Source: 8/23/18
63 New SF House Sales Total Not started Under Construction Completed June 39, 65, 18, 64, July 33, 59, 183, 61, , 44, 17, 61, M/M change 2.% 1.2% -1.6% 4.9% Y/Y change 12.4% 47.7% 5.9% 4.9% Total percentage 21.% 58.3% 2.7% Not SAAR New SF Houses for Sale at the end of the Period Source: 8/23/18
64 New SF House Sales 35 3 Thousands of units; not SAAR For Sale at End of the Period Not started Under construction Completed Not SAAR Source: 8/23/18
65 New SF House Sales New SF Houses for Sale at the end of the Period by Region* Total NE MW S W June 31, 27, 42, 161, 8, July 34, 26, 41, 157, 8, , 24, 37, 149, 66, M/M change 2.% 3.8% 2.4% 2.5%.% Y/Y change 12.7% 12.5% 13.5% 8.1% 21.2% * Not SAAR Source: 8/23/18
66 New SF Houses Sale at End of Period by Region Thousands of units; not SAAR For sale at end of period 31, Northeast 27, 8.7% Midwest 42, 13.5% South 161, 51.9% West 8, 25.8% NE MW S W Source: 8/23/18
67 July 218 Construction Spending Total Private Residential* * Millions ** The US DOC does not report improvement spending directly, this is a monthly estimation for 217: ((Total Private Spending (SF spending + MF spending)). All data are SAARs and reported in nominal US$. SF MF Improvement** July $56,88 $287,64 $58,94 $214,84 June $556,688 $287,882 $59,23 $29, $524,88 $27,813 $58,299 $195,768 M/M change.6% -.3% -.4% 2.1% Y/Y change 6.7% 6.% 1.1% 9.4% Source: 9/4/18
68 Total Construction Spending (nominal): 1993 July 218 $7, SAAR; in millions of nominal US dollars $6, Total Private Nominal Construction Spending: $56,88 bil $5, $4, $3, $2, $1, $ Total Residential Spending (nominal) MF Spending (nominal) SF Spending (nominal) Remodeling Spending (nominal) Reported in nominal US$. The US DOC does not report improvement spending directly, this is a monthly estimation for 218. Source: 9/4/18
69 Total Construction Spending (adjusted): * $8, SAAR; in millions of US dollars (adj.) $7, $6, $5, $4, $3, $2, $1, $ Total Residential Spending (adj.) SF Spending (adj.) MF Spending (adj.) Remodeling Spending (adj.) Reported in adjusted US$: (adjusted for inflation, BEA Table 1.1.9); *January 218 to July 218 reported in nominal US$. Source: 9/4/18
70 Construction Spending Shares: 1993 to July SF, MF, & RR: Percent of Total Residential Spending (adj.) SF % MF % RR % Total Residential Spending: 1993 through 26 SF spending average: 69.2% MF spending average: 7.5 % Residential remodeling (RR) spending average: 23.3 % (SAAR). Note: 1993 to 217 (adjusted for inflation, BEA Table 1.1.9); Jan-July 218 reported in nominal US$. Source: and 9/4/18
71 Adjusted Construction Spending: Y/Y Percentage Change, 1993 to July SF Spending-nom.: Y/Y % change MF Spending-nom.: Y/Y % change Remodeling Spending-nom.: Y/Y % change Residential Construction Spending: Percentage Change, 1993 to July 218 Presented above is the percentage change of inflation adjusted Y/Y construction spending. All spending measures declined, on a percentage basis, year-over-year. Source: 9/4/18
72 Adjusted Construction Spending: Y/Y Percentage Change, 2 to July Total Residential Spending Y/Y % change (adj.) MF Spending Y/Y % change (adj.) SF Spending Y/Y % change (adj.) Remodeling Spending Y/Y % change (adj.) Source: 9/4/18
73 Total Adjusted Construction Spending: Y/Y Percentage Change, 1993 to July Total Residential Spending Y/Y % change (adj.) MF Spending Y/Y % change (adj.) SF Spending Y/Y % change (adj.) Remodeling Spending Y/Y % change (adj.) Residential Construction Spending: Percentage Change, 1993 to July 218 Total, MF, and remodeling spending indicate a slight uptick in spending however, SF appears to have leveled-off. Source: and 9/4/18
74 Remodeling BuildFax Remodeling alone is up 3% in the last five years. The slight dip in remodeling volume may be an early indicator of a leveling off of the very hot housing construction market we ve seen in the last few years. We will be keeping a close eye in the coming months to look for the leveling off trend or a further softening. Single-family housing authorizations increased by just.62% from June to July, and by a seasonally adjusted annual rate of 4.77% since July 217, the report showed. Existing housing maintenance, however, increased at a much faster pace, as the chart below shows. The annual rate of housing maintenance volume increased by 5.23%, while housing maintenance spend increased at an annual rate of 8.4% in July The annual rate of existing home remodels dropped slightly from last year, falling.26%, however remodel spend increased at an annual rate of 8.96%. Jonathan Kanarek, Chief Operating Officer, BuildFax Source: 8/15/18
75 Remodeling Source: 8/15/18
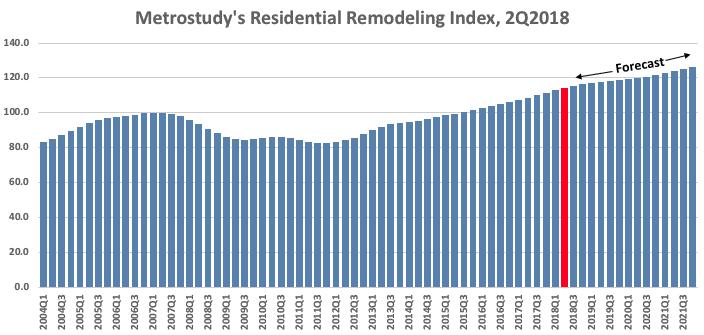
76 Remodeling Metrostudy Remodeling Activity Will Continue Its Record Growth in 218, RRI Finds Index up 5.2% over year earlier and projects positive growth through 221 Big-ticket residential remodeling activity nationwide rose 1.3% in the second quarter from the first, Metrostudy said today as it released its latest Residential Remodeling Index (RRI). The second quarter of 218 was the RRI's 25th consecutive quarter of year-over-year gains since 211. The RRI as of the second quarter of 218 stood at 114.4, its highest ever reading. The number means the economic conditions known to influence remodeling activity are 14.4% better than the old peak in early 27, just before the Great Recession. As of the second quarter of 218, the RRI was 5.2% above the year-earlier level. Metrostudy, a sister company of REMODELING, projects the number of remodeling projects worth $1, or more will rise to 12.6 million, a 5% increase from last year. The continued strong growth in the RRI is fueled by the long economic expansion and a still-strong housing market, according to Metrostudy. The index is based on a statistical model that takes into account such data as household level remodeling permits, employment statistics, and a market's economic health. It then uses that model to predict the number and dollar volume of home improvement and replacement projects worth at least $1,. Vincent Salandro, Assistant Editor, Remodeling and ProSales Source: 8/23/18
77 Remodeling Source: 8/23/18
78 Remodeling Metrostudy Remodeling Activity Will Continue Its Record Growth in 218 Metrostudy predicts the inflation-adjusted value of big-ticket remodeling projects in 218 will rise 6.7% to $194.2 billion. Metrostudy projects that the index should rise 2.7% in 219 and is projected to experience positive growth through 221. According to Metrostudy, all 381 of the nation s Metropolitan Statistical Areas will see growth in 218 project volume and the average rate of growth will be about 4.3%. Vincent Salandro, Assistant Editor, Remodeling and ProSales The U.S. economy is in the midst of its longest streak of consecutive monthly job growth in history, and, the median existing home price has recorded seventy-six consecutive months of year-over-year gains. With record setting levels in employment growth and home equity, it is little wonder that Americans are investing in home upgrades. We expect the remodeling industry to close strong in 218, with more moderate, but still-steady growth in 219. While the good times roll, there are still some headwinds for the industry. Slowing home sales amid tight inventory is limiting remodeling growth potential, as is the acute shortage of construction labor. And more recently, even before the steel and aluminum tariffs were initiated, we saw a sharp rise in costs for residential construction materials. Rising costs and effects of tariffs will need to be watched carefully over the next several quarters. Mark Boud, Chief Economist, Metrostudy Source: 8/23/18
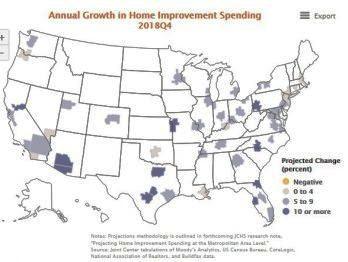
79 Remodeling Harvard Joint Center for Housing Studies Major Metro Remodeling Markets Projected To Heat Up Across The U.S. Annual growth in home improvement spending is expected to be widespread across the country s largest metropolitan areas in 218, according to a new model developed by the Remodeling Futures Program at the Joint Center. The model, described in a new research note, produces short-term projections of remodeling activity for 5 major metropolitan areas. The development of the model utilized two decades of home improvement spending in several of the nation s largest metro areas as benchmark data. As shown in the interactive map below, the Joint Center projects that improvement spending by homeowners will increase in all 5 metros this year, and increase by at least 5 percent in 41 of the 5 metros. Moreover, the Joint Center projects that annual spending will grow by 1 percent or more in 11 of these major metros, led by Kansas City, Charlotte, San Antonio, Dallas, and Sacramento (Figure 1). These projections mirror the national projections from the Remodeling Futures quarterly Leading Indicator of Remodeling Activity (LIRA), which predicts that national spending on remodeling will grow by over 7 percent in 218. The metro projections suggest that the national increase is likely to be broad-based, rather than being concentrated in any one area of the country. Elizabeth La Jeunesse, Senior Research Analyst, Harvard Joint Center for Housing Studies Source: 9/4/18
80 Remodeling Source: 9/4/18
81 Remodeling Major Metro Remodeling Markets Projected To Heat Up Across The U.S. These new metro-level projections draw on over a year of research into what drives homeowner remodeling activity at the local level, an effort that relied on home improvement data from in the Detroit, Chicago, Los Angeles, and Philadelphia metro areas. As the research note explains, about two-thirds of the variation in these metros historical growth rates is closely correlated with such factors as gains in local home prices, home sales activity, housing starts, retail sales of building materials, and remodeling permitting activity. Importantly, changes in these inputs also tend to lead remodeling activity by several quarters. Drawing on these findings, we developed a model to predict spending patterns in any metro for which we had reliable data on these inputs. In addition to offering projections on future spending, the model and the map allow us to take a retrospective look at how modeled growth rates have been trending over the past several quarters in each metro. For example, in some metros where especially strong growth is projected by year end such as Kansas City, San Antonio, Tucson, Pittsburgh, and Austin the model suggests that annual growth rates have been accelerating in recent quarters. In contrast, in such metros as San Diego, Las Vegas, and Portland, the model indicates that while growth should remain positive this year, it will be lower than it was in late 216 or early 217 (Figure 2). Additional estimates for all 5 metro areas are available in online appendix tables, which were published as part of the research note. Going forward, we will routinely monitor and assess the model s performance for any adjustments that might improve our metro-level remodeling projections over time. We plan to release 219 projections for metro area growth in home improvement spending early next year. Elizabeth La Jeunesse, Senior Research Analyst, Harvard Joint Center for Housing Studies Source: 9/4/18
82 Remodeling Source: 9/4/18
83 * All sales data: SAAR Existing House Sales National Association of Realtors July 218 sales: 5.34 thousand Existing Sales* Median Price Mean Price Month's Supply July 5,34, $269,6 $37,8 4.3 June 5,38, $273,8 $311, ,42, $258,1 $298,8 4.3 M/M -.7% -1.5% -1.3%.% Y/Y change -1.5% 4.5% 3.%.% NE Sales MW Sales S Sales W Sales July 66, 1,25, 2,24, 1,19, June 72, 1,27, 2,25, 1,14, , 1,26, 2,25, 1,24, M/M change -8.3% -1.6% -.4% 4.4% Y/Y change -1.5% -.8% -.4% -4.% Source: 8/22/18
84 Existing House Sales 8, SAAR; in thousands 7, 6, 5, Total Existing Sales 5,34, Total NE 66, 12.4% Total MW 1,25, 23.4% Total S 2,24, 41.9% Total W 1,19, 22.3% 4, 3, 2, 1, U.S. NE MW S W Source: 8/22/18
85 in percent House Ownership House Ownership: 1965 to Q Source: 8/22/18
86 16, 14, House Ownership Total Units and Occupied Houses: 1965 to Q2 218 in thousands 138,313 12, 121,24 1, 8, 6, 64,213 57,51 4, 2, Total Housing Units Total Occupied Housing Units Source: 8/22/18
87 House Ownership Total, Owner, and Renter Occupied Houses: 1965 to Q , 8, in thousands 121,24 77,911 14, 12, 7, 1, 6, 5, 43,329 8, 4, 6, 3, 4, 2, 1, 2, Total Occupied Housing Units Owner Occupied Houses Renter Occupied Source: 8/22/18
88 House Ownership House Occupation by Age-Class: 1982 to Q % 9.% 8.% 7.% 6.% 5.% 4.% 3.% 8.% 77.4% 74.4% 7.% 41.2% 78.% 75.1% 7.6% 6.% 36.5% 2.% 1.%.% 35 years years years years 65 Source: 8/22/18
89 House Ownership Residential Electricity Customers & Total Housing Units: 199 to Q , 14, 12, 1, 8, in thousands 16,283 97,95 138, ,922 6, 4, 2, Residential Customers Electricity Accounts Total Housing Units Residential electricity customer accounts are a component of the Annual Electric Power Industry Report collected by the US EIA. The US Census has four separate programs to collect, in part, estimates of household attributes and the number of vacant houses: American Housing Survey (AHS); Current Population Survey (CPS); Housing Vacancy Survey (HVS); and the Annual Social and Economic Supplement (ASEC). These differing surveys, including different objectives and timing, may account for the discrepancy between US Census and US EIA estimates. Sources: and 8/22/18
90 House Ownership Residential Electricity Customers & Total Occupied Housing Units: 199 to Q , in thousands 14, 133,922 12, 1, 8, 97,95 94, ,24 6, 4, 2, Residential Customers Electricity Accounts Total Occupied Housing Units Sources: and 8/22/18
91 House Ownership Residential Electricity Customers, Owner & Renter Occupied Housing Units: Q1 28 to Q , 134, LHS: Residential electricity customers 75,145 RHS: Owner & Renter housing units 133,922 77,911 8, 7, 132, 6, 13, 5, 43, , 35,678 4, 126, 3, 124, 124,857 2, 122, 1, 12, Electricity: Residential Customer Accounts (Quarterly) Owner occuupied housing units Renter occuupied housing units Sources: and 8/22/18
92 House Ownership Residential Electricity Customers, Owner & Renter Occupied Housing Units: 199 to Q , in thousands 14, 12, 133,922 1, 8, 6, 4, 2, 97,95 6,248 33,976 Total Owner & Renter Occupied Houses: 121,24 77,911 43,329 Residential Customers Electricity Accounts Owner Occuupied Housing Units Renter Occuupied Housing Units Sources: and 8/22/18

93 First-Time Purchasers Urban Institute In May 218, the first-time homebuyer share of GSE purchase loans was 48.5 percent, slightly down from its highest level in recent history. The FHA has always been more focused on first-time homebuyers, with its first-time homebuyer share hovering around 8 percent; it stood at 83.7 percent in May 218. The bottom table shows that based on mortgages originated in May 218, the average first-time homebuyer was more likely than an average repeat buyer to take out a smaller loan and have a lower credit score and higher LTV and DTI, thus requiring a higher interest rate. Laurie Goodman, et al., Co-director, Housing Finance Policy Center Sources: 8/28/18

94 Housing Affordability National Housing Affordability Over Time Urban Institute Home prices remain affordable by historic standards, despite price increases over the last five years and the recent interest rate hikes. As of June 218, with 2% down, the share of median income needed for the monthly mortgage payment stood at 23%; with 3.5% down, it is 27%. If interest rates rise to 5.1%, the housing expenses to income share with both a 2 percent and a 3.5 percent down payment would be the same as the 21-3 averages (24 and 28 percent, respectively). As shown in the bottom picture, mortgage affordability varies widely across MSAs. Bing Lai, Research Associate, Housing Finance Policy Center Sources: 8/28/18
The Virginia Tech U.S. Forest Service April 2018 Housing Commentary: Section I
 The Virginia Tech U.S. Forest Service April Housing Commentary: Section I Urs Buehlmann Department of Sustainable Biomaterials College of Natural Resources & Environment Virginia Tech Blacksburg, VA 540.231.9759
The Virginia Tech U.S. Forest Service June 2018 Housing Commentary: Section I
 The Virginia Tech U.S. Forest Service June Housing Commentary: Section I Urs Buehlmann Department of Sustainable Biomaterials College of Natural Resources & Environment Virginia Tech Blacksburg, VA 540.231.9759
The Virginia Tech U.S. Forest Service November 2018 Housing Commentary: Section I
 The Virginia Tech U.S. Forest Service November 2018 Housing Commentary: Section I Urs Buehlmann Department of Sustainable Biomaterials College of Natural Resources & Environment Virginia Tech Blacksburg,
The Virginia Tech U.S. Forest Service January 2019 Housing Commentary: Section I
 The Virginia Tech U.S. Forest Service January 2019 Housing Commentary: Section I Urs Buehlmann Department of Sustainable Biomaterials College of Natural Resources & Environment Virginia Tech Blacksburg,
The Virginia Tech U.S. Forest Service October 2018 Housing Commentary: Section I
 The Virginia Tech U.S. Forest Service October 218 Housing Commentary: Section I Urs Buehlmann Department of Sustainable Biomaterials College of Natural Resources & Environment Virginia Tech Blacksburg,
The Virginia Tech U.S. Forest Service September 2017 Housing Commentary: Section I
 The Virginia Tech U.S. Forest Service September 2017 Housing Commentary: Section I Urs Buehlmann Department of Sustainable Biomaterials College of Natural Resources & Environment Virginia Tech Blacksburg,
The Virginia Tech U.S. Forest Service November 2017 Housing Commentary: Section I
 The Virginia Tech U.S. Forest Service November 2017 Housing Commentary: Section I Urs Buehlmann Department of Sustainable Biomaterials College of Natural Resources & Environment Virginia Tech Blacksburg,
The Virginia Tech U.S. Forest Service December 2016 Housing Commentary: Section I
 The Virginia Tech U.S. Forest Service December 2016 Housing Commentary: Section I Urs Buehlmann Department of Sustainable Biomaterials College of Natural Resources & Environment Virginia Tech Blacksburg,
The Virginia Tech U.S. Forest Service November 2015 Housing Commentary: Part A
 The Virginia Tech U.S. Forest Service November Housing Commentary: Part A Urs Buehlmann Department of Sustainable Biomaterials College of Natural Resources & Environment Virginia Tech Blacksburg, VA 54.231.9759
The Virginia Tech U.S. Forest Service March 2017 Housing Commentary: Section I
 The Virginia Tech U.S. Forest Service March 217 Housing Commentary: Section I Urs Buehlmann Department of Sustainable Biomaterials College of Natural Resources & Environment Virginia Tech Blacksburg, VA
The Virginia Tech U.S. Forest Service September 2016 Housing Commentary: Section I
 The Virginia Tech U.S. Forest Service September Housing Commentary: Section I Urs Buehlmann Department of Sustainable Biomaterials College of Natural Resources & Environment Virginia Tech Blacksburg, VA
Real Estate Trends and Outlook
 Real Estate Trends and Outlook Lawrence Yun, Ph.D. Chief Economist NATIONAL ASSOCIATION OF REALTORS Presentation at NAR Region XII Conference Coeur d Alene, ID March 5, 2015 GDP Burst in 2014 Q2, Q3, Q4
ECONOMIC SNAPSHOT. A Summary of the San Diego Regional Economy UNEMPLOYMENT
 A Summary of the San Diego Regional Economy UNEMPLOYMENT San Diego Regional EDC analyzes key economic metrics that are important to understanding the regional economy and San Diego's standing relative
U.S. Economic, Office and Industrial Market Overview and Outlook. July 16, 2014
 2014 U.S. Economic, Office and Industrial Market Overview and Outlook July 16, 2014 U.S. Economic Overview U.S. GDP Growth Persistent Despite 1Q Polar Vortex Annualized Quarterly Percent Change 10% 5%
ECONOMIC SNAPSHOT. A Summary of the San Diego Regional Economy UNEMPLOYMENT
 A Summary of the San Diego Regional Economy Brought to you by San Diego Regional EDC analyzes key economic metrics that are important to understanding the regional economy and San Diego s standing relative
SAN DIEGO S QUARTERLY ECONOMIC SNAPSHOT
 SAN DIEGO S QUARTERLY ECONOMIC SNAPSHOT November 2017 SAN DIEGO HIGHLIGHTS IN THIS ISSUE Every quarter San Diego Regional EDC analyzes key economic indicators that are important to understanding the regional
Taking the Measure of St. Louis
 Taking the Measure of St. Louis The views expressed here are those of the speakers and do not necessarily represent the views of the Federal Reserve Bank of St. Louis or of the Federal Reserve System.
ECONOMIC SNAPSHOT. A Summary of the San Diego Regional Economy UNEMPLOYMENT
 A Summary of the San Diego Regional Economy Brought to you by San Diego Regional EDC analyzes key economic metrics that are important to understanding the regional economy and San Diego s standing relative
Economic & Housing Market Outlook
 Economic & Housing Market Outlook By Lawrence Yun, Ph.D. Chief Economist, National Association of REALTORS Presentations to NAR Annual Conference Boston, MA November 2, 2018 Existing Home Sales Since
ECONOMIC SNAPSHOT. A Summary of the San Diego Regional Economy UNEMPLOYMENT
 A Summary of the San Diego Regional Economy Brought to you by analyzes key economic metrics that are important to understanding the regional economy and San Diego s standing relative to other major metropolitan
SAN DIEGO S QUARTERLY ECONOMIC SNAPSHOT
 SAN DIEGO S QUARTERLY ECONOMIC SNAPSHOT August 2017 highlights in THIS ISSUE Every quarter Regional EDC analyzes key economic indicators that are important to understanding the regional economy and the
Economic and Housing Market Outlook
 Economic and Housing Market Outlook By Lawrence Yun, Ph.D. Chief Economist, National Association of REALTORS Presentations At Raleigh Regional Association of REALTORS At Orange-Chatham Association of REALTORS
Welcome to the 10 th Annual Real Estate Symposium for The Lake of the Ozarks. October 5th, 2017 Osage National Golf Resort
 Welcome to the 10 th Annual Real Estate Symposium for The Lake of the Ozarks October 5th, 2017 Osage National Golf Resort Economic and Real Estate Market Outlook October, 2017 Steve Snook, Senior Business
SAN DIEGO S QUARTERLY ECONOMIC SNAPSHOT
 SAN DIEGO S QUARTERLY ECONOMIC SNAPSHOT December 2018 SAN DIEGO HIGHLIGHTS IN THIS ISSUE Every quarter San Diego Regional EDC analyzes key economic indicators that are important to understanding the regional
SAN DIEGO S QUARTERLY ECONOMIC SNAPSHOT
 SAN DIEGO S QUARTERLY ECONOMIC SNAPSHOT February 2018 SAN DIEGO HIGHLIGHTS IN THIS ISSUE Every quarter San Diego Regional EDC analyzes key economic indicators that are important to understanding the regional
ECONOMIC SNAPSHOT. A Summary of the San Diego Regional Economy UNEMPLOYMENT
 A Summary of the San Diego Regional Economy Brought to you by San Diego Regional EDC analyzes key economic metrics that are important to understanding the regional economy and San Diego s standing relative
economy City of Rohnert Park : Local Economic Report EDB Sonoma County
 EDB Sonoma County Economic Development Board economy 2010-11 City of Rohnert Park : Local Economic Report E c o n o m i c D e v e l o p m e n t B o a r d 4 0 1 C o l l e g e Av e n u e S u i t e D S a
THE ECONOMIC OUTLOOK FOR THE U.S. AND THE CONSTRUCTION INDUSTRY
 THE ECONOMIC OUTLOOK FOR THE U.S. AND THE CONSTRUCTION INDUSTRY by William F. Ford, Ph.D. Weatherford Chair of Finance Middle Tennessee State University presented to The Roofing Industry Alliance for Progress
GEORGE RATIU Director, Quantitative & Commercial Research National Association of REALTORS
 GEORGE RATIU Director, Quantitative & Commercial Research National Association of REALTORS 2015 CCIM Commercial Real Estate Outlook Conference Wednesday, January 21, 2015 Coral Gables, FL Where Are We
Dr. Jeffrey Michael. Executive Director, Center for Business and Policy Research University of the Pacific
 2019 San Joaquin County Economic Outlook Dr. Jeffrey Michael Executive Director, Center for Business and Policy Research University of the Pacific Outline Population Growth and Migration California and
Economic and Real Estate Market Outlook
 Economic and Real Estate Market Outlook By Lawrence Yun, Ph.D. Chief Economist, National Association of REALTORS Presentation at Miami International Congress Miami, FL November 1, 2016 Lifetime Wealth
Housing Market Outlook
 Housing Market Outlook By Lawrence Yun, Ph.D. Chief Economist, National Association of REALTORS Presentation at National Conference of State Legislatures Washington, DC December 7, 2018 Very Long Economic
Be Counted, America! The Challenge Ahead An analysis of mail-in participation in the 2010 Census as door-to-door enumeration begins
 May 3, 2010 Be Counted, America! The Challenge Ahead An analysis of mail-in participation in the 2010 Census as door-to-door enumeration begins On April 28, the U.S. Census Bureau announced that the nation
3Q03 Silicon Wafer Update: Demand Continues Recovery
 Gartner Dataquest Alert 3Q03 Silicon Wafer Update: Demand Continues Recovery The latest silicon forecast indicates that silicon wafer demand will grow 10 percent in 2003 over the previous year. This is
S E C O N D Q U A R T E R
 SECOND QUARTER 2018 U.S. TRENDLINES 5-Year Trend VACANCY Current Quarter ABSORPTION All signs point to continued growth More tenants seeking spaces than 8 consecutive years availabilities - of especially
F O U R T H Q U A R T E R
 FOURTH QUARTER 2018 U.S. TRENDLINES 5-Year Trend Current Quarter UNEMPLOYMENT RATE 3.9% Strongest quarter for job gains in 2018 RETAIL SALES All signs GROWTH point to continued growth More tenants seeking
The 2013 Hilliard Lyons INVESTKentucky Equity Conference
 The 2013 Hilliard Lyons INVESTKentucky Equity Conference Keynote Address William Ford Ph.D. Weatherford Chair of Finance Middle Tennessee State University THE ECONOMIC OUTLOOK FOR THE U.S. & KENTUCKY ECONOMY
Economic & Housing Outlook
 Economic & Housing Outlook By Lawrence Yun, Ph.D. Chief Economist, National Association of REALTORS Presentation at Northern Arizona Association of REALTORS November 30, 2017 Tax Reform Mortgage interest
Economic & Real Estate Outlook. Tax Reform. Michigan 4/26/18
 Economic & Real Estate Outlook By Lawrence Yun, Ph.D. Chief Economist, National Association of REALTORS Presentations at Michigan REALTORS Broker Summit Plymouth, MI April 25, 2018 Tax Reform Mortgage
National Population Estimates: March 2009 quarter
 Image description. Hot Off The Press. End of image description. Embargoed until 10:45am 15 May 2009 National Population Estimates: March 2009 quarter Highlights The estimated resident population of New
Silicon Wafer Demand Forecast Update, 4Q03
 Forecast Analysis Silicon Wafer Demand Forecast Update, 4Q03 Abstract: Silicon wafer demand in 2003 will register an 8 percent increase over 2002. Demand will enter an expansion phase in the second quarter
BUSINESS EMPLOYMENT DYNAMICS
 BUSINESS EMPLOYMENT DYNAMICS First Quarter 2018 Office of Research Kurt Westby, Commissioner Andrew Condon, Director of Research WETHERSFIELD, November 7th, 2018 - (BED) data published quarterly by the
Charles S. Gascon Regional Economist, Senior Coordinator
 Generated: July 2018 Charles S. Gascon Regional Economist, Senior Coordinator Education MBA, Washington University, 2012 M.A. Economics, State University of New York at Albany, 2006 B.S. Managerial Economics,
State of the media: audio today A FOCUS ON BLACK & HISPANIC AUDIENCES
 State of the media: audio today A FOCUS ON BLACK & HISPANIC AUDIENCES JUly 2015 Copyright 2015 The Nielsen Company 1 AUDIO S REACH CONTINUES TO GROW NATIONAL RADIO AUDIENCES AGAIN AT ALL-TIME HIGHS Audio
Folly Rd. - Former Roller Rink Retail / Warehouse / Land Lease / BTS
 Folly Rd. - Former Roller Rink Retail / Warehouse / Land Lease / BTS 1523 Folly Rd. Charleston, SC 29412 Sq Ft: 16,000 Price: $5.99 PSF (Annual) NNN Lease TRAFFIC COUNT: 24,100 VPD DEMOGRAPHICS 1 Mile
SEMICONDUCTOR INDUSTRY ASSOCIATION FACTBOOK
 Factbook 2014 SEMICONDUCTOR INDUSTRY ASSOCIATION FACTBOOK INTRODUCTION The data included in the 2014 SIA Factbook helps demonstrate the strength and promise of the U.S. semiconductor industry and why it
THE U.S. SEMICONDUCTOR INDUSTRY:
 THE U.S. SEMICONDUCTOR INDUSTRY: KEY CONTRIBUTOR TO U.S. ECONOMIC GROWTH Matti Parpala 1 August 2014 The U.S. Semiconductor Industry: Key Contributor To U.S. Economic Growth August 2014 1 INTRO The U.S.
Silicon Wafer Demand Outlook: Forecast Update, 2Q03
 Research Brief Silicon Wafer Demand Outlook: Forecast Update, 2Q03 Abstract: The latest silicon wafer demand outlook predicts about 6 percent growth in 2003, nearly the same as the previous forecast. However,
Real Estate Markets in a Tentative Economic Landscape
 Real Estate Markets in a Tentative Economic Landscape GEORGE RATIU Director, Quantitative & Commercial Research National Association of REALTORS Bay Area Real Estate Council Annual Economic Outlook Tampa,
Silicon Valley Venture Capital Survey Second Quarter 2018
 fenwick & west Silicon Valley Venture Capital Survey Second Quarter 2018 Full Analysis Silicon Valley Venture Capital Survey Second Quarter 2018 fenwick & west Full Analysis Cynthia Clarfield Hess, Mark
2012 ACCE Industry Advisory Board Best Practices Positioning Your Firm After the Great Recession
 2012 ACCE Industry Advisory Board Best Practices Positioning Your Firm After the Great Recession 2012 FMI Corporation 0 The Great Recession 2012 FMI Corporation 1 FMI Corporation 2010 1 Market Truths You
1Q04 Update: Silicon Demand Will Move to a Full Recovery
 Gartner Dataquest Alert 1Q04 Update: Silicon Demand Will Move to a Full Recovery Our latest silicon demand forecast indicates that wafer demand in 2003 will increase 9 percent over 2002. While the forecast
The State of the Erie Economy
 The State of the Erie Economy Presentation to Presque Isle CPCU Society Chapter September 14, 2017 Kenneth Louie The Economic Research Institute of Erie Sam and Irene Black School of Business Penn State
State of Venture Capital in the Southeast Q Executive Summary Pacing vs. 2016*
 Executive Summary Venture capital in the U.S. continues to flow at historically high levels, largely driven by later stage deals, with total invested capital on pace through August for an all-time record
NATIONAL INSTITUTE OF ECONOMIC AND SOCIAL RESEARCH ESTIMATES OF MONTHLY GDP. Embargo until hours on 11 th January 2013
 NATIONAL INSTITUTE OF ECONOMIC AND SOCIAL RESEARCH ESTIMATES OF MONTHLY GDP Embargo until 15.00 hours on 11 th January 2013 Our monthly estimates of GDP suggest that output declined by 0.3 per cent in
Click to edit Master title style The State of the Venture Capital Industry Click to edit Master text styles
 The State of the Venture Capital Industry Bobby Franklin President Third & level CEO of NVCA Southeast Venture Conference March 16 Overview Click Venture to edit capital Master stats text at-a-glance styles
Portland State of the Market 2016
 RESILIENT & RISING Portland State of the Market 2016 Portland why all the hype? Source: JLL Research Highest GDP Growth Oregon has the fastest real GDP growth in the nation at 3.9% in Q1 2016 Highest Job
How U.S. Employment Is Changing
 December 1, 211 How U.S. Employment Is Changing Stephen P. A. Brown and Hui Liu During the most recent recession, U.S. employment fell by 7,49 million jobs (5.4 percent). During the first 8 months of the
Washington, D.C. Metro Area November 2018 Housing Market Update
 Washington, D.C. Metro Area November 2018 Housing Market Update Washington D.C. Metro prices of $449,900 at record November level; sales continue to cool; for the first time since early 2016, inventories
Venture Capital Research Report Q4 2017
 Venture Capital Research Report Q4 2017 As of February 9, 2018 Executive Summary VC market in the US Regional share of investment VC market in the SF Bay Area Annual VC investment in the SF Bay Area VC
XT: Explore Technology LAUNCHING STUDENTS INTO TECHNOLOGY-BASED MAJORS AT VIRGINIA TECH
 XT: Explore Technology LAUNCHING STUDENTS INTO TECHNOLOGY-BASED MAJORS AT VIRGINIA TECH The XT factor: what drives you? THIS MAY NOT BE THE EASIEST QUESTION TO ANSWER. THERE CAN BE SEVERAL THINGS THAT
Characteristics of Competitive Places: Changing Models of Economic Dynamism
 Characteristics of Competitive Places: Changing Models of Economic Dynamism IEDC/IASP 2009 Conference Technology-Led Economic Development World Science and Technology Park Research Triangle Park, NC June
State of the U.S. Retail Market
 State of the U.S. Retail Market 2015 Q1 Review and Forecast Copyright 2015 CoStar Realty Information, Inc. No reproduction or distribution without permission. The following information includes projections
COLUMBUS 2020 A REGIONAL GROWTH STRATEGY FOR CENTRAL OHIO
 COLUMBUS 2020 A REGIONAL GROWTH STRATEGY FOR CENTRAL OHIO Vision To achieve the strongest decade of growth in the Columbus Region s history Mission To strengthen the economic base of the 11-county Columbus
Dropbox, Inc. signed a 736,000 SF lease in San Francisco s Mission Bay making it the single largest lease in the city s history.
 FOURTH QUARTER 2017 U.S. TRENDLINES 5-Year Trend Current Quarter VACANCY ABSORPTION 11.5% Lowest in 10 years 13.4 MSF All signs point to continued growth 31 quarters of More tenants positive seeking growth
Intentionality: Competing in the 21 st Century
 Intentionality: Competing in the 21 st Century America s First Road Trip Horatio Nelson Jackson, Sewall K. Crocker & Bud 1-2 December 2009 Source: www.pbs.org Six Converging Forces Globalization Environmental
2014 PRODUCTION FORECASTS FOR THE GLOBAL ELECTRONICS AND INFORMATION TECHNOLOGY INDUSTRIES
 PRODUCTION FORECASTS FOR THE GLOBAL ELECTRONICS AND INFORMATION TECHNOLOGY INDUSTRIES December 24, JAPAN ELECTRONICS AND INFORMATION TECHNOLOGY INDUSTRIES ASSOCIATION FOREWORD For the Japanese economy,
Building on Innovation
 Building on Innovation America s First Road Trip Horatio Nelson Jackson, Sewall K. Crocker & Bud 1-2 December 2009 Source: www.pbs.org Sweeping Away the Old Rules Globalization Technology Demographics
NEWS RELEASE FOR WIRE TRANSMISSION: 8:30 A.M. EDT, FRIDAY, APRIL 17, William Zeile: (202) BEA 09-14
 BEA 09-14") NEWS RELEASE FOR WIRE TRANSMISSION: 8:30 A.M. EDT, FRIDAY, APRIL 17, 2009 William Zeile: (202) 606-9893 BEA 09-14 Summary Estimates for Multinational Companies: Employment, Sales, and Capital Expenditures
NEWS RELEASE FOR WIRE TRANSMISSION: 8:30 A.M. EDT, FRIDAY, APRIL 17, 2009 William Zeile: (202) 606-9893 BEA 09-14 Summary Estimates for Multinational Companies: Employment, Sales, and Capital Expenditures
Table 5 Population changes in Enfield, CT from 1950 to Population Estimate Total
 This chapter provides an analysis of current and projected populations within the Town of Enfield, Connecticut. A review of current population trends is invaluable to understanding how the community is
2018 U.S. Ceramic Tile Market Update
 FOR IMMEDIATE RELEASE: Contact: Andrew Whitmire April 8, 2019 T: 864-646-8453 ext. 102 2018 U.S. Ceramic Tile Market Update U.S. Tile Consumption Overview: Total U.S. ceramic tile consumption for 2018
Canadian Consumer Confidence Index A TNS News Release April 18, 2013
 Canadian Consumer Confidence Index A TNS News Release April 18, 2013 Canadian Consumer Confidence Sinks Again Amid Continued Uncertainty over Housing, Jobs News Release Consumer Confidence Indices Overview
Florida Venture Factbook
 S E AT T L E SAN FRANCISCO NEW YORK LONDON Florida Venture Factbook 2019 pitchbook.com US + 1 206.623.1986 UK + 44 (0)207.190.9809 demo@pitchbook.com PG 1 Dear Attendee, On behalf of the Florida Venture
SFSA CASTEEL REPORTER a monthly publication Steel Founders' Society of America
 SFSA CASTEEL REPORTER a monthly publication Steel Founders' Society of America serving SFSA steel casting industry Members 780 McArdle Drive Unit G, Crystal Lake IL 60014 815-455-8240 Fax: 815-455-8241
Moving Ahead. Third-quarter Technology venture capital investment increased 33 percent yearover-year. percent quarter-over-quarter.
 Moving Ahead Third-quarter Technology venture capital investment increased 33 percent yearover-year but decreased 6 percent quarter-over-quarter October 2 PwC US venture capital funding for the Technology
Colliers International Real Estate Trends2018
 Colliers International Real Estate Trends2018 Colliers International Silicon Valley Market Recap San Jose, California - February 13, 2018 - In its 19th consecutive year, last week Colliers International
The Construction Market in Europe: A Supplier s Point of View
 The Construction Market in Europe: A Supplier s Point of View Dr. Walter Nussbaumer Abstract After the 2009 recession and the 2010 stagnation, recovery took place in 2011 when the World Construction Industry
PitchBook. Bet ter Data. Bet ter Decisions. 4Q 2012 Private Equity. Company Inventory. Report. Sponsored by:
 4Q 2012 Private Equity Company Inventory Report Sponsored by: www.newstarfin.com Introduction In the last few quarters, an overwhelming number of the inquiries coming in to the Research Team have centered
THE PENINSULA ECONOMY
 Economic Update THE PENINSULA ECONOMY June 2016 SILICON VALLEY INSTITUTE for REGIONAL STUDIES Prepared by Stephen Levy This publication is one in a series of periodic updates on the local economy published
National Population Estimates: June 2011 quarter
 National Population Estimates: June 2011 quarter Embargoed until 10:45am 12 August 2011 Highlights The estimated resident population of New Zealand was 4.41 million at 30 June 2011. Population growth was
The Economic Census and Its Role in Economic Statistics
 The Economic Census and Its Role in Economic Statistics Andrew Reamer George Washington Institute of Public Policy George Washington University 2012 Economic Census Conference U.S. Census Bureau October
III. THE REGIONAL FRAMEWORK
 THE SAN DIEGO REGIONAL ECONOMY III. THE REGIONAL FRAMEWORK The San Diego region, comprised solely of San Diego County, is one of California s most dynamic regions. The efforts of the University within
Metros at the Vanguard of Exports and Trade: Delivering the Next U.S. Economy
 Metros at the Vanguard of Exports and Trade: Delivering the Next U.S. Economy @BrookingsMetro @Amy_Liuw Metropolitan Policy Program at BROOKINGS NASBITE International Conference Memphis, TN! April 3, 2014
Industrial Conference 2013 Thursday, November 14, 2013
 Goldman Sachs Industrial Conference 2013 Thursday, November 14, 2013 SINGLE SOURCE INTERMODAL DEDICATED FINAL MILE TRUCKLOAD LESS THAN TRUCKLOAD REFRIGERATED FLATBED EXPEDITED Disclosure This presentation
Dr. Greg Hallman Director, Real Estate Finance and Investment Center (REFIC) McCombs School of Business University of Texas at Austin
 McCombs School of Business University of Texas at Austin") Dr. Greg Hallman Director, Real Estate Finance and Investment Center (REFIC) McCombs School of Business University of Texas at Austin POWERPOINT PARTNER } The US Economy today, with a close look at jobs
Dr. Greg Hallman Director, Real Estate Finance and Investment Center (REFIC) McCombs School of Business University of Texas at Austin POWERPOINT PARTNER } The US Economy today, with a close look at jobs
USG CORPORATION + U.S. CHAMBER OF COMMERCE. Q4 Commercial. Construction Index. powered by
 D Q4 Commercial USG CORPORATION + U.S. CHAMBER OF COMMERCE 2018 Construction Index powered by THE USG CORPORATION + U.S. CHAMBER OF COMMERCE COMMERCIAL CONSTRUCTION INDEX Throughout 2018, USG Corporation
BACCARAT: A LONGITUDINAL MICRO-STUDY
 BACCARAT: A LONGITUDINAL MICRO-STUDY FIELD RESULTS FROM ONE ATLANTIC CITY CASINO, JANUARY 2004 TO JUNE 2010 CENTER FOR GAMING RESEARCH, JULY 2010 Baccarat is the most important game in the world s biggest
Panel Discussion: Regional Economic and Transit Ridership Trends
 Finance Committee Information Item III-B September 8, 2016 Panel Discussion: Regional Economic and Transit Ridership Trends Page 32 of 37 Washington Metropolitan Area Transit Authority Board Action/Information
Carroll Co-Invest Fund I, LP Investor Update, Q4 2013
 Carroll Co-Invest Fund I, LP Investor Update, Q4 2013 January 31, 2014 We are pleased to report that the Carroll Co-Invest Fund I concluded the 4th quarter 2013 with continued strong performance across
St. George Mega Trends
 St. George Mega Trends Image Source: http://www.nps.gov/zion/photosmultimedia/index.htm Arthur C. Nelson, Ph.D., FAICP Presidential Professor & Director of Metropolitan Research University of Utah St.
TECH CITIES 2.0 TECH METRICS OVERVIEW THE TECH 25. Click below to explore what makes a city a tech city
 TECH CITIES 2.0 Click below to explore what makes a city a tech city OVERVIEW TECH METRICS THE TECH 25 TECH CITIES 2.0 INTRODUCTION Tech is ubiquitous. It has become a part of our daily life at work and
Freight: A View From the Street
 Equity Research September 2017 Freight: A View From the Street NEARS Conference, Pittsburgh, PA September 26-28, 2017 Jason H. Seidl, Managing Director 646.562.1404 jason.seidl@cowen.com Matt Elkott, Vice
Profile of the British Columbia High Technology Sector: 2013 Edition
 Profile of the British Columbia High Technology Sector: 2013 Edition PREPARED FOR THE MINISTRY OF TECHNOLOGY, INNOVATION AND CITIZENS SERVICES BY BC STATS APRIL 2014 Authors: Dan Schrier, Lillian Hallin
areiusa.com DALLAS-FORT WORTH MARKET REPORT
 areiusa.com DALLAS-FORT WORTH MARKET REPORT Overview The Dallas-Fort Worth real estate market is not slowing down as it flips the calendar to 2019. People are migrating to the area at impressive rates
Industries, United States Agriculture. Forest Products. Laboratory 1. Resource Bulletin FPL-12 December 1983
 United States Department of Wood Used In U.S. Agriculture Forest Service Manufacturing Forest Products Industries, 1977 Laboratory 1 Resource Bulletin FPL-12 December 1983 By DAVID B. McKEEVER, Research
Going back to the definition of Biostatistics. Organizing and Presenting Data. Learning Objectives. Nominal Data 10/10/2016. Tabulation and Graphs
 1/1/1 Organizing and Presenting Data Tabulation and Graphs Introduction to Biostatistics Haleema Masud Going back to the definition of Biostatistics The collection, organization, summarization, analysis,
North American Business Activity Statistics
 Second Quarter 2014 XTeam Partner: Strategic Retail Advisors (Boston, MA) Room & Board: Newbury Street Flagship Store (39,000 SF) WE ARE over 400 professionals in 35 offices throughout North America. We
ECONOMIC ELEMENT. of the PINELLAS COUNTY COMPREHENSIVE PLAN. Prepared By: The Pinellas County Planning Department. as staff to the
 ECONOMIC ELEMENT of the PINELLAS COUNTY COMPREHENSIVE PLAN Prepared By: The Pinellas County Planning Department as staff to the LOCAL PLANNING AGENCY for THE BOARD OF COUNTY COMMISSIONERS OF PINELLAS COUNTY,
(3 pts) 1. Which statements are usually true of a left-skewed distribution? (circle all that are correct)
 1. Which statements are usually true of a left-skewed distribution? (circle all that are correct)") STAT 451 - Practice Exam I Name (print): Section: This is a practice exam - it s a representative sample of problems that may appear on the exam and also substantially longer than the in-class exam. It
STAT 451 - Practice Exam I Name (print): Section: This is a practice exam - it s a representative sample of problems that may appear on the exam and also substantially longer than the in-class exam. It
PLUS REVIEW Q Quarterly Economic Indicators 18 Counties of Northeast Ohio
 PLUS REVIEW Q2 Quarterly Economic Indicators 18 Counties of Northeast Ohio Unemployment in the Cleveland Plus region continues to trend lower than the national average. Manufacturing, which represents