2017 Chairm an Bob Adamson
|
|
|
- Gillian O’Neal’
- 6 years ago
- Views:
Transcription
1

2 2017 Chairm an Bob Adamson
3 21 st Annual Economic Summit Brought to you by: No rt h e rn Virg in ia Asso c ia t io n o f Re a lt o rs In partnership with: George Mason University s: Ce n t e r fo r Re g io n a l An a lysis


4 Moderators Marshall Chapman & Richard Donohoe

5


6 THANK YOU TO OUR SPONSORS


7 PLEASE SILENCE YOUR CELL P HO N ES

8
9
10 QUESTION S & ANSWERS Q&A w ill st a rt a t ~Se ssio n Tw o Step up to one of the audience microphones Please keep your question brief and to the point
11 Dr. Lawrence Yun National Association of Realtors
12 National Economic, Housing Overview & Forecast By Lawrence Yun, Ph.D. Chief Economist, National Association of REALTORS Presentation at Iowa Association of REALTORS September 18, 2017
13 Existing Home Sales 8,000,000 7,000,000 6,000,000 5,000,000 4,000,000 3,000,000 2,000,000 1,000,
14 Existing Home Sales Mostly Rising in Recent Years (Exceptions: when home buyer tax credit ended and taper tantrum ) 6,000,000 5,500,000 5,000,000??? 4,500,000 4,000,000 3,500,000 3,000,
15 Mortgage Rates year Fixed Rate Jan Mar May Jul Sep Nov Jan Mar May Jul Sep Nov Jan Mar May Jul Sep Nov Jan Mar May Jul Sep Nov Jan Mar May Jul Sep Nov Jan Mar May Jul
16 Monetary Policy Fed Funds Rate Series 1
17 Existing Home Sales Rising After Election (% change from one year ago) Dec Jan Feb Mar Apr May Jun Jul
18 New Home Sales Rising After Election Dec Jan Feb Mar Apr May Jun Jul
19 NAR HOME Survey of Consumers % Strongly indicating Good Time to Buy Q Q Q Q Q Q2
20 Stock Market: S&P 500 Index Jan Feb Mar Apr May Jun Jul Aug Sep Oct Nov Dec Jan Feb Mar Apr May Jun Jul
21 Animal Spirit Revival of Consumers? Consumer Confidence Index Jan Feb Mar Apr May Jun Jul Aug Sep Oct Nov Dec Jan Feb Mar Apr May Jun Jul
22 Animal Spirit Revival of Businesses? Small Business Optimism Index Jan- Feb - Mar - Apr - May - Jun - Jul - Aug - Sep- Oct - Nov - Dec - Jan- Feb - Mar - Apr - May - Jun - Jul
23 Months to Sell a Newly Built Home Jan Apr Jul Oct Jan Apr Jul Oct Jan Apr Jul Oct Jan Apr Jul Oct Jan Apr Jul Oct Jan Apr Jul Oct Jan Apr Jul
24 Single-family Housing Starts (Shortage of Lots, Labor, Lending, Lumber) Thousand units Oct Jan Apr Jul Oct Jan Apr Jul Oct Jan Apr Jul Oct Jan Apr Jul Oct Jan Apr Jul Oct Jan Apr Jul Oct Jan Apr Jul Oct Jan Apr Jul Oct Jan Apr Jul
25 U.S. Home Price Index $300,000 $250,000 $200,000 $150,000 $100,000 $50,000 $ Jan Jun Nov Apr Sep Feb Jul Dec May Oct Mar Aug Jan Jun Nov Apr Sep Feb Jul Dec May Oct Mar Aug Jan Jun Nov Apr Sep Feb Jul Dec May Oct Mar Aug Jan Jun Nov Apr Sep Feb Jul
26 12.0 Borrowers Not Defaulting (Serious Delinquency Rate) All Mortgages Veterans Affairs Mortgages FHA Mortgages Q Q Q Q Q Q Q Q Q Q Q Q Q Q Q Q Q Q Q Q Q Q Q Q Q Q Q Q Q Q Q Q Q Q Q Q Q Q Q Q Q Q Q Q Q Q Q Q Q Q2

27 FHA Insurance Premium - High
28 Homeownership Rate Still Near 50-year Lows Q Q Q Q Q Q Q Q Q Q Q Q Q Q Q Q Q Q Q Q Q Q Q Q Q Q Q1
29 Is Owning still American Dream? Will you Buy in Future? Yes on Dream Yes on Future 2016 Q Q4

30 Student Loan Debt Impacted Purchase a home 76% Take a vacation 72% Purchase a car Continue with education 65% 64% Rent solo or change living situation 58% Purchase entertainment 46% Purchase clothes Start a small business Purchase daily necessities 38% 40% 40% Rent or own closer to work or school location 33% Own a pet 21% None of these 5% % 10% 20% 30% 40% 50% 60% 70% 80%
31 Economy?
32 GDP Growth Rates Reagan GHW Bush Clinton GW Bush Obama Trump Q1 Trump Q2
33 150, ,000 In thousands Jobs (8 million lost 16 million gained) 140, , , , , Jan Jul Jan Jul Jan Jul Jan Jul Jan Jul Jan Jul Jan Jul Jan Jul Jan Jul Jan Jul Jan Jul Jan Jul Jan Jul Jan Jul Jan Jul Jan Jul Jan Jul Jan Jul
34 Total Job Openings In thousands Jan Jul Jan Jul Jan Jul Jan Jul Jan Jul Jan Jul Jan Jul Jan Jul Jan Jul Jan Jul Jan Jul Jan Jul Jan Jul Jan Jul Jan Jul Jan Jul Jan
35 In thousands Weekly Initial Unemployment Insurance Filings Jan Jun Nov Apr Sep Feb Jul Dec May Oct Mar Aug Jan Jun Nov Apr Sep Feb Jul Dec May Oct Mar Aug Jan Jun Nov Apr Sep Feb Jul Dec May Oct Mar Aug Jan Jun Nov Apr
36 Economic Forecast Forecast 2018 Forecast GDP Growth 2.6% 1.6% 2.2% 2.4% Job Growth +2.6 million +2.0 million +2.1 million +2.4 million CPI Inflation 0.3% 1.3% 2.3% 2.2%
37 Actual versus projected Households KC Federal Reserve estimate of 6.9 million missing households
38 Young Adults Living with Parents % of those aged 25 to
39 Housing Forecast Forecast 2018 Forecast New Home Sales Existing Home Sales Median Price Growth 500, , , , million 5.4 million 5.6 million 5.8 million + 6.8% +5.1% +5.0% +3.5% 30-year Rate 3.9% 3.6% 4.3% 5.0%


40 Trump Presidency o Flood Insurance Availability? Extended Thank You for Responding o Dodd-Frank? o Fannie/Freddie and Mortgage Availability? o Tax Simplification? and Mortgage Interest Deduction and 1031 exchange? o EPA, land use, development fees?


41 Dr. Terry Clower Director, Center for Regional Analysis George Mason University, School of Public Policy
42 Washington Area Economy: Performance and Outlook Presentation to Northern Virginia Association of Realtors Economic Summit Terry L. Clower, Ph.D. Center for Regional Analysis Schar School of Policy and Government George Mason University Sept 18, 2017
43 110 Annual Job Change - Washington MSA MOTYC Non-Farm Jobs 000 s 000 s 3, ,300 3,200 3,100 3,000 2,900 July 16- July K Source: Bureau of Labor Statistics (Not Seasonally Adjusted), GMU Center for Regional Analysis 2,800 July-17 Total: 3,321 K
44 (000s) Federal Government Washington MSA (000s) July 16- July MOTYC Source: Bureau of Labor Statistics (Not Seasonally Adjusted), GMU Center for Regional Analysis July-17 Total: 368.4K Total Jobs
45 $ Billions Federal Procurement in the Washington MSA (Fiscal Years) 82.4 TOTAL = $1,409.7 Billion Source: US Census, Consolidated Federal Funds Report and USAspending.gov
46 (000s) Professional & Business Services Washington MSA Source: Bureau of Labor Statistics (Not Seasonally Adjusted), GMU Center for Regional Analysis July 16- July K MOTYC Total Jobs July-17 Total: 761.9K
47 (000s) 25 Professional & Business Services Washington MSA Month Over the Year Change Prof., Sci. & Tech. Svcs & Mgt. Admin. & Waste Mgt Jan-10 Jan-11 Jan-12 Jan-13 Jan-14 Jan-15 Jan-16 Jan-17 Source: Bureau of Labor Statistics (Not Seasonally Adjusted), GMU Center for Regional Analysis
48 (Ranked by Size in 2016) Prof. & Bus. Svcs Educ & Health Svcs Federal Govt. State & Local Govt Leisure & Hosp. Retail Trade Other Services Construction Financial Information Transp. & Util. Wlse Trade Manufacturing Job Change by Sector July 2016 July 2017 Washington MSA (000s) Total = 83, Source: Bureau of Labor Statistics (Not Seasonally Adjusted), GMU Center for Regional Analysis
49 Employment Composition by Sector June 2017 Washington MSA Professional & Business Services Education & Health Services Federal Government Leisure & Hospitality State & Local Government Retail Trade Other Services Construction Financial Activites Information Transportation & Utilities Wholesale Trade Manufacturing 2.2% 2.0% 1.9% 1.6% 4.9% 4.8% 6.0% 11.1% 10.5% 10.0% 8.6% 13.5% 22.9% Source: US Bureau of Labor Statistics, Current Employment Statistics 0% 5% 10% 15% 20% 25% 49
50 3.5% 3.0% 15 Largest Job Markets Job Change: July 2016 July 2017 Washington +2.6% 2.5% 2.0% 1.5% 1.0% 0.5% 0.0% Source: Bureau of Labor Statistics (Not Seasonally Adjusted), GMU Center for Regional Analysis Source: Bureau of Labor Statistics (Not Seasonally Adjusted), GMU Center for Regional Analysis
51 Elements of Population Change Washington MSA Population Change 120, ,000 80,000 60,000 40,000 20, ,000-40, % 1.6% 1.5% 1.1% +1.0% +0.9% 22,979 5,525 3,827 37,714 38,895 36,749 40,119 42,240 40,581 49,005 49,178 47,773 48,669 46,424 43,886-26,362-29,417-31,010 Net Domestic Migration Net Int'l Migration Natural Increase Source: US Census Bureau, Population Estimates Program, V2016
52 50 Annual Job Change Northern VA MOTYC Non-Farm Jobs 000 s 000 s 1, ,450 1,400 1,350 1,300 July 16- July K Source: Bureau of Labor Statistics (Not Seasonally Adjusted), GMU Center for Regional Analysis 1,250 July-17 Total: 1,472.4 K
53 (Ranked by Size in 2016) Prof. & Bus. Svcs Educ & Health Svcs State & Local Govt Retail Trade Leisure & Hosp. Federal Govt. Other Services Financial Construction Transp. & Util. Information Wlse Trade Manufacturing Job Change by Sector July 2016 July 2017 Northern Virginia Source: Bureau of Labor Statistics (Not Seasonally Adjusted), GMU Center for Regional Analysis (000s) Total 28,
54 Unemployment Rates in the WMSA By Sub-State Area DC 4.4 U.S. 3.9 SMD 3.9 MSA 3.2 NVA 2 0 Source: Bureau of Labor Statistics (Region - Not Seasonally Adjusted, US Seasonally Adjusted)
55 Housing Market Trends
56 16,000 Existing Home Sales Washington MSA Through Aug ,000 12,000 10, Month Moving Average 8,000 6,000 4,000 8,199 Aug , Source: Metropolitan Regional Information Systems (MRIS), GMU Center for Regional Analysis
57 (000s) (000s) Median House Sales Price Washington MSA $412.6 K Aug 2017 Source: Metropolitan Regional Information Systems (MRIS), GMU Center for Regional Analysis
58 Average Sales Price Percent Change (MOTYC) Washington MSA % Source: Metropolitan Regional Information Systems (MRIS), GMU Center for Regional Analysis Aug = $466K
, GMU Center for Regional Analysis.")
59 Inventories of Existing Homes Month-Over-Year , MSA % Chg Inv Inventory Thousands Aug -4.7% Source: Metropolitan Regional Information Systems (MRIS), GMU Center for Regional Analysis. Total monthly inventory includes listings active at the end of the month plus sales during the month.
60 % Average Home Sales Price Percent Change (MOTYC) Northern Virginia Source: Metropolitan Regional Information Systems (MRIS), GMU Center for Regional Analysis Aug = $486K
61 3,000 Washington MSA Building Permits , 3-Month Moving Avg 2,500 2,000 July 2,384 1,500 1, Source: Census Bureau, GMU Center for Regional Analysis
62 Alexandria Housing Outlook Alexandria Median Housing Price Alexandria Housing Unit Sales $700,000 $600,000 $500,000 $400,000 $300,000 $200,000 $100,000 $- Jan-10 Aug-10 Mar-11 Oct-11 May-12 Dec-12 Jul-13 Feb-14 Sep-14 Apr-15 Nov-15 Jun-16 Jan-17 Aug-17 Mar-18 Alx_Md_Price Alx_Md_fcast Jan-10 Jun-10 Nov-10 Apr-11 Sep-11 Feb-12 Jul-12 Dec-12 May-13 Oct-13 Mar-14 Aug-14 Jan-15 Jun-15 Nov-15 Apr-16 Sep-16 Feb-17 Jul-17 Dec-17 May-18 Alexandria Housing Inventory (month end) Alx_Sales Alx_Sales_fcast Jan-10 Jun-10 Nov-10 Apr-11 Sep-11 Feb-12 Jul-12 Dec-12 May-13 Oct-13 Mar-14 Aug-14 Jan-15 Jun-15 Nov-15 Apr-16 Sep-16 Feb-17 Jul-17 Dec-17 May-18 Modest rise in prices Flattening unit sales Constrained inventory Alx_Inv Alx_INV_fcast
63 Arlington Market Outlook Arlington Median Housing Prices Arlington Housing Sales (units) $700,000 $600,000 $500,000 $400,000 $300,000 $200,000 $100,000 $- Jan-10 Jul-10 Jan-11 Jul-11 Jan-12 Jul-12 Jan-13 Jul-13 Jan-14 Jul-14 Jan-15 Jul-15 Jan-16 Jul-16 Jan-17 Jul-17 Jan-18 Arl_Md_Price Arl_md_sales_fcast Jan-10 Jun-10 Nov-10 Apr-11 Sep-11 Feb-12 Jul-12 Dec-12 May-13 Oct-13 Mar-14 Aug-14 Jan-15 Jun-15 Nov-15 Apr-16 Sep-16 Feb-17 Jul-17 Dec-17 May-18 Arlington Housing Inventory (month end) Arl_Total_Sales Arl_sales_fcast Jan-10 Jun-10 Nov-10 Apr-11 Sep-11 Feb-12 Jul-12 Dec-12 May-13 Oct-13 Mar-14 Aug-14 Jan-15 Jun-15 Nov-15 Apr-16 Sep-16 Feb-17 Jul-17 Dec-17 May-18 Prices stable at slightly lower level Unit sales tracking trends (?) Inventory stabilizing but Arl_Inv Arl_INV_fcast
64 Fairfax County Housing Outlook Fairfax County Median Sales Price Fairfax County Housing Sales (units) $600,000 2,500 $500,000 $400,000 $300,000 $200,000 $100,000 2,000 1,500 1, $- - Jan-10 Jun-10 Nov-10 Apr-11 Sep-11 Feb-12 Jul-12 Dec-12 May-13 Oct-13 Mar-14 Aug-14 Jan-15 Jun-15 Nov-15 Apr-16 Sep-16 Feb-17 Jul-17 Dec-17 May-18 Jan-10 Jun-10 Nov-10 Apr-11 Sep-11 Feb-12 Jul-12 Dec-12 May-13 Oct-13 Mar-14 Aug-14 Jan-15 Jun-15 Nov-15 Apr-16 Sep-16 Feb-17 Jul-17 Dec-17 May-18 Fairfax Median Sales Price FX_Md_fcast FX_Sales FX_Sales_fcast 5,000 4,000 3,000 2,000 1,000 - Jan-10 Jun-10 Nov-10 Apr-11 Fairfax County Housing Inventory (month end) Sep-11 Feb-12 Jul-12 Dec-12 May-13 Oct-13 Mar-14 Aug-14 Jan-15 Jun-15 Nov-15 Apr-16 Sep-16 Feb-17 Jul-17 Dec-17 May-18 Prices following upward trendline Unit sales stable Inventories flat, not falling FX_Inv FX_Inv_fcast
65 Economic Outlook
66 % % Economic Outlook (GRP), Washington Area and Sub-State Areas (Annual % Change) NV MSA SM DC Source: GMU Center for Regional Analysis, Forecast: April 2016
67 Employment Change in the WMSA by Sub-State Area (000s) D.C Sub. MD No. VA REGION Source: BLS, IHS Economics, GMU Center for Regional Analysis (December 2016) NOTE: The regional totals do not include Jefferson, WV. Average Annual Change = 37,300
68
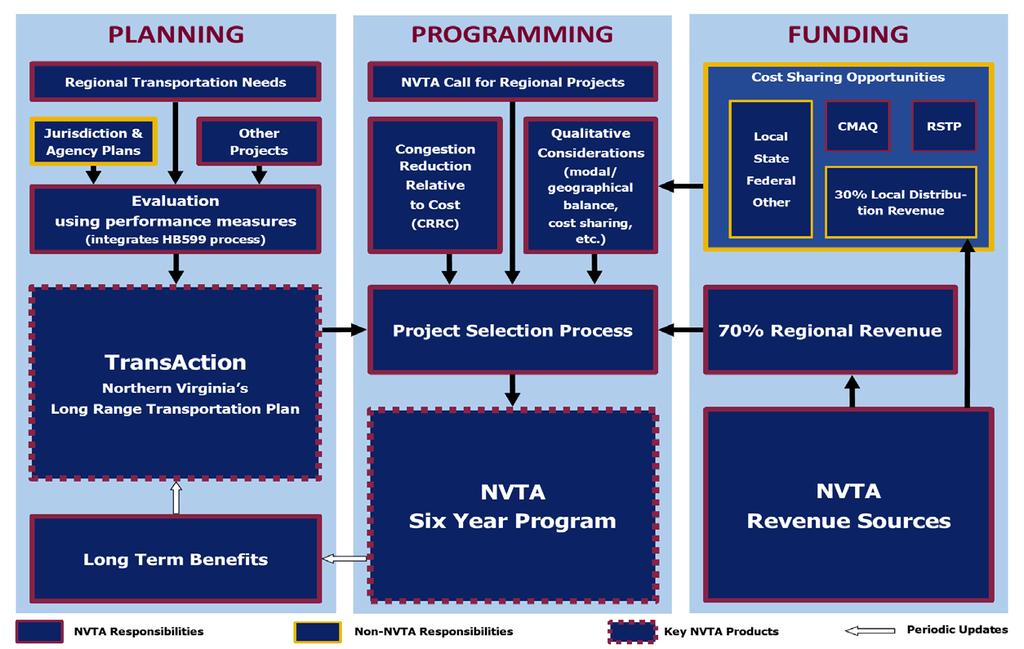
69 Where are we? We are growing: Some diversification Some catch-up Recent job growth across all wage levels Growth will continue in 2017, but at a moderating pace Advantages Government Center International Institutions Connectivity to the World Concentration of Leaders Access to capital High Quality-of-Life Diverse Population Higher Education Educated Work Force Advanced Occupational Specializations Challenges Drain the swamp/sequester Further market shifts needed Cost of living/doing business Mobility Access to capital Regional branding / cooperation Globally competitive? Understanding changing nature of jobs Productivity
70 Thank You Questions cra.gmu.edu
71

72 Dr. Gerald L. Gordon President & CEO, Fairfax County Economic Development Authority

73 Supervisor Martin Nohe Chairman, Northern Virginia Transportation Authority
74 Transportation Today & Tomorrow in the NOVA Region Martin E. Nohe, Chairman September 18,
75 Thank You for Your Efforts Your Voice Matters We have a diverse and complicated regional transportation network of existing and compelling needs. Business community helped bring focus to solutions for regional transportation needs in NOVA. Virginia General Assembly facilitated a new chapter in regional transportation funding through HB 2313 in
76 Diverse Needs Regional Solution The NVTA has worked transparently and diligently to fund regional transportation investments as a result of HB 2313, which has resulted in significant congestion relieving improvements throughout the region! Using HB 2313 revenues, we; Identify and Plan Prioritize and Program Invest Taxpayer Dollars 76 76


77 Our Approach Transparent Collaboration = Stakeholder engagement-inclusive of citizens, member jurisdictions and agencies Planning = Development and Update of the Long-Range Transportation Plan TransAction Prioritizing = Performance Measures to Evaluate & Prioritize Projects Programming = Funding Decisions through the Six Year Program 77 77
78 Long Range Transportation Planning Responsibility The NVTA is legislatively required to prepare a long range transportation plan for Northern Virginia that includes transportation improvements of regional significance. Northern Virginia 2020 Transportation Plan Adopted by TCC July 1999* Total Cost $9.7B TransAction 2030 Adopted July 2007 Total Cost $15.4B TransAction 2040 Adopted November 2012 Total Cost $23.2B costs for capital investments only *developed by the Transportation Coordinating Council 78 78
79 NVTA Funding Programs Adopted Since HB 2313 FY2014 Program Adopted July 2013 Total Investments---$187.0M (includes inaugural bond issuance) FY Program Adopted April 2015 Total Investments---$336.9M FY2017 Program Adopted July 2016 Total Investments---$466.0M Includes $300M I-66/Rt. 28 Interchange (Transform 66) Funding programs developed under TransAction

80 Regional Transportation Investments Funded in Three Years FY Programs 79 Projects $990 Million Total 80 80

81 NVTA HB 2313 Revenues Received and Projected through FYE June 30, 2017 NVTA TOTAL REVENUE RECEIVED BY TAX TYPE $1,235,265,843 Transient Occupancy Tax $109,039,758 Interest $6,227,329 Grantor s Tax $173,580,006 NVTA TOTAL REVENUE RECEIVED $1,235,265,843 30% Local Distribution Revenue $370,579,753 Regional Sales Tax $946,418,750 70% Regional Revenue $864,686,
82 Draft TransAction Plan: Planning for Next Round of Investments First update since the passage of HB 2313 Approximately 358 multi-modal candidate projects across 11 regional corridors/28 corridor segments Continuous Public Engagement MWCOG Round 9.0 forecasts, 2040 planning horizon No singular focus on one project or mode Sensitivity analysis Unconstrained financially---not enough $$ to fund all of the region s transportation needs 82 82
83 83 NVTA Planning/Programming/Funding

84 Jurisdiction Origins and Destinations 2040 Commute Patterns The origins and destinations noted on the right graphically show commuting patterns and provide a sense of volume. Source: MWCOG 2040 Travel Forecasts, Round 9.0 Land Use 84


85 Evaluation of Corridors and Segments Focus on improving travel conditions on 11 multi-modal corridors, divided into 28 corridor segments 85
86 Draft TransAction Plan Total Projects in Draft Plan Draft Plan Cost Estimate including ROW ($B)* 358 $44.1 Project Type Total Projects** Project Cost FY17 ($M) Roadway 239 $19,831 Transit 99 $23,293 Non-motorized 51 $3,543 ITS 1 / ICM 2 15 $1,570 TDM 3 3 $170 * Cost estimates are for entire projects, regardless of potential funding sources ** Projects can be categorized as multiple types 1 ITS: Intelligent Transportation Systems 2 ICM: Integrated Corridor Management 3 TDM: Transportation Demand Management 86
87 Findings: Selected Measures Measures (Weekday) Current Conditions (2016) No Build (2040) Draft Plan (2040) % Change Motorized Trips 8,737,000 10,462,000 10,565, % Auto Trips 7,862,000 9,432,000 9,442, % Transit Trips 876,000 1,030,000 1,122, % Transit Share 10.0% 9.8% 10.6% 8.2% Transit Boardings 1,002,000 1,359,000 1,551, % Miles of Travel 104,839k 125,379k 124,869k -0.4% Hours of Travel 3,298,000 5,811,000 4,446, % Hours of Delay 1,007,000 3,030,000 1,704, % Transit Crowding 10,800 20,100 7, % *24% Population Increase & 37% Employment Increase 87
 No Build (2040) Draft Plan (2040) Draft Plan No Build (2040)")
88 Overall Impact of Draft Plan Draft Plan (2040) compared to No Build (2040) No Build (2040) Draft Plan (2040) Draft Plan No Build (2040) 88
89 Summary of Findings Compared to the No Build (2040), the Draft Plan: Improved travel conditions on all corridors; Modestly increased total trips (1.0%), but with increased transit share (up by 8.2%); Marginally decreased person miles traveled; Noticeably reduced person hours of travel and person hours of delay (by 24% and 44%); Significantly reduced transit crowding (by 64%) to below 2016 levels, in part due to regional BRT/LRT additions; Noticeably improved job accessibility for residents in a broad corridor from Leesburg to Prince William County; Residual problem areas include I-95 and I
90 Alternate Futures Four Alternate Futures tested: Scenario A: Technology makes driving easier Scenario B: Changes in travel behavior Scenario C: Dispersed land use growth Scenario D: Concentrated land use growth Scenarios are plausible alternate futures, but are neither predicted nor preferred ; hybrid scenarios are probable Scenario (sensitivity) analysis provides an understanding of the robustness of TransAction findings and recommendations 90
91 Next Steps Development of the Region s First Six Year Program October 12, Adoption of TransAction October 12, Call for Regional Transportation Projects for FY Six Year Program Spring Public Comment Period for Six Year Program June Adoption of the FY Six Year Program Spring Bi-Annual Update of the Six Year Program 91
92 Next Steps Ongoing Coordination Continued coordination with localities and regional agencies CTB TPB Synchronization of NVTA s Six Year Program with the CTB s Six Year Improvement Program Leverage funding opportunities for regional projects Long Term Benefits Assessment 92
93 Questions and Answers Richard Donohoe Real Estate Finance and Settlement Forum Vice Chair
94
95
Economic & Housing Outlook
 Economic & Housing Outlook By Lawrence Yun, Ph.D. Chief Economist, National Association of REALTORS Presentation at Northern Arizona Association of REALTORS November 30, 2017 Tax Reform Mortgage interest
Economic & Real Estate Outlook. Tax Reform. Michigan 4/26/18
 Economic & Real Estate Outlook By Lawrence Yun, Ph.D. Chief Economist, National Association of REALTORS Presentations at Michigan REALTORS Broker Summit Plymouth, MI April 25, 2018 Tax Reform Mortgage
Economic and Housing Market Outlook
 Economic and Housing Market Outlook By Lawrence Yun, Ph.D. Chief Economist, National Association of REALTORS Presentations At Raleigh Regional Association of REALTORS At Orange-Chatham Association of REALTORS
Real Estate Trends and Outlook
 Real Estate Trends and Outlook Lawrence Yun, Ph.D. Chief Economist NATIONAL ASSOCIATION OF REALTORS Presentation at NAR Region XII Conference Coeur d Alene, ID March 5, 2015 GDP Burst in 2014 Q2, Q3, Q4
Fairfax County: Five Major Forces Shaping Its Economic Evolution
 Fairfax County: Five Major Forces Shaping Its Economic Evolution Stephen S. Fuller, Ph.D. The Dwight Schar Faculty Chair and University Professor Director, The Stephen S. Fuller Institute Schar School
Welcome to the 10 th Annual Real Estate Symposium for The Lake of the Ozarks. October 5th, 2017 Osage National Golf Resort
 Welcome to the 10 th Annual Real Estate Symposium for The Lake of the Ozarks October 5th, 2017 Osage National Golf Resort Economic and Real Estate Market Outlook October, 2017 Steve Snook, Senior Business
Panel Discussion: Regional Economic and Transit Ridership Trends
 Finance Committee Information Item III-B September 8, 2016 Panel Discussion: Regional Economic and Transit Ridership Trends Page 32 of 37 Washington Metropolitan Area Transit Authority Board Action/Information
Economic and Real Estate Market Outlook
 Economic and Real Estate Market Outlook By Lawrence Yun, Ph.D. Chief Economist, National Association of REALTORS Presentation at Miami International Congress Miami, FL November 1, 2016 Lifetime Wealth
Economic & Housing Market Outlook
 Economic & Housing Market Outlook By Lawrence Yun, Ph.D. Chief Economist, National Association of REALTORS Presentations to NAR Annual Conference Boston, MA November 2, 2018 Existing Home Sales Since
Housing Market Outlook
 Housing Market Outlook By Lawrence Yun, Ph.D. Chief Economist, National Association of REALTORS Presentation at National Conference of State Legislatures Washington, DC December 7, 2018 Very Long Economic
GEORGE RATIU Director, Quantitative & Commercial Research National Association of REALTORS
 GEORGE RATIU Director, Quantitative & Commercial Research National Association of REALTORS 2015 CCIM Commercial Real Estate Outlook Conference Wednesday, January 21, 2015 Coral Gables, FL Where Are We
2019 Business Journal. Chris Raad
 2019 Business Journal Chris Raad Tax Reform Mortgage interest deduction?... $750,000 Property tax deduction? SALT at $10,000 Tax Cut for nearly all However, many will not itemize and do standard deduction
The State of the Erie Economy
 The State of the Erie Economy Presentation to Presque Isle CPCU Society Chapter September 14, 2017 Kenneth Louie The Economic Research Institute of Erie Sam and Irene Black School of Business Penn State
Real Estate Markets in a Tentative Economic Landscape
 Real Estate Markets in a Tentative Economic Landscape GEORGE RATIU Director, Quantitative & Commercial Research National Association of REALTORS Bay Area Real Estate Council Annual Economic Outlook Tampa,
Taking the Measure of St. Louis
 Taking the Measure of St. Louis The views expressed here are those of the speakers and do not necessarily represent the views of the Federal Reserve Bank of St. Louis or of the Federal Reserve System.
ECONOMIC SNAPSHOT. A Summary of the San Diego Regional Economy UNEMPLOYMENT
 A Summary of the San Diego Regional Economy UNEMPLOYMENT San Diego Regional EDC analyzes key economic metrics that are important to understanding the regional economy and San Diego's standing relative
areiusa.com DALLAS-FORT WORTH MARKET REPORT
 areiusa.com DALLAS-FORT WORTH MARKET REPORT Overview The Dallas-Fort Worth real estate market is not slowing down as it flips the calendar to 2019. People are migrating to the area at impressive rates
Greater Binghamton, New York
 Presentation: COLLABORATING FOR OUR FUTURE Greater Binghamton, New York www.angeloueconomics.com Angelos G. Angelou July 25, 2006 PROGRAM 1. Greater Binghamton Today 2. Target Industries 3. What it Takes
THE ECONOMIC OUTLOOK FOR THE U.S. AND THE CONSTRUCTION INDUSTRY
 THE ECONOMIC OUTLOOK FOR THE U.S. AND THE CONSTRUCTION INDUSTRY by William F. Ford, Ph.D. Weatherford Chair of Finance Middle Tennessee State University presented to The Roofing Industry Alliance for Progress
Legislative Joint Transportation Committee Meeting. Arkansas Convention Center Texarkana Thursday, November 21, 2013
 Arkansas State Highway and Transportation Department Legislative Joint Transportation Committee Meeting Arkansas Convention Center Texarkana Thursday, November 21, 2013 Recent Voter Approved Programs November
The Economic Census and Its Role in Economic Statistics
 The Economic Census and Its Role in Economic Statistics Andrew Reamer George Washington Institute of Public Policy George Washington University 2012 Economic Census Conference U.S. Census Bureau October
The 2013 Hilliard Lyons INVESTKentucky Equity Conference
 The 2013 Hilliard Lyons INVESTKentucky Equity Conference Keynote Address William Ford Ph.D. Weatherford Chair of Finance Middle Tennessee State University THE ECONOMIC OUTLOOK FOR THE U.S. & KENTUCKY ECONOMY
Active Cable TV Connections. Active Residential Cable Modem Customers. Page FIRST QUARTER REPORT
 21-22 FIRST QUARTER REPORT Active Cable TV Connections AFN Cable connections in the business plan are projected to be 2,44 by July 22. As of October 31, 21, there are 1,895 connections, which means AFN
Vital Signs. Indicators of the Nonprofit Safety Net for Children in the Washington, D.C., Region ERIC C. TWOMBLY AND JENNIFER CLAIRE AUER
 Indicators of the Nonprofit Safety Net for Children in the Washington, D.C., Region ERIC C. TWOMBLY AND JENNIFER CLAIRE AUER THE URBAN INSTITUTE MARCH 2005 Indicators of the Nonprofit Safety Net for Children
SAN DIEGO S QUARTERLY ECONOMIC SNAPSHOT
 SAN DIEGO S QUARTERLY ECONOMIC SNAPSHOT December 2018 SAN DIEGO HIGHLIGHTS IN THIS ISSUE Every quarter San Diego Regional EDC analyzes key economic indicators that are important to understanding the regional
Washington, D.C. Metro Area November 2018 Housing Market Update
 Washington, D.C. Metro Area November 2018 Housing Market Update Washington D.C. Metro prices of $449,900 at record November level; sales continue to cool; for the first time since early 2016, inventories
Dr. Jeffrey Michael. Executive Director, Center for Business and Policy Research University of the Pacific
 2019 San Joaquin County Economic Outlook Dr. Jeffrey Michael Executive Director, Center for Business and Policy Research University of the Pacific Outline Population Growth and Migration California and
THE REGIONAL ECONOMIC BRIEFING FEDERAL RESERVE BANK OF NEW YORK SPEAKERS BIOGRAPHIES AT THE 33 LIBERTY STREET NEW YORK, NY
 THE REGIONAL ECONOMIC BRIEFING AT THE FEDERAL RESERVE BANK OF NEW YORK SPEAKERS BIOGRAPHIES FEDERAL RESERVE BANK OF NEW YORK 33 LIBERTY STREET NEW YORK, NY 10045 WWW.NEWYORKFED.ORG THURSDAY, JULY 22, 2010
Oklahoma Economic Outlook 2014
 Oklahoma Economic Outlook 14 by Dan Rickman Regents Professor of Economics and Oklahoma Gas and Electric Services Chair in Regional Economic Analysis http://economy.okstate.edu/ Quarterly U.S. Real GDP
Contents. Illustrations
 Copyright IDSA 2001 Contents Executive Summary 3 1.0 Introduction 4 2.0 Direct Effects of Consumer Demand for Computer and Video Games 6 2.1 Sectors and Industries Directly Affected and Included 6 Information
ECONOMIC SNAPSHOT. A Summary of the San Diego Regional Economy UNEMPLOYMENT
 A Summary of the San Diego Regional Economy Brought to you by San Diego Regional EDC analyzes key economic metrics that are important to understanding the regional economy and San Diego s standing relative
THIS REPORT CONTAINS ASSESSMENTS OF COMMODITY AND TRADE ISSUES MADE BY USDA STAFF AND NOT NECESSARILY STATEMENTS OF OFFICIAL U.S.
 THIS REPORT CONTAINS ASSESSMENTS OF COMMODITY AND TRADE ISSUES MADE BY USDA STAFF AND NOT NECESSARILY STATEMENTS OF OFFICIAL U.S. GOVERNMENT POLICY Required Report - public distribution Date: GAIN Report
Colliers International Real Estate Trends2018
 Colliers International Real Estate Trends2018 Colliers International Silicon Valley Market Recap San Jose, California - February 13, 2018 - In its 19th consecutive year, last week Colliers International
WRITTEN SUBMISSION OF GE CAPITAL TO THE FINANCIAL CRISIS INQUIRY COMMISSION
 WRITTEN SUBMISSION OF GE CAPITAL TO THE FINANCIAL CRISIS INQUIRY COMMISSION MICHAEL A. NEAL CHAIRMAN AND CEO OF GE CAPITAL AND VICE CHAIRMAN OF GE May 6, 2010 Chairman Angelides, Vice-Chairman Thomas,
For personal use only
 ASX Announcement 18 July 2017 Crowd Mobile Limited (ASX:CM8) Crowd Mobile Achieves Record Fourth Quarter Revenue Supporting Strong Performance Fourth Quarter Financial Highlights Revenue of $11.6 million
SMEs Development: Vietnamese Experience
 SMEs Development: Vietnamese Experience Presenter: Dr. CAN Van Luc at the Conference on APEC s Post 2020 Agenda: Rising Protectionism, Economic Rebalancing and Diversified Growth Session 2: Micro Competitiveness,
State Content Standards for New Mexico
 Episode 101 What Is a Biz Kid? Episode 102 What Is Money? Episode 103 How Do You Get Money? Episode 104 What Can You Do with Money? Episode 105 Money Moves Episode 106 Taking Charge of Your Financial Future
A S TATE OF ACHIE V EMENT. West Virginia s welcoming business climate
 A S TATE OF ACHIE V EMENT West Virginia s welcoming business climate The Development Office was terrific. There was complete transparency, which builds a lot of confidence that you re working with an organization
THE U.S. SEMICONDUCTOR INDUSTRY:
 THE U.S. SEMICONDUCTOR INDUSTRY: KEY CONTRIBUTOR TO U.S. ECONOMIC GROWTH Matti Parpala 1 August 2014 The U.S. Semiconductor Industry: Key Contributor To U.S. Economic Growth August 2014 1 INTRO The U.S.
THE REGIONAL ECONOMIC BRIEFING FEDERAL RESERVE BANK OF NEW YORK SPEAKERS BIOGRAPHIES AT THE 33 LIBERTY STREET NEW YORK, NY
 THE REGIONAL ECONOMIC BRIEFING AT THE FEDERAL RESERVE BANK OF NEW YORK SPEAKERS BIOGRAPHIES FEDERAL RESERVE BANK OF NEW YORK 33 LIBERTY STREET NEW YORK, NY 10045 WWW.NEWYORKFED.ORG MONDAY, FEBRUARY 14,
Promoting Foreign Direct Investment in The United States. Christopher Clement International Investment Specialist Invest in America
 Promoting Foreign Direct Investment in The United States Christopher Clement International Investment Specialist Invest in America FDI in the U.S. Economy 5.2 million $40 billion $55 billion $190 billion
2012 Small Business Leadership Forum hosted by CFO Jeff Atwater and the Jim Moran Institute
 CONTENTS Please click on the presentation you would like to view Small Businesses and Florida s Economy Sean Snaith, PhD David Denslow, PhD Growing Your Small Business Jerry Cartwright Hugh Dailey September
Northern California Megaregion
 Northern California Megaregion Dr. Micah Weinberg President, Bay Area Council Economic Institute Jeff Bellisario Research Manager, Bay Area Council Economic Institute Thursday, November 3, 2016 SPONSORED
2005 First Quarter Presentation
 2005 First Quarter Presentation Safe Harbor This presentation contains statements of a forward-looking nature. These statements are made under the safe harbor provisions of the U.S. Private Securities
SMART DUBAI INSPIRING NEW REALITIES
 SMART DUBAI INSPIRING NEW REALITIES SMART DUBAI 2014-2017 2016 2013 Smart Government Smart Dubai & board formation 2000 E-Gov 2014 Smart Dubai Initiative 2021 Smart Dubai 2021 Smart Dubai is transforming
BUSINESS EMPLOYMENT DYNAMICS
 BUSINESS EMPLOYMENT DYNAMICS First Quarter 2018 Office of Research Kurt Westby, Commissioner Andrew Condon, Director of Research WETHERSFIELD, November 7th, 2018 - (BED) data published quarterly by the
COLUMBUS 2020 A REGIONAL GROWTH STRATEGY FOR CENTRAL OHIO
 COLUMBUS 2020 A REGIONAL GROWTH STRATEGY FOR CENTRAL OHIO Vision To achieve the strongest decade of growth in the Columbus Region s history Mission To strengthen the economic base of the 11-county Columbus
SAN DIEGO S QUARTERLY ECONOMIC SNAPSHOT
 SAN DIEGO S QUARTERLY ECONOMIC SNAPSHOT November 2017 SAN DIEGO HIGHLIGHTS IN THIS ISSUE Every quarter San Diego Regional EDC analyzes key economic indicators that are important to understanding the regional
THE PENINSULA ECONOMY
 Economic Update THE PENINSULA ECONOMY June 2016 SILICON VALLEY INSTITUTE for REGIONAL STUDIES Prepared by Stephen Levy This publication is one in a series of periodic updates on the local economy published
SMEs are a strategic segment for the Group
 SME GLOBAL STRATEGY SMEs are a strategic segment for the Group They are the driving force of the economies where we operate: 24 million SMEs in the markets where we operate. Contribute between 30% (e.g.
SFSA CASTEEL REPORTER a monthly publication Steel Founders' Society of America
 SFSA CASTEEL REPORTER a monthly publication Steel Founders' Society of America serving SFSA steel casting industry Members 780 McArdle Drive Unit G, Crystal Lake IL 60014 815-455-8240 Fax: 815-455-8241
Preparing for an Uncertain Future:
 : for a Greater Baltimore Region DRAFT Maximize2040 is an initiative of the Baltimore Regional Transportation Board, the metropolitan planning organization for the Baltimore region. 1 SCENARIO THINKING:
The Florida Turnaround Story
 The Florida Turnaround Story In 2010, Florida was in a free fall. Florida lost more than 800,000 jobs, the real estate market had collapsed and tourism was on the decline. State debt had grown by about
economy City of Rohnert Park : Local Economic Report EDB Sonoma County
 EDB Sonoma County Economic Development Board economy 2010-11 City of Rohnert Park : Local Economic Report E c o n o m i c D e v e l o p m e n t B o a r d 4 0 1 C o l l e g e Av e n u e S u i t e D S a
2017 Economic Outlook
 2017 Economic Outlook January 25, 2017 What is the economic outlook for 2017? [ 2 ] idk [ 3 ] US Output Modest GDP growth in 2017 2016:Q3 was strong Productivity will be key to higher growth Chance of
State Content Standards for Florida
 Episode 101 What Is a Biz Kid? Episode 102 What Is Money? Episode 103 How Do You Get Money? Episode 104 What Can You Do with Money? Episode 105 Money Moves Episode 106 Taking Charge of Your Financial Future
Investing in Regional Sustainability Norris Lozano, PDC
 Investing in Regional Sustainability Norris Lozano, PDC Regional Leaders Seminar Series Institute of Metropolitan Studies Portland, OR May 10, 2004 1 The Portland Development Commission Housing Infrastructure
The Tri-State Transit Authority
 The Tri-State Transit Authority Finding Creative Pockets for Funding By: Paul Davis, General Manager and CEO 8/11/2016 Tri-State Transit Authority 1 Goals 1. Give SUN attendees history of TTA & overview
SAN DIEGO S QUARTERLY ECONOMIC SNAPSHOT
 SAN DIEGO S QUARTERLY ECONOMIC SNAPSHOT February 2018 SAN DIEGO HIGHLIGHTS IN THIS ISSUE Every quarter San Diego Regional EDC analyzes key economic indicators that are important to understanding the regional
TALENT AS CANADA S COMPARATIVE ADVANTAGE Digital Talent Strategy: Road to 2020 and Beyond Ottawa March 9 th Namir Anani President & CEO
 TALENT AS CANADA S COMPARATIVE ADVANTAGE Digital Talent Strategy: Road to 2020 and Beyond Ottawa March 9 th 2016 Namir Anani President & CEO CONSULTATIONS & ACKNOWLEDGEMENT Canada wide targeted consultations
IR Presentation. March 2014
 IR Presentation March 2014 1 Table of Contents 1. 4Q13 Earnings Summary - Financial Highlights 2. Service & Business Strategy 3. Mobile 4. PC - Developing Quality Contents - Growth Strategy - Expanding
ECONOMIC SNAPSHOT. A Summary of the San Diego Regional Economy UNEMPLOYMENT
 A Summary of the San Diego Regional Economy Brought to you by analyzes key economic metrics that are important to understanding the regional economy and San Diego s standing relative to other major metropolitan
ECONOMIC SNAPSHOT. A Summary of the San Diego Regional Economy UNEMPLOYMENT
 A Summary of the San Diego Regional Economy Brought to you by San Diego Regional EDC analyzes key economic metrics that are important to understanding the regional economy and San Diego s standing relative
Acknowledging Jackson s Challenges for Growth The Significance of People & Place
 Acknowledging Jackson s Challenges for Growth Updated 07/29/15 The Enterprise Group of Jackson, Inc. (EG) is the economic development agency supporting all of Jackson County. The Enterprise Group of Jackson,
BRITISH INSTITUTE OF ENERGY ECONOMICS
 BRITISH INSTITUTE OF ENERGY ECONOMICS ST JOHN S COLLEGE OXFORD 20 SEPTEMBER 2012 Michael Liebreich, Chief Executive Bloomberg New Energy Finance Twitter: @MLiebreich MICHAEL LIEBREICH, OXFORD, SEPT 2012
The Global Financial Crisis and Its Impact on China and East Asia
 The Global Financial Crisis and Its Impact on China and East Asia Lawrence J. Lau, Ph. D. President and Ralph and Claire Landau Professor of Economics The Chinese University of Hong Kong and Kwoh-Ting
III. THE REGIONAL FRAMEWORK
 THE SAN DIEGO REGIONAL ECONOMY III. THE REGIONAL FRAMEWORK The San Diego region, comprised solely of San Diego County, is one of California s most dynamic regions. The efforts of the University within
Dr. Greg Hallman Director, Real Estate Finance and Investment Center (REFIC) McCombs School of Business University of Texas at Austin
 McCombs School of Business University of Texas at Austin") Dr. Greg Hallman Director, Real Estate Finance and Investment Center (REFIC) McCombs School of Business University of Texas at Austin POWERPOINT PARTNER } The US Economy today, with a close look at jobs
Dr. Greg Hallman Director, Real Estate Finance and Investment Center (REFIC) McCombs School of Business University of Texas at Austin POWERPOINT PARTNER } The US Economy today, with a close look at jobs
A STATE OF ACHIE V EMENT. West Virginia s welcoming business climate
 A STATE OF ACHIE V EMENT West Virginia s welcoming business climate The Development Office was terrific. There was complete transparency, which builds a lot of confidence that you re working with an organization
Results for the Three-Month Period Ended June 30, 2013
 Statements made in this document with respect to SQUARE ENIX HOLDINGS CO., LTD. and its consolidated subsidiaries' (together, SQUARE ENIX GROUP") plans, estimates, strategies and beliefs are forward-looking
The Casey Report. E.B. Tucker
 The Casey Report E.B. Tucker How to profit from collapse Everyone knows what s already happened Few people can figure out what happens next Think about incentives What will people do next? These people
3 Economic Development
 3 Economic Development Introduction: The Economic Development Element of the Comprehensive Plan is intended to guide the climate for enterprise and commercial exchange in Buckley and reinforce the overall
EVCA Strategic Priorities
 EVCA Strategic Priorities EVCA Strategic Priorities The following document identifies the strategic priorities for the European Private Equity and Venture Capital Association (EVCA) over the next three
Annual Spring Conference May 19-20, 2016 Dublin, Ireland
 Annual Spring Conference May 19-20, 2016 Dublin, Ireland 1 2009 IACPM Managing SME Portfolios - Balancing Risk and Growth Speakers: Tom Fee, Head of Credit, Bank of Ireland Deirdre Hannigan, Chief Risk
U.S. Small Business Administration Tim Jeffcoat, District Director Houston District Office
 U.S. Small Business Administration Tim Jeffcoat, District Director Houston District Office AGENDA Who Are We and What Do We Do and How Do We Do It and Who Does It and Why You Should Care Warning! Warning!
The Critical Path. Positioning Maryland as an Innovation Leader in the Global Construction Industry
 Positioning Maryland as an Innovation Leader in the Global Construction Industry For Downloads: 1.Executive Summary 2.Full Report Scan this QR code. To Join the MCCEI Mailing List: Send your email address
THE TOP 100 CITIES PRIMED FOR SMART CITY INNOVATION
 THE TOP 100 CITIES PRIMED FOR SMART CITY INNOVATION Identifying U.S. Urban Mobility Leaders for Innovation Opportunities 6 March 2017 Prepared by The Top 100 Cities Primed for Smart City Innovation 1.
Technology and Competitiveness in Vietnam
 Technology and Competitiveness in Vietnam General Statistics Office, Hanoi, Vietnam July 3 rd, 2014 Prof. Carol Newman, Trinity College Dublin Prof. Finn Tarp, University of Copenhagen and UNU-WIDER 1
Economic History of the US
 Economic History of the US Revolution to Civil War,1776-1860 Lecture #5 Peter Allen Econ 120 Financial Issues, 1776-1860 Revolutionary War, 1775-81 Articles of Confederation, 1781-89 Practical aim, victory
The future of work. Nav Singh Managing Partner, Boston McKinsey & Company
 The future of work Nav Singh Managing Partner, Boston Since the Industrial Revolution, innovation has fueled economic growth Estimated global GDP per capita, $ 100,000 1st Industrial Revolution 2 nd Industrial
An Overview of the American Community Survey
 An Overview of the American Community Survey Scott Boggess U.S. Census Bureau 2009 National Conference for Adult Education State Directors Washington, DC March 17, 2009 1 Overview What is the American
India s Imported Fruit Market The Washington Apple Story
 India s Imported Fruit Market The Washington Apple Story Citrus Australia Market Outlook Forum 2018 Sydney, NSW. March 14, 2018 India s Imported Fruit Market The Washington Apple Story India: At A Glance
Pier 1 imports. absolute nnn lease west virgina. For more info on this opportunity please contact: 150 Mall Road, Barboursville, WV Bob Sanner
 Pier 1 imports absolute nnn lease west virgina For more info on this opportunity please contact: John Andreini jandreini@capitalpacific.com (415) 274-2715 CA BRE# 01440360 Rick Sanner rsanner@capitalpacific.com
SEPTEMBER 2017 STATE OF THE MEDIA: AUDIO TODAY 2017 A FOCUS ON BLACK & HISPANIC AUDIENCES
 SEPTEMBER 2017 STATE OF THE MEDIA: AUDIO TODAY 2017 A FOCUS ON BLACK & HISPANIC AUDIENCES Copyright 2017 The Nielsen Company THE NATIONAL RADIO AUDIENCE CONTINUES TO DIVERSIFY BLACK AND HISPANIC CONSUMERS
ECONOMIC SNAPSHOT. A Summary of the San Diego Regional Economy UNEMPLOYMENT
 A Summary of the San Diego Regional Economy Brought to you by San Diego Regional EDC analyzes key economic metrics that are important to understanding the regional economy and San Diego s standing relative
TESTIMONY OF SCOTT HAUGE, FIRST VICE CHAIR NATIONAL SMALL BUSINESS ASSOCIATION
 TESTIMONY OF SCOTT HAUGE, FIRST VICE CHAIR NATIONAL SMALL BUSINESS ASSOCIATION The Job Creation Through Entrepreneurship Act of 2009 Before the U.S. House Committee on Small Business May 6, 2009 Chairwoman
ECONOMIC ELEMENT. of the PINELLAS COUNTY COMPREHENSIVE PLAN. Prepared By: The Pinellas County Planning Department. as staff to the
 ECONOMIC ELEMENT of the PINELLAS COUNTY COMPREHENSIVE PLAN Prepared By: The Pinellas County Planning Department as staff to the LOCAL PLANNING AGENCY for THE BOARD OF COUNTY COMMISSIONERS OF PINELLAS COUNTY,
Capcom Co., Ltd. (Tokyo Stock Exchange, First Section, 9697) Financial Highlights for the Fiscal Year ended March 31, 2018
 Financial Highlights for the Fiscal Year ended March 31, 2018") Capcom Co., Ltd. (Tokyo Stock Exchange, First Section, 9697) Financial Highlights for the Fiscal Year ended March 31, 2018 0 0 Forward-looking Statements Strategies, plans, outlooks and other statements
Capcom Co., Ltd. (Tokyo Stock Exchange, First Section, 9697) Financial Highlights for the Fiscal Year ended March 31, 2018 0 0 Forward-looking Statements Strategies, plans, outlooks and other statements
Charles S. Gascon Regional Economist, Senior Coordinator
 Generated: July 2018 Charles S. Gascon Regional Economist, Senior Coordinator Education MBA, Washington University, 2012 M.A. Economics, State University of New York at Albany, 2006 B.S. Managerial Economics,
Adopted March 17, 2009 (Ordinance 09-15)
") ECONOMIC ELEMENT of the PINELLAS COUNTY COMPREHENSIVE PLAN Prepared By: The Pinellas County Planning Department as staff to the LOCAL PLANNING AGENCY for THE BOARD OF COUNTY COMMISSIONERS OF PINELLAS COUNTY,
ECONOMIC ELEMENT of the PINELLAS COUNTY COMPREHENSIVE PLAN Prepared By: The Pinellas County Planning Department as staff to the LOCAL PLANNING AGENCY for THE BOARD OF COUNTY COMMISSIONERS OF PINELLAS COUNTY,
The State of Innovation. Orlando Saez
 The State of Innovation Orlando Saez Separating fact from myth Myth Illinois is hostile to businesses. Fact Illinois is a good place to do business, and it s getting better everyday. Illinois Economy Highlights
Characteristics of Competitive Places: Changing Models of Economic Dynamism
 Characteristics of Competitive Places: Changing Models of Economic Dynamism IEDC/IASP 2009 Conference Technology-Led Economic Development World Science and Technology Park Research Triangle Park, NC June
Guidelines to Promote National Integrated Circuit Industry Development : Unofficial Translation
 Guidelines to Promote National Integrated Circuit Industry Development : Unofficial Translation Ministry of Industry and Information Technology National Development and Reform Commission Ministry of Finance
2012 ACCE Industry Advisory Board Best Practices Positioning Your Firm After the Great Recession
 2012 ACCE Industry Advisory Board Best Practices Positioning Your Firm After the Great Recession 2012 FMI Corporation 0 The Great Recession 2012 FMI Corporation 1 FMI Corporation 2010 1 Market Truths You
Saying. I Do to a. Franchise
 Saying I Do to a Franchise 1 Saying I Do To A Franchise Like marriage, buying a franchise is a long-term commitment. Before you say yes, make sure you understand what it takes to be successful. The Commitment
3 BANKNOTES AND COINS 3.1 THE CIRCULATION OF EURO BANKNOTES AND COINS AND THE HANDLING OF CURRENCY
 3 BANKNOTES AND COINS 3.1 THE CIRCULATION OF EURO BANKNOTES AND COINS AND THE HANDLING OF CURRENCY DEMAND FOR EURO BANKNOTES AND COINS The substantial increase in euro banknotes in circulation which was
FORESIGHT METHOD HORIZONS. Module. Introduction to Foresight for Canada Beyond 150
 HORIZONS FORESIGHT METHOD for Canada Beyond 50 OVERVIEW Where are we in the process? What is Horizons approach to foresight? How do the foresight tools fit together for Canada Beyond 50? 2 A NEW MODEL
TRACY SEWARD CPA DECEMBER 2015 PAGE 1
 TRACY SEWARD CPA Tracy Seward has over 20 years of financial accounting experience obtained through a diverse range of industry and senior management experience. He is a team leader devoted to creating
Economic Trends Affecting Hospitality Sellers in Today s Turbulent Marketplace
 Economic Trends Affecting Hospitality Sellers in Today s Turbulent Marketplace webinar will be begin shortly. If you need technical assistance with the webcast, contact us at hsmai@commpartners.com and
Labour supply/demand dynamics of Canada s ICT sector and beyond. David
 Labour supply/demand dynamics of Canada s ICT sector and beyond David Ticoll dticoll@gmail.com @dticoll Quality technical grads, but shortages Insufficient business skills & seasoning ICT skills context