Diversion Analysis. Appendix K
|
|
|
- Ashley Richards
- 5 years ago
- Views:
Transcription
1 Appendix K Appendix K
2 Appendix K Project Description The Project includes the potential closure of the eastbound direction ramp for vehicular traffic at Washington Street and University Avenue. In addition, the concept proposes to restrict vehicular traffic on the westbound direction at University Avenue and Front Street. The purpose of these changes to vehicular circulation (diversion) is to achieve the traffic volumes necessary to create a low stress street to accommodate a Bicycle Boulevard bikeway design along the section of University Avenue between Ibis Street and Front Street. This preliminary capacity analysis has been prepared to evaluate the potential effect in vehicular capacity along Washington Street as a result of traffic diversion from this section of University Avenue. This analysis used available turn movement data from multiple sources and newly commissioned intersection counts. The study area is shown in Figure 1. The locations analyzed are listed below. Intersections 1. Washington Ave and Goldfinch St 2. Washington Ave and Front St 3. Washington Ave and First Ave 4. Washington Ave and Fourth Ave 5. Washington Ave and Fifth Ave 6. Washington Ave and Eight Ave/SR 163 Off-Ramp 7. Washington Ave and Richmond St/ SR 163 On-Ramp 8. Washington Ave and Lincoln Ave 9. University Ave and Hawk St 10. University Ave and Goldfinch St 11. University Ave and Front Ave 12. University Ave and First Ave 13. University Ave and Fourth Ave 14. University Ave and Fifth Ave 15. University Ave and Sixth Ave 16. University Ave and Seventh Ave 17. University Ave and Eighth Ave 18. University Ave and Ninth Ave 19. University Ave and Tenth Ave 20. University Ave and Vermont St 21. University Ave and Richmond St 22. University Ave and Normal St 23. University Ave and Park Blvd 24. Normal St and Park Blvd 25. Robinson Ave and Park Blvd Study Scenarios The following scenarios were analyzed: Year 2035 without Project Year 2035 with Project The purpose of this preliminary capacity analysis is to identify any potential issues that may be associated with the Project once implemented. A complete traffic impact study including existing and future conditions will be conducted during the preliminary engineering phase of the Project. K-1
3 Appendix K Year 2035 Traffic Volumes The implemented traffic growth to the roadway network within the study area is a function of expected land development, economic activity, and changes in demographics. Several methods can be used to estimate this growth. For the purposes of this analysis, Year 2008 and Year 2035 based on the San Diego Association of Governments computerized travel forecast model (Series 12 Select Zone Analysis) were used. Using the existing counts volumes and the growth factor calculated by the interpolation of the two models, future base volumes were developed. Appendix K-A contains the growth calculation worksheets. Intersection Analysis Results Year 2035 peak hour period turning movement traffic volumes for both AM and PM peak hour were analyzed. Figures 2 and 3 show Year 2035 AM and PM peak hour without project traffic conditions for intersections respectively. Appendix K-B contains the traffic analysis methodologies and concepts used in this analysis. The 2035 baseline analysis assumes no roadway network changes. Table 1 summarizes the results of the intersection analysis. As shown on Table 1, all intersections in the study area operate at a level of service (LOS) D or above except for the following intersections: University Ave and 6th Ave LOS E (AM peak hour) Washington St and 8 th Ave/SR 163 Off-Ramp LOS F (PM peak hour) University Ave and Front St LOS F (PM peak hour) University Ave and Sixth Ave LOS E (PM peak hour) Appendix K-C contains the intersection analysis worksheets for the 2035 peak hour without project. K-2
4 Appendix K Figure 1 Study Area K-3
5 Appendix K Figure 2 Year 2035 AM Peak without Project Traffic Conditions K-4
6 Appendix K Figure 3 Year 2035 PM Peak without Project Traffic Conditions K-5
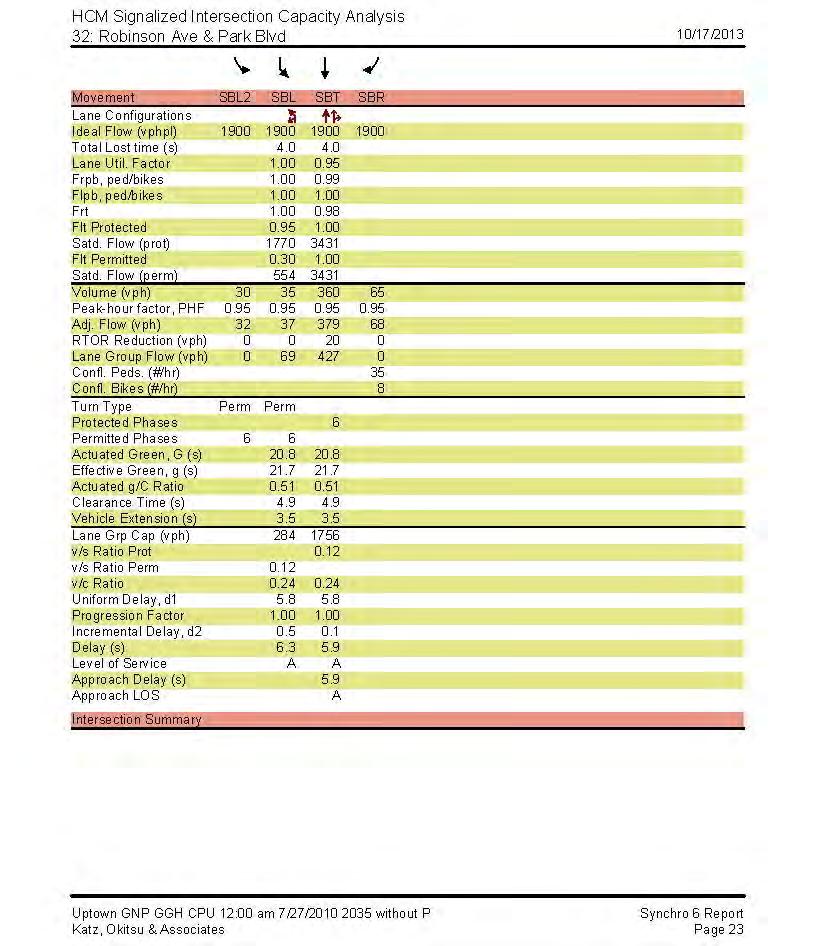
7 Appendix K Table 1 Year 2035 Peak Hour without Project Year 2035 without Project Conditions AM Peak Hour PM Peak Hour Delay LOS Delay LOS 1. Washington Ave & Goldfinch St 35.8 D 35.9 D 2. Washington Ave & Front St 11.5 B 15.9 B 3. Washington Ave & First Ave 26.3 C 33.8 C 4. Washington Ave & Fourth Ave 25.0 C 37.0 D 5. Washington Ave & Fifth Ave 13.7 B 20.1 C 6. Washington Ave & Eight Ave/SR-163 Off Ramp 42.1 D F 7. Washington Ave & Richmond St/SR-163 On Ramp 19.8 B 15.2 B 8. Washington Ave & Lincoln Ave 51.3 D 48.2 D 9. University Ave & Hawk St 18.6 C 22.9 C 10. University Ave & Goldfinch St 10.9 B 18.0 B 11. University Ave & Front Ave 27.9 D 53.1 F 12. University Ave & First Ave 19.8 C 28.2 C 13. University Ave & Fourth Ave 21.3 C 24.3 C 14. University Ave & Fifth Ave 20.9 C 28.3 C 15. University Ave & Sixth Ave 56.4 E 69.1 E 16. University Ave & Seventh Ave 4.1 A 8.6 A 17. University Ave & Eighth Ave 12.2 C 24.7 C 18. University Ave & Ninth Ave 8.0 B 11.9 B 19. University Ave & Tenth Ave 19.3 C 20.2 C 20. University Ave & Vermont St 12.0 B 17.8 B 21. University Ave & Richmond St 19.5 C 23.3 C 22. University Ave & Normal St 7.2 A 9.7 A 23. University Ave & Park Blvd 23.5 D 41.6 D 24. Normal St & Park Blvd 23.2 C 32.0 C 25. Robinson Ave & Park Blvd 7.1 A 8.6 A K-6
8 Appendix K Year 2035 with Project Conditions Year 2035 with project traffic volumes were developed by reassigning the Year 2035 base volumes discussed previously for both eastbound and westbound traffic from University Avenue onto Washington Street and adjacent streets. Changes were assessed by comparing the Year 2035 without Project conditions against the Year 2035 with the addition of the project traffic. Below is the list of assumptions made for the under Year 2035 with Project conditions (diversion from University Avenue to Washington Street). A 5 percent reduction was applied to diverted trips due to mode conversion from vehicle to bicycle as a result of the Project 50 bicycles on both eastbound and westbound direction on University Avenue During the AM Peak hour 225 trips were diverted in the eastbound direction 390 trips were diverted in the westbound direction During the PM Peak hour 500 trips were diverted in the eastbound direction 550 trips were diverted in the westbound direction A summary of the results is presented below. Intersection Analysis Results The Year 2035 with project peak hour period turning movement traffic volumes for both AM and PM peak hour are summarized in Figures 4 and 5 respectively. Table 2 summarizes the results of the intersection analysis. All intersections in the study area are calculated to operate at LOS D or above except for the following: University Ave and 6th Ave (LOS E ) during both AM peak and PM peak hour Washington St and 8 th Ave/SR 163 Off-Ramp (LOS E) during the AM peak hour and (LOS F) PM peak hour Washington St and Lincoln Ave (LOS E) during the AM peak hour and (LOS E) during the PM peak hour Normal St and Park Blvd (LOS F) during the PM peak hour Appendix K-D includes Year 2035 with project peak hour intersection analysis worksheets. K-7
9 Appendix K Figure 3 Year 2035 AM Peak with Project Traffic Conditions K-8
10 Appendix K Figure 3 Year 2035 PM Peak with Project Traffic Conditions K-9
11 Appendix K Table 2 Year 2035 Peak Hour with Project Intersections Year 2035 without Project Year 2035 with Project Delay Significant Delay LOS Delay LOS AM Peak Hour 1. Washington Ave & Goldfinch St 35.8 D 30.8 C -5.0 No 2. Washington Ave & Front St 11.5 B 8.1 A -3.4 No 3. Washington Ave & First Ave 26.3 C 24.1 C -2.2 No 4. Washington Ave & Fourth Ave 25.0 C 23.7 C -1.3 No 5. Washington Ave & Fifth Ave 13.7 B 24.8 C 11.1 No 6. Washington Ave & Eight Ave/SR-163 Off Ramp 42.1 D 66.1 E 24.0 Yes 7. Washington Ave & Richmond St/SR-163 On Ramp 19.8 B 16.8 B -3.0 No 8. Washington Ave & Lincoln 51.3 D 78.6 E 27.3 Yes 9. University Ave & Hawk St 18.6 C 9.3 A -9.3 No 10. University Ave & Goldfinch St 10.9 B 9.3 A -1.6 No 11. University Ave & Front Ave 27.9 D 11.0 B No 12. University Ave & First Ave 19.8 C 15.8 B -4.0 No 13. University Ave & Fourth Ave 21.3 C 25.3 C 4.0 No 14. University Ave & Fifth Ave * 20.9 C 23.4 C 2.5 No 15. University Ave & Sixth Ave * 56.4 E 68.2 E 11.8 Yes 16. University Ave & Seventh Ave 4.1 A 4.8 A 0.7 No 17. University Ave & Eighth Ave 12.2 C 12.2 B 0.0 No 18. University Ave & Ninth Ave 8.0 B 10.1 B 2.1 No 19. University Ave & Tenth Ave 19.3 C 16.9 B -2.4 No 20. University Ave & Vermont St 12.0 B 13.8 B 1.8 No 21. University Ave & Richmond St 19.5 C 16.5 B -3.0 No 22. University Ave & Normal St 7.2 A 8.9 A 1.7 No 23. University Ave & Park Blvd 23.5 D 23.9 C 0.4 No 24. Normal St & Park Blvd 23.2 C 24.6 C 1.4 No 25. Robinson Ave & Park Blvd 7.1 A 7.1 A 0.0 No PM Peak Hour 1. Washington Ave & Goldfinch St 35.9 D 35.8 D -0.1 No 2. Washington Ave & Front St 15.9 B 13.2 B -2.7 No 3. Washington Ave & First Ave 33.8 C 51.8 D 18.0 No 4. Washington Ave & Fourth Ave 37.0 D 44.3 D 7.3 No 5. Washington Ave & Fifth Ave 20.1 C 26.0 C 5.9 No 6. Washington Ave & Eight Ave/SR-163 Off Ramp F F 25.6 Yes 7. Washington Ave & Richmond St/SR-163 On Ramp 15.2 B 4.9 A No 8. Washington Ave & Lincoln Ave 48.2 D 68.3 E 20.1 Yes 9. University Ave & Hawk St 22.9 C 9.9 A No 10. University Ave & Goldfinch St 18.0 B 9.5 A -8.5 No 11. University Ave & Front Ave 53.1 F 9.9 A No 12. University Ave & First Ave 28.2 C 17.6 B No 13. University Ave & Fourth Ave 24.3 C 27.7 C 3.4 No 14. University Ave & Fifth Ave 28.3 C 32.6 C 4.3 No 15. University Ave & Sixth Ave 69.1 E 70.3 E 1.2 No 16. University Ave & Seventh Ave 8.6 A 12.3 B 3.7 No 17. University Ave & Eighth Ave 24.7 C 23.3 C -1.4 No 18. University Ave & Ninth Ave 11.9 B 16.9 B 5.0 No 19. University Ave & Tenth Ave 20.2 C 21.8 C 1.6 No 20. University Ave & Vermont St 17.8 B 18.0 B 0.2 No 21. University Ave & Richmond St 23.3 C 20.1 C -3.2 No 22. University Ave & Normal St 9.7 A 7.7 A -2.0 No 23. University Ave & Park Blvd 41.6 D 36.2 D -5.4 No 24. Normal St & Park Blvd 32.0 C 86.9 F 54.9 Yes 25. Robinson Ave & Park Blvd 8.6 A 8.6 A 0.0 No K-10
12 Appendix K-A Appendix K-A: Growth Calculation Sheet Roadway Segment University Avenue Park Boulevard Washington Street Table 1 Growth Calculation Sheet Year 2008 Year 2035 Growth west of Goldfinch east of Goldfinch st - 3rd rd - 4th th - 5th th - 6th Adj. Growth Subtotal th - 7th th - 8th th - 9th th - 10th Subtotal th - Vermont Vermont - Richmond Richmond - Normal Normal - Centre Centre - Park Subtotal University - Essex Essex - Robinson Robinson - Pennsylvania Brookes - Myrtle Upas - Morley Field Morley Field - Zoo Subtotal University - Hawk Hawk-Goldfinch Goldfinch-Dove Dove-Albatross Albatross-Front Front-1st st - 3rd rd - 4th th - 5th th - 6th th - 7th th - 8th th - 9th K-11
13 Appendix K-A Roadway Segment University Avenue Goldfinch St Albatross Front 1st 4th 5th 6th 9th Year 2008 Year 2035 Growth 9th-Vermont Vermont - Richmond Adj. Growth Subtotal North of Washington Washington-University South of University Subtotal North of Washington Washington-University Subtotal North of Washington South of Washington Subtotal Year Year Adj. Roadway Segment Growth Growth SR 163 Ramp/8th Vermont North of Washington Washington-University South of University Subtotal North of Washington Washington-University South of University Subtotal Washington-University South of University Subtotal North of Washington Washington-University South of University Subtotal Washington-University Subtotal Off-Ramp Subtotal K-12
14 Appendix K-A Roadway Segment University Avenue Richmond Lincoln Normal El Cajon Robinson Year 2008 Year 2035 Growth North of University Adj. Growth Subtotal South of Washington North of University South of University Subtotal North of Washington South of Washington Subtotal North of University South of Park Subtotal East of Park Subtotal West of Park East of Park Subtotal K-13
15 Appendix K-B Appendix K-B: Traffic Analysis Methodology A brief overview of traffic analysis methodologies and concepts used in this analysis is presented in this section. Street system operating conditions are typically described in terms of level of service. LOS is a report-card scale used to indicate the traffic flow on roadway segments and at intersections. LOS ranges from LOS A (free flow, little congestion) to LOS F (forced flow, extreme congestion). Intersection Capacity The analysis of peak hour intersection performance was conducted using the Synchro analysis software program, which uses methodologies defined in the 2000 Highway Capacity Manual (HCM) to calculate results. LOS for intersections is determined by control delay. Control delay is defined as the total elapsed time from when a vehicle stops at the end of a queue to the time the vehicle departs from the stop line. The total elapsed time includes the time required for the vehicle to travel from the last-inqueue position to the first-in-queue position; including deceleration of vehicles from free-flow speed to the speed of vehicles in the queue The HCM LOS for the range of delay by seconds for unsignalized and signalized intersections is described in Table 1. Table 1 Unsignalized and Signalized Intersection Level of Service (HCM 2000) Level of Service Unsignalized Average Control Delay (seconds/vehicle) Signalized Average Control Delay (seconds/vehicle) A B > > C > > D > > E > > F >50 > 80 Source: Highway Capacity Manual Signalized Intersections The HCM analysis methodology for evaluating signalized intersections is based on the operational analysis procedure. This technique uses 1,900 passenger cars per hour of green per lane as the maximum saturation flow of a single lane at an intersection. This saturation flow rate is adjusted to account for lane width, on-street parking, conflicting pedestrian flow, traffic composition, (e.g., the percentage of vehicles that are trucks), and shared lane movements (e.g., through and right-turn movements from the same lane). Average control delay is calculated by taking a volume-weighted average of all the delays for all vehicles entering the intersection. Level of Service Definitions The concept of LOS is defined as a qualitative measure describing operational conditions within a traffic stream, and the motorists' and/or passengers' perception of operations. A LOS definition generally describes these conditions in terms of such factors as speed, travel time, freedom to maneuver, comfort, convenience, and safety. Levels of service for freeway segments can generally be categorized as shown in the table above. K-14
16 Appendix K-C Appendix K-C: Peak Hour Intersection Analysis Worksheets 2035 Conditions K-15

17 Appendix K-C K-16

18 Appendix K-C K-17

19 Appendix K-C K-18
20 Appendix K-C K-19
21 Appendix K-C K-20

22 Appendix K-C K-21

23 Appendix K-C K-22
24 Appendix K-C K-23

25 Appendix K-C K-24

26 Appendix K-C K-25

27 Appendix K-C K-26

28 Appendix K-C K-27
29 Appendix K-C K-28
30 Appendix K-C K-29
31 Appendix K-C K-30

32 Appendix K-C K-31

33 Appendix K-C K-32
34 Appendix K-C K-33

35 Appendix K-C K-34
36 Appendix K-C K-35

37 Appendix K-C K-36
38 Appendix K-C K-37
39 Appendix K-C K-38

40 Appendix K-C K-39

41 Appendix K-C K-40

42 Appendix K-C K-41

43 Appendix K-C K-42

44 Appendix K-C K-43
45 Appendix K-C K-44

46 Appendix K-C K-45
47 Appendix K-C K-46

48 Appendix K-C K-47

49 Appendix K-C K-48
50 Appendix K-C K-49

51 Appendix K-C K-50
52 Appendix K-C K-51
53 Appendix K-C K-52
54 Appendix K-C K-53

55 Appendix K-C K-54

56 Appendix K-C K-55
57 Appendix K-C K-56

58 Appendix K-C K-57
59 Appendix K-C K-58
60 Appendix K-C K-59

61 Appendix K-C K-60
62 Appendix K-C K-61

63 Appendix K-C K-62
64 Appendix K-C K-63
65 Appendix K-C K-64

66 Appendix K-C K-65

67 Appendix K-C K-66
68 Appendix K-D Appendix K-D: Peak Hour Intersection Analysis Worksheets 2035 with Project Conditions K-67

69 Appendix K-D K-68

70 Appendix K-D K-69

71 Appendix K-D K-70

72 Appendix K-D K-71
73 Appendix K-D K-72

74 Appendix K-D K-73
75 Appendix K-D K-74

76 Appendix K-D K-75
77 Appendix K-D K-76

78 Appendix K-D K-77

79 Appendix K-D K-78

80 Appendix K-D K-79
81 Appendix K-D K-80

82 Appendix K-D K-81

83 Appendix K-D K-82

84 Appendix K-D K-83

85 Appendix K-D K-84

86 Appendix K-D K-85

87 Appendix K-D K-86
88 Appendix K-D K-87

89 Appendix K-D K-88
90 Appendix K-D K-89

91 Appendix K-D K-90
92 Appendix K-D K-91

93 Appendix K-D K-92

94 Appendix K-D K-93

95 Appendix K-D K-94

96 Appendix K-D K-95

97 Appendix K-D K-96
98 Appendix K-D K-97
99 Appendix K-D K-98

100 Appendix K-D K-99

101 Appendix K-D K-100

102 Appendix K-D K-101
103 Appendix K-D K-102
104 Appendix K-D K-103

105 Appendix K-D K-104

106 Appendix K-D K-105
107 Appendix K-D K-106
108 Appendix K-D K-107

109 Appendix K-D K-108

110 Appendix K-D K-109

111 Appendix K-D K-110

112 Appendix K-D K-111
113 Appendix K-D K-112
114 Appendix K-D K-113

115 Appendix K-D K-114
116 Appendix K-D K-115

117 Appendix K-D K-116
118 Appendix K-D K-117

119 Appendix K-D K-118
120
State Road A1A North Bridge over ICWW Bridge
 Final Report State Road A1A North Bridge over ICWW Bridge Draft Design Traffic Technical Memorandum Contract Number: C-9H13 TWO 5 - Financial Project ID 249911-2-22-01 March 2016 Prepared for: Florida
King Mill Lambert DRI# 2035 Henry County, Georgia
 Transportation Analysis King Mill Lambert DRI# 2035 Henry County, Georgia Prepared for: The Alter Group, Ltd. Prepared by: Kimley-Horn and Associates, Inc. Norcross, GA Kimley-Horn and Associates, Inc.
1050 Page Mill Road Office Development
 1050 Page Mill Road Office Development Transportation Impact Analysis Prepared for: 1050 Page Mill Road Property, LLC April 15, 2015 Hexagon Office: 2 N. Second Street, Suite 400 San Jose, CA 95113 Hexagon
Vulcan Materials Company - Sanger/Centerville Project, Fresno County - Traffic Impact Analysis
 3.0 TRAFFIC IMPACTS 3.1 TRIP GENERATION To assess the impacts that the project may have on the surrounding streets, the first step was to determine Project trip generation. Project trip generation is shown
A. INTRODUCTION PRINCIPAL CONCLUSIONS
 Chapter 16: Traffic and Parking A. INTRODUCTION This chapter examines the potential traffic and parking impacts of the proposed development of the Fresh Kills Park project. The analysis of the proposed
Exit 61 I-90 Interchange Modification Justification Study
 Exit 61 I-90 Interchange Modification Justification Study Introduction Exit 61 is a diamond interchange providing the connection between Elk Vale Road and I-90. Figure 1 shows the location of Exit 61.
Application of Dynamic Traffic Assignment (DTA) Model to Evaluate Network Traffic Impact during Bridge Closure - A Case Study in Edmonton, Alberta
 Model to Evaluate Network Traffic Impact during Bridge Closure - A Case Study in Edmonton, Alberta") Application of Dynamic Traffic Assignment (DTA) Model to Evaluate Network Traffic Impact during Bridge Closure - A Case Study in Edmonton, Alberta Peter Xin, P.Eng. Senior Transportation Engineer Policy
Application of Dynamic Traffic Assignment (DTA) Model to Evaluate Network Traffic Impact during Bridge Closure - A Case Study in Edmonton, Alberta Peter Xin, P.Eng. Senior Transportation Engineer Policy
Update on Traffic Results and Findings
 Los Angeles County Metropolitan Transportation Authority Update on Traffic Results and Findings presented to the Corridor Advisory Committee February 16, 2017 Traffic Presentation Topics 2 Traffic Volumes
CONCURRENT OPTIMIZATION OF SIGNAL PROGRESSION AND CROSSOVER SPACING FOR DIVERGING DIAMOND INTERCHANGES
 CONCURRENT OPTIMIZATION OF SIGNAL PROGRESSION AND CROSSOVER SPACING FOR DIVERGING DIAMOND INTERCHANGES Yao Cheng*, Saed Rahwanji, Gang-Len Chang MDOT State Highway Administration University of Maryland,
TCAG Annual Intersection Monitoring Program
 TCAG Annual Intersection Monitoring Program 2015 Intersection Monitoring Report Prepared by: Transportation Modeling Department August, 2015 Work Element 605.01 TABLE OF CONTENTS INTRODUCTION...1 PROJECT
TCAG Annual Intersection Monitoring Program
 TCAG Annual Intersection Monitoring Program 2015 Intersection Monitoring Report Prepared by: Transportation Modeling Department August, 2015 Work Element 605.01 TABLE OF CONTENTS INTRODUCTION...1 PROJECT
Abilene District Traffic Signal Timing and Capacity Analysis
 Abilene District Traffic Signal Timing and Capacity Analysis 2017 IAC Report Task-45 TransTech Lab, TechMRT Hongchao Liu, Ph.D., P.E. Jason (Bo) Pang, Ph.D. Ariel Castillo-Rodriguez, E.I.T. I Table of
Demolition of Ramp C (SN ): Westbound Ontario Street to Eastbound I-90/94) over I-90/94 (JF Kennedy Expressway)
: Westbound Ontario Street to Eastbound I-90/94) over I-90/94 (JF Kennedy Expressway)") I-90/94 (Kennedy Expressway) at Ohio Street Structure Replacement and Rehabilitation Section Number 0303-474HB-R D-91-177-09 Contract 60F63 Cook County, Region One, District One City of Chicago Project
I-90/94 (Kennedy Expressway) at Ohio Street Structure Replacement and Rehabilitation Section Number 0303-474HB-R D-91-177-09 Contract 60F63 Cook County, Region One, District One City of Chicago Project
Frequently Asked Questions
 The Synchro Studio support site is available for users to submit questions regarding any of our software products. Our goal is to respond to questions (Monday - Friday) within a 24-hour period. Most questions
TRAFFIC IMPACT STUDY. PROPOSED AMENDED MASTER PLAN AMENDED - H - ZONE Village of Ridgewood Bergen County, New Jersey
 TRAFFIC IMPACT STUDY PROPOSED AMENDED MASTER PLAN AMENDED - H - ZONE Village of Ridgewood Bergen County, New Jersey Prepared For: The Valley Hospital 223 North Van Dien Avenue Ridgewood, New Jersey 07450
ON USING PERFECT SIGNAL PROGRESSION AS THE BASIS FOR ARTERIAL DESIGN: A NEW PERSPECTIVE
 ON USING PERFECT SIGNAL PROGRESSION AS THE BASIS FOR ARTERIAL DESIGN: A NEW PERSPECTIVE Samuel J. Leckrone, P.E., Corresponding Author Virginia Department of Transportation Commerce Rd., Staunton, VA,
APPENDIX 4.8 Transportation Impact Study
 APPENDIX 4.8 Transportation Impact Study Prepared for: Submitted by:, CA 95 El Dorado Hills Town Center Apartments Transportation Impact Study - Revised Draft June 207 Table of Contents.0 INTRODUCTION.....3
ACEC OC February 22, 2017
 ACEC OC February 22, 2017 I-405 Freeway 1958 I-405 Freeway Today Measure R Highway Projects Study Area Highway Program Project Status Summary (Measure R Funded) # Project Current Phase Estimated Cost of
Real-Time Identification and Tracking of Traffic Queues Based on Average Link Speed
 Paper No. 03-3351 Real-Time Identification and Tracking of Traffic Queues Based on Average Link Speed T. Nixon Chan M.A.Sc. Candidate Department of Civil Engineering, University of Waterloo 200 University
Appendix D. Traffic Noise Analysis Report. I-94 St. Michael to Albertville Minnesota Department of Transportation
 Appendix D Traffic Noise Analysis Report I-94 St. Michael to Albertville Minnesota Department of Transportation Traffic Noise Analysis Report I-94 St. Michael to Albertville Project SP 8680-172 Report
Single Point Urban Interchange (SPUI) with Signals
 with Signals") 1 Single Point Urban Interchange (SPUI) with Signals Allows for concurrent left turns on Wurzbach Parkway and on NW Military Traffic Signal added on NW Military Hwy at Fairfield Bend/ Turnberry Way Large
1 Single Point Urban Interchange (SPUI) with Signals Allows for concurrent left turns on Wurzbach Parkway and on NW Military Traffic Signal added on NW Military Hwy at Fairfield Bend/ Turnberry Way Large
The Shoppes at Forney Crossings
 F M 548 U.S. HWY 80 U.S. HWY 80 F M 688 F M 548 COOL SPRINGS F M 1641 F M 548 TROPHY BUGLE CALL PHESANT WHITE PORCH SPINAKER The Shoppes at Forney Crossings 18' 14'-8" 18' 15'-8 1 2 " 14' 7' 23'-0" 21'-0"
Appendix C HCS 7 ANALYTICAL REPORTS: MITIGATED SIGNALIZED AND NON-SIGNALIZED INTERSECTIONS. Draft
 Appendix C HCS 7 ANALYTICAL REPORTS: MITIGATED SIGNALIZED AND NON-SIGNALIZED INTERSECTIONS HCS7 All-Way Stop Control Report Site Information Analyst M Hays Intersection Mulberry Ave @ Newcomb St Agency/Co.
ENTERPRISE Transportation Pooled Fund Study TPF-5 (231)
") ENTERPRISE Transportation Pooled Fund Study TPF-5 (231) Impacts of Traveler Information on the Overall Network FINAL REPORT Prepared by September 2012 i 1. Report No. ENT-2012-2 2. Government Accession
ENTERPRISE Transportation Pooled Fund Study TPF-5 (231) Impacts of Traveler Information on the Overall Network FINAL REPORT Prepared by September 2012 i 1. Report No. ENT-2012-2 2. Government Accession
EVALUATING AN ADAPTIVE SIGNAL CONTROL SYSTEM IN GRESHAM. James M. Peters, P.E., P.T.O.E., Jay McCoy, P.E., Robert Bertini, Ph.D., P.E.
 EVALUATING AN ADAPTIVE SIGNAL CONTROL SYSTEM IN GRESHAM James M. Peters, P.E., P.T.O.E., Jay McCoy, P.E., Robert Bertini, Ph.D., P.E. ABSTRACT Cities and Counties are faced with increasing traffic congestion
SDSU NEW STUDENT HOUSING PROJECT ENVIRONMENTAL IMPACT REPORT Final EIR Comments and Responses
 FINAL SDSU NEW STUDENT HOUSING PROJECT ENVIRONMENTAL IMPACT REPORT Final EIR Comments and Responses SCH# 2016121025 Prepared for: 5500 Campanile Drive San Diego, California 92182-1624 Contact: Laura Shinn
CLINTON CLOSURE DETOURS
 S W Princen Ave Southbound Hwy off ramp at Shields Ave Ave: Exit Southbound Hwy at Shields, proceed south on Marks Ave Ave Southbound Hwy on ramp at Shields Ave from Ave: Ave Marks Ave north. Proceed north
NCTCOG Regional Travel Model Improvement Experience in Travel Model Development and Data Management. Presented to TMIP VMTSC.
 NCTCOG Regional Travel Model Improvement Experience in 2009 and Data Management Presented to TMIP VMTSC December 7, 2009 Presenters Kathy Yu Senior Modeler Arash Mirzaei Manager Model Group Behruz Paschai
Appendix G. Visual Simulations and Illustrations
 Appendix G Visual Simulations and Illustrations 5TH AVE AV E N View ewshe ed 5 SHORELINE N 185TH ST egment B gment A 26 NE 185th Street Station (A1, A3, A5, A7, A10, A11) 25 24 23 22 21 NE 180TH ST 99
Appendix B: Transportation B-10 Toll Plaza Analysis
 Appendix B: Transportation B-10 Toll Plaza Analysis TRAFFIC-DESIGN STUDIES TZB TOLL PLAZA ANALYSES STUDY ASSUMPTIONS Study Goal: Provide assessment of current design concept for toll plaza operations under
GUIDELINES AND MINIMUM ACCEPTANCE CRITERIA FOR THE PREPARATION AND SUBMISSION OF PARKING MANAGEMENT PLANS (PMP) ARLINGTON COUNTY GOVERNMENT (ACG)
 ARLINGTON COUNTY GOVERNMENT (ACG)") GUIDELINES AND MINIMUM ACCEPTANCE CRITERIA FOR THE PREPARATION AND SUBMISSION OF PARKING MANAGEMENT PLANS (PMP) TO ARLINGTON COUNTY GOVERNMENT (ACG) Effective Date: February 15, 2016 Prepared by: Arlington
GUIDELINES AND MINIMUM ACCEPTANCE CRITERIA FOR THE PREPARATION AND SUBMISSION OF PARKING MANAGEMENT PLANS (PMP) TO ARLINGTON COUNTY GOVERNMENT (ACG) Effective Date: February 15, 2016 Prepared by: Arlington
Agenda. Analysis Tool Selection and Mesoscopic Dynamic Traffic Assignment Models Applications:
 Four Case Studies Agenda Analysis Tool Selection and Mesoscopic Dynamic Traffic Assignment Models Applications: Traffic diversion caused by capacity reduction (Fort Lauderdale, FL) Impacts on traffic due
a) 1/2 b) 3/7 c) 5/8 d) 4/10 e) 5/15 f) 2/4 a) two-fifths b) three-eighths c) one-tenth d) two-thirds a) 6/7 b) 7/10 c) 5/50 d) ½ e) 8/15 f) 3/4
 1/2 b) 3/7 c) 5/8 d) 4/10 e) 5/15 f) 2/4 a) two-fifths b) three-eighths c) one-tenth d) two-thirds a) 6/7 b) 7/10 c) 5/50 d) ½ e) 8/15 f) 3/4") MATH M010 Unit 2, Answers Section 2.1 Page 72 Practice 1 a) 1/2 b) 3/7 c) 5/8 d) 4/10 e) 5/15 f) 2/4 Page 73 Practice 2 a) two-fifths b) three-eighths c) one-tenth d) two-thirds e) four-ninths f) one quarter
MATH M010 Unit 2, Answers Section 2.1 Page 72 Practice 1 a) 1/2 b) 3/7 c) 5/8 d) 4/10 e) 5/15 f) 2/4 Page 73 Practice 2 a) two-fifths b) three-eighths c) one-tenth d) two-thirds e) four-ninths f) one quarter
Metro - Let me know about major weekend traffic impacts
 Highway 100 Construction Traffic Impacts Dates may change due to weather. West 36th St to Hwy 62 Currently April 4-mid Aug 50th St. ramp to NB Hwy 100 will close. The ramp will reopen in mid-august. Upcoming
Proposed Watertown Plan Road Interchange Evaluation Using Full Scale Driving Simulator
 0 0 0 0 Proposed Watertown Plan Road Interchange Evaluation Using Full Scale Driving Simulator Kelvin R. Santiago-Chaparro*, M.S., P.E. Assistant Researcher Traffic Operations and Safety (TOPS) Laboratory
Welcome Public Open House
 Peachland Study Welcome Public Open House Preliminary Review of Alternate & Existing Route Options Peachland Study Open House Purpose & Objectives 1. Present possible options for meeting the current and
Noise Mitigation Study Pilot Program Summary Report Contract No
 Ohio Turnpike Commission Noise Mitigation Study Pilot Program Summary Report Contract No. 71-08-02 Prepared For: Ohio Turnpike Commission 682 Prospect Street Berea, Ohio 44017 Prepared By: November 2009
3-15 TRAFFIC AND TRANSPORTATION
 3-15 TRAFFIC AND TRANSPORTATION Changes Since the Draft EIS/EIR Subsequent to the release of the Draft EIS/EIR in April 2004, the Gold Line Phase II project has undergone several updates: Name Change:
2016 CMP MONITORING AND CONFORMANCE REPORT
 2016 CMP MONITORING AND CONFORMANCE REPORT TABLE OF CONTENTS EXECUTIVE SUMMARY 5 1 INTRODUCTION 8 2 LAND USE 10 3 CMP INTERSECTIONS 19 4 FREEWAYS 40 5 RURAL HIGHWAYS 90 6 EXPRESSWAY STUDY 96 7 BICYCLE
Appendix Traffic Engineering Checklist - How to Complete. (Refer to Template Section for Word Format Document)
") Appendix 400.1 Traffic Engineering Checklist - How to Complete (Refer to Template Section for Word Format Document) Traffic Engineering Checksheet How to Complete the Form June 2003 Version 3 Maintained
Appendix 400.1 Traffic Engineering Checklist - How to Complete (Refer to Template Section for Word Format Document) Traffic Engineering Checksheet How to Complete the Form June 2003 Version 3 Maintained
Closed Loop Traffic Signal Systems Analysis: US 1 and PA 352 in Delaware County, Pennsylvania
 Closed Loop Traffic Signal Systems Analysis: US 1 and PA 352 in Delaware County, Pennsylvania January 2010 The Delaware Valley Regional Planning Commission is dedicated to uniting the region s elected
Figures. Tables. Comparison of Interchange Control Methods...25
 Signal Timing Contents Signal Timing Introduction... 1 Controller Types... 1 Pretimed Signal Control... 2 Traffic Actuated Signal Control... 2 Controller Unit Elements... 3 Cycle Length... 3 Vehicle Green
Signal Patterns for Improving Light Rail Operation By Wintana Miller and Mark Madden DKS Associates
 Signal Patterns for Improving Light Rail Operation By Wintana Miller and Mark Madden DKS Associates Abstract This paper describes the follow up to a pilot project to coordinate traffic signals with light
A Fuzzy Signal Controller for Isolated Intersections
 1741741741741749 Journal of Uncertain Systems Vol.3, No.3, pp.174-182, 2009 Online at: www.jus.org.uk A Fuzzy Signal Controller for Isolated Intersections Mohammad Hossein Fazel Zarandi, Shabnam Rezapour
Greater Ukiah Area Micro-simulation Model Final Report
 Greater Ukiah Area Micro-simulation Model Final Report Prepared for the Mendocino Council of Governments January 2016 Prepared by: Caliper Corporation 1172 Beacon Street, Suite 300 Newton, MA 02461 Phone:
Review Status 8150 Sunset
 Eileen Hunt Review Status 8150 Sunset Ron Hirsch To: Eileen Hunt Tue, Feb 4, 2014 at 4:17 PM Thanks, Eileen. We ll look into these issues and get back
Traffic Controller Timing Processes
 4 Actuated Traffic Controller Timing Processes In Chapter 4, you will learn about the timing processes that run an actuated traffic controller. Many transportation engineers begin their study of signalized
Appendix CANADA / Québec Montréal tunnels Ville-Marie & Viger
 PIARC WG5 Complex Underground Road Networks Part A Case Studies - appendices Appendix 3.1 - CANADA / Québec Montréal tunnels Ville-Marie & Viger 1. SUMMARY The Ville-Marie and Viger tunnel complex is part
I-85 Integrated Corridor Management. Jennifer Portanova, PE, CPM Sreekanth Sunny Nandagiri, PE, PMP
 Jennifer Portanova, PE, CPM Sreekanth Sunny Nandagiri, PE, PMP SDITE Meeting, Columbia, SC March 2017 Agenda The I-85 ICM project in Charlotte will serve as a model to deploy similar strategies throughout
Using Multimodal Performance Measures to Prioritize Improvements on US 101 in San Luis Obispo County
 Portland State University PDXScholar TREC Friday Seminar Series Transportation Research and Education Center (TREC) 4-24-2015 Using Multimodal Performance Measures to Prioritize Improvements on US 101
Signal Timing and Coordination Strategies Under Varying Traffic Demands
 NDOT Research Report Report No. 236-11-803 Signal Timing and Coordination Strategies Under Varying Traffic Demands July 2012 Nevada Department of Transportation 1263 South Stewart Street Carson City, NV
PHASE II FOR LEASE PROJECT FEATURES. Phase I - 100% Leased to FedEx Ground
 ARCADIA LOGISTICS CENTER ARCADIA, CALIFORNIA PHASE II FOR LEASE 3 BUILDINGS +-150,672 SF TO +- 529,179 SF STATE OF THE ART DEVELOPMENT ˑ ADJACENT TO I-605, BETWEEN I-10 AND I-210 ˑ LEED SILVER DEVELOPMENT
PLEASE NOTE THAT THIS ENTIRE PROJECT WAS A COMPLETELY ACADEMIC EXERCISE. THIS PROJECT IN NO WAY REPRESENTS THE OPINIONS OF ITRANS OR THE MTO
 PREAMBLE 1 PLEASE NOTE THAT THIS ENTIRE PROJECT WAS A COMPLETELY ACADEMIC EXERCISE. THIS PROJECT IN NO WAY REPRESENTS THE OPINIONS OF ITRANS OR THE MTO HIGHWAY 404 AND 16 TH AVENUE INTERCHANGE RECONSTRUCTION
Appendix A. Congestion Management Process
 Appendix A Congestion Management Process CONGESTION MANAGEMENT PROCESS NORTHEASTERN INDIANA REGIONAL COORDINATING COUNCIL This report represents an update of the activities documenting the development
Planarization & Routing Guide
 Metro Regional Centerlines Collaborative Planarization & Routing Guide Document: Version. Published: July 8, 25 Prepared and edited by: Matt Koukol, MRCC Project Technical Lead Ramsey County GIS Manager
Transportation and Traffic Theory: Flow, Dynamics and Human Interaction
 Real-Time Estimation of Travel Times on Signalized Arterials 1 Transportation and Traffic Theory: Flow, Dynamics and Human Interaction Proceedings of the 16 th International Symposium on Transportation
%&g( %&g( ) Bridge Projects DRAFT
 Bridge Projects DRAFT") BELCHER RD 66TH ST N DRAFT 09-18-14 GULF BLVD Dunedin Causeway 16 Gulf of Mexico WEST BAY DR WALSINGHAM RD Beckett Bridge 102ND AVE N 26 27 S MYRTLE AVE 113TH ST N EDGEWATER DR BAYSHORE BLVD S MISSOURI
BELCHER RD 66TH ST N DRAFT 09-18-14 GULF BLVD Dunedin Causeway 16 Gulf of Mexico WEST BAY DR WALSINGHAM RD Beckett Bridge 102ND AVE N 26 27 S MYRTLE AVE 113TH ST N EDGEWATER DR BAYSHORE BLVD S MISSOURI
FLORIDA HIGHWAY PATROL OFFICIAL PRESS RELEASE PRESS RELEASE APPROVED FOR PUBLIC RELEASE BY: Trooper Joe M. Sanchez Public Affairs Officers 11/2/2016 T
 FLORIDA HIGHWAY PATROL OFFICIAL PRESS RELEASE PRESS RELEASE APPROVED FOR PUBLIC RELEASE BY: Trooper Joe M. Sanchez Public Affairs Officers 11/2/2016 Troop E 11/02/2016 1:42 PM STATE ROAD 90 EB / SW 137
2.4 OPERATION OF CELLULAR SYSTEMS
 INTRODUCTION TO CELLULAR SYSTEMS 41 a no-traffic spot in a city. In this case, no automotive ignition noise is involved, and no cochannel operation is in the proximity of the idle-channel receiver. We
Plan Preparation Checklist
 Appendix D Plan Preparation Checklist It is the responsibility of the Designer to complete and submit this checklist along with all required drawings for OUC (EFP) Review. All drawings submitted for OUC
A Mathematical Procedure for Time-Space Diagrams
 A Mathematical Procedure for Time-Space Diagrams C. E. R i s e r Commissioner Division of Traffic Engineering Toledo, Ohio IN TR O D U CTIO N This paper will describe a mathematical procedure for constructing
REGIONAL TRAFFIC SIGNAL RETIMING PROGRAM EXECUTIVE SUMMARY
 REGIONAL TRAFFIC SIGNAL RETIMING PROGRAM EXECUTIVE SUMMARY Introduction In 2010, the North Central Texas Council of Governments (NCTCOG) launched the Regional Traffic Signal Retiming Program (RTSRP), the
Noise Study Report. Addendum. Interstate 10 Corridor Project. In the Counties of San Bernardino and Los Angeles
 Interstate 10 Corridor Project Draft NSR Addendum Noise Study Report Addendum Interstate 10 Corridor Project In the Counties of San Bernardino and Los Angeles 07-LA-10 PM 44.9/48.3 08-SBD-10 PM 0.0/R37.0
Constructing a Traffic Control Process Diagram
 22 Constructing a Traffic Control Process Diagram The purpose of this assignment is to help you improve your understanding of the operation of an actuated traffic controller system by studying eight cases
Updated: April 7, 2016
 Updated: April 7, 2016 Hwy 36 to Lexington Ave. Add a lane in each direction Recommend a MNPASS Lane Several spot improvements to roadway included Concrete pavement Noise walls will be evaluated Replace
ASSESSING THE POTENTIAL FOR THE AUTOMATIC DETECTION OF INCIDENTS ON THE BASIS OF INFORMATION OBTAINED FROM ELECTRONIC TOLL TAGS
 ASSESSING THE POTENTIAL FOR THE AUTOMATIC DETECTION OF INCIDENTS ON THE BASIS OF INFORMATION OBTAINED FROM ELECTRONIC TOLL TAGS Bruce Hellinga Department of Civil Engineering, University of Waterloo, Waterloo,
COMMITTEE OF THE WHOLE MEETING JUNE 26, 2017
 REPORT #ENG-2017-37 COMMITTEE OF THE WHOLE MEETING JUNE 26, 2017 INTRODUCTION OF PARKING AND TRAFFIC BY-LAWS IN THE VICINITY OF SIDEROAD 10 AND THE 11TH LINE, TOWN OF NEW TECUMSETH RECOMMENDATION That
Mapping the capacity and performance of the arterial road network in Adelaide
 Australasian Transport Research Forum 2015 Proceedings 30 September - 2 October 2015, Sydney, Australia Publication website: http://www.atrf.info/papers/index.aspx Mapping the capacity and performance
FINAL REPORT. On Project Supplemental Guidance on the Application of FHWA s Traffic Noise Model (TNM) APPENDIX K Parallel Barriers
 APPENDIX K Parallel Barriers") FINAL REPORT On Project - Supplemental Guidance on the Application of FHWA s Traffic Noise Model (TNM) APPENDIX K Parallel Barriers Prepared for: National Cooperative Highway Research Program (NCHRP) Transportation
FINAL REPORT On Project - Supplemental Guidance on the Application of FHWA s Traffic Noise Model (TNM) APPENDIX K Parallel Barriers Prepared for: National Cooperative Highway Research Program (NCHRP) Transportation
Using Driving Simulator for Advance Placement of Guide Sign Design for Exits along Highways
 Using Driving Simulator for Advance Placement of Guide Sign Design for Exits along Highways Fengxiang Qiao, Xiaoyue Liu, and Lei Yu Department of Transportation Studies Texas Southern University 3100 Cleburne
Enrique Gonzalez-Velez Civil and Environmental Engineering University of South Florida
 Enrique Gonzalez-Velez Civil and Environmental Engineering University of South Florida Background Objective Introduction Roadway Lighting Literature Review Study Area Data Illuminance, Crash, and Roadway
SEQUENTIAL WARNING LIGHT SYSTEM FOR WORK ZONE LANE CLOSURES Paper No
 SEQUENTIAL WARNING LIGHT SYSTEM FOR WORK ZONE LANE CLOSURES Paper No. 01-2293 by Melisa D. Finley Assistant Transportation Researcher Texas Transportation Institute m-finley@tamu.edu Gerald L. Ullman,
Q. Will prevailing winds and wind speeds be taken into account in the noise study?
 Anthony Henday Noise Study Questions asked at Open House (October 24, 2016) March 2, 2017 Q. Will prevailing winds and wind speeds be taken into account in the noise study? Yes, engineers will review weather
Texas Transportation Institute The Texas A&M University System College Station, Texas
 1. Report No. FHWA/TX-08/0-4986-1 4. Title and Subtitle AN ASSESSMENT OF YIELD TREATMENTS AT FRONTAGE ROAD EXIT RAMP AND FRONTAGE ROAD U-TURN MERGE AREAS 2. Government Accession No. 3. Recipient's Catalog
DESIGN PUBLIC HEARING
 DESIGN PUBLIC HEARING JUNE 22, 2016 AT TOWN HALL AUDITORIUM 11 TOWN HOUSE ROAD WESTON, MASSACHUSETTS 7:00 PM FOR THE PROPOSED DEMOLITION OF LEGACY TOLL PLAZAS ALONG I-90 DISTRICT 6 PLAZAS 14, 15 AND 55
Evaluation of Real-World Toll Plazas Using Driving Simulation
 Evaluation of Real-World Toll Plazas Using Driving Simulation Mohamed Abdel-Aty, PhD, PI Pegasus Professor, Chair Department of Civil, Environmental and Construction Engineering University of Central Florida
Signal Coordination for Arterials and Networks CIVL 4162/6162
 Signal Coordination for Arterials and Networks CIVL 4162/6162 Learning Objectives Define progression of signalized intersections Quantify offset, bandwidth, bandwidth capacity Compute progression of one-way
Traffic Signal and Junction Design: A Case Study of Rajkot City
 http:// Traffic Signal and Junction Design: A Case Study of Rajkot City Vaishali Parmar Department of civil engineering, Indus University Ahmedabad, India Ruchika Lalit Department of civil engineering,
0-6920: PROACTIVE TRAFFIC SIGNAL TIMING AND COORDINATION FOR CONGESTION MITIGATION ON ARTERIAL ROADS. TxDOT Houston District
 0-6920: PROACTIVE TRAFFIC SIGNAL TIMING AND COORDINATION FOR CONGESTION MITIGATION ON ARTERIAL ROADS TxDOT Houston District October 10, 2017 PI: XING WU, PHD, PE CO-PI: HAO YANG, PHD DEPT. OF CIVIL & ENVIRONMENTAL
Development and Application of On-Line Strategi for Optimal Intersection Control (Phase Ill) 1II II! IIi1111 III. I k I I I
 1II II! IIi1111 III. I k I I I") iii DEPi T OF TRANSPORTATIONi j - "L IIIIIIIIIIIIIII l ll IIIIIIIIIIN lll111111111 II 1II II!11111 11IIi1111 III 3 0314 00023 6447 Report Number C/UU'. I -.: ; ',, I k I I S1 I 0 I I a, Cu 60 C P1-5 /I
iii DEPi T OF TRANSPORTATIONi j - "L IIIIIIIIIIIIIII l ll IIIIIIIIIIN lll111111111 II 1II II!11111 11IIi1111 III 3 0314 00023 6447 Report Number C/UU'. I -.: ; ',, I k I I S1 I 0 I I a, Cu 60 C P1-5 /I
Adaptive Signal System Mt. Juliet, TN. SR-171 (Mt. Juliet Road)
") Adaptive Signal System Mt. Juliet, TN SR-171 (Mt. Juliet Road) Project Background Project Location Mt. Juliet, TN: 2015 Census: 28,159 Doubled since 2000 Immediately east of Metro Nashville Mt. Juliet
Adaptive Signal System Mt. Juliet, TN SR-171 (Mt. Juliet Road) Project Background Project Location Mt. Juliet, TN: 2015 Census: 28,159 Doubled since 2000 Immediately east of Metro Nashville Mt. Juliet
Performance Evaluation of Coordinated-Actuated Traffic Signal Systems Gary E. Shoup and Darcy Bullock
 ABSTRACT Performance Evaluation of Coordinated-Actuated Traffic Signal Systems Gary E. Shoup and Darcy Bullock Arterial traffic signal systems are complex systems that are extremely difficult to analyze
Addressing Issues with GPS Data Accuracy and Position Update Rate for Field Traffic Studies
 Addressing Issues with GPS Data Accuracy and Position Update Rate for Field Traffic Studies THIS FEATURE VALIDATES INTRODUCTION Global positioning system (GPS) technologies have provided promising tools
I-405 Sepulveda Pass Improvements Project. Community Advisory Committee September 23, 2010
 I-405 Sepulveda Pass Improvements Project Community Advisory Committee September 23, 2010 1 Click to edit Master title style Click to edit Master text styles Regional Project Updates Second level Third
Getting Through the Green: Smarter Traffic Management with Adaptive Signal Control
 Getting Through the Green: Smarter Traffic Management with Adaptive Signal Control Presented by: C. William (Bill) Kingsland, Assistant Commissioner, Transportation Systems Management Outline 1. What is
Event-Based Data Collection for Generating Actuated Controller Performance Measures
 University of Nebraska - Lincoln DigitalCommons@University of Nebraska - Lincoln Civil Engineering Faculty Publications Civil Engineering 2007 Event-Based Data Collection for Generating Actuated Controller
AN INTERSECTION TRAFFIC DATA COLLECTION DEVICE UTILIZING LOGGING CAPABILITIES OF TRAFFIC CONTROLLERS AND CURRENT TRAFFIC SENSORS.
 AN INTERSECTION TRAFFIC DATA COLLECTION DEVICE UTILIZING LOGGING CAPABILITIES OF TRAFFIC CONTROLLERS AND CURRENT TRAFFIC SENSORS Final Report November 2008 UI Budget KLK134 NIATT Report Number N08-13 Prepared
Freeway exit ramp traffic flow research based on computer simulation
 University of South Florida Scholar Commons Graduate Theses and Dissertations Graduate School 2008 Freeway exit ramp traffic flow research based on computer simulation Xu Wang University of South Florida
How to Calculate the Probabilities of Winning the Nine Cash4Life Prize Levels:
 How to Calculate the Probabilities of Winning the Nine Cash4Life Prize Levels: CASH4LIFE numbers are drawn from two sets of numbers. Five numbers are drawn from one set of 60 numbered white balls and one
CHAPTER 14: TRAFFIC SIGNAL STANDARDS Introduction and Goals Administration Standards Standard Attachments 14.
 14.00 Introduction and Goals 14.01 Administration 14.02 Standards 14.03 Standard Attachments 14.1 14.00 INTRODUCTION AND GOALS The purpose of this chapter is to outline the City s review process for traffic
Intelligent Driving Agents
 Intelligent Driving Agents The agent approach to tactical driving in autonomous vehicles and traffic simulation Presentation Master s thesis Patrick Ehlert January 29 th, 2001 Imagine. Sensors Actuators
MOBILITY RESEARCH NEEDS FROM THE GOVERNMENT PERSPECTIVE
 MOBILITY RESEARCH NEEDS FROM THE GOVERNMENT PERSPECTIVE First Annual 2018 National Mobility Summit of US DOT University Transportation Centers (UTC) April 12, 2018 Washington, DC Research Areas Cooperative
Evaluation of Small City Traffic Signal Network
 Evaluation of Small City Traffic Signal Network W. L. G recco Research Engineer C. E. Cooper Research Assistant Joint Highway Research Project Purdue University IN T R O D U C T IO N Small cities have
Managing traffic through Signal Performance Measures in Pima County
 CASE STUDY Miovision TrafficLink Managing traffic through Signal Performance Measures in Pima County TrafficLink ATSPM Case Study Contents Project overview (executive summary) 2 Project objective 2 Overall
created by: The Curriculum Corner
 created by: The Curriculum Corner I can understand fractions. I can show and understand that fractions represent equal parts of a whole, where the top number is the part and the bottom number is the total
Coastside Fire Protection District
 Folsom (Sacramento), CA Management Consultants Fire Station Relocation Study for the Coastside Fire Protection District Volume 1 of 2 Main Report February 19, 2014 www.ci.pasadena.ca.us 2250 East Bidwell
2015 GDOT PowerPoint. Title Page
 Cartersville MPO Regional Travel Demand Model Update Joint Policy Committee (PC) and Technical Coordinating Committee (TCC) Meeting May 20, 1 BACKGROUND Federal legislation requires Long-Range Transportation
Recent research on actuated signal timing and performance evaluation and its application in SIDRA 5
 Akcelik & Associates Pty Ltd REPRINT with MINOR REVISIONS Recent research on actuated signal timing and performance evaluation and its application in SIDRA 5 Reference: AKÇELIK, R., CHUNG, E. and BESLEY
An Overview of TTI Automated and Connected Vehicles Research
 An Overview of TTI Automated and Connected Vehicles Research Michael P. Manser, Ph.D. Human Factors Program Manager Associate Director of Safety Initiatives Center for Transportation Safety Texas A&M Transportation
Georgia Department of Transportation. Automated Traffic Signal Performance Measures Reporting Details
 Georgia Department of Transportation Automated Traffic Signal Performance Measures Prepared for: Georgia Department of Transportation 600 West Peachtree Street, NW Atlanta, Georgia 30308 Prepared by: Atkins