Augmented Reality and Remote Sensing: Using Multi-Spectrum to Exhibit Our Physical Environment
|
|
|
- Reynard Bryant
- 6 years ago
- Views:
Transcription
1 Augmented Reality and Remote Sensing: Using Multi-Spectrum to Exhibit Our Physical Environment Lingli ZHU, Juha SUOMALAINEN, Eero SALMINEN, Juha HYYPPÄ, Harri KAARTINEN, Arttu JULIN, and Hannu HYYPPÄ, Finland Key words: Remote Sensing, Augmented Reality, Multispectral camera, NDVI, Object Detection, PCA, Image Matching, Similarity Measurement Android Mobile Application Platform ABSTRACT In this paper, we propose an AR technology in which our surroundings can be visually enhanced by superposing common video with information from multispectral bands such as red and infrared channels. The camera used in this study is a NIR camera with a spectral range of 600nm-975nm, which is commonly used for vegetation study. We utilize images acquired from the red and infrared channels to calculate the information about e.g. the vegetation NDVI and a customized object class and put them into a library. An Android smartphone based video camera is used to record the real environment, in the predominant scene, augmented information from the library can be retrieved and superposed on it.
2 Augmented Reality and Remote Sensing: Using Multi-Spectrum to Exhibit Our Physical Environment Lingli ZHU, Juha SUOMALAINEN, Eero SALMINEN, Juha HYYPPÄ, Harri KAARTINEN, Arttu JULIN, and Hannu HYYPPÄ, Finland INTRODUCTION Augmented Reality (AR) is a technology to combine or mix the view of the real environment with additional, virtual content that is presented through computer graphics (Augmented Reality, 2017). It has been used in education, entertainment, GIS, media arts, psychology, robotics, surgery and urban planning. With the help of advanced AR technology, the information about the surrounding real world becomes interactive and digitally manipulable. It can bring out the components of the digital world into a person's perceived real world. However, the visible spectrum is limited to the visible light, approximately in the wavelength from 390nm to 700nm. Human eyes and brain can distinguish the pure colors and a mix of multiple wavelengths in such spectral range (Human Eye, 2017). However, in our physical world, the electromagnetic spectrum (EMS) covers a wide range, typically from Gamma rays, x-rays, ultraviolet, visible light, infrared light, microwaves and Radio waves, between 1pm to 100Mm (Electromagnetic spectrum, 2017). We can utilize remote sensing sensors to explore information which is out of human vision. Remote sensing sensors measure electromagnetic radiation and interact with the atmosphere and the objects to acquire information including not only the distance between the sensor and the object, but also the direction, intensity, wavelength content, and polarization of electromagnetic radiation. In different EMS, objects exhibit different characteristics. For example, remote sensor working in green channel is typically applied for water body measurement due to less absorption by water body in that channel, while exploring the vegetation, red and near infrared lights are applied: to calculate the Normalized Difference Vegetation Index (NDVI), to classify different objects, to find the health status of the vegetation and tree species. Such information can t be directly acquired by human vision. In previous study, a synergy to visualize physical and virtual city environments by integrating AR with photogrammetry has been addressed by Portales et al. (2010). The authors introduced a lowcost outdoor mobile AR application to integrate buildings of different urban spaces. High-accuracy 3D photo-models derived from close-range photogrammetry are integrated in real (physical) urban worlds. The augmented environment that is presented herein requires for visualization a see-through video head mounted display (HMD), whereas user's movement navigation is achieved in the real world with the help of an inertial navigation sensor. AR technology applied for Virtual training of parts assembly, which has been introduced by Horejsi (2015). It uses a conventional web camera to shoot a referential workplace with a worker. The proposed software solution processes the web camera image data and adds virtual 3D model instructions to the real image. The final image is presented on a monitor placed in front of the worker. Mura et al. (2015) integrated AR with sensing device for manual assembly workstations to reduce human errors in performing the operations. An
3 augmented reality (AR) equipment used to give to the worker the necessary information about the correct assembly sequence and to alert him in case of errors. The force sensor is placed under the workbench and it is used to monitor the assembly process by collecting force and torque data with respect to an XYZ reference system. Two AR devices have been tested in this application: a videomixing spatial display and an optical see-through apparatus. Recently, AR has been widely used in education field. Foster (2016) developed an AR system for visually impaired students for the lectures. Weng et al. (2016) presents an AR system for Biology science education. During the lessons, dedicated stereoscopic and photo-realistic views were presented and also assert something such as a specific attribute, a rule or a function, applies to all the objects of the same kind, thus facilitating students in noticing, memorizing and understanding Biology concepts. This paper is aiming for using the multi-spectral sensors to enhance our physical environment in which acquired information is beyond the range of our vision. We utilize a multispectral camera to obtain images from red and near-infrared bands. Information about vegetation is investigated, for instance, the NDVI values, detecting known and unknown objects from a scene and so on. Such information is stored in a library file. When a video camera (e.g. a smartphone) records the scene, a searching is conducted from the library file. When finding the matched object, the image from library overlaps on the video image to show up more information about the current object. In the near future, when multispectral camera becomes available in our smart phone, synchronized information from video camera and multispectral camera will make our AR technology easy to be implemented. MATERIALS The materials used in this paper include a Near-Infrared (NIR) hyperspectral camera, a smart phone with video camera and development platform, Matlab software. The model of the camera is Ximea MQ022HG-IM-SM5X5-NIR. The specifications of the camera are as follows: Resolution: 409x217 pixels Spectral range: nm Sensor active area: 25 Bands Dimensions (without lens) WxHxD: 26x26x31 mm Frame rates: up to 170 cubes/s Weight: 32 g A smartphone Samsung Galax Note Edge with Android operating system was used for development platform. The device is powered by a 2.7GHz quad-core Qualcomm Snadragon 805 processor, 3GB of RAM and has 64GB of internal storage. It features a 16P camera, heart rate monitor and 3000mAh battery.

 to obtain the NDVI value of vegetation.")
 to highlight and alarm about object not fitting spectrally in a scenery.")
4 Figure 1. NIR camera; spectrum bands of the NIR camera; a smart phone. METHODS In this study, we concentrate on utilizing the advantages from multispectral data, especially in infrared bands, which are beyond human vision. It can help people understand the physical environment better. The multispectral camera works in the wavelength of 600nm-875nm, in which vegetation is highly sensitive. Some indicators/ parameters such as their healthy status or tree species can be obtained from these channels. Three cases are studied in this paper. They are i) to obtain the NDVI value of vegetation. NDVI images can allow people to see additional information on health status of leaves and vegetation; ii) to highlight and detect known objects. For example, it can help people to spot lost objects or mushrooms when those show up in a scene; iii) to highlight and alarm about object not fitting spectrally in a scenery. For example, this can be used to spot manmade objects in natural environment. Image registration technology is conducted in our application. The method of structure similarity is highlighted. This method contains three primary measurements: luminance, contrast and structure. The development was implemented in two platforms. One is Matlab, another is Android smart phone developer platform. The details are as follows: 1. NDVI value acquisition NDVI is a robust index which can be used to evaluate the presence and vigor of vegetation. Live green plants absorb efficiently solar radiation in the photosynthetically active radiation (PAR) spectral region which coarsely overlaps with the spectral range of human vision (NDVI, 2017).
5 Outside of this region and especially in the near-infrared (NIR) the vegetation cells have evolved to reflect and re-emit solar radiation in the near-infrared spectral region. A strong absorption at these wavelengths would only result in overheating the plant and possibly damaging the tissues. Hence, most organic objects appear relatively bright (>0.50 reflectance) in the NIR. Furthermore, the photosynthesis mechanisms in healthy green vegetation causes such objects to have appear very dark especially in red spectral region (<0.05 reflectance). The NDVI exploits this difference between red and NIR response. With NDVI, the observed intensities in red and NIR bands are converted it to a single NDVI value describing health and organic nature of the target by using the following equation: NDVI = NIR RED NIR + RED Where NIR and RED are the observed intensities in the NIR and red regions of the spectrum (~800nm and ~650nm). The NDVI is a robust self-normalizing index and for coarse visualization of the NDVI the radiometric calibration of the sensor is not absolutely necessary but it is possible to achieve reasonable results with any digital numbers produced by the camera. For more advanced analysis calibration and conversion of observations to radiance or reflectance factor units is recommended. 2. Object detection-finding known objects Normal human vision observes targets using three colors: red, green, and blue. This set of 3 spectral bands allows people to identify objects by their colors. The human sight is limited to these exact colors and number of bands due to evolutional reasons, but when using camera technology there is no reason stick with this spectral range or such a low number of spectral bands. With our hyperspectral camera we take simultaneously measurement on 25 spectral bands in the spectral range from 600nm to 875nm. The human brain interprets colors of objects using the natural RGB observation and uses those to detect and identify objects in view. Using hyperspectral cameras we can very similarly form the more advanced 25-bands spectrum of an object to describe its color in very high detail. If we compare this observed spectrum, with the spectrum of a to-be-searched object, we can scan the image for objects with that spectrum. A simple way to evaluate similarity of the two spectra (x and y in equation below) is by using algorithm called Spectral Angle Mapper (SAM): SAM = arccos ( N bands x i y i=1 i N bands x2 N i=1 i bands y2 i=1 i ) [1] If the spectrum of the -to-be-found target is known, the hyperspectral image can be scanned for pixels of such spectrum and if similarity better than threshold is detected the user can be alerted of the observation. 3. Object detection-finding unknown objects
6 In the case above, the hyperspectral information was used to detect specific known objects. However this methodology is not possible if the spectrum of the to-be-found object is not known. In such case it is still possible to use the hyperspectral information to highlight potentially interesting objects in the scene. Especially in the natural environment, the spectrum of majority of objects in the scene can usually be described for most part using just a few spectral component shapes. Meanwhile anomalies, such as man-made objects lost in the nature, often have radically different spectral shape. This difference in spectral composition can be used to spot and highlight anomalous objects even if their spectrum is unknown. 4. PCA component analysis A common method to determine the spectral component shapes dominating in the imagery is Principal Component Analysis (PCA). In PCA workflow, the spectra of the pixels are analyzed to determine the dominant spectral shapes presenting in imagery. The presence of these spectral component shapes is measured in each spectrum. Using these data, it is possible to form a mask highlighting all anomalous objects in the scene by setting a threshold on how many dominant spectral shape components are ignored. 5. Image registration Image registration is necessary when measurements were taken in different time, different viewpoints or in different coordinate systems. Image registration makes different measurements comparable. Common image registration methods include point-based matching (e.g. intensity), feature-based matching (e.g. line, edge, and area), or similarity measurement. It can be interactive operation or automated operation. In our task, we conducted image matching using the automatic method for similarity measurement. Two datasets were utilized: one is a library file, which consists of the predefined images; another is the video images taken by the users. An image similarity measure quantifies the degree of similarity between intensity patterns in two images. Common image similarity measures include cross-correlation, mutual information, sum of squared intensity differences, and ratio image uniformity. At present, in the field of video image registration, the typical method is to measure structural similarity (SSIM). Structural information is the idea that the pixels have strong inter-dependencies. These dependencies carry important information about the structure of the objects in the visual scene. The SSIM formula is based on three comparison measurements between the samples: luminance, contrast and structure. This method improved the traditional methods such as peak signal-to-noise ratio (PSNR) and mean squared error (MSE). The SSIM index is calculated on various windows of an image. The measure between two windows is (Wang et al. (2003)): SSIM(x, y) = [l M (x, y)] αm. M j=1 βj [cj (x, y)] [s j (x,y)] γj [2] Where x={x i i=1,2,., N} and y={y i i=1, 2,, N} are two discrete non-negative signals that have been aligned with each other; l M (x, y) is the luminance comparison, computed only at scale M; c j (x,y) is the contrast comparison at the j-th scale; s j (x,y) is the structure comparison calculated at the j-th scale; α, β, γ are parameters to define the relative importance of the three components.
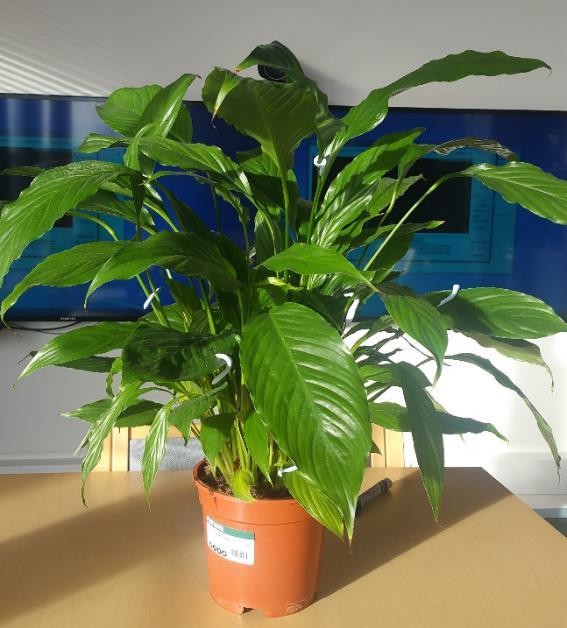
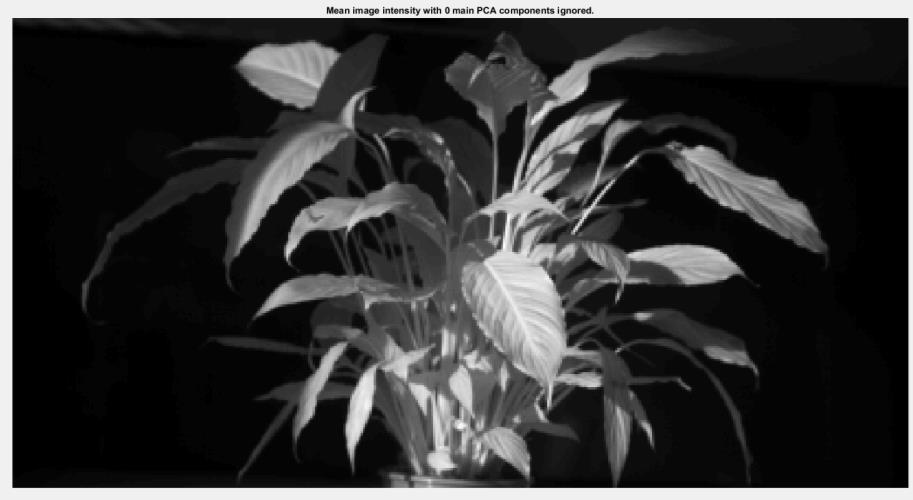
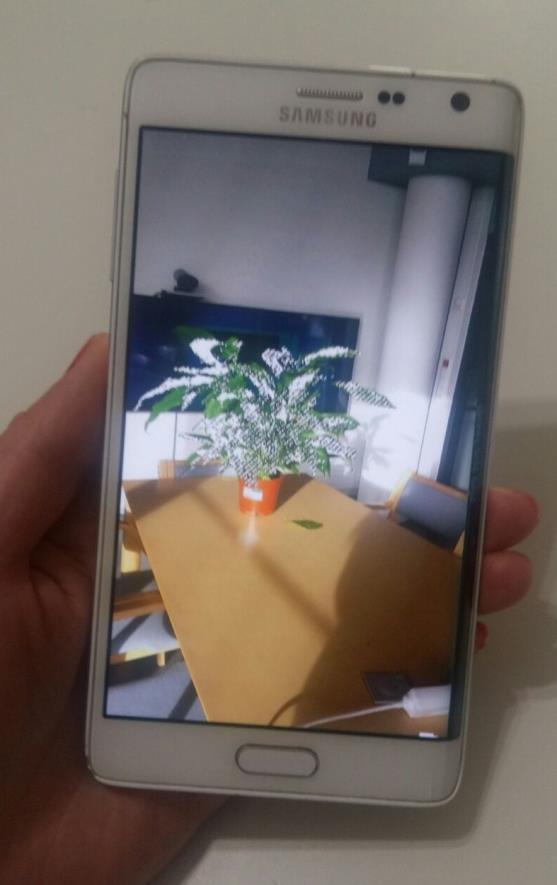
7 When an object defined in the library appears in a scene, the similarity is measured. A threshold is set to determine whether they are the same objects. 6. Added information overlapping on video based on Android Smartphone Platform A Samsung smart phone is based on the Android operation system. Android gives a powerful platform for creating apps. Android also gives you tools for creating apps that take advantage of the hardware capabilities available on each device. It gives the developers as much control as he wants over his UI on different device types. The Android framework includes support for various cameras and camera features available (Class: android.hardware.camera2 or Camera) on devices, allowing users to capture pictures and videos in their applications. A series of declarations of request permission is needed to use the devices, features and actions from the camera. To capture or stream images from a camera device, the application must first create a camera capture session with a set of output Surfaces for use with the camera device, with createcapturesession. Each Surface has to be pre-configured with an appropriate size and format (if applicable) to match the sizes and formats available from the camera device. A target Surface can be obtained from a variety of classes, including SurfaceView, SurfaceTexture via Surface(SurfaceTexture), MediaCodec, MediaRecorder, Allocation, and ImageReader. When recording a video, retrieval is processed to check whether the target surface is matching the image from library. When the matching condition is met, the library image shows up on the phone. DEMONSTRATION OF THE RESULTS After the implementation of our developed AR system, we are able to overlap multi-spectral information from a library on a video image. The aim is to demonstrate the operability of our method. The test data was a home plant which has many wide leaves in a good condition. The multi-spectral camera recorded imagery in red and near infrared bands. The plant was recorded in different forms: the plant, and the plant with green pins. We have achieved the following results i) obtained its NDVI image; ii) recognized known spectral object in the scene; iii) found abnormal objects in a scene by the PCA of the image; iv) acceptable image matching results; v) overlapped images shown on the smart phone. Figure 2. A photo and a NDVI visualization of an indoor plant. In this visualization we can see how: (1.) the NDVI effectively masks the plant from the background, (2.) greatly reduces the effect of shadows in the plant structure (3.) highlights a dead leaf in the middle of the plant, and (4.) reveals the veins in the leaves on high detail.


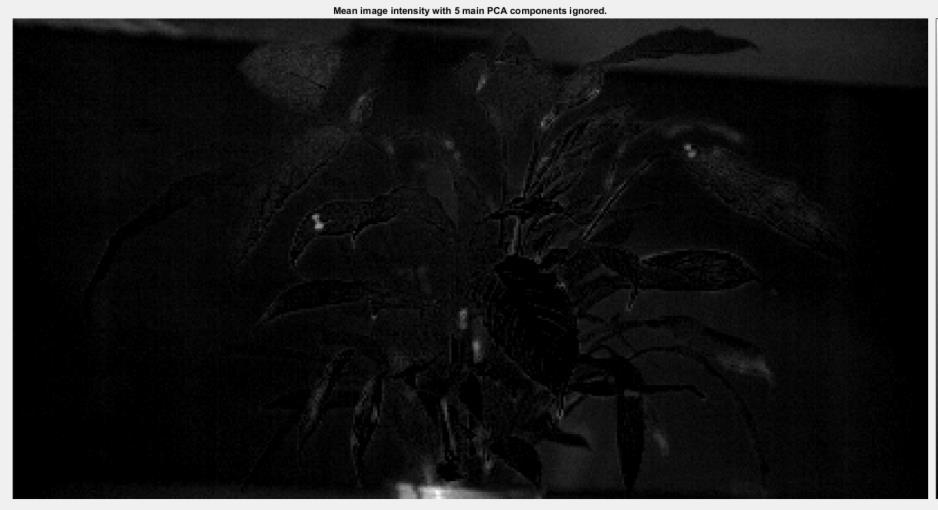
8 Figure 3. A photo and highlighted NIR image of the SAM detection experiment. Some green plastic pins were stuck to the leaves of the plant. For human eye, detecting all pins would have been a challenging task. From hyperspectral image, the spectrum of one pin was picked. This reference spectrum was compared to all pixels in the image using SAM algorithm. By setting threshold to SAM < 0.10 (radians) we were able to highlight the pins in the scene. Figure 4. A photo and image of anomalous objects produced with unsupervised PCA filtering. To bring out the anomalous objects, a PCA transformation was done to the image, four most dominant spectral components were removed, and the PCA image was reverse-transformed back to normal hyperspectral spectral data cube. In the resulting data cube, the manmade anomalous objects (plastic pins and rubbers) are clearly showing up as they stand out spectrally from the majority of the scene. a). Plant with green pins; b) Plant with plastic buckets; c) PCA without any component removal; d) Investigate 12 top most dominant component contributions. The fifth component clearly shows the green pins; e) The seventh component shows the rubbers.
 (a (c)")
9 (( c ) a) b) (a (c) (d)


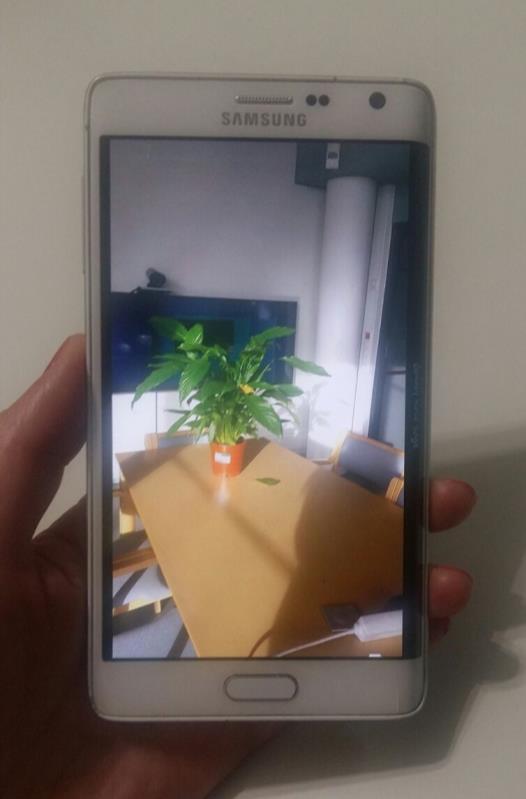
10 (e) Figure 5. Image Registration and overlapped with the video image. Plant s NDVI image was stored in a library. The library file was retrieved and the NDVI image was matched to the video image which was taken by a smart phone. The similarity measurement between two images was over 60%. Due to a bit different views from two images, the matching was not perfect, but they have showed a relatively high similarity. Finally the NDVI image was showed up on the video camera. (a) A plant image; (b) NDVI image of the plant; (c) NDVI image mask; (d) A video image; (e) NDVI image matching to video image; (f) Overlapped images when matching condition meets. (a) (b) (c)
")
11 (d) (e) (f)

12 We has demonstrated the procedure of the experient. We have utilized multi-spectral images to obtain the NDVI image of a plant. We have shown the possibilities to detect known spectral objects from a scene and also it showed that unknown objects can be revealed by PCA component analysis. These two applications can be extented to other similar applications. For example, when we know the spectrum of a mushroom, we set it as known object in a scene. Then when mushrooms emerged in a scene, a indicator can show the locations of the mushrooms. It can be used as a helper for finding a certain class of objects. In the application of unknown object detection, we can extend this application to be a warning system. For instance, when some dangerous objects are in a scene, by PCA components analysis of a scene, some abnormal objects will show up in the PCA components as a certain group of objects. In our experiment, top 12 dominated components were analyzed. As a result, the objects such as green pins and rubbers were found among a plant. The most challenging work in image registration is that two images were taken in different time and from different angles of the view points. We have showed the possiblility of the application. In our experiment, a small amount of images have been tested. It is still a challenge when a huge datasets are in a library file and various situations need to be considered. Failure becomes normal. However, if we consider about near future, when multispectral camera becomes available in every smartphone. Synchronized images from video camera and multispectral camera can be matched by a constant displacement. The information overlapping becomes very easy. At that time, multispectral information will be widely used in our daily lives.
13 SUMMARY As a summary, this paper proposed an AR technology to enhance video images by superposing the added information from multispectral camera. Multispectral images were taken from red and near infrared spectral bands. These images were explored and analyzed, especially for the NDVI value of the vegetation, object detection from known spectrum, and the PCA components of a scene. These information is stored in a library file as images. A video was taken by a video camera from a smartphone. A similarity measurement image matching method was implemented to check whether an image is matching with the video image. When matching condition meets, the image from the library will be shown up and overlapped on the video. The implementation of the AR system was based on two platforms: Matlab and Android mobile application platforms. This paper has exhibited the possibility for using remote sensing sensors to enhance a physical scene. EMS beyond human vision offers extra information for our surroundings. And we believe that in near future these information will be beneficial for our lives. REFERENCES Augmented Reality. Last access on 10 February, Dalle Mura, M., Dini, G., & Failli, F. (2016). An integrated environment based on augmented reality and sensing device for manual assembly workstations. Procedia CIRP, 41, Electromagnetic Spectrum. Last access on 10 February, Foster, P. J. (2016). Augmented Reality in the Classroom (Doctoral dissertation, Loyola Marymount University). Human eye. Last access on 10 February, Hořejší, P. (2015). Augmented reality system for virtual training of parts assembly. Procedia Engineering, 100, NDVI. Last access on 10 February, Portalés, C., Lerma, J. L., & Navarro, S. (2010). Augmented reality and photogrammetry: A synergy to visualize physical and virtual city environments. ISPRS Journal of Photogrammetry and Remote Sensing, 65(1), Wang, Z., Simoncelli, E. P., & Bovik, A. C. (2003, November). Multiscale structural similarity for image quality assessment. In Signals, Systems and Computers, Conference Record of the Thirty-Seventh Asilomar Conference on (Vol. 2, pp ). IEEE. Weng, N. G., Bee, O. Y., Yew, L. H., & Hsia, T. E. (2016). An Augmented Reality System for Biology Science Education in Malaysia. International Journal of Innovative Computing, 6(2).
An Introduction to Remote Sensing & GIS. Introduction
 An Introduction to Remote Sensing & GIS Introduction Remote sensing is the measurement of object properties on Earth s surface using data acquired from aircraft and satellites. It attempts to measure something
Present and future of marine production in Boka Kotorska
 Present and future of marine production in Boka Kotorska First results from satellite remote sensing for the breeding areas of filter feeders in the Bay of Kotor INTRODUCTION Environmental monitoring is
Module 3 Introduction to GIS. Lecture 8 GIS data acquisition
 Module 3 Introduction to GIS Lecture 8 GIS data acquisition GIS workflow Data acquisition (geospatial data input) GPS Remote sensing (satellites, UAV s) LiDAR Digitized maps Attribute Data Management Data
Introduction to Remote Sensing
 Introduction to Remote Sensing Spatial, spectral, temporal resolutions Image display alternatives Vegetation Indices Image classifications Image change detections Accuracy assessment Satellites & Air-Photos
University of Texas at San Antonio EES 5053 Term Project CORRELATION BETWEEN NDVI AND SURFACE TEMPERATURES USING LANDSAT ETM + IMAGERY NEWFEL MAZARI
 University of Texas at San Antonio EES 5053 Term Project CORRELATION BETWEEN NDVI AND SURFACE TEMPERATURES USING LANDSAT ETM + IMAGERY NEWFEL MAZARI Introduction and Objectives The present study is a correlation
Lecture 2. Electromagnetic radiation principles. Units, image resolutions.
 NRMT 2270, Photogrammetry/Remote Sensing Lecture 2 Electromagnetic radiation principles. Units, image resolutions. Tomislav Sapic GIS Technologist Faculty of Natural Resources Management Lakehead University
Sommersemester Prof. Dr. Christoph Kleinn Institut für Waldinventur und Waldwachstum Arbeitsbereich Fernerkundung und Waldinventur.
 Basics of Remote Sensing Some literature references Franklin, SE 2001 Remote Sensing for Sustainable Forest Management Lewis Publishers 407p Lillesand, Kiefer 2000 Remote Sensing and Image Interpretation
Govt. Engineering College Jhalawar Model Question Paper Subject- Remote Sensing & GIS
 Govt. Engineering College Jhalawar Model Question Paper Subject- Remote Sensing & GIS Time: Max. Marks: Q1. What is remote Sensing? Explain the basic components of a Remote Sensing system. Q2. What is
Lecture 13: Remotely Sensed Geospatial Data
 Lecture 13: Remotely Sensed Geospatial Data A. The Electromagnetic Spectrum: The electromagnetic spectrum (Figure 1) indicates the different forms of radiation (or simply stated light) emitted by nature.
Remote Sensing for Rangeland Applications
 Remote Sensing for Rangeland Applications Jay Angerer Ecological Training June 16, 2012 Remote Sensing The term "remote sensing," first used in the United States in the 1950s by Ms. Evelyn Pruitt of the
746A27 Remote Sensing and GIS. Multi spectral, thermal and hyper spectral sensing and usage
 746A27 Remote Sensing and GIS Lecture 3 Multi spectral, thermal and hyper spectral sensing and usage Chandan Roy Guest Lecturer Department of Computer and Information Science Linköping University Multi
Digital Image Processing
 Digital Image Processing IMAGE PERCEPTION & ILLUSION Hamid R. Rabiee Fall 2015 Outline 2 What is color? Image perception Color matching Color gamut Color balancing Illusions What is Color? 3 Visual perceptual
Hyperspectral imaging (HSI) goes embedded All rights reserved Max Larin, 1
 goes embedded All rights reserved Max Larin, 1") Hyperspectral imaging (HSI) goes embedded 2015 All rights reserved Max Larin, max.larin@ximea.com 1 Hyperspectral Imaging (HSI) goes embedded Seeing the invisible with Miniature intelligent HSI Cameras
Hyperspectral imaging (HSI) goes embedded 2015 All rights reserved Max Larin, max.larin@ximea.com 1 Hyperspectral Imaging (HSI) goes embedded Seeing the invisible with Miniature intelligent HSI Cameras
Interpreting land surface features. SWAC module 3
 Interpreting land surface features SWAC module 3 Interpreting land surface features SWAC module 3 Different kinds of image Panchromatic image True-color image False-color image EMR : NASA Echo the bat
Application of GIS to Fast Track Planning and Monitoring of Development Agenda
 Application of GIS to Fast Track Planning and Monitoring of Development Agenda Radiometric, Atmospheric & Geometric Preprocessing of Optical Remote Sensing 13 17 June 2018 Outline 1. Why pre-process remotely
Ground Truth for Calibrating Optical Imagery to Reflectance
 Visual Information Solutions Ground Truth for Calibrating Optical Imagery to Reflectance The by: Thomas Harris Whitepaper Introduction: Atmospheric Effects on Optical Imagery Remote sensing of the Earth
Camera Requirements For Precision Agriculture
 Camera Requirements For Precision Agriculture Radiometric analysis such as NDVI requires careful acquisition and handling of the imagery to provide reliable values. In this guide, we explain how Pix4Dmapper
Outline for today. Geography 411/611 Remote sensing: Principles and Applications. Remote sensing: RS for biogeochemical cycles
 Geography 411/611 Remote sensing: Principles and Applications Thomas Albright, Associate Professor Laboratory for Conservation Biogeography, Department of Geography & Program in Ecology, Evolution, & Conservation
typical spectral signatures of photosynthetically active and non-photosynthetically active vegetation (Beeri et al., 2007)
") typical spectral signatures of photosynthetically active and non-photosynthetically active vegetation (Beeri et al., 2007) Xie, Y. et al. J Plant Ecol 2008 1:9-23; doi:10.1093/jpe/rtm005 Copyright restrictions
typical spectral signatures of photosynthetically active and non-photosynthetically active vegetation (Beeri et al., 2007) Xie, Y. et al. J Plant Ecol 2008 1:9-23; doi:10.1093/jpe/rtm005 Copyright restrictions
Fig Color spectrum seen by passing white light through a prism.
 1. Explain about color fundamentals. Color of an object is determined by the nature of the light reflected from it. When a beam of sunlight passes through a glass prism, the emerging beam of light is not
The techniques with ERDAS IMAGINE include:
 The techniques with ERDAS IMAGINE include: 1. Data correction - radiometric and geometric correction 2. Radiometric enhancement - enhancing images based on the values of individual pixels 3. Spatial enhancement
Remote Sensing. The following figure is grey scale display of SPOT Panchromatic without stretching.
 Remote Sensing Objectives This unit will briefly explain display of remote sensing image, geometric correction, spatial enhancement, spectral enhancement and classification of remote sensing image. At
MSB Imagery Program FAQ v1
 MSB Imagery Program FAQ v1 (F)requently (A)sked (Q)uestions 9/22/2016 This document is intended to answer commonly asked questions related to the MSB Recurring Aerial Imagery Program. Table of Contents
Geo-localization and Mosaicing System (GEMS): Enabling Precision Image Feature Location and Rapid Mosaicing General:
: Enabling Precision Image Feature Location and Rapid Mosaicing General:") Geo-localization and Mosaicing System (GEMS): Enabling Precision Image Feature Location and Rapid Mosaicing General: info@senteksystems.com www.senteksystems.com 12/6/2014 Precision Agriculture Multi-Spectral
Geo-localization and Mosaicing System (GEMS): Enabling Precision Image Feature Location and Rapid Mosaicing General: info@senteksystems.com www.senteksystems.com 12/6/2014 Precision Agriculture Multi-Spectral
DEFENSE APPLICATIONS IN HYPERSPECTRAL REMOTE SENSING
 DEFENSE APPLICATIONS IN HYPERSPECTRAL REMOTE SENSING James M. Bishop School of Ocean and Earth Science and Technology University of Hawai i at Mānoa Honolulu, HI 96822 INTRODUCTION This summer I worked
Important Missions. weather forecasting and monitoring communication navigation military earth resource observation LANDSAT SEASAT SPOT IRS
 Fundamentals of Remote Sensing Pranjit Kr. Sarma, Ph.D. Assistant Professor Department of Geography Mangaldai College Email: prangis@gmail.com Ph. No +91 94357 04398 Remote Sensing Remote sensing is defined
Aerial photography and Remote Sensing. Bikini Atoll, 2013 (60 years after nuclear bomb testing)
") Aerial photography and Remote Sensing Bikini Atoll, 2013 (60 years after nuclear bomb testing) Computers have linked mapping techniques under the umbrella term : Geomatics includes all the following spatial
Aerial photography and Remote Sensing Bikini Atoll, 2013 (60 years after nuclear bomb testing) Computers have linked mapping techniques under the umbrella term : Geomatics includes all the following spatial
Making NDVI Images using the Sony F717 Nightshot Digital Camera and IR Filters and Software Created for Interpreting Digital Images.
 Making NDVI Images using the Sony F717 Nightshot Digital Camera and IR Filters and Software Created for Interpreting Digital Images Draft 1 John Pickle Museum of Science October 14, 2004 Digital Cameras
MR-i. Hyperspectral Imaging FT-Spectroradiometers Radiometric Accuracy for Infrared Signature Measurements
 MR-i Hyperspectral Imaging FT-Spectroradiometers Radiometric Accuracy for Infrared Signature Measurements FT-IR Spectroradiometry Applications Spectroradiometry applications From scientific research to
Camera Requirements For Precision Agriculture
 Camera Requirements For Precision Agriculture Radiometric analysis such as NDVI requires careful acquisition and handling of the imagery to provide reliable values. In this guide, we explain how Pix4Dmapper
MR-i. Hyperspectral Imaging FT-Spectroradiometers Radiometric Accuracy for Infrared Signature Measurements
 MR-i Hyperspectral Imaging FT-Spectroradiometers Radiometric Accuracy for Infrared Signature Measurements FT-IR Spectroradiometry Applications Spectroradiometry applications From scientific research to
Chapter 8. Remote sensing
 1. Remote sensing 8.1 Introduction 8.2 Remote sensing 8.3 Resolution 8.4 Landsat 8.5 Geostationary satellites GOES 8.1 Introduction What is remote sensing? One can describe remote sensing in different
Geo/SAT 2 INTRODUCTION TO REMOTE SENSING
 Geo/SAT 2 INTRODUCTION TO REMOTE SENSING Paul R. Baumann, Professor Emeritus State University of New York College at Oneonta Oneonta, New York 13820 USA COPYRIGHT 2008 Paul R. Baumann Introduction Remote
An NDVI image provides critical crop information that is not visible in an RGB or NIR image of the same scene. For example, plants may appear green
 Normalized Difference Vegetation Index (NDVI) Spectral Band calculation that uses the visible (RGB) and near-infrared (NIR) bands of the electromagnetic spectrum NDVI= + An NDVI image provides critical
DISCO-PRO AG ALL-IN-ONE DRONE SOLUTION FOR PRECISION AGRICULTURE. 80ha COVERAGE PARROT SEQUOIA INCLUDES MULTI-PURPOSE TOOL SAFE ANALYZE & DECIDE
 DISCO-PRO AG ALL-IN-ONE DRONE SOLUTION FOR PRECISION AGRICULTURE Powered by 80ha COVERAGE AT 120M * FLIGHT ALTITUDE (200AC @ 400FT) MULTI-PURPOSE TOOL PHOTO 14MPX VIDEO 1080P FULL HD PARROT SEQUOIA RGB
Atmospheric interactions; Aerial Photography; Imaging systems; Intro to Spectroscopy Week #3: September 12, 2018
 GEOL 1460/2461 Ramsey Introduction/Advanced Remote Sensing Fall, 2018 Atmospheric interactions; Aerial Photography; Imaging systems; Intro to Spectroscopy Week #3: September 12, 2018 I. Quick Review from
Advanced Techniques in Urban Remote Sensing
 Advanced Techniques in Urban Remote Sensing Manfred Ehlers Institute for Geoinformatics and Remote Sensing (IGF) University of Osnabrueck, Germany mehlers@igf.uni-osnabrueck.de Contents Urban Remote Sensing:
PLANT PHENOTYPING: Photo shoots of plants on the catwalk. Stijn Dhondt. - Leuven January 22 th 2019
 PLANT PHENOTYPING: Photo shoots of plants on the catwalk Imaging@VIB - Leuven January 22 th 2019 Stijn Dhondt Tackling the phenotyping bottleneck Phenotyping platforms Image processing Data analysis and
An Introduction to Geomatics. Prepared by: Dr. Maher A. El-Hallaq خاص بطلبة مساق مقدمة في علم. Associate Professor of Surveying IUG
 An Introduction to Geomatics خاص بطلبة مساق مقدمة في علم الجيوماتكس Prepared by: Dr. Maher A. El-Hallaq Associate Professor of Surveying IUG 1 Airborne Imagery Dr. Maher A. El-Hallaq Associate Professor
FluorCam PAR- Absorptivity Module & NDVI Measurement
 FluorCam PAR- Absorptivity Module & NDVI Measurement Instruction Manual Please read this manual before operating this product P PSI, spol. s r. o., Drásov 470, 664 24 Drásov, Czech Republic FAX: +420 511
Part I. The Importance of Image Registration for Remote Sensing
 Part I The Importance of Image Registration for Remote Sensing 1 Introduction jacqueline le moigne, nathan s. netanyahu, and roger d. eastman Despite the importance of image registration to data integration
Dirty REMOTE SENSING Lecture 3: First Steps in classifying Stuart Green Earthobservation.wordpress.com
 Dirty REMOTE SENSING Lecture 3: First Steps in classifying Stuart Green Earthobservation.wordpress.com Stuart.Green@Teagasc.ie You have your image, but is it any good? Is it full of cloud? Is it the right
Spectral Signatures. Vegetation. 40 Soil. Water WAVELENGTH (microns)
") Spectral Signatures % REFLECTANCE VISIBLE NEAR INFRARED Vegetation Soil Water.5. WAVELENGTH (microns). Spectral Reflectance of Urban Materials 5 Parking Lot 5 (5=5%) Reflectance 5 5 5 5 5 Wavelength (nm)
Spectral Signatures % REFLECTANCE VISIBLE NEAR INFRARED Vegetation Soil Water.5. WAVELENGTH (microns). Spectral Reflectance of Urban Materials 5 Parking Lot 5 (5=5%) Reflectance 5 5 5 5 5 Wavelength (nm)
THE VISIONLAB TEAM engineers - 1 physicist. Feasibility study and prototyping Hardware benchmarking Open and closed source libraries
 VISIONLAB OPENING THE VISIONLAB TEAM 2018 6 engineers - 1 physicist Feasibility study and prototyping Hardware benchmarking Open and closed source libraries Deep learning frameworks GPU frameworks FPGA
RGB colours: Display onscreen = RGB
 RGB colours: http://www.colorspire.com/rgb-color-wheel/ Display onscreen = RGB DIGITAL DATA and DISPLAY Myth: Most satellite images are not photos Photographs are also 'images', but digital images are
Monitoring agricultural plantations with remote sensing imagery
 MPRA Munich Personal RePEc Archive Monitoring agricultural plantations with remote sensing imagery Camelia Slave and Anca Rotman University of Agronomic Sciences and Veterinary Medicine - Bucharest Romania,
General Imaging System
 General Imaging System Lecture Slides ME 4060 Machine Vision and Vision-based Control Chapter 5 Image Sensing and Acquisition By Dr. Debao Zhou 1 2 Light, Color, and Electromagnetic Spectrum Penetrate
Image interpretation and analysis
 Image interpretation and analysis Grundlagen Fernerkundung, Geo 123.1, FS 2014 Lecture 7a Rogier de Jong Michael Schaepman Why are snow, foam, and clouds white? Why are snow, foam, and clouds white? Today
GIS Data Collection. Remote Sensing
 GIS Data Collection Remote Sensing Data Collection Remote sensing Introduction Concepts Spectral signatures Resolutions: spectral, spatial, temporal Digital image processing (classification) Other systems
Sensors and Sensing Cameras and Camera Calibration
 Sensors and Sensing Cameras and Camera Calibration Todor Stoyanov Mobile Robotics and Olfaction Lab Center for Applied Autonomous Sensor Systems Örebro University, Sweden todor.stoyanov@oru.se 20.11.2014
Philpot & Philipson: Remote Sensing Fundamentals Color 6.1 W.D. Philpot, Cornell University, Fall 2012 W B = W (R + G) R = W (G + B)
 R = W (G + B)") Philpot & Philipson: Remote Sensing Fundamentals olor 6.1 6. OLOR The human visual system is capable of distinguishing among many more colors than it is levels of gray. The range of color perception is
Philpot & Philipson: Remote Sensing Fundamentals olor 6.1 6. OLOR The human visual system is capable of distinguishing among many more colors than it is levels of gray. The range of color perception is
Capture the invisible
 Capture the invisible A Capture the invisible The Sequoia multispectral sensor captures both visible and invisible images, providing calibrated data to optimally monitor the health and vigor of your crops.
Final Examination Introduction to Remote Sensing. Time: 1.5 hrs Max. Marks: 50. Section-I (50 x 1 = 50 Marks)
") Final Examination Introduction to Remote Sensing Time: 1.5 hrs Max. Marks: 50 Note: Attempt all questions. Section-I (50 x 1 = 50 Marks) 1... is the technology of acquiring information about the Earth's
Final Examination Introduction to Remote Sensing Time: 1.5 hrs Max. Marks: 50 Note: Attempt all questions. Section-I (50 x 1 = 50 Marks) 1... is the technology of acquiring information about the Earth's
Introduction to Remote Sensing Fundamentals of Satellite Remote Sensing. Mads Olander Rasmussen
 Introduction to Remote Sensing Fundamentals of Satellite Remote Sensing Mads Olander Rasmussen (mora@dhi-gras.com) 01. Introduction to Remote Sensing DHI What is remote sensing? the art, science, and technology
How to Access Imagery and Carry Out Remote Sensing Analysis Using Landsat Data in a Browser
 How to Access Imagery and Carry Out Remote Sensing Analysis Using Landsat Data in a Browser Including Introduction to Remote Sensing Concepts Based on: igett Remote Sensing Concept Modules and GeoTech
Int n r t o r d o u d c u ti t on o n to t o Remote Sensing
 Introduction to Remote Sensing Definition of Remote Sensing Remote sensing refers to the activities of recording/observing/perceiving(sensing)objects or events at far away (remote) places. In remote sensing,
Plant Health Monitoring System Using Raspberry Pi
 Volume 119 No. 15 2018, 955-959 ISSN: 1314-3395 (on-line version) url: http://www.acadpubl.eu/hub/ http://www.acadpubl.eu/hub/ 1 Plant Health Monitoring System Using Raspberry Pi Jyotirmayee Dashᵃ *, Shubhangi
CPSC 4040/6040 Computer Graphics Images. Joshua Levine
 CPSC 4040/6040 Computer Graphics Images Joshua Levine levinej@clemson.edu Lecture 04 Displays and Optics Sept. 1, 2015 Slide Credits: Kenny A. Hunt Don House Torsten Möller Hanspeter Pfister Agenda Open
REMOTE SENSING. Topic 10 Fundamentals of Digital Multispectral Remote Sensing MULTISPECTRAL SCANNERS MULTISPECTRAL SCANNERS
 REMOTE SENSING Topic 10 Fundamentals of Digital Multispectral Remote Sensing Chapter 5: Lillesand and Keifer Chapter 6: Avery and Berlin MULTISPECTRAL SCANNERS Record EMR in a number of discrete portions
Miniaturized hyperspectral imaging cameras
 Fraunhofer IOSB KCM SpectroNet Collaboration Forum 2015 Miniaturized hyperspectral imaging cameras 1 Hyper spectral imaging (HSI) 2 HSI sensor types from imec filter layouts Linescan Snapshot Mosaic Snapshot
APPLICATION OF COMPUTER VISION FOR DETERMINATION OF SYMMETRICAL OBJECT POSITION IN THREE DIMENSIONAL SPACE
 APPLICATION OF COMPUTER VISION FOR DETERMINATION OF SYMMETRICAL OBJECT POSITION IN THREE DIMENSIONAL SPACE Najirah Umar 1 1 Jurusan Teknik Informatika, STMIK Handayani Makassar Email : najirah_stmikh@yahoo.com
Using Color-Infrared Imagery for Impervious Surface Analysis. Chris Behee City of Bellingham Planning & Community Development
 Using Color-Infrared Imagery for Impervious Surface Analysis. Chris Behee City of Bellingham Planning & Community Development NW GIS Users Group - March 18, 2005 Outline What is Color Infrared Imagery?
Remote Sensing. in Agriculture. Dr. Baqer Ramadhan CRP 514 Geographic Information System. Adel M. Al-Rebh G Term Paper.
 Remote Sensing in Agriculture Term Paper to Dr. Baqer Ramadhan CRP 514 Geographic Information System By Adel M. Al-Rebh G199325390 May 2012 Table of Contents 1.0 Introduction... 4 2.0 Objective... 4 3.0
Colour. Cunliffe & Elliott, Chapter 8 Chapman & Chapman, Digital Multimedia, Chapter 5. Autumn 2016 University of Stirling
 CSCU9N5: Multimedia and HCI 1 Colour What is colour? Human-centric view of colour Computer-centric view of colour Colour models Monitor production of colour Accurate colour reproduction Cunliffe & Elliott,
NON-PHOTOGRAPHIC SYSTEMS: Multispectral Scanners Medium and coarse resolution sensor comparisons: Landsat, SPOT, AVHRR and MODIS
 NON-PHOTOGRAPHIC SYSTEMS: Multispectral Scanners Medium and coarse resolution sensor comparisons: Landsat, SPOT, AVHRR and MODIS CLASSIFICATION OF NONPHOTOGRAPHIC REMOTE SENSORS PASSIVE ACTIVE DIGITAL
IMPROVING AUTOMOTIVE INSPECTION WITH LIGHT & COLOR MEASUREMENT SYSTEMS
 IMPROVING AUTOMOTIVE INSPECTION WITH LIGHT & COLOR MEASUREMENT SYSTEMS Matt Scholz, Radiant Vision Systems February 21, 2017 Matt.Scholz@RadiantVS.com 1 TODAY S SPEAKER Matt Scholz Business Leader, Automotive
For a long time I limited myself to one color as a form of discipline. Pablo Picasso. Color Image Processing
 For a long time I limited myself to one color as a form of discipline. Pablo Picasso Color Image Processing 1 Preview Motive - Color is a powerful descriptor that often simplifies object identification
the eye Light is electromagnetic radiation. The different wavelengths of the (to humans) visible part of the spectra make up the colors.
 visible part of the spectra make up the colors.") Computer Assisted Image Analysis TF 3p and MN1 5p Color Image Processing Lecture 14 GW 6 (suggested problem 6.25) How does the human eye perceive color? How can color be described using mathematics? Different
Computer Assisted Image Analysis TF 3p and MN1 5p Color Image Processing Lecture 14 GW 6 (suggested problem 6.25) How does the human eye perceive color? How can color be described using mathematics? Different
The New Rig Camera Process in TNTmips Pro 2018
 The New Rig Camera Process in TNTmips Pro 2018 Jack Paris, Ph.D. Paris Geospatial, LLC, 3017 Park Ave., Clovis, CA 93611, 559-291-2796, jparis37@msn.com Kinds of Digital Cameras for Drones Two kinds of
Texture characterization in DIRSIG
 Rochester Institute of Technology RIT Scholar Works Theses Thesis/Dissertation Collections 2001 Texture characterization in DIRSIG Christy Burtner Follow this and additional works at: http://scholarworks.rit.edu/theses
Introduction to Remote Sensing. Electromagnetic Energy. Data From Wave Phenomena. Electromagnetic Radiation (EMR) Electromagnetic Energy
 Electromagnetic Energy") A Basic Introduction to Remote Sensing (RS) ~~~~~~~~~~ Rev. Ronald J. Wasowski, C.S.C. Associate Professor of Environmental Science University of Portland Portland, Oregon 1 September 2015 Introduction
A Basic Introduction to Remote Sensing (RS) ~~~~~~~~~~ Rev. Ronald J. Wasowski, C.S.C. Associate Professor of Environmental Science University of Portland Portland, Oregon 1 September 2015 Introduction
A simulation tool for evaluating digital camera image quality
 A simulation tool for evaluating digital camera image quality Joyce Farrell ab, Feng Xiao b, Peter Catrysse b, Brian Wandell b a ImagEval Consulting LLC, P.O. Box 1648, Palo Alto, CA 94302-1648 b Stanford
Visual Perception. Overview. The Eye. Information Processing by Human Observer
 Visual Perception Spring 06 Instructor: K. J. Ray Liu ECE Department, Univ. of Maryland, College Park Overview Last Class Introduction to DIP/DVP applications and examples Image as a function Concepts
CS 565 Computer Vision. Nazar Khan PUCIT Lecture 4: Colour
 CS 565 Computer Vision Nazar Khan PUCIT Lecture 4: Colour Topics to be covered Motivation for Studying Colour Physical Background Biological Background Technical Colour Spaces Motivation Colour science
Assessment of Spatiotemporal Changes in Vegetation Cover using NDVI in The Dangs District, Gujarat
 Assessment of Spatiotemporal Changes in Vegetation Cover using NDVI in The Dangs District, Gujarat Using SAGA GIS and Quantum GIS Tutorial ID: IGET_CT_003 This tutorial has been developed by BVIEER as
MULTISPECTRAL IMAGE PROCESSING I
 TM1 TM2 337 TM3 TM4 TM5 TM6 Dr. Robert A. Schowengerdt TM7 Landsat Thematic Mapper (TM) multispectral images of desert and agriculture near Yuma, Arizona MULTISPECTRAL IMAGE PROCESSING I SENSORS Multispectral
LECTURE III: COLOR IN IMAGE & VIDEO DR. OUIEM BCHIR
 1 LECTURE III: COLOR IN IMAGE & VIDEO DR. OUIEM BCHIR 2 COLOR SCIENCE Light and Spectra Light is a narrow range of electromagnetic energy. Electromagnetic waves have the properties of frequency and wavelength.
Digitization and fundamental techniques
 Digitization and fundamental techniques Chapter 2.2-2.6 Robin Strand Centre for Image analysis Swedish University of Agricultural Sciences Uppsala University Outline Imaging Digitization Sampling Labeling
Colour. Why/How do we perceive colours? Electromagnetic Spectrum (1: visible is very small part 2: not all colours are present in the rainbow!
 Colour What is colour? Human-centric view of colour Computer-centric view of colour Colour models Monitor production of colour Accurate colour reproduction Colour Lecture (2 lectures)! Richardson, Chapter
Remote Sensing Platforms
 Types of Platforms Lighter-than-air Remote Sensing Platforms Free floating balloons Restricted by atmospheric conditions Used to acquire meteorological/atmospheric data Blimps/dirigibles Major role - news
APCAS/10/21 April 2010 ASIA AND PACIFIC COMMISSION ON AGRICULTURAL STATISTICS TWENTY-THIRD SESSION. Siem Reap, Cambodia, April 2010
 APCAS/10/21 April 2010 Agenda Item 8 ASIA AND PACIFIC COMMISSION ON AGRICULTURAL STATISTICS TWENTY-THIRD SESSION Siem Reap, Cambodia, 26-30 April 2010 The Use of Remote Sensing for Area Estimation by Robert
Digital Image Processing COSC 6380/4393. Lecture 20 Oct 25 th, 2018 Pranav Mantini
 Digital Image Processing COSC 6380/4393 Lecture 20 Oct 25 th, 2018 Pranav Mantini What is color? Color is a psychological property of our visual experiences when we look at objects and lights, not a physical
Chapter 16 Light Waves and Color
 Chapter 16 Light Waves and Color Lecture PowerPoint Copyright The McGraw-Hill Companies, Inc. Permission required for reproduction or display. What causes color? What causes reflection? What causes color?
Radiometric and Photometric Measurements with TAOS PhotoSensors
 INTELLIGENT OPTO SENSOR DESIGNER S NUMBER 21 NOTEBOOK Radiometric and Photometric Measurements with TAOS PhotoSensors contributed by Todd Bishop March 12, 2007 ABSTRACT Light Sensing applications use two
Application of Remote Sensing in the Monitoring of Marine pollution. By Atif Shahzad Institute of Environmental Studies University of Karachi
 Application of Remote Sensing in the Monitoring of Marine pollution By Atif Shahzad Institute of Environmental Studies University of Karachi Remote Sensing "Remote sensing is the science (and to some extent,
Introduction to Remote Sensing
 Introduction to Remote Sensing Daniel McInerney Urban Institute Ireland, University College Dublin, Richview Campus, Clonskeagh Drive, Dublin 14. 16th June 2009 Presentation Outline 1 2 Spaceborne Sensors
FOR 353: Air Photo Interpretation and Photogrammetry. Lecture 2. Electromagnetic Energy/Camera and Film characteristics
 FOR 353: Air Photo Interpretation and Photogrammetry Lecture 2 Electromagnetic Energy/Camera and Film characteristics Lecture Outline Electromagnetic Radiation Theory Digital vs. Analog (i.e. film ) Systems
Comparing Sound and Light. Light and Color. More complicated light. Seeing colors. Rods and cones
 Light and Color Eye perceives EM radiation of different wavelengths as different colors. Sensitive only to the range 4nm - 7 nm This is a narrow piece of the entire electromagnetic spectrum. Comparing
Digital Photogrammetry. Presented by: Dr. Hamid Ebadi
 Digital Photogrammetry Presented by: Dr. Hamid Ebadi Background First Generation Analog Photogrammetry Analytical Photogrammetry Digital Photogrammetry Photogrammetric Generations 2000 digital photogrammetry
Real life augmented reality for maintenance
 64 Int'l Conf. Modeling, Sim. and Vis. Methods MSV'16 Real life augmented reality for maintenance John Ahmet Erkoyuncu 1, Mosab Alrashed 1, Michela Dalle Mura 2, Rajkumar Roy 1, Gino Dini 2 1 Cranfield
Basic Hyperspectral Analysis Tutorial
 Basic Hyperspectral Analysis Tutorial This tutorial introduces you to visualization and interactive analysis tools for working with hyperspectral data. In this tutorial, you will: Analyze spectral profiles
Colour. Electromagnetic Spectrum (1: visible is very small part 2: not all colours are present in the rainbow!) Colour Lecture!
 Colour Lecture!") Colour Lecture! ITNP80: Multimedia 1 Colour What is colour? Human-centric view of colour Computer-centric view of colour Colour models Monitor production of colour Accurate colour reproduction Richardson,
Colour Lecture! ITNP80: Multimedia 1 Colour What is colour? Human-centric view of colour Computer-centric view of colour Colour models Monitor production of colour Accurate colour reproduction Richardson,
PLANET SURFACE REFLECTANCE PRODUCT
 PLANET SURFACE REFLECTANCE PRODUCT FEBRUARY 2018 SUPPORT@PLANET.COM PLANET.COM VERSION 1.0 TABLE OF CONTENTS 3 Product Description 3 Atmospheric Correction Methodology 5 Product Limitations 6 Product Assessment
Introduction to Remote Sensing Part 1
 Introduction to Remote Sensing Part 1 A Primer on Electromagnetic Radiation Digital, Multi-Spectral Imagery The 4 Resolutions Displaying Images Corrections and Enhancements Passive vs. Active Sensors Radar
MULTIPURPOSE QUADCOPTER SOLUTION FOR AGRICULTURE
 MULTIPURPOSE QUADCOPTER SOLUTION FOR AGRICULTURE Powered by COVERS UP TO 30HA AT 70M FLIGHT ALTITUDE PER BATTERY PHOTO & VIDEO FULL HD 1080P - 14MP 3-AXIS STABILIZATION INCLUDES NDVI & ZONING MAPS SERVICE
remote sensing? What are the remote sensing principles behind these Definition
 Introduction to remote sensing: Content (1/2) Definition: photogrammetry and remote sensing (PRS) Radiation sources: solar radiation (passive optical RS) earth emission (passive microwave or thermal infrared
MULTISPECTRAL AGRICULTURAL ASSESSMENT. Normalized Difference Vegetation Index. Federal Robotics INSPECTION & DOCUMENTATION
 MULTISPECTRAL AGRICULTURAL ASSESSMENT Normalized Difference Vegetation Index INSPECTION & DOCUMENTATION Federal Robotics Clearwater Dr. Amherst, New York 14228 716-221-4181 Sales@FedRobot.com www.fedrobot.com
Center for Advanced Land Management Information Technologies (CALMIT), School of Natural Resources, University of Nebraska-Lincoln
, School of Natural Resources, University of Nebraska-Lincoln") Geoffrey M. Henebry, Andrés Viña, and Anatoly A. Gitelson Center for Advanced Land Management Information Technologies (CALMIT), School of Natural Resources, University of Nebraska-Lincoln Introduction
Geoffrey M. Henebry, Andrés Viña, and Anatoly A. Gitelson Center for Advanced Land Management Information Technologies (CALMIT), School of Natural Resources, University of Nebraska-Lincoln Introduction
Enhancement of Multispectral Images and Vegetation Indices
 Enhancement of Multispectral Images and Vegetation Indices ERDAS Imagine 2016 Description: We will use ERDAS Imagine with multispectral images to learn how an image can be enhanced for better interpretation.
ME 6406 MACHINE VISION. Georgia Institute of Technology
 ME 6406 MACHINE VISION Georgia Institute of Technology Class Information Instructor Professor Kok-Meng Lee MARC 474 Office hours: Tues/Thurs 1:00-2:00 pm kokmeng.lee@me.gatech.edu (404)-894-7402 Class