Using Color-Infrared Imagery for Impervious Surface Analysis. Chris Behee City of Bellingham Planning & Community Development
|
|
|
- Gloria Gregory
- 5 years ago
- Views:
Transcription


1 Using Color-Infrared Imagery for Impervious Surface Analysis. Chris Behee City of Bellingham Planning & Community Development NW GIS Users Group - March 18, 2005
2 Outline What is Color Infrared Imagery? Vegetation Indices (NDVI) Building an Impervious Surface Layer Results Generating a natural-color image from Color IR


3 Spectral Ranges of Typical Aerial Imagery Nm ,000 1,100 1,200 ULTRAVIOLET VISIBLE LIGHT NEAR INFRARED FAR INFRARED Panchromatic Film Natural Color Black & White Color Infrared

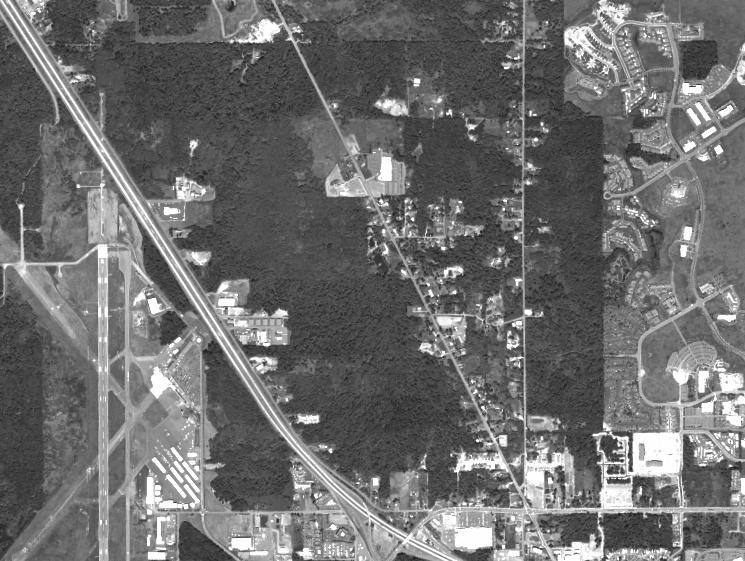
4 Black & White
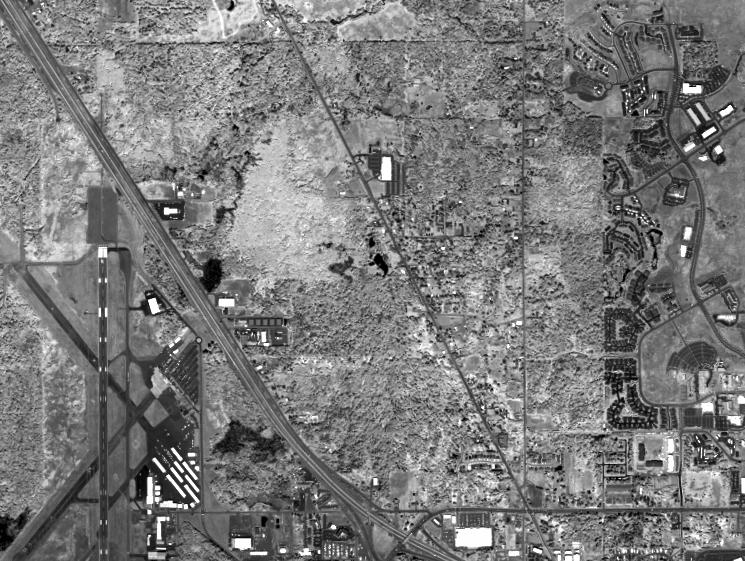
5 Natural Color
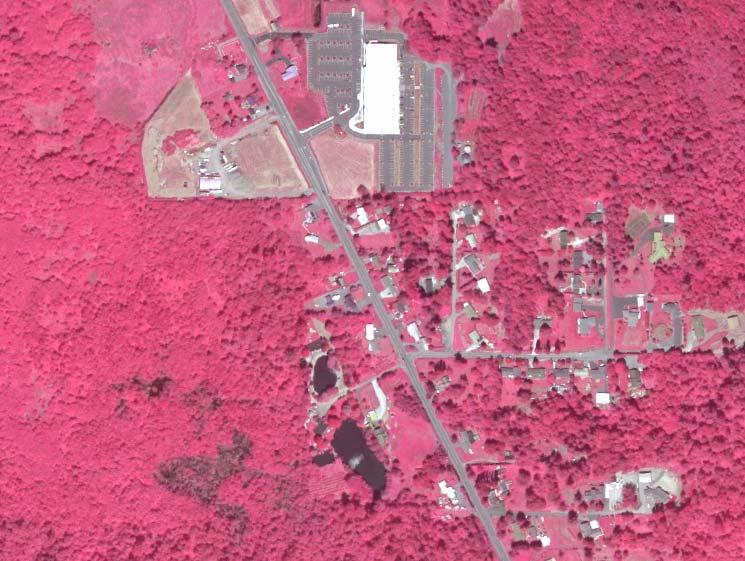
6 Color IR

 appears similar to the red light image. Vegetation index image.")

7 How a Vegetation Index Works Red light image. Red light is strongly absorbed by photosynthetic pigments (i.e. chlorophyll a) found in green leaves. Here we have an image of 2 green kale leaves and a 3rd kale leaf that yellowed with just a spot of green remaining. Near-infrared image. IR light either passes through or is reflected by live leaf tissues regardless of their color. Note that the background soil (non-vegetated area) appears similar to the red light image. Vegetation index image. If we subtract the red light image from the near-infrared image, everything that has about the same brightness level in the two wavelengths becomes dark, and everything that is brighter in the near-infrared becomes light. Notice that even the ribs of the leaves disappear since there is no chlorophyll in that part of the leaf. The small green patch is the only part of the yellowed leaf that is still visible.
8 For Example: Buildings & Pavement Living Vegetation Rocks/Soil/Dead Vegetation Near Infrared Band Red Band NIR - Red
9 Normalized Difference Vegetation Index (NDVI) This is one of the most commonly used indices. The difference in reflectances is divided by the sum of the two reflectances. This compensates for different amounts of incoming light and produces a number between 0 and 1. The typical range of actual values is about 0.1 for bare soils to 0.9 for dense vegetation. NDVI is thought to be more sensitive to low levels of vegetative cover NDVI = (NIR - Red) (NIR + Red)
10 Red Band
11 NIR Band
12 Veg Index
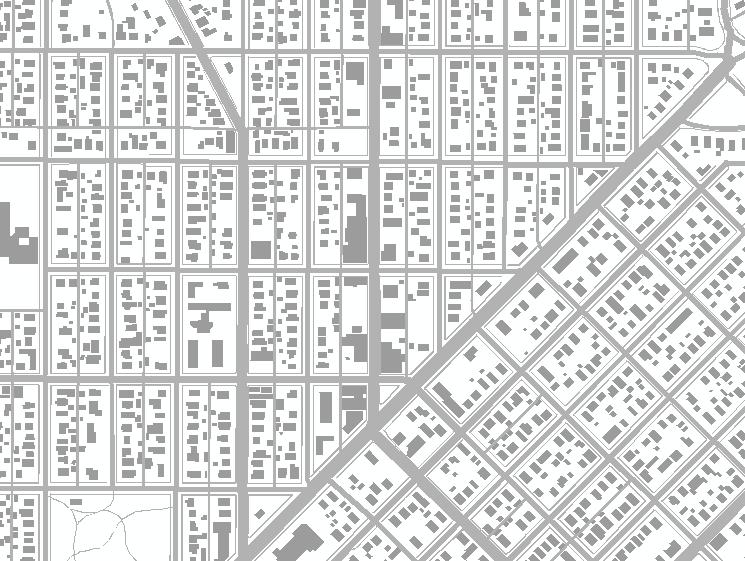
13 Building an Impervious Surface Layer Generate NDVI Vegetation Index (raster) Classify NDVI into vegetated and non-vegetated Assemble vector non-veg layers from GIS Create composite Impervious Surface layer

14 Values from -1 to +1 Raw NDVI

15 Classified NDVI Values stretched from 0 to 255 Then classified into vegetated and non-vegetated: 0 to 140 = non-vegetated 141 to 255 = vegetated
16 Classified NDVI
17 Alleys
18 Streets

19 Sidewalks & Trails
20 Buildings

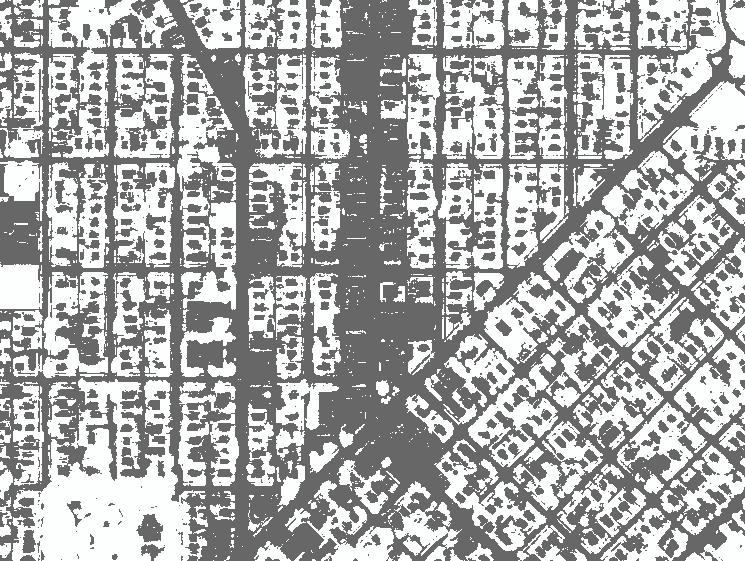
21 Composite Impervious Layer
22

23
24 Results Within city limits of Bellingham (28 square miles) 33% Impervious 58% Vegetated (pervious) 9 % Open water
25 Accuracy Based on sample of 100 one-acre sites. of impervious surfaces where GIS vector layers were available (City & UGA) of impervious surfaces where GIS vector layers were not available (imagery only). Spectral variability between image frames also contributes to misclassification of cover types.
26 Generating a Natural-Color Image from Color-Infrared GIS project managers are often forced to choose between purchasing natural-color imagery that will look like the real world and serve as an effective communication tool with the public; and color-infrared imagery that works well for classifying vegetation but is disorienting to the casual user. Here is a method for generating pseudo-natural color imagery from standard color-ir.
27 Pseudo-Natural Color Red = Band2 from Color IR composite (gamma corrected*) Green = 65% of Green (Band3) + 35% of Infrared (Band1) Blue = 85% of Green (Band3) - 15% of Infrared (Band1) 255 Original Gamma Corrected * Gamma correction provides a variably manipulated stretch to avoid disturbing purple and pink tones for water and other bluish features
28 /* AML for ArcInfo GIS - Using GRID /* /* Creates natural color image composite from color-infrared image composite /* /* Red = Band2 from ColorIR composite (gamma corrected) /* Green = 65% of Green (Band3) + 35% of Infrared (Band1) /* Blue = 85% of Green (Band3) - 15% of Infrared (Band1) /* /* Written July 15, C. Behee grid tempgc1x = reclass(slice(cirgc2,eqinterval,200,55,0,255),gamma.rm) tempgc2x = (icirgc3 * 0.85) + (cirgc1 * 0.15) tempgc3x = slice(((cirgc3 * 0.85) - (cirgc1 * 0.15)),eqinterval,200,55,0,255) makestack tempg list tempgc1x tempgc2x tempgc3x q gridimage tempg # %input%nc.tif tiff none /*kill tempg all &type Image conversion complete.

29 Natural Color
30 Color IR
31 Pseudo-Natural Color
32 Technical Specs Flown June 16-17, 2004 (West 1/2 flown June 16th between 11:00am and 12:30pm during -1.6 Tide) Coverage area includes City, UGA & Lake Whatcom Watershed (140 square miles total) Imagery collected and processed by Emerge Inc. Imagery delivered as 3-band digital geo-tiff format orthophotos. Airborne digital sensor with on-board differential GPS. Collected as 3-band color-infrared data using a 4000x4000 pixel CCD array. Band 1 = Near Infrared ( nanometers) Band 2 = Visual Red ( nm) Band 3 = Visual Green ( nm) Color depth = 8-bit (0-255) Image resolution = 0.6m (2 feet) Image spatial accuracy = +/- 1m for City and +/- 2m for Lake Whatcom Watershed. Projection = Washington Stateplane, North Zone, NAD27, feet. To facilitate natural-color display, a simulated blue band was created by City GIS staff. Questions regarding this project should be directed to Chris Behee cbehee@cob.org (Planning & Community Development)

33 Coverage Area with Basins Overlay Silver Squalicum Whatcom Lake Whatcom Padden Chuckanut
34 Reference Material: US Water Conservation Lab How a Vegetation Index Works Ray D. Jackson & Alfredo R. Huete Interpreting Vegetation Indices - Journal of Preventive Veterinary Medicine, 11 (1991) NASA/Jet Propulsion Laboratory General information and background - document illustrating and explaining the creation of pseudo-natural color images from LANDSAT and SPOT satellite imagery.
Making NDVI Images using the Sony F717 Nightshot Digital Camera and IR Filters and Software Created for Interpreting Digital Images.
 Making NDVI Images using the Sony F717 Nightshot Digital Camera and IR Filters and Software Created for Interpreting Digital Images Draft 1 John Pickle Museum of Science October 14, 2004 Digital Cameras
An NDVI image provides critical crop information that is not visible in an RGB or NIR image of the same scene. For example, plants may appear green
 Normalized Difference Vegetation Index (NDVI) Spectral Band calculation that uses the visible (RGB) and near-infrared (NIR) bands of the electromagnetic spectrum NDVI= + An NDVI image provides critical
Land Cover Analysis to Determine Areas of Clear-cut and Forest Cover in Olney, Montana. Geob 373 Remote Sensing. Dr Andreas Varhola, Kathry De Rego
 1 Land Cover Analysis to Determine Areas of Clear-cut and Forest Cover in Olney, Montana Geob 373 Remote Sensing Dr Andreas Varhola, Kathry De Rego Zhu an Lim (14292149) L2B 17 Apr 2016 2 Abstract Montana
Interpreting land surface features. SWAC module 3
 Interpreting land surface features SWAC module 3 Interpreting land surface features SWAC module 3 Different kinds of image Panchromatic image True-color image False-color image EMR : NASA Echo the bat
An Introduction to Remote Sensing & GIS. Introduction
 An Introduction to Remote Sensing & GIS Introduction Remote sensing is the measurement of object properties on Earth s surface using data acquired from aircraft and satellites. It attempts to measure something
Geo/SAT 2 INTRODUCTION TO REMOTE SENSING
 Geo/SAT 2 INTRODUCTION TO REMOTE SENSING Paul R. Baumann, Professor Emeritus State University of New York College at Oneonta Oneonta, New York 13820 USA COPYRIGHT 2008 Paul R. Baumann Introduction Remote
FOR 353: Air Photo Interpretation and Photogrammetry. Lecture 2. Electromagnetic Energy/Camera and Film characteristics
 FOR 353: Air Photo Interpretation and Photogrammetry Lecture 2 Electromagnetic Energy/Camera and Film characteristics Lecture Outline Electromagnetic Radiation Theory Digital vs. Analog (i.e. film ) Systems
Enhancement of Multispectral Images and Vegetation Indices
 Enhancement of Multispectral Images and Vegetation Indices ERDAS Imagine 2016 Description: We will use ERDAS Imagine with multispectral images to learn how an image can be enhanced for better interpretation.
Module 3 Introduction to GIS. Lecture 8 GIS data acquisition
 Module 3 Introduction to GIS Lecture 8 GIS data acquisition GIS workflow Data acquisition (geospatial data input) GPS Remote sensing (satellites, UAV s) LiDAR Digitized maps Attribute Data Management Data
The techniques with ERDAS IMAGINE include:
 The techniques with ERDAS IMAGINE include: 1. Data correction - radiometric and geometric correction 2. Radiometric enhancement - enhancing images based on the values of individual pixels 3. Spatial enhancement
The New Rig Camera Process in TNTmips Pro 2018
 The New Rig Camera Process in TNTmips Pro 2018 Jack Paris, Ph.D. Paris Geospatial, LLC, 3017 Park Ave., Clovis, CA 93611, 559-291-2796, jparis37@msn.com Kinds of Digital Cameras for Drones Two kinds of
Dirty REMOTE SENSING Lecture 3: First Steps in classifying Stuart Green Earthobservation.wordpress.com
 Dirty REMOTE SENSING Lecture 3: First Steps in classifying Stuart Green Earthobservation.wordpress.com Stuart.Green@Teagasc.ie You have your image, but is it any good? Is it full of cloud? Is it the right
GIS Data Collection. Remote Sensing
 GIS Data Collection Remote Sensing Data Collection Remote sensing Introduction Concepts Spectral signatures Resolutions: spectral, spatial, temporal Digital image processing (classification) Other systems
NRS 415 Remote Sensing of Environment
 NRS 415 Remote Sensing of Environment 1 High Oblique Perspective (Side) Low Oblique Perspective (Relief) 2 Aerial Perspective (See What s Hidden) An example of high spatial resolution true color remote
typical spectral signatures of photosynthetically active and non-photosynthetically active vegetation (Beeri et al., 2007)
") typical spectral signatures of photosynthetically active and non-photosynthetically active vegetation (Beeri et al., 2007) Xie, Y. et al. J Plant Ecol 2008 1:9-23; doi:10.1093/jpe/rtm005 Copyright restrictions
typical spectral signatures of photosynthetically active and non-photosynthetically active vegetation (Beeri et al., 2007) Xie, Y. et al. J Plant Ecol 2008 1:9-23; doi:10.1093/jpe/rtm005 Copyright restrictions
Important Missions. weather forecasting and monitoring communication navigation military earth resource observation LANDSAT SEASAT SPOT IRS
 Fundamentals of Remote Sensing Pranjit Kr. Sarma, Ph.D. Assistant Professor Department of Geography Mangaldai College Email: prangis@gmail.com Ph. No +91 94357 04398 Remote Sensing Remote sensing is defined
Spatial Analyst is an extension in ArcGIS specially designed for working with raster data.
 Spatial Analyst is an extension in ArcGIS specially designed for working with raster data. 1 Do you remember the difference between vector and raster data in GIS? 2 In Lesson 2 you learned about the difference
Present and future of marine production in Boka Kotorska
 Present and future of marine production in Boka Kotorska First results from satellite remote sensing for the breeding areas of filter feeders in the Bay of Kotor INTRODUCTION Environmental monitoring is
Lecture 2. Electromagnetic radiation principles. Units, image resolutions.
 NRMT 2270, Photogrammetry/Remote Sensing Lecture 2 Electromagnetic radiation principles. Units, image resolutions. Tomislav Sapic GIS Technologist Faculty of Natural Resources Management Lakehead University
Remote Sensing. The following figure is grey scale display of SPOT Panchromatic without stretching.
 Remote Sensing Objectives This unit will briefly explain display of remote sensing image, geometric correction, spatial enhancement, spectral enhancement and classification of remote sensing image. At
Lab 3: Image Enhancements I 65 pts Due > Canvas by 10pm
 Geo 448/548 Spring 2016 Lab 3: Image Enhancements I 65 pts Due > Canvas by 3/11 @ 10pm For this lab, you will learn different ways to calculate spectral vegetation indices (SVIs). These are one category
Lecture 13: Remotely Sensed Geospatial Data
 Lecture 13: Remotely Sensed Geospatial Data A. The Electromagnetic Spectrum: The electromagnetic spectrum (Figure 1) indicates the different forms of radiation (or simply stated light) emitted by nature.
COMPARISON OF INFORMATION CONTENTS OF HIGH RESOLUTION SPACE IMAGES
 COMPARISON OF INFORMATION CONTENTS OF HIGH RESOLUTION SPACE IMAGES H. Topan*, G. Büyüksalih*, K. Jacobsen ** * Karaelmas University Zonguldak, Turkey ** University of Hannover, Germany htopan@karaelmas.edu.tr,
SFR 406 Spring 2015 Lecture 7 Notes Film Types and Filters
 SFR 406 Spring 2015 Lecture 7 Notes Film Types and Filters 1. Film Resolution Introduction Resolution relates to the smallest size features that can be detected on the film. The resolving power is a related
Aerial photography and Remote Sensing. Bikini Atoll, 2013 (60 years after nuclear bomb testing)
") Aerial photography and Remote Sensing Bikini Atoll, 2013 (60 years after nuclear bomb testing) Computers have linked mapping techniques under the umbrella term : Geomatics includes all the following spatial
Aerial photography and Remote Sensing Bikini Atoll, 2013 (60 years after nuclear bomb testing) Computers have linked mapping techniques under the umbrella term : Geomatics includes all the following spatial
Introduction to Remote Sensing
 Introduction to Remote Sensing Spatial, spectral, temporal resolutions Image display alternatives Vegetation Indices Image classifications Image change detections Accuracy assessment Satellites & Air-Photos
Assessment of Spatiotemporal Changes in Vegetation Cover using NDVI in The Dangs District, Gujarat
 Assessment of Spatiotemporal Changes in Vegetation Cover using NDVI in The Dangs District, Gujarat Using SAGA GIS and Quantum GIS Tutorial ID: IGET_CT_003 This tutorial has been developed by BVIEER as
Introduction to Remote Sensing Fundamentals of Satellite Remote Sensing. Mads Olander Rasmussen
 Introduction to Remote Sensing Fundamentals of Satellite Remote Sensing Mads Olander Rasmussen (mora@dhi-gras.com) 01. Introduction to Remote Sensing DHI What is remote sensing? the art, science, and technology
Introduction to image processing for remote sensing: Practical examples
 Università degli studi di Roma Tor Vergata Corso di Telerilevamento e Diagnostica Elettromagnetica Anno accademico 2010/2011 Introduction to image processing for remote sensing: Practical examples Dr.
Image interpretation and analysis
 Image interpretation and analysis Grundlagen Fernerkundung, Geo 123.1, FS 2014 Lecture 7a Rogier de Jong Michael Schaepman Why are snow, foam, and clouds white? Why are snow, foam, and clouds white? Today
Center for Advanced Land Management Information Technologies (CALMIT), School of Natural Resources, University of Nebraska-Lincoln
, School of Natural Resources, University of Nebraska-Lincoln") Geoffrey M. Henebry, Andrés Viña, and Anatoly A. Gitelson Center for Advanced Land Management Information Technologies (CALMIT), School of Natural Resources, University of Nebraska-Lincoln Introduction
Geoffrey M. Henebry, Andrés Viña, and Anatoly A. Gitelson Center for Advanced Land Management Information Technologies (CALMIT), School of Natural Resources, University of Nebraska-Lincoln Introduction
Apply Colour Sequences to Enhance Filter Results. Operations. What Do I Need? Filter
 Apply Colour Sequences to Enhance Filter Results Operations What Do I Need? Filter Single band images from the SPOT and Landsat platforms can sometimes appear flat (i.e., they are low contrast images).
Geo/SAT 2 TROPICAL WET REALMS OF CENTRAL AFRICA, PART II
 Geo/SAT 2 TROPICAL WET REALMS OF CENTRAL AFRICA, PART II Paul R. Baumann Professor of Geography (Emeritus) State University of New York College at Oneonta Oneonta, New York 13820 USA COPYRIGHT 2009 Paul
Satellite Imagery and Remote Sensing. DeeDee Whitaker SW Guilford High EES & Chemistry
 Satellite Imagery and Remote Sensing DeeDee Whitaker SW Guilford High EES & Chemistry whitakd@gcsnc.com Outline What is remote sensing? How does remote sensing work? What role does the electromagnetic
Using QuickBird Imagery in ESRI Software Products
 Using QuickBird Imagery in ESRI Software Products TABLE OF CONTENTS 1. Introduction...2 Purpose Scope Image Stretching Color Guns 2. Imagery Usage Instructions...4 ArcView 3.x...4 ArcGIS...7 i Using QuickBird
Exercise 4-1 Image Exploration
 Exercise 4-1 Image Exploration With this exercise, we begin an extensive exploration of remotely sensed imagery and image processing techniques. Because remotely sensed imagery is a common source of data
Image interpretation I and II
 Image interpretation I and II Looking at satellite image, identifying different objects, according to scale and associated information and to communicate this information to others is what we call as IMAGE
Remote Sensing of Environment (RSE)
") I N T R O Introduction to Introduction to Remote Sensing T O R S E Remote Sensing of Environment (RSE) with TNTmips page 1 TNTview Before Getting Started Imagery acquired by airborne or satellite sensors
I N T R O Introduction to Introduction to Remote Sensing T O R S E Remote Sensing of Environment (RSE) with TNTmips page 1 TNTview Before Getting Started Imagery acquired by airborne or satellite sensors
Land cover change methods. Ned Horning
 Land cover change methods Ned Horning Version: 1.0 Creation Date: 2004-01-01 Revision Date: 2004-01-01 License: This document is licensed under a Creative Commons Attribution-Share Alike 3.0 Unported License.
Outline for today. Geography 411/611 Remote sensing: Principles and Applications. Remote sensing: RS for biogeochemical cycles
 Geography 411/611 Remote sensing: Principles and Applications Thomas Albright, Associate Professor Laboratory for Conservation Biogeography, Department of Geography & Program in Ecology, Evolution, & Conservation
Figure 1: Percent reflectance for various features, including the five spectra from Table 1, at different wavelengths from 0.4µm to 1.4µm.
 Section 1: The Electromagnetic Spectrum 1. The wavelength range that has the highest reflectance for broadleaf vegetation and needle leaf vegetation is 0.75µm to 1.05µm. 2. Dry soil can be distinguished
Summary. Introduction. Remote Sensing Basics. Selecting a Remote Sensing Product
 K. Dalsted, J.F. Paris, D.E. Clay, S.A. Clay, C.L. Reese, and J. Chang SSMG-40 Selecting the Appropriate Satellite Remote Sensing Product for Precision Farming Summary Given the large number of satellite
TRUESENSE SPARSE COLOR FILTER PATTERN OVERVIEW SEPTEMBER 30, 2013 APPLICATION NOTE REVISION 1.0
 TRUESENSE SPARSE COLOR FILTER PATTERN OVERVIEW SEPTEMBER 30, 2013 APPLICATION NOTE REVISION 1.0 TABLE OF CONTENTS Overview... 3 Color Filter Patterns... 3 Bayer CFA... 3 Sparse CFA... 3 Image Processing...
Monitoring agricultural plantations with remote sensing imagery
 MPRA Munich Personal RePEc Archive Monitoring agricultural plantations with remote sensing imagery Camelia Slave and Anca Rotman University of Agronomic Sciences and Veterinary Medicine - Bucharest Romania,
Remote Sensing Platforms
 Types of Platforms Lighter-than-air Remote Sensing Platforms Free floating balloons Restricted by atmospheric conditions Used to acquire meteorological/atmospheric data Blimps/dirigibles Major role - news
High Resolution Multi-spectral Imagery
 High Resolution Multi-spectral Imagery Jim Baily, AirAgronomics AIRAGRONOMICS Having been involved in broadacre agriculture until 2000 I perceived a need for a high resolution remote sensing service to
Image Band Transformations
 Image Band Transformations Content Band math Band ratios Vegetation Index Tasseled Cap Transform Principal Component Analysis (PCA) Decorrelation Stretch Image Band Transformation Purposes Image band transforms
Viewing New Hampshire from Space
 Viewing New Hampshire from Space A Bird s-eye View of the Granite State! Introduction Environmental changes are a major concern for researchers and policy makers today since these changes have both human
Spectral Signatures. Vegetation. 40 Soil. Water WAVELENGTH (microns)
") Spectral Signatures % REFLECTANCE VISIBLE NEAR INFRARED Vegetation Soil Water.5. WAVELENGTH (microns). Spectral Reflectance of Urban Materials 5 Parking Lot 5 (5=5%) Reflectance 5 5 5 5 5 Wavelength (nm)
Spectral Signatures % REFLECTANCE VISIBLE NEAR INFRARED Vegetation Soil Water.5. WAVELENGTH (microns). Spectral Reflectance of Urban Materials 5 Parking Lot 5 (5=5%) Reflectance 5 5 5 5 5 Wavelength (nm)
Saturation And Value Modulation (SVM): A New Method For Integrating Color And Grayscale Imagery
: A New Method For Integrating Color And Grayscale Imagery") 87 Saturation And Value Modulation (SVM): A New Method For Integrating Color And Grayscale Imagery By David W. Viljoen 1 and Jeff R. Harris 2 Geological Survey of Canada 615 Booth St. Ottawa, ON, K1A 0E9
87 Saturation And Value Modulation (SVM): A New Method For Integrating Color And Grayscale Imagery By David W. Viljoen 1 and Jeff R. Harris 2 Geological Survey of Canada 615 Booth St. Ottawa, ON, K1A 0E9
Introduction to Remote Sensing Part 1
 Introduction to Remote Sensing Part 1 A Primer on Electromagnetic Radiation Digital, Multi-Spectral Imagery The 4 Resolutions Displaying Images Corrections and Enhancements Passive vs. Active Sensors Radar
MULTISPECTRAL AGRICULTURAL ASSESSMENT. Normalized Difference Vegetation Index. Federal Robotics INSPECTION & DOCUMENTATION
 MULTISPECTRAL AGRICULTURAL ASSESSMENT Normalized Difference Vegetation Index INSPECTION & DOCUMENTATION Federal Robotics Clearwater Dr. Amherst, New York 14228 716-221-4181 Sales@FedRobot.com www.fedrobot.com
APCAS/10/21 April 2010 ASIA AND PACIFIC COMMISSION ON AGRICULTURAL STATISTICS TWENTY-THIRD SESSION. Siem Reap, Cambodia, April 2010
 APCAS/10/21 April 2010 Agenda Item 8 ASIA AND PACIFIC COMMISSION ON AGRICULTURAL STATISTICS TWENTY-THIRD SESSION Siem Reap, Cambodia, 26-30 April 2010 The Use of Remote Sensing for Area Estimation by Robert
IKONOS High Resolution Multispectral Scanner Sensor Characteristics
 High Spatial Resolution and Hyperspectral Scanners IKONOS High Resolution Multispectral Scanner Sensor Characteristics Launch Date View Angle Orbit 24 September 1999 Vandenberg Air Force Base, California,
746A27 Remote Sensing and GIS. Multi spectral, thermal and hyper spectral sensing and usage
 746A27 Remote Sensing and GIS Lecture 3 Multi spectral, thermal and hyper spectral sensing and usage Chandan Roy Guest Lecturer Department of Computer and Information Science Linköping University Multi
Course overview; Remote sensing introduction; Basics of image processing & Color theory
 GEOL 1460 /2461 Ramsey Introduction to Remote Sensing Fall, 2018 Course overview; Remote sensing introduction; Basics of image processing & Color theory Week #1: 29 August 2018 I. Syllabus Review we will
CanImage. (Landsat 7 Orthoimages at the 1: Scale) Standards and Specifications Edition 1.0
 Standards and Specifications Edition 1.0") CanImage (Landsat 7 Orthoimages at the 1:50 000 Scale) Standards and Specifications Edition 1.0 Centre for Topographic Information Customer Support Group 2144 King Street West, Suite 010 Sherbrooke, QC
CanImage (Landsat 7 Orthoimages at the 1:50 000 Scale) Standards and Specifications Edition 1.0 Centre for Topographic Information Customer Support Group 2144 King Street West, Suite 010 Sherbrooke, QC
Image Fusion. Pan Sharpening. Pan Sharpening. Pan Sharpening: ENVI. Multi-spectral and PAN. Magsud Mehdiyev Geoinfomatics Center, AIT
 1 Image Fusion Sensor Merging Magsud Mehdiyev Geoinfomatics Center, AIT Image Fusion is a combination of two or more different images to form a new image by using certain algorithms. ( Pohl et al 1998)
Urban Classification of Metro Manila for Seismic Risk Assessment using Satellite Images
 Urban Classification of Metro Manila for Seismic Risk Assessment using Satellite Images Fumio YAMAZAKI/ yamazaki@edm.bosai.go.jp Hajime MITOMI/ mitomi@edm.bosai.go.jp Yalkun YUSUF/ yalkun@edm.bosai.go.jp
Match the correct description with the correct term. Write the letter in the space provided.
 Skills Worksheet Directed Reading A Section: Interactions of Light with Matter REFLECTION Write the letter of the correct answer in the space provided. 1. What happens when light travels through a material
RGB colours: Display onscreen = RGB
 RGB colours: http://www.colorspire.com/rgb-color-wheel/ Display onscreen = RGB DIGITAL DATA and DISPLAY Myth: Most satellite images are not photos Photographs are also 'images', but digital images are
Evaluation of Sentinel-2 bands over the spectrum
 Evaluation of Sentinel-2 bands over the spectrum S.E. Hosseini Aria, M. Menenti, Geoscience and Remote sensing Department Delft University of Technology, Netherlands 1 outline ointroduction - Concept odata
Prelab Exercise. Stop and Think: Reflectance. % Reflectance. Absorbance Spectra of Photosynthetic Pigments. Contents
 Contents 1 Prelab Exercise 2 Stop and Think: Reflectance 3 The Role of Light in Carbohydrate Synthesis 4 Measuring Absorbance Prelab Exercise 1. Fill the Color field in the table below 2. Use plot.ly to
Separation of crop and vegetation based on Digital Image Processing
 Separation of crop and vegetation based on Digital Image Processing Mayank Singh Sakla 1, Palak Jain 2 1 M.TECH GEOMATICS student, CEPT UNIVERSITY 2 M.TECH GEOMATICS student, CEPT UNIVERSITY Word Limit
remote sensing? What are the remote sensing principles behind these Definition
 Introduction to remote sensing: Content (1/2) Definition: photogrammetry and remote sensing (PRS) Radiation sources: solar radiation (passive optical RS) earth emission (passive microwave or thermal infrared
Test 1: Example #2. Paul Avery PHY 3400 Feb. 15, Note: * indicates the correct answer.
 Test 1: Example #2 Paul Avery PHY 3400 Feb. 15, 1999 Note: * indicates the correct answer. 1. A red shirt illuminated with yellow light will appear (a) orange (b) green (c) blue (d) yellow * (e) red 2.
Digitization of Trail Network Using Remotely-Sensed Data in the CFB Suffield National Wildlife Area
 Digitization of Trail Network Using Remotely-Sensed Data in the CFB Suffield National Wildlife Area Brent Smith DLE 5-5 and Mike Tulis G3 GIS Technician Department of National Defence 27 March 2007 Introduction
Precision Remote Sensing and Image Processing for Precision Agriculture (PA)
") Precision Remote Sensing and Image Processing for Precision Agriculture (PA) Dr. Jack F. Paris Presented to Colorado State University, Fort Collins, CO October 20, 2005 Speaker s Current Activities: Consultant
Precision Remote Sensing and Image Processing for Precision Agriculture (PA) Dr. Jack F. Paris Presented to Colorado State University, Fort Collins, CO October 20, 2005 Speaker s Current Activities: Consultant
The Normal Baseline. Dick Gent Law of the Sea Division UK Hydrographic Office
 The Normal Baseline Dick Gent Law of the Sea Division UK Hydrographic Office 2 The normal baseline for measuring the breadth of the territorial sea is the low water line along the coast as marked on large
Lecture 6: Multispectral Earth Resource Satellites. The University at Albany Fall 2018 Geography and Planning
 Lecture 6: Multispectral Earth Resource Satellites The University at Albany Fall 2018 Geography and Planning Outline SPOT program and other moderate resolution systems High resolution satellite systems
Final Examination Introduction to Remote Sensing. Time: 1.5 hrs Max. Marks: 50. Section-I (50 x 1 = 50 Marks)
") Final Examination Introduction to Remote Sensing Time: 1.5 hrs Max. Marks: 50 Note: Attempt all questions. Section-I (50 x 1 = 50 Marks) 1... is the technology of acquiring information about the Earth's
Final Examination Introduction to Remote Sensing Time: 1.5 hrs Max. Marks: 50 Note: Attempt all questions. Section-I (50 x 1 = 50 Marks) 1... is the technology of acquiring information about the Earth's
Photogrammetry. Lecture 4 September 7, 2005
 Photogrammetry Lecture 4 September 7, 2005 What is Photogrammetry Photogrammetry is the art and science of making accurate measurements by means of aerial photography: Analog photogrammetry (using films:
Coral Reef Remote Sensing
 Coral Reef Remote Sensing Spectral, Spatial, Temporal Scaling Phillip Dustan Sensor Spatial Resolutio n Number of Bands Useful Bands coverage cycle Operation Landsat 80m 2 2 18 1972-97 Thematic 30m 7
Introduction to Remote Sensing. Electromagnetic Energy. Data From Wave Phenomena. Electromagnetic Radiation (EMR) Electromagnetic Energy
 Electromagnetic Energy") A Basic Introduction to Remote Sensing (RS) ~~~~~~~~~~ Rev. Ronald J. Wasowski, C.S.C. Associate Professor of Environmental Science University of Portland Portland, Oregon 1 September 2015 Introduction
A Basic Introduction to Remote Sensing (RS) ~~~~~~~~~~ Rev. Ronald J. Wasowski, C.S.C. Associate Professor of Environmental Science University of Portland Portland, Oregon 1 September 2015 Introduction
1. PHOTO ESSAY THE GREENING OF DETROIT, : PHYSICAL EFFECTS OF DECLINE
 1. PHOTO ESSAY THE GREENING OF DETROIT, 1975-1992: PHYSICAL EFFECTS OF DECLINE John D. Nystuen, The University of Michigan Rhonda Ryznar, The University of Michigan Thomas Wagner, Environmental Research
MSB Imagery Program FAQ v1
 MSB Imagery Program FAQ v1 (F)requently (A)sked (Q)uestions 9/22/2016 This document is intended to answer commonly asked questions related to the MSB Recurring Aerial Imagery Program. Table of Contents
High Spectral And Spatial Resolution Sensor Images for Mapping Urban Areas. Dar A. Roberts: UCSB Geography Martin Herold: University of Jena
 High Spectral And Spatial Resolution Sensor Images for Mapping Urban Areas Dar A. Roberts: UCSB Geography Martin Herold: University of Jena Outline Introduction Why urban, why imaging spectrometry? Urban
Remote Sensing and GIS
 Remote Sensing and GIS Atmosphere Reflected radiation, e.g. Visible Emitted radiation, e.g. Infrared Backscattered radiation, e.g. Radar (λ) Visible TIR Radar & Microwave 11/9/2017 Geo327G/386G, U Texas,
Remote Sensing for Rangeland Applications
 Remote Sensing for Rangeland Applications Jay Angerer Ecological Training June 16, 2012 Remote Sensing The term "remote sensing," first used in the United States in the 1950s by Ms. Evelyn Pruitt of the
Documenting Land Cover and Vegetation Productivity Changes in the NWT using the Landsat Satellite Archive
 Documenting Land Cover and Vegetation Productivity Changes in the NWT using the Landsat Satellite Archive Fraser, R.H 1, Olthof, I. 1, Deschamps, A. 1, Pregitzer, M. 1, Kokelj, S. 2, Lantz, T. 3,Wolfe,
COLOR FILTER PATTERNS
 Sparse Color Filter Pattern Overview Overview The Sparse Color Filter Pattern (or Sparse CFA) is a four-channel alternative for obtaining full-color images from a single image sensor. By adding panchromatic
A map says to you, 'Read me carefully, follow me closely, doubt me not.' It says, 'I am the Earth in the palm of your hand. Without me, you are alone
 A map says to you, 'Read me carefully, follow me closely, doubt me not.' It says, 'I am the Earth in the palm of your hand. Without me, you are alone and lost. Beryl Markham (West With the Night, 1946
Lesson 9: Multitemporal Analysis
 Lesson 9: Multitemporal Analysis Lesson Description Multitemporal change analyses require the identification of features and measurement of their change through time. In this lesson, we will examine vegetation
Remote Sensing Instruction Laboratory
 Laboratory Session 217513 Geographic Information System and Remote Sensing - 1 - Remote Sensing Instruction Laboratory Assist.Prof.Dr. Weerakaset Suanpaga Department of Civil Engineering, Faculty of Engineering
UAV-based Environmental Monitoring using Multi-spectral Imaging
 UAV-based Environmental Monitoring using Multi-spectral Imaging Martin De Biasio a, Thomas Arnold a, Raimund Leitner a, Gerald McGunnigle a, Richard Meester b a CTR Carinthian Tech Research AG, Europastrasse
MULTISPECTRAL IMAGE PROCESSING I
 TM1 TM2 337 TM3 TM4 TM5 TM6 Dr. Robert A. Schowengerdt TM7 Landsat Thematic Mapper (TM) multispectral images of desert and agriculture near Yuma, Arizona MULTISPECTRAL IMAGE PROCESSING I SENSORS Multispectral
Remote sensing in archaeology from optical to lidar. Krištof Oštir ModeLTER Scientific Research Centre of the Slovenian Academy of Sciences and Arts
 Remote sensing in archaeology from optical to lidar Krištof Oštir ModeLTER Scientific Research Centre of the Slovenian Academy of Sciences and Arts Introduction Optical remote sensing Systems Search for
OPTICAL RS IMAGE INTERPRETATION
 1 OPTICAL RS IMAGE INTERPRETATION Lecture 8 Visible Middle Infrared Image Bands 2 Data Processing Information data in a useable form Interpretation Visual AI (Machine learning) Recognition, Classification,
LAND SURFACE TEMPERATURE MONITORING THROUGH GIS TECHNOLOGY USING SATELLITE LANDSAT IMAGES
 Abstract LAND SURFACE TEMPERATURE MONITORING THROUGH GIS TECHNOLOGY USING SATELLITE LANDSAT IMAGES Aurelian Stelian HILA, Zoltán FERENCZ, Sorin Mihai CIMPEANU University of Agronomic Sciences and Veterinary
How to Access Imagery and Carry Out Remote Sensing Analysis Using Landsat Data in a Browser
 How to Access Imagery and Carry Out Remote Sensing Analysis Using Landsat Data in a Browser Including Introduction to Remote Sensing Concepts Based on: igett Remote Sensing Concept Modules and GeoTech
Remote Sensing Platforms
 Remote Sensing Platforms Remote Sensing Platforms - Introduction Allow observer and/or sensor to be above the target/phenomena of interest Two primary categories Aircraft Spacecraft Each type offers different
Fusion of Heterogeneous Multisensor Data
 Fusion of Heterogeneous Multisensor Data Karsten Schulz, Antje Thiele, Ulrich Thoennessen and Erich Cadario Research Institute for Optronics and Pattern Recognition Gutleuthausstrasse 1 D 76275 Ettlingen
An Introduction to Geomatics. Prepared by: Dr. Maher A. El-Hallaq خاص بطلبة مساق مقدمة في علم. Associate Professor of Surveying IUG
 An Introduction to Geomatics خاص بطلبة مساق مقدمة في علم الجيوماتكس Prepared by: Dr. Maher A. El-Hallaq Associate Professor of Surveying IUG 1 Airborne Imagery Dr. Maher A. El-Hallaq Associate Professor
Satellite/Aircraft Imaging Systems Imaging Sensors Standard scanner designs Image data formats
 CEE 6150: Digital Image Processing 1 Satellite/Aircraft Imaging Systems Imaging Sensors Standard scanner designs Image data formats CEE 6150: Digital Image Processing 2 CEE 6150: Digital Image Processing
HIGH RESOLUTION COLOR IMAGERY FOR ORTHOMAPS AND REMOTE SENSING. Author: Peter Fricker Director Product Management Image Sensors
 HIGH RESOLUTION COLOR IMAGERY FOR ORTHOMAPS AND REMOTE SENSING Author: Peter Fricker Director Product Management Image Sensors Co-Author: Tauno Saks Product Manager Airborne Data Acquisition Leica Geosystems
Introduction of Satellite Remote Sensing
 Introduction of Satellite Remote Sensing Spatial Resolution (Pixel size) Spectral Resolution (Bands) Resolutions of Remote Sensing 1. Spatial (what area and how detailed) 2. Spectral (what colors bands)
SEMI-SUPERVISED CLASSIFICATION OF LAND COVER BASED ON SPECTRAL REFLECTANCE DATA EXTRACTED FROM LISS IV IMAGE
 SEMI-SUPERVISED CLASSIFICATION OF LAND COVER BASED ON SPECTRAL REFLECTANCE DATA EXTRACTED FROM LISS IV IMAGE B. RayChaudhuri a *, A. Sarkar b, S. Bhattacharyya (nee Bhaumik) c a Department of Physics,
Monitoring of mine tailings using satellite and lidar data
 Surveying Monitoring of mine tailings using satellite and lidar data by Prevlan Chetty, Southern Mapping Geospatial This study looks into the use of high resolution satellite imagery from RapidEye and
Capture the invisible
 Capture the invisible A Capture the invisible The Sequoia multispectral sensor captures both visible and invisible images, providing calibrated data to optimally monitor the health and vigor of your crops.
REMOTE SENSING INTERPRETATION
 REMOTE SENSING INTERPRETATION Jan Clevers Centre for Geo-Information - WU Remote Sensing --> RS Sensor at a distance EARTH OBSERVATION EM energy Earth RS is a tool; one of the sources of information! 1