typical spectral signatures of photosynthetically active and non-photosynthetically active vegetation (Beeri et al., 2007)
|
|
|
- Jayson Clarke
- 6 years ago
- Views:
Transcription
1 typical spectral signatures of photosynthetically active and non-photosynthetically active vegetation (Beeri et al., 2007) Xie, Y. et al. J Plant Ecol :9-23; doi: /jpe/rtm005 Copyright restrictions may apply.
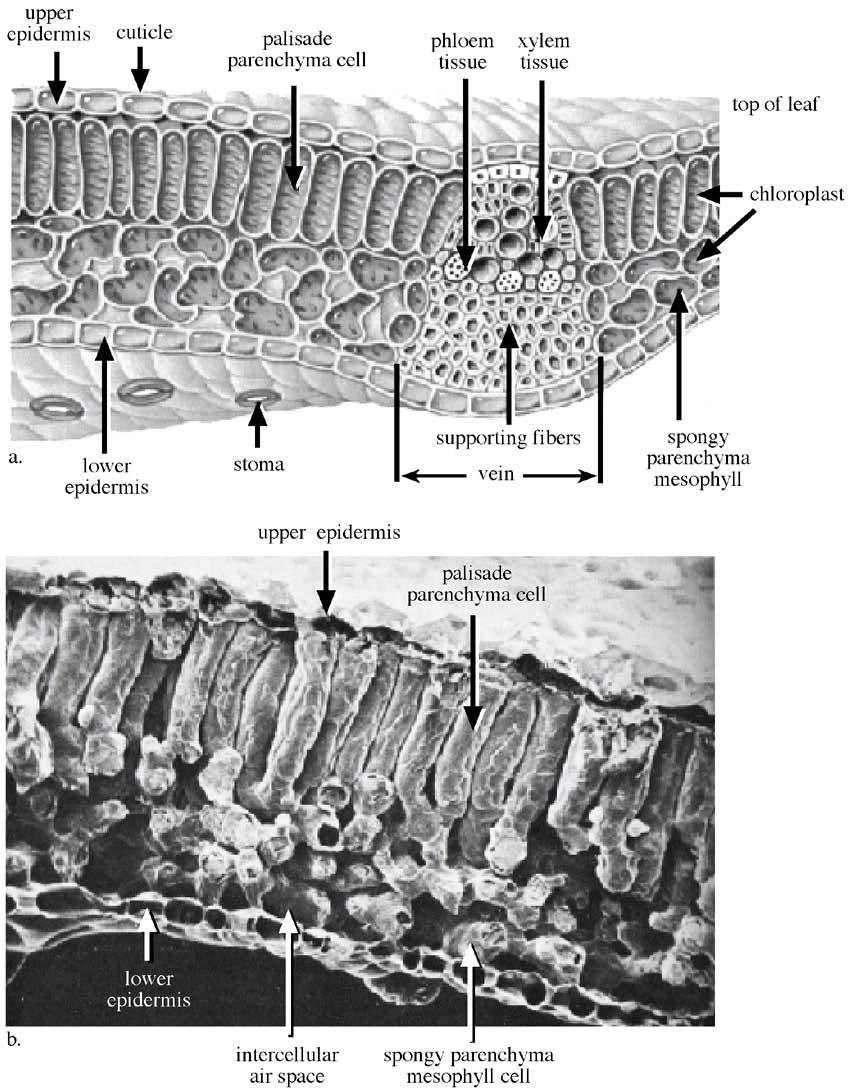
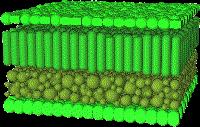
2 The Leaf

3 Chloroplasts sieve effect
4 Chlorophyll
5 Carotenes

6 Light Harvesting Complex II Chlorophyll A: green; Chlorophyll B: orange; Carotene: red; Structural proteins: yellow
7 Antennae Complex light Carotenoids Chlorophyll b Chlorophyll a Wavelength of max absorption shorter? 650 nm 670 nm Energy Gradient High P 680 Chl a longer low Reaction Center

8 Photosynthesis 6CO 2 +6H 2 O = C 6 H 12 O 6 + 6O 2 The Cornerstone of Life on this planet!
9
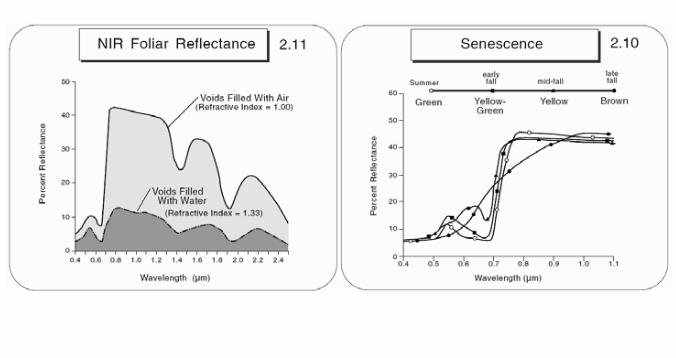
10 Vegetation Spectra
11
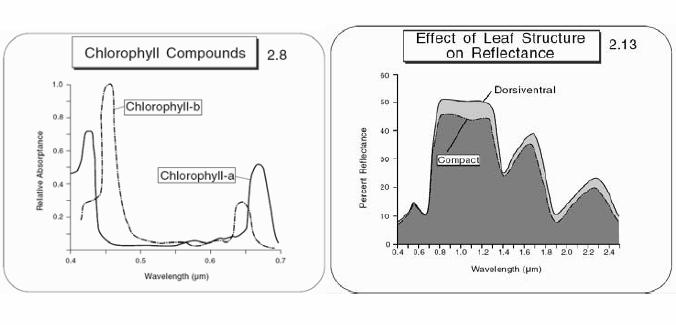
12 Chlorophyll b Chlorophyll a Absorption Spectra of Chlorophyll a and b Absorption Efficiency a violet blue green yellow red Wavelength, µm Phycocyanin Phycoerythrin Pigment Absorption Absorption Efficiency β-carotene b violet blue green yellow red Wavelength, µm
13 Cell Wall Constituents
14 Protein Constituents
15 Cellular Water
16 Leaf Biochemistry Leaf biochemistry pigments: chlorophyll a and b, α-carotene, and xanthophyll absorb in blue (& red for chlorophyll) Absorbed radiation converted into: heat energy, flourescence, or carbohydrates through photosynthesis Stored carbon!
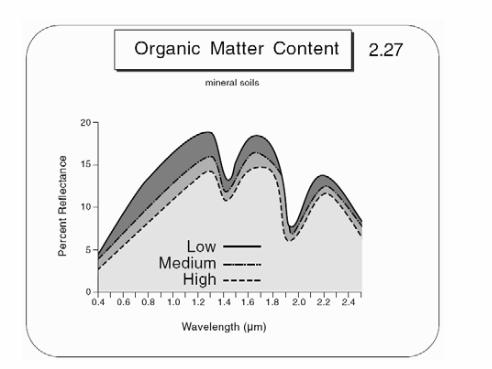
17 Chlorophyll Concentration Reduced absorption due to decreasing chlorophyll concentration
18 Chlorophyll Concentrations chlorophyll concentration
19
20
21 What about estimating Phytomass? First lets define phytomass: leaf area x leaf mass per unit area (m 2 x kg/m 2 = kg) Then lets introduce some surrogates for phytomass: Leaf area Index (LAI)- one sided leaf area per unit ground area Leaf area density (LAD) leaf area per unit volume Why use area instead of mass? Because estimating the leaf mass per unit area using remote sensing is very difficult. (How thick and heavy are the leaves?) Estimating area is more straight forward (remember areal mixtures)

22 Estimating Phytomass: Additive Reflectance
23 Leaf Area Estimation Most leaf area 0.5 reflectance(%) density 1 density 2 density 3 density 4 density 5 density 6 sunlit soil wavelength
24 Vegetation Indices Both red and NIR bands carry complementary information. How can we use that info and reduce noise introduced by other sources? NIR = 75 Red = 32 NIR/R = 2.34 Shaded area NIR =119 Red = 49 NIR/R = 2.38
25 Vegetation Indices Vegetation indices (VI) are combinations of spectral measurements in different wavelengths as recorded by a radiometric sensor. They aid in the analysis of multispectral image information by shrinking multidimensional data into a single value. Huete (1994) defined vegetation indices as: dimensonless, radiometric measures usually involving a ratio and/or linear combination of the red and near-infrared (NIR) portions of the spectrum. VI s may be computed from digital counts, at satellite radiances, apparent reflectances, land-leaving radiances, or surface reflectances and require no additional ancillary information other than the measurements themselves What VI s specifically measure remains unclear. They serve as indicators of relative growth and/or vigor of green vegetation, and are diagnostic of various biophysical vegetation parameters.
26 Vegetation Indices Vegetation indices (VI s) can be broken up into two basic categories: Ratio based indices VI s based on the ratio of two or more radiance, reflectance, or DN values (or linear combinations thereof). Difference indices VI s based on the difference between the spectral response of vegetation and the soil background.
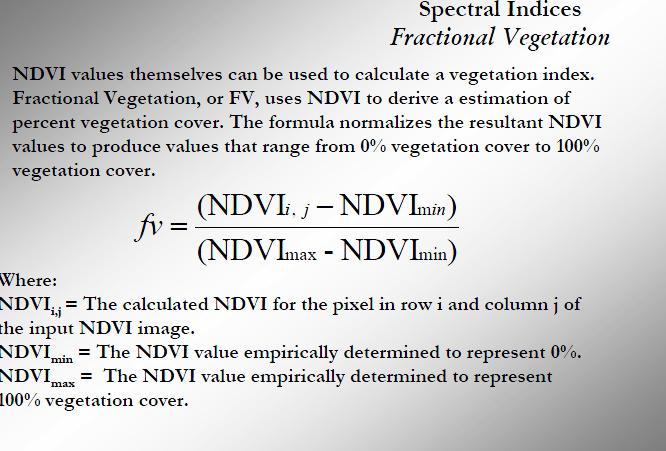
27 Common Ratio Indices Simple Ratio Index (SR) = NIR/R Normalized Difference Vegetation Index (NDVI) = NIR NIR + R R

28 The NDVI ratio capitalizes on the NIR and Red portions of the electromagnetic spectrum. The NIR portion of the spectrum is reflected by leaf tissue and recorded at the sensor, while the Red portion of the spectrum is absorbed by the chlorophyll present in the leaf tissue, thus reducing the reflectance of red light present at the sensor. The mathematical range of NDVI is -1 to 1. Thus, the contrast of reflectance and absorption by vegetation cover allows for the evaluation of vegetation present on the surface.

29 What bands should we ratio to reduce albedo effect and shadows? Assuming we want the vegetation to stand out, we should ratio a bright band with a dark band. Vegetation reflects darkly in the nm range, and brightly in the nm range. TM- TM4/TM3 is traditional MSS- MSS7/MSS5 is traditional
30
31
32
33
34
35 Common Difference Indices Perpendicular Vegetation Index (PVI) for a single soil background : 2 2 ( ) ( ) soil veg soil veg PVI = R R + NIR NIR Where R soil and NIR soil are the red and NIR reflecatance/radiance for the soil background.
36 Common Difference Indices (continued) Or the PVI for a multiple soil background : PVI = NIR ar b veg 1+ a Where a and b are the slope and intercept respectively of the universal soil line for the area veg 2
37 Typical Vegetation Index Response LAI, LAD But what about other objects within the field of view (FOV) of the sensor other than vegetation?
38
39 Red flux radiation NIR flux radiation Composite Canopy Reflectance Sensor Leaf area Density Shadow Sunlit Background
40 Composite Canopy Reflectance 0% veg. Cover; LAI = 0 100% veg. Cover; 1 leaf layer; LAI =1 1 m 2 of leaf area pixel 50% veg. Cover; 2 leaf layers; LAI = 1 33% veg. cover; 3 leaf layers; LAI = 1 Are the reflectances for these 3 pixels the same?
41 Composite Canopy Reflectance 100% vegetation cover LAI, LAD In this region, there is complete vegetion cover and differences are due to increasing canopy density- Additive Reflectance (multiple scattering)
42 How to separate.
43 Separability between classes can be evaluated by computing the M statistic. To compute the M statistic you must find the mean pixel value for each vegetation type you want to test and also the standard deviation. M = (μ1 μ2) / (σ1 + σ2) where μ1 = mean value of the reflectance for vegetation type 1 μ2 = mean value of the reflectance for vegetation type σ1 = the standard deviation of the reflectance for veg 1 σ2 = the standard deviation of the reflectance for veg 2 M > 1 indicates adequate separability You can merge classes that do not have good separability.
44 Using Remote Sensing to Map Vegetation Density on a Reclaimed Surface Mine Michael Shank Abstract. The West Virginia Department of Environmental Protection, in a cooperative agreement with the Office of Surface Mining s Charleston Field Office, is evaluating the utility of high resolution satellite images for characterizing vegetation patterns on reclaimed surface mines. This paper details the results of the first phase of this project, which sought to determine whether satellite images could be used to estimate percentage vegetation cover. This paper details a simple technique for estimating percent vegetation cover based on the widely-used Normalized Difference Vegetation Index (NDVI). NDVI exhibited a 0.96 correlation with percent vegetation cover for 34 reference samples collected on a 94 acre study area in southern West Virginia. Based on this relationship, a technique was developed that produced a mean error of 6.41% (+/- 2.68% at the 90% confidence level) when estimating percent cover for the 34 field sites.
45 Sample locations were identified from the satellite image by examining Normalized Difference Vegetation Index (NDVI) statistics calculated for a 5x5 moving window. NDVI is a common tool for identifying and characterizing vegetation. In this instance, NDVI served as a surrogate measure of vegetation density and homogeneity in the neighborhood surrounding an image pixel. The average NDVI value for the 5x5 window was used to stratify image pixels into ten groups representing conditions ranging from bare earth to fully revegetated. The graph depicts the relationship between NDVI and percent cover for the 34 field sites. The solid line traces the best fit equation calculated using simple linear regression: PCT_COVER = * NDVI The equation produces an R 2 value of Residual errors for this model ranged from 0 to 20.27%, averaging 6.78% for the entire sample set (RMSE was 8.66%). A linear regression established a relationship between NDVI and Percent cover. With this relationship they were able to map % Cover.
46
47
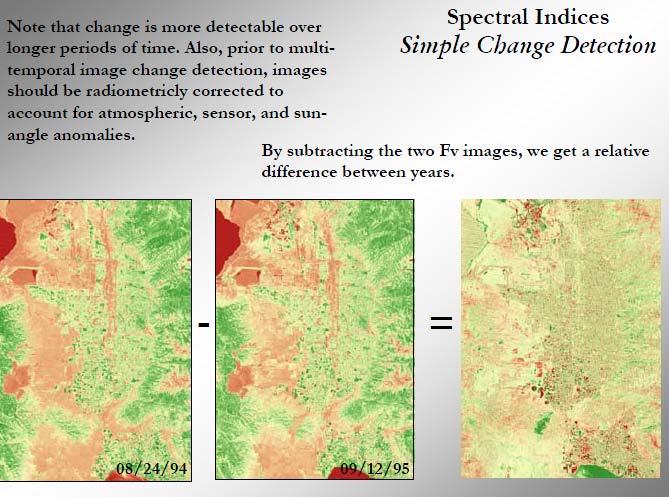
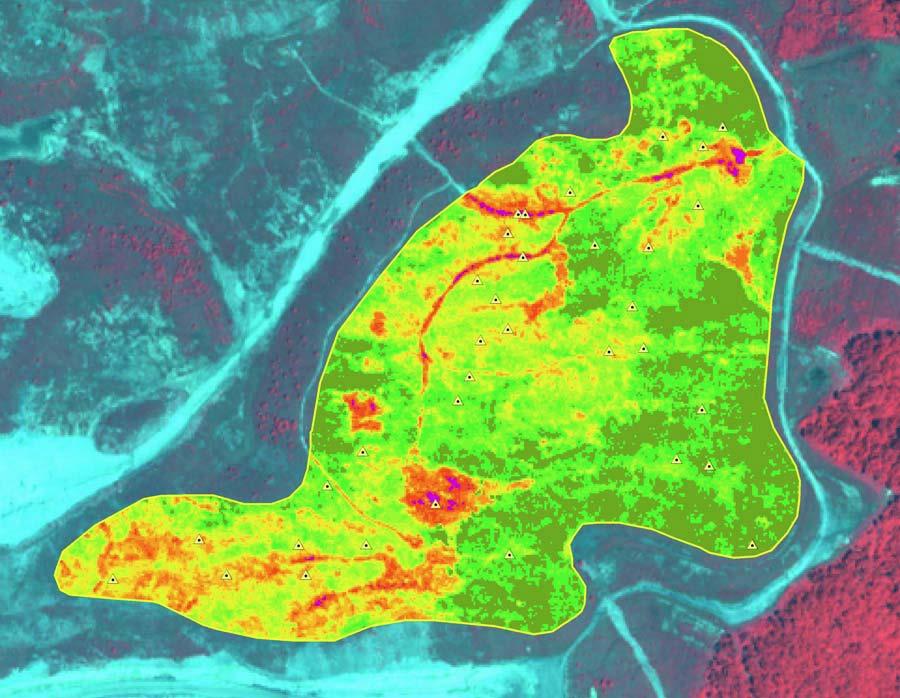
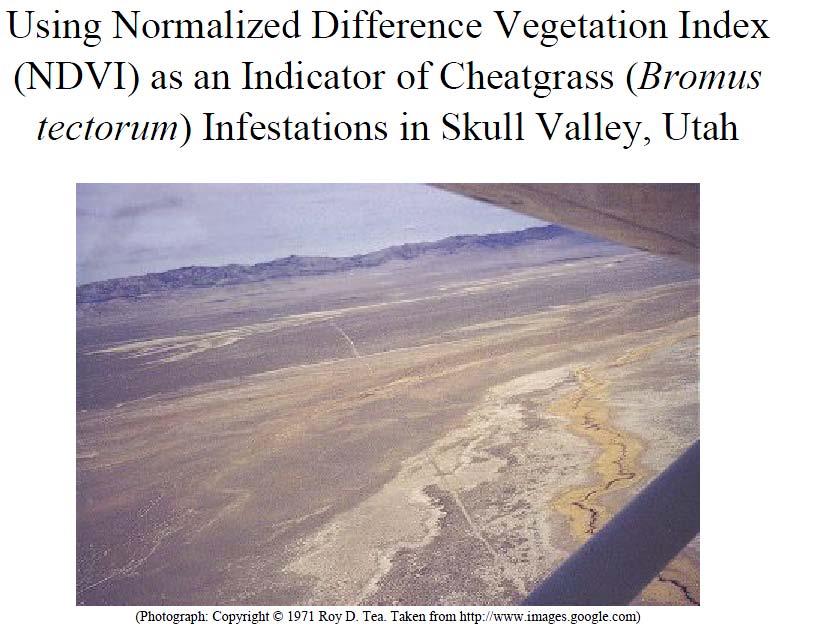
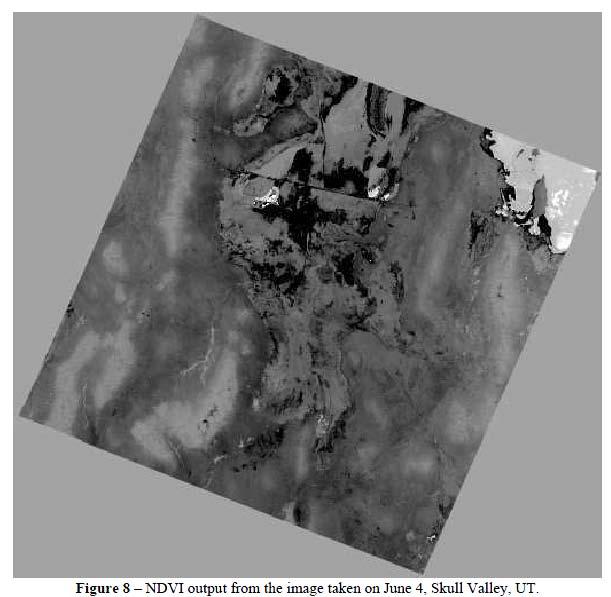
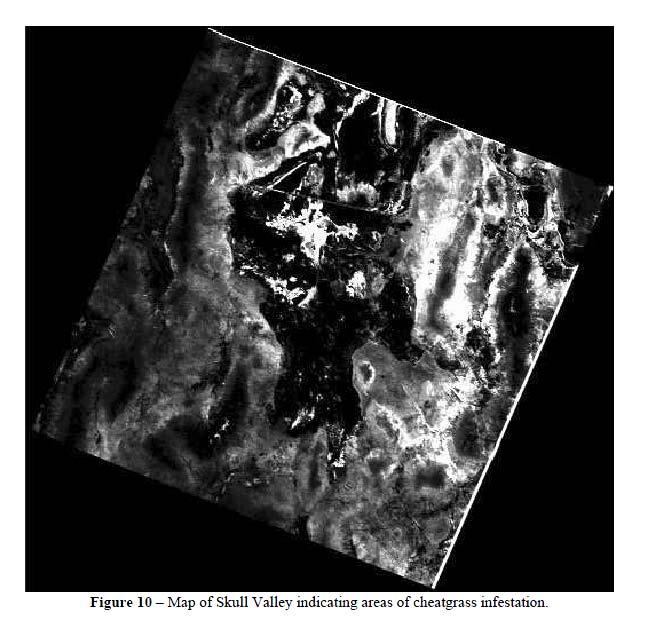
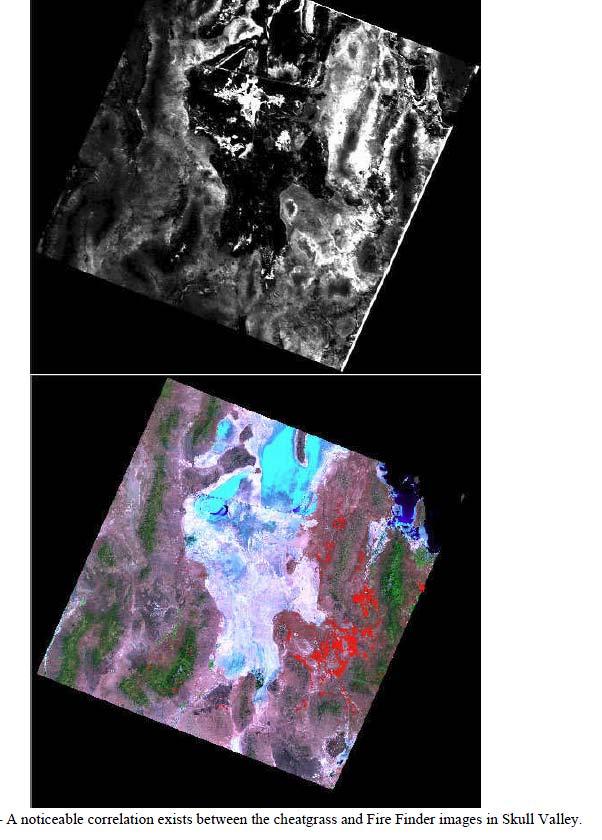
48 A comparative method using Normalized Difference Vegetation Index (NDVI) has been developed for monitoring the presence and spread of cheatgrass. This method was applied on Landsat-7 ETM data for Skull Valley, UT. NDVI values of the area from June 4, were subtracted from NDVI values from May 3 of the same year in order to indicate the presence and area of cheatgrass infestations in the valley. Correlations between the NDVI and Fire Finder outputs of the area, which were both generated in ERDAS Imagine s Model Maker, are visually apparent resulting from the mutualistic relationship between cheatgreass and wildfire.
49
50
51
52
53
54 Reality Though these transformations show us trends we could not see, they are far from perfect. Researchers have found that none of these indices effectively deals with atmospheric error, and some critics question whether interpretable results can even be obtained with out a pixel by pixel atmospheric correction. Understanding basic Vegetation indices does help to solidify the concept of the soil line.
55
56
57 a Many sensors provide imagery for producing VI (e.g. NDVI) that is calculated from the bands in the visible and near-infrared regions. Features Vegetation mapping applications a Products (sensors) Landsat TM Medium to coarse spatial resolution with multispectral data (120 m for thermal infrared band and 30 m for multispectral bands) from Landsat 4 and 5 (1982 to present). Each scene covers an area of 185 x 185 km. Temporal resolution is 16 days. Regional scale mapping, usually capable of mapping vegetation at community level. Landsat ETM+ (Landsat 7) Medium to coarse spatial resolution with multispectral data (15 m for panchromatic band, 60 m for thermal infrared and 30 m for multispectral bands) (1999 to present). Each scene covers an area of 185 km x 185 km. Temporal resolution is 16 days. Regional scale mapping, usually capable of mapping vegetation at community level or some dominant species can be possibly discriminated. SPOT MODIS AVHRR IKONOS QuickBird ASTER AVIRIS A full range of medium spatial resolutions from 20 m down to 2.5 m, and SPOT VGT with coarse spatial resolution of 1 km. Each scene covers 60 x 60 km for HRV/HRVIR/HRG and 1000 x 1000 km (or 2000 x 2000 km) for VGT. SPOT 1, 2, 3, 4 and 5 were launched in the year of 1986, 1990, 1993, 1998 and 2002, respectively. SPOT 1 and 3 are not providing data now. Low spatial resolution ( m) and multispectral data from the Terra Satellite (2000 to present) and Aqua Satellite (2002 to present). Revisit interval is around 1 2 days. Suitable for vegetation mapping at a large scale. The swath is 2330 km (cross track) by 10 km (along track at nadir). 1-km GSD with multispectral data from the NOAA satellite series (1980 to present). The approximate scene size is 2400 x 6400 km It collects high-resolution imagery at 1 m (panchromatic) and 4 m (multispectral bands, including red, green, blue and near infrared) resolution. The revisit rate is 3 5 days (off-nadir). The single scene is 11 x 11 km. High resolution ( m) and panchromatic and multispectral imagery from a constellation of spacecraft. Single scene area is 16.5 x 16.5 km. Revisit frequency is around days depending on latitude. Medium spatial resolution (15 90 m) image with 14 spectral bands from the Terra Satellite (2000 to present). Visible to near-infrared bands have a spatial resolution of 15 m, 30 m for short wave infrared bands and 90 m for thermal infrared bands. Airborne sensor collecting images with 224 spectral bands from visible, near infrared to short wave infrared. Depending on the satellite platforms and latitude of data collected, the spatial resolution ranges from meters to dozens of meters and the swath ranges from several kilometers to dozens of kilometers. Regional scale usually capable of mapping vegetation at community level or species level or global/national/regional scale (from VGT) mapping land cover types (i.e. urban area, classes of vegetation, water area, etc.). Mapping at global, continental or national scale. Suitable for mapping land cover types (i.e. urban area, classes of vegetation, water area, etc.). Global, continental or national scale mapping. Suitable for mapping land cover types (i.e. urban area, classes of vegetation, water area, etc.). Local to regional scale vegetation mapping at species or community level or can be used to validate other classification result. Local to regional scale vegetation mapping at species or community level or used to validate vegetation cover extracted from other images. Regional to national scale vegetation mapping at species or community level. At local to regional scale usually capable of mapping vegetation at community level or species level. As images are carried out as onetime operations, data are not readily available as it is obtained on an as needs basis. Hyperion It collects hyperspectral image with 220 bands ranging from visible to short wave infrared. The spatial resolution is 30 m. Data available since At regional scale capable of mapping vegetation at community level or species level.
58 Preprocessing of satellite images prior to vegetation extraction is essential to remove noise and increase the interpretability of image data. This is particularly true when a time series of imagery is used or when an area is encompassed by many images since it is essentially important to make these images compatible spatially and spectrally. The ideal result of image preprocessing is that all images after image preprocessing should appear as if they were acquired from the same sensor. Two types of preprocessing include: Radiometric and Geometric. Radiometric correction of remote sensing data normally involves the process of correcting radiometric errors or distortions of digital images to improve the fidelity of the brightness values. Factors such as seasonal phenology, ground conditions and atmospheric conditions can contribute to variability in multi-temporal spectral responses that may have little to do with the remote sensed objects themselves. It is mandatory to differentiate real changes from noises through radiometric correction in cases where the spectral signals are not sufficiently strong to minimize the effects of these complicating factors. Several methods are available to make radioactive corrections. Some of them are based on complex mathematical models that describe the main interactions involved. However, the values of certain parameters (i.e. the atmospheric composition) must be known before applying them. Other radiometric correction methods are based on the observations of reference targets (e.g. water or desert land) whose radiometry is known.
59 Geometric correction is aimed to avoid geometric distortions from a distorted image and is achieved by establishing the relationship between the image coordinate system and the geographic coordinate system using the calibration data of the sensor, the measured data of position and altitude and the ground control points. Therefore, geometric correction usually includes the selection of a map projection system and the co-registration of satellite image data with other data that are used as the calibration reference. The outcome of geometric correction should obtain an error within plus or minus one pixel of its true position, which allows for accurate spatial assessments and measurements of the data generated from the satellite imagery. The first-order transformation and the nearest neighbor resampling of the uncorrected imagery are among those popularly adopted methods in geometric correction. The first-order transformation, also known as the linear transformation, applies the standard linear equation (y = mx + b) to the X and Y coordinates of the ground control points. The nearest neighbor resampling method uses the value of the closest pixel to assign to the output pixel value and thus transfers original data values without averaging them. Therefore, the extremes and subtleties of the data values are not lost
60
61 It is very common that the same vegetation type on ground may have different spectral features in remote sensed images. Also, different vegetation types may possess similar spectra, which makes very hard to obtain accurate classification results either using the traditional unsupervised classification or supervised classification. Searching for improved classification methods is always a hot research topic. All classification methods are derived from the traditional methods which provide the basic principles and techniques for image classification. Unsupervised, supervised, etc
62
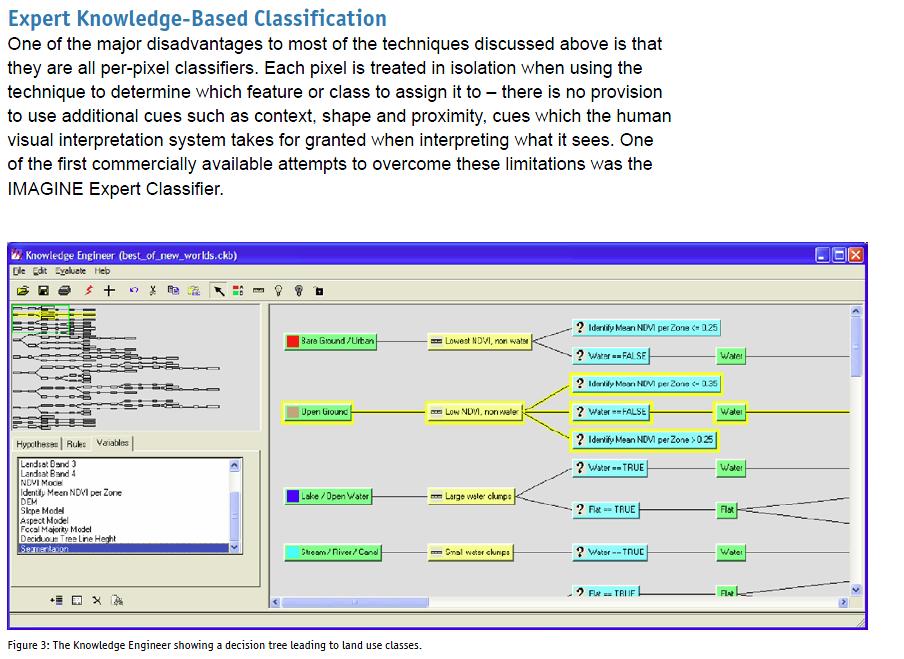
63 The expert classification software provides a rules-based approach to multispectral image classification, post-classification refinement and GIS modeling. In essence, an expert classification system is a hierarchy of rules, or a decision tree that describes the conditions for when a set of low level constituent information gets abstracted into a set of high level informational classes. The constituent information consists of user-defined variables and includes raster imagery, vector layers, spatial models, external programs and simple scalars. A rule is a conditional statement, or list of conditional statements, about the variable s data values and/or attributes that determine an informational component or hypotheses. Multiple rules and hypotheses can be linked together into a hierarchy that ultimately describes a final set of target informational classes or terminal hypotheses. Confidence values associated with each condition are also combined to provide a confidence image corresponding to the final output classified image. LIMITATIONS: While the Expert Classification approach does enable ancillary data layers to be taken into consideration, it is still not truly an object based means of image classification (rules are still evaluated on a pixel by pixel basis). Additionally, it is extremely user-intensive to build the models an expert is required in the morphology of the features to be extracted, which also then need to be turned into graphical models and programs that feed complex rules, all of which need building up from the components available. Even once a knowledge base has been constructed it may not be easily transportable to other images (different locations, dates, etc).
64 Lab 2. Decision (Classification) Tree Represented as a set of hierarchically-arranged decision rules (i.e., tree-branch-leaf) Could be generated by knowledge engineering, neural network, or statistic methods. S-Plus: Tree Models: successively splitting the data to form homogeneous subsets.
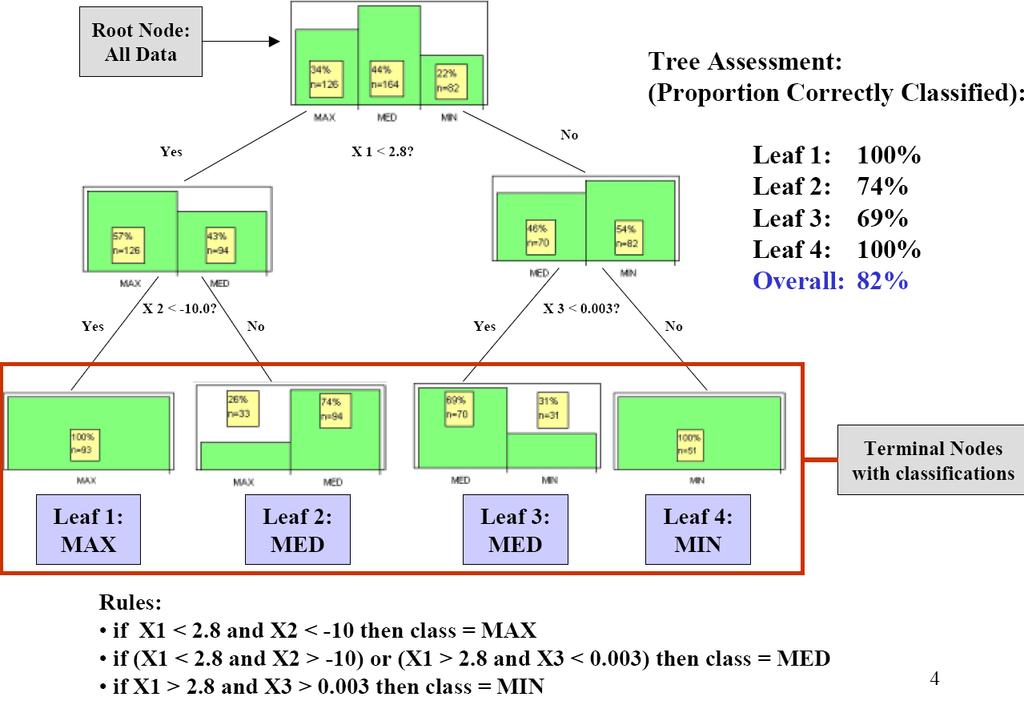
65 Classification Example
Dirty REMOTE SENSING Lecture 3: First Steps in classifying Stuart Green Earthobservation.wordpress.com
 Dirty REMOTE SENSING Lecture 3: First Steps in classifying Stuart Green Earthobservation.wordpress.com Stuart.Green@Teagasc.ie You have your image, but is it any good? Is it full of cloud? Is it the right
Lecture 2. Electromagnetic radiation principles. Units, image resolutions.
 NRMT 2270, Photogrammetry/Remote Sensing Lecture 2 Electromagnetic radiation principles. Units, image resolutions. Tomislav Sapic GIS Technologist Faculty of Natural Resources Management Lakehead University
IKONOS High Resolution Multispectral Scanner Sensor Characteristics
 High Spatial Resolution and Hyperspectral Scanners IKONOS High Resolution Multispectral Scanner Sensor Characteristics Launch Date View Angle Orbit 24 September 1999 Vandenberg Air Force Base, California,
Remote Sensing for Rangeland Applications
 Remote Sensing for Rangeland Applications Jay Angerer Ecological Training June 16, 2012 Remote Sensing The term "remote sensing," first used in the United States in the 1950s by Ms. Evelyn Pruitt of the
An Introduction to Remote Sensing & GIS. Introduction
 An Introduction to Remote Sensing & GIS Introduction Remote sensing is the measurement of object properties on Earth s surface using data acquired from aircraft and satellites. It attempts to measure something
NON-PHOTOGRAPHIC SYSTEMS: Multispectral Scanners Medium and coarse resolution sensor comparisons: Landsat, SPOT, AVHRR and MODIS
 NON-PHOTOGRAPHIC SYSTEMS: Multispectral Scanners Medium and coarse resolution sensor comparisons: Landsat, SPOT, AVHRR and MODIS CLASSIFICATION OF NONPHOTOGRAPHIC REMOTE SENSORS PASSIVE ACTIVE DIGITAL
REMOTE SENSING. Topic 10 Fundamentals of Digital Multispectral Remote Sensing MULTISPECTRAL SCANNERS MULTISPECTRAL SCANNERS
 REMOTE SENSING Topic 10 Fundamentals of Digital Multispectral Remote Sensing Chapter 5: Lillesand and Keifer Chapter 6: Avery and Berlin MULTISPECTRAL SCANNERS Record EMR in a number of discrete portions
Int n r t o r d o u d c u ti t on o n to t o Remote Sensing
 Introduction to Remote Sensing Definition of Remote Sensing Remote sensing refers to the activities of recording/observing/perceiving(sensing)objects or events at far away (remote) places. In remote sensing,
The techniques with ERDAS IMAGINE include:
 The techniques with ERDAS IMAGINE include: 1. Data correction - radiometric and geometric correction 2. Radiometric enhancement - enhancing images based on the values of individual pixels 3. Spatial enhancement
An Introduction to Geomatics. Prepared by: Dr. Maher A. El-Hallaq خاص بطلبة مساق مقدمة في علم. Associate Professor of Surveying IUG
 An Introduction to Geomatics خاص بطلبة مساق مقدمة في علم الجيوماتكس Prepared by: Dr. Maher A. El-Hallaq Associate Professor of Surveying IUG 1 Airborne Imagery Dr. Maher A. El-Hallaq Associate Professor
Introduction to Remote Sensing
 Introduction to Remote Sensing Spatial, spectral, temporal resolutions Image display alternatives Vegetation Indices Image classifications Image change detections Accuracy assessment Satellites & Air-Photos
Lecture 6: Multispectral Earth Resource Satellites. The University at Albany Fall 2018 Geography and Planning
 Lecture 6: Multispectral Earth Resource Satellites The University at Albany Fall 2018 Geography and Planning Outline SPOT program and other moderate resolution systems High resolution satellite systems
Spectral Signatures. Vegetation. 40 Soil. Water WAVELENGTH (microns)
") Spectral Signatures % REFLECTANCE VISIBLE NEAR INFRARED Vegetation Soil Water.5. WAVELENGTH (microns). Spectral Reflectance of Urban Materials 5 Parking Lot 5 (5=5%) Reflectance 5 5 5 5 5 Wavelength (nm)
Spectral Signatures % REFLECTANCE VISIBLE NEAR INFRARED Vegetation Soil Water.5. WAVELENGTH (microns). Spectral Reflectance of Urban Materials 5 Parking Lot 5 (5=5%) Reflectance 5 5 5 5 5 Wavelength (nm)
746A27 Remote Sensing and GIS. Multi spectral, thermal and hyper spectral sensing and usage
 746A27 Remote Sensing and GIS Lecture 3 Multi spectral, thermal and hyper spectral sensing and usage Chandan Roy Guest Lecturer Department of Computer and Information Science Linköping University Multi
APCAS/10/21 April 2010 ASIA AND PACIFIC COMMISSION ON AGRICULTURAL STATISTICS TWENTY-THIRD SESSION. Siem Reap, Cambodia, April 2010
 APCAS/10/21 April 2010 Agenda Item 8 ASIA AND PACIFIC COMMISSION ON AGRICULTURAL STATISTICS TWENTY-THIRD SESSION Siem Reap, Cambodia, 26-30 April 2010 The Use of Remote Sensing for Area Estimation by Robert
An NDVI image provides critical crop information that is not visible in an RGB or NIR image of the same scene. For example, plants may appear green
 Normalized Difference Vegetation Index (NDVI) Spectral Band calculation that uses the visible (RGB) and near-infrared (NIR) bands of the electromagnetic spectrum NDVI= + An NDVI image provides critical
Introduction to Remote Sensing Part 1
 Introduction to Remote Sensing Part 1 A Primer on Electromagnetic Radiation Digital, Multi-Spectral Imagery The 4 Resolutions Displaying Images Corrections and Enhancements Passive vs. Active Sensors Radar
Introduction to Remote Sensing Fundamentals of Satellite Remote Sensing. Mads Olander Rasmussen
 Introduction to Remote Sensing Fundamentals of Satellite Remote Sensing Mads Olander Rasmussen (mora@dhi-gras.com) 01. Introduction to Remote Sensing DHI What is remote sensing? the art, science, and technology
Remote Sensing. The following figure is grey scale display of SPOT Panchromatic without stretching.
 Remote Sensing Objectives This unit will briefly explain display of remote sensing image, geometric correction, spatial enhancement, spectral enhancement and classification of remote sensing image. At
Ground Truth for Calibrating Optical Imagery to Reflectance
 Visual Information Solutions Ground Truth for Calibrating Optical Imagery to Reflectance The by: Thomas Harris Whitepaper Introduction: Atmospheric Effects on Optical Imagery Remote sensing of the Earth
Introduction of Satellite Remote Sensing
 Introduction of Satellite Remote Sensing Spatial Resolution (Pixel size) Spectral Resolution (Bands) Resolutions of Remote Sensing 1. Spatial (what area and how detailed) 2. Spectral (what colors bands)
GIS Data Collection. Remote Sensing
 GIS Data Collection Remote Sensing Data Collection Remote sensing Introduction Concepts Spectral signatures Resolutions: spectral, spatial, temporal Digital image processing (classification) Other systems
Coral Reef Remote Sensing
 Coral Reef Remote Sensing Spectral, Spatial, Temporal Scaling Phillip Dustan Sensor Spatial Resolutio n Number of Bands Useful Bands coverage cycle Operation Landsat 80m 2 2 18 1972-97 Thematic 30m 7
Introduction to Remote Sensing
 Introduction to Remote Sensing Outline Remote Sensing Defined Resolution Electromagnetic Energy (EMR) Types Interpretation Applications Remote Sensing Defined Remote Sensing is: The art and science of
Lecture 13: Remotely Sensed Geospatial Data
 Lecture 13: Remotely Sensed Geospatial Data A. The Electromagnetic Spectrum: The electromagnetic spectrum (Figure 1) indicates the different forms of radiation (or simply stated light) emitted by nature.
Course overview; Remote sensing introduction; Basics of image processing & Color theory
 GEOL 1460 /2461 Ramsey Introduction to Remote Sensing Fall, 2018 Course overview; Remote sensing introduction; Basics of image processing & Color theory Week #1: 29 August 2018 I. Syllabus Review we will
Evaluation of Sentinel-2 bands over the spectrum
 Evaluation of Sentinel-2 bands over the spectrum S.E. Hosseini Aria, M. Menenti, Geoscience and Remote sensing Department Delft University of Technology, Netherlands 1 outline ointroduction - Concept odata
Remote Sensing. Odyssey 7 Jun 2012 Benjamin Post
 Remote Sensing Odyssey 7 Jun 2012 Benjamin Post Definitions Applications Physics Image Processing Classifiers Ancillary Data Data Sources Related Concepts Outline Big Picture Definitions Remote Sensing
Interpreting land surface features. SWAC module 3
 Interpreting land surface features SWAC module 3 Interpreting land surface features SWAC module 3 Different kinds of image Panchromatic image True-color image False-color image EMR : NASA Echo the bat
Remote sensing in archaeology from optical to lidar. Krištof Oštir ModeLTER Scientific Research Centre of the Slovenian Academy of Sciences and Arts
 Remote sensing in archaeology from optical to lidar Krištof Oštir ModeLTER Scientific Research Centre of the Slovenian Academy of Sciences and Arts Introduction Optical remote sensing Systems Search for
Some Basic Concepts of Remote Sensing. Lecture 2 August 31, 2005
 Some Basic Concepts of Remote Sensing Lecture 2 August 31, 2005 What is remote sensing Remote Sensing: remote sensing is science of acquiring, processing, and interpreting images and related data that
1. Theory of remote sensing and spectrum
 1. Theory of remote sensing and spectrum 7 August 2014 ONUMA Takumi Outline of Presentation Electromagnetic wave and wavelength Sensor type Spectrum Spatial resolution Spectral resolution Mineral mapping
Image Band Transformations
 Image Band Transformations Content Band math Band ratios Vegetation Index Tasseled Cap Transform Principal Component Analysis (PCA) Decorrelation Stretch Image Band Transformation Purposes Image band transforms
Development of normalized vegetation, soil and water indices derived from satellite remote sensing data
 Development of normalized vegetation, soil and water indices derived from satellite remote sensing data Takeuchi, W. & Yasuoka, Y. IIS/UT, Japan E-mail: wataru@iis.u-tokyo.ac.jp Nov. 25th, 2004 ACRS2004
Enhancement of Multispectral Images and Vegetation Indices
 Enhancement of Multispectral Images and Vegetation Indices ERDAS Imagine 2016 Description: We will use ERDAS Imagine with multispectral images to learn how an image can be enhanced for better interpretation.
Remote Sensing Platforms
 Types of Platforms Lighter-than-air Remote Sensing Platforms Free floating balloons Restricted by atmospheric conditions Used to acquire meteorological/atmospheric data Blimps/dirigibles Major role - news
Preparing Remote Sensing Data for Natural Resources Mapping (image enhancement, rectifications )
") Preparing Remote Sensing Data for Natural Resources Mapping (image enhancement, rectifications ) Why is this important What are the major approaches Examples of digital image enhancement Follow up exercises
Preparing Remote Sensing Data for Natural Resources Mapping (image enhancement, rectifications ) Why is this important What are the major approaches Examples of digital image enhancement Follow up exercises
A broad survey of remote sensing applications for many environmental disciplines
 1 2 3 4 A broad survey of remote sensing applications for many environmental disciplines 5 6 7 8 9 10 1. First definition is very general and applies to many types of remote sensing. You use your eyes
Image interpretation and analysis
 Image interpretation and analysis Grundlagen Fernerkundung, Geo 123.1, FS 2014 Lecture 7a Rogier de Jong Michael Schaepman Why are snow, foam, and clouds white? Why are snow, foam, and clouds white? Today
CHARACTERISTICS OF REMOTELY SENSED IMAGERY. Radiometric Resolution
 CHARACTERISTICS OF REMOTELY SENSED IMAGERY Radiometric Resolution There are a number of ways in which images can differ. One set of important differences relate to the various resolutions that images express.
NORMALIZING ASTER DATA USING MODIS PRODUCTS FOR LAND COVER CLASSIFICATION
 NORMALIZING ASTER DATA USING MODIS PRODUCTS FOR LAND COVER CLASSIFICATION F. Gao a, b, *, J. G. Masek a a Biospheric Sciences Branch, NASA Goddard Space Flight Center, Greenbelt, MD 20771, USA b Earth
Module 3 Introduction to GIS. Lecture 8 GIS data acquisition
 Module 3 Introduction to GIS Lecture 8 GIS data acquisition GIS workflow Data acquisition (geospatial data input) GPS Remote sensing (satellites, UAV s) LiDAR Digitized maps Attribute Data Management Data
Blacksburg, VA July 24 th 30 th, 2010 Remote Sensing Page 1. A condensed overview. For our purposes
 A condensed overview George McLeod Prepared by: With support from: NSF DUE-0903270 in partnership with: Geospatial Technician Education Through Virginia s Community Colleges (GTEVCC) The art and science
IMPROVEMENT IN THE DETECTION OF LAND COVER CLASSES USING THE WORLDVIEW-2 IMAGERY
 IMPROVEMENT IN THE DETECTION OF LAND COVER CLASSES USING THE WORLDVIEW-2 IMAGERY Ahmed Elsharkawy 1,2, Mohamed Elhabiby 1,3 & Naser El-Sheimy 1,4 1 Dept. of Geomatics Engineering, University of Calgary
Evaluation of FLAASH atmospheric correction. Note. Note no SAMBA/10/12. Authors. Øystein Rudjord and Øivind Due Trier
 Evaluation of FLAASH atmospheric correction Note Note no Authors SAMBA/10/12 Øystein Rudjord and Øivind Due Trier Date 16 February 2012 Norsk Regnesentral Norsk Regnesentral (Norwegian Computing Center,
Atmospheric Correction (including ATCOR)
") Technical Specifications Atmospheric Correction (including ATCOR) The data obtained by optical satellite sensors with high spatial resolution has become an invaluable tool for many groups interested in
Technical Specifications Atmospheric Correction (including ATCOR) The data obtained by optical satellite sensors with high spatial resolution has become an invaluable tool for many groups interested in
Sommersemester Prof. Dr. Christoph Kleinn Institut für Waldinventur und Waldwachstum Arbeitsbereich Fernerkundung und Waldinventur.
 Basics of Remote Sensing Some literature references Franklin, SE 2001 Remote Sensing for Sustainable Forest Management Lewis Publishers 407p Lillesand, Kiefer 2000 Remote Sensing and Image Interpretation
Aral Sea profile Selection of area 24 February April May 1998
 250 km Aral Sea profile 1960 1960 1985 1986 1987 1988 1989 1990 1991 1992 1993 1994 1995 1996 1997 1998 2010? Selection of area Area of interest Kzyl-Orda Dried seabed 185 km Syrdarya river Aral Sea Salt
Chapter 5. Preprocessing in remote sensing
 Chapter 5. Preprocessing in remote sensing 5.1 Introduction Remote sensing images from spaceborne sensors with resolutions from 1 km to < 1 m become more and more available at reasonable costs. For some
Application of GIS to Fast Track Planning and Monitoring of Development Agenda
 Application of GIS to Fast Track Planning and Monitoring of Development Agenda Radiometric, Atmospheric & Geometric Preprocessing of Optical Remote Sensing 13 17 June 2018 Outline 1. Why pre-process remotely
The New Rig Camera Process in TNTmips Pro 2018
 The New Rig Camera Process in TNTmips Pro 2018 Jack Paris, Ph.D. Paris Geospatial, LLC, 3017 Park Ave., Clovis, CA 93611, 559-291-2796, jparis37@msn.com Kinds of Digital Cameras for Drones Two kinds of
Textbook, Chapter 15 Textbook, Chapter 10 (only 10.6)
") AGOG 484/584/ APLN 551 Fall 2018 Concept definition Applications Instruments and platforms Techniques to process hyperspectral data A problem of mixed pixels and spectral unmixing Reading Textbook, Chapter
AGOG 484/584/ APLN 551 Fall 2018 Concept definition Applications Instruments and platforms Techniques to process hyperspectral data A problem of mixed pixels and spectral unmixing Reading Textbook, Chapter
Geo/SAT 2 TROPICAL WET REALMS OF CENTRAL AFRICA, PART II
 Geo/SAT 2 TROPICAL WET REALMS OF CENTRAL AFRICA, PART II Paul R. Baumann Professor of Geography (Emeritus) State University of New York College at Oneonta Oneonta, New York 13820 USA COPYRIGHT 2009 Paul
The studies began when the Tiros satellites (1960) provided man s first synoptic view of the Earth s weather systems.
 provided man s first synoptic view of the Earth s weather systems.") Remote sensing of the Earth from orbital altitudes was recognized in the mid-1960 s as a potential technique for obtaining information important for the effective use and conservation of natural resources.
Remote sensing of the Earth from orbital altitudes was recognized in the mid-1960 s as a potential technique for obtaining information important for the effective use and conservation of natural resources.
In late April of 1986 a nuclear accident damaged a reactor at the Chernobyl nuclear
 CHERNOBYL NUCLEAR POWER PLANT ACCIDENT Long Term Effects on Land Use Patterns Project Introduction: In late April of 1986 a nuclear accident damaged a reactor at the Chernobyl nuclear power plant in Ukraine.
Remote sensing image correction
 Remote sensing image correction Introductory readings remote sensing http://www.microimages.com/documentation/tutorials/introrse.pdf 1 Preprocessing Digital Image Processing of satellite images can be
Center for Advanced Land Management Information Technologies (CALMIT), School of Natural Resources, University of Nebraska-Lincoln
, School of Natural Resources, University of Nebraska-Lincoln") Geoffrey M. Henebry, Andrés Viña, and Anatoly A. Gitelson Center for Advanced Land Management Information Technologies (CALMIT), School of Natural Resources, University of Nebraska-Lincoln Introduction
Geoffrey M. Henebry, Andrés Viña, and Anatoly A. Gitelson Center for Advanced Land Management Information Technologies (CALMIT), School of Natural Resources, University of Nebraska-Lincoln Introduction
Satellite data processing and analysis: Examples and practical considerations
 Satellite data processing and analysis: Examples and practical considerations Dániel Kristóf Ottó Petrik, Róbert Pataki, András Kolesár International LCLUC Regional Science Meeting in Central Europe Sopron,
Using Color-Infrared Imagery for Impervious Surface Analysis. Chris Behee City of Bellingham Planning & Community Development
 Using Color-Infrared Imagery for Impervious Surface Analysis. Chris Behee City of Bellingham Planning & Community Development NW GIS Users Group - March 18, 2005 Outline What is Color Infrared Imagery?
How to Access Imagery and Carry Out Remote Sensing Analysis Using Landsat Data in a Browser
 How to Access Imagery and Carry Out Remote Sensing Analysis Using Landsat Data in a Browser Including Introduction to Remote Sensing Concepts Based on: igett Remote Sensing Concept Modules and GeoTech
Lab 6: Multispectral Image Processing Using Band Ratios
 Lab 6: Multispectral Image Processing Using Band Ratios due Dec. 11, 2017 Goals: 1. To learn about the spectral characteristics of vegetation and geologic materials. 2. To experiment with vegetation indices
The studies began when the Tiros satellites (1960) provided man s first synoptic view of the Earth s weather systems.
 provided man s first synoptic view of the Earth s weather systems.") Remote sensing of the Earth from orbital altitudes was recognized in the mid-1960 s as a potential technique for obtaining information important for the effective use and conservation of natural resources.
Remote sensing of the Earth from orbital altitudes was recognized in the mid-1960 s as a potential technique for obtaining information important for the effective use and conservation of natural resources.
Comprehensive Vicarious Calibration and Characterization of a Small Satellite Constellation Using the Specular Array Calibration (SPARC) Method
 Method") This document does not contain technology or Technical Data controlled under either the U.S. International Traffic in Arms Regulations or the U.S. Export Administration Regulations. Comprehensive Vicarious
This document does not contain technology or Technical Data controlled under either the U.S. International Traffic in Arms Regulations or the U.S. Export Administration Regulations. Comprehensive Vicarious
Geo/SAT 2 INTRODUCTION TO REMOTE SENSING
 Geo/SAT 2 INTRODUCTION TO REMOTE SENSING Paul R. Baumann, Professor Emeritus State University of New York College at Oneonta Oneonta, New York 13820 USA COPYRIGHT 2008 Paul R. Baumann Introduction Remote
Introduction to Remote Sensing
 Introduction to Remote Sensing Daniel McInerney Urban Institute Ireland, University College Dublin, Richview Campus, Clonskeagh Drive, Dublin 14. 16th June 2009 Presentation Outline 1 2 Spaceborne Sensors
University of Texas at San Antonio EES 5053 Term Project CORRELATION BETWEEN NDVI AND SURFACE TEMPERATURES USING LANDSAT ETM + IMAGERY NEWFEL MAZARI
 University of Texas at San Antonio EES 5053 Term Project CORRELATION BETWEEN NDVI AND SURFACE TEMPERATURES USING LANDSAT ETM + IMAGERY NEWFEL MAZARI Introduction and Objectives The present study is a correlation
Monitoring agricultural plantations with remote sensing imagery
 MPRA Munich Personal RePEc Archive Monitoring agricultural plantations with remote sensing imagery Camelia Slave and Anca Rotman University of Agronomic Sciences and Veterinary Medicine - Bucharest Romania,
Mod. 2 p. 1. Prof. Dr. Christoph Kleinn Institut für Waldinventur und Waldwachstum Arbeitsbereich Fernerkundung und Waldinventur
 Histograms of gray values for TM bands 1-7 for the example image - Band 4 and 5 show more differentiation than the others (contrast=the ratio of brightest to darkest areas of a landscape). - Judging from
Satellite Remote Sensing: Earth System Observations
 Satellite Remote Sensing: Earth System Observations Land surface Water Atmosphere Climate Ecosystems 1 EOS (Earth Observing System) Develop an understanding of the total Earth system, and the effects of
Abstract Quickbird Vs Aerial photos in identifying man-made objects
 Abstract Quickbird Vs Aerial s in identifying man-made objects Abdullah Mah abdullah.mah@aramco.com Remote Sensing Group, emap Division Integrated Solutions Services Department (ISSD) Saudi Aramco, Dhahran
FOR 353: Air Photo Interpretation and Photogrammetry. Lecture 2. Electromagnetic Energy/Camera and Film characteristics
 FOR 353: Air Photo Interpretation and Photogrammetry Lecture 2 Electromagnetic Energy/Camera and Film characteristics Lecture Outline Electromagnetic Radiation Theory Digital vs. Analog (i.e. film ) Systems
Remote Sensing Exam 2 Study Guide
 Remote Sensing Exam 2 Study Guide Resolution Analog to digital Instantaneous field of view (IFOV) f ( cone angle of optical system ) Everything in that area contributes to spectral response mixels Sampling
Remote Sensing 1 Principles of visible and radar remote sensing & sensors
 Remote Sensing 1 Principles of visible and radar remote sensing & sensors Nick Barrand School of Geography, Earth & Environmental Sciences University of Birmingham, UK Field glaciologist collecting data
Remote Sensing Platforms
 Remote Sensing Platforms Remote Sensing Platforms - Introduction Allow observer and/or sensor to be above the target/phenomena of interest Two primary categories Aircraft Spacecraft Each type offers different
Remote Sensing of Environment (RSE)
") I N T R O Introduction to Introduction to Remote Sensing T O R S E Remote Sensing of Environment (RSE) with TNTmips page 1 TNTview Before Getting Started Imagery acquired by airborne or satellite sensors
I N T R O Introduction to Introduction to Remote Sensing T O R S E Remote Sensing of Environment (RSE) with TNTmips page 1 TNTview Before Getting Started Imagery acquired by airborne or satellite sensors
BV NNET User manual. V0.2 (Draft) Rémi Lecerf, Marie Weiss
 Rémi Lecerf, Marie Weiss") BV NNET User manual V0.2 (Draft) Rémi Lecerf, Marie Weiss 1. Introduction... 2 2. Installation... 2 3. Prerequisites... 2 3.1. Image file format... 2 3.2. Retrieving atmospheric data... 3 3.2.1. Using
BV NNET User manual V0.2 (Draft) Rémi Lecerf, Marie Weiss 1. Introduction... 2 2. Installation... 2 3. Prerequisites... 2 3.1. Image file format... 2 3.2. Retrieving atmospheric data... 3 3.2.1. Using
Image transformations
 Image transformations Digital Numbers may be composed of three elements: Atmospheric interference (e.g. haze) ATCOR Illumination (angle of reflection) - transforms Albedo (surface cover) Image transformations
Module 11 Digital image processing
 Introduction Geo-Information Science Practical Manual Module 11 Digital image processing 11. INTRODUCTION 11-1 START THE PROGRAM ERDAS IMAGINE 11-2 PART 1: DISPLAYING AN IMAGE DATA FILE 11-3 Display of
Basic Digital Image Processing. The Structure of Digital Images. An Overview of Image Processing. Image Restoration: Line Drop-outs
 Basic Digital Image Processing A Basic Introduction to Digital Image Processing ~~~~~~~~~~ Rev. Ronald J. Wasowski, C.S.C. Associate Professor of Environmental Science University of Portland Portland,
Remote Sensing and GIS
 Remote Sensing and GIS Atmosphere Reflected radiation, e.g. Visible Emitted radiation, e.g. Infrared Backscattered radiation, e.g. Radar (λ) Visible TIR Radar & Microwave 11/9/2017 Geo327G/386G, U Texas,
On the use of water color missions for lakes in 2021
 Lakes and Climate: The Role of Remote Sensing June 01-02, 2017 On the use of water color missions for lakes in 2021 Cédric G. Fichot Department of Earth and Environment 1 Overview 1. Past and still-ongoing
Present and future of marine production in Boka Kotorska
 Present and future of marine production in Boka Kotorska First results from satellite remote sensing for the breeding areas of filter feeders in the Bay of Kotor INTRODUCTION Environmental monitoring is
HYPERSPECTRAL IMAGERY FOR SAFEGUARDS APPLICATIONS. International Atomic Energy Agency, Vienna, Austria
 HYPERSPECTRAL IMAGERY FOR SAFEGUARDS APPLICATIONS G. A. Borstad 1, Leslie N. Brown 1, Q.S. Bob Truong 2, R. Kelley, 3 G. Healey, 3 J.-P. Paquette, 3 K. Staenz 4, and R. Neville 4 1 Borstad Associates Ltd.,
Final Examination Introduction to Remote Sensing. Time: 1.5 hrs Max. Marks: 50. Section-I (50 x 1 = 50 Marks)
") Final Examination Introduction to Remote Sensing Time: 1.5 hrs Max. Marks: 50 Note: Attempt all questions. Section-I (50 x 1 = 50 Marks) 1... is the technology of acquiring information about the Earth's
Final Examination Introduction to Remote Sensing Time: 1.5 hrs Max. Marks: 50 Note: Attempt all questions. Section-I (50 x 1 = 50 Marks) 1... is the technology of acquiring information about the Earth's
Outline. Introduction. Introduction: Film Emulsions. Sensor Systems. Types of Remote Sensing. A/Prof Linlin Ge. Photographic systems (cf(
 GMAT x600 Remote Sensing / Earth Observation Types of Sensor Systems (1) Outline Image Sensor Systems (i) Line Scanning Sensor Systems (passive) (ii) Array Sensor Systems (passive) (iii) Antenna Radar
Figure 1: Percent reflectance for various features, including the five spectra from Table 1, at different wavelengths from 0.4µm to 1.4µm.
 Section 1: The Electromagnetic Spectrum 1. The wavelength range that has the highest reflectance for broadleaf vegetation and needle leaf vegetation is 0.75µm to 1.05µm. 2. Dry soil can be distinguished
Remote Sensing. in Agriculture. Dr. Baqer Ramadhan CRP 514 Geographic Information System. Adel M. Al-Rebh G Term Paper.
 Remote Sensing in Agriculture Term Paper to Dr. Baqer Ramadhan CRP 514 Geographic Information System By Adel M. Al-Rebh G199325390 May 2012 Table of Contents 1.0 Introduction... 4 2.0 Objective... 4 3.0
What is Remote Sensing? Contents. Image Fusion in Remote Sensing. 1. Optical imagery in remote sensing. Electromagnetic Spectrum
 Contents Image Fusion in Remote Sensing Optical imagery in remote sensing Image fusion in remote sensing New development on image fusion Linhai Jing Applications Feb. 17, 2011 2 1. Optical imagery in remote
CHAPTER 7: Multispectral Remote Sensing
 CHAPTER 7: Multispectral Remote Sensing REFERENCE: Remote Sensing of the Environment John R. Jensen (2007) Second Edition Pearson Prentice Hall Overview of How Digital Remotely Sensed Data are Transformed
remote sensing? What are the remote sensing principles behind these Definition
 Introduction to remote sensing: Content (1/2) Definition: photogrammetry and remote sensing (PRS) Radiation sources: solar radiation (passive optical RS) earth emission (passive microwave or thermal infrared
Environmental and Natural Resources Issues in Minnesota. A Remote Sensing Overview: Principles and Fundamentals. Outline. Challenges.
 A Remote Sensing Overview: Principles and Fundamentals Marvin Bauer Remote Sensing and Geospatial Analysis Laboratory College of Natural Resources University of Minnesota Remote Sensing for GIS Users Workshop,
Lecture 7 Earth observation missions
 Remote sensing for agricultural applications: principles and methods (2013-2014) Instructor: Prof. Tao Cheng (tcheng@njau.edu.cn). Nanjing Agricultural University Lecture 7 Earth observation missions May
Urban Classification of Metro Manila for Seismic Risk Assessment using Satellite Images
 Urban Classification of Metro Manila for Seismic Risk Assessment using Satellite Images Fumio YAMAZAKI/ yamazaki@edm.bosai.go.jp Hajime MITOMI/ mitomi@edm.bosai.go.jp Yalkun YUSUF/ yalkun@edm.bosai.go.jp
Outline for today. Geography 411/611 Remote sensing: Principles and Applications. Remote sensing: RS for biogeochemical cycles
 Geography 411/611 Remote sensing: Principles and Applications Thomas Albright, Associate Professor Laboratory for Conservation Biogeography, Department of Geography & Program in Ecology, Evolution, & Conservation
CHARACTERISTICS OF REMOTELY SENSED IMAGERY. Spatial Resolution
 CHARACTERISTICS OF REMOTELY SENSED IMAGERY Spatial Resolution There are a number of ways in which images can differ. One set of important differences relate to the various resolutions that images express.
Evaluating the Effects of Shadow Detection on QuickBird Image Classification and Spectroradiometric Restoration
 Remote Sens. 2013, 5, 4450-4469; doi:10.3390/rs5094450 Article OPEN ACCESS Remote Sensing ISSN 2072-4292 www.mdpi.com/journal/remotesensing Evaluating the Effects of Shadow Detection on QuickBird Image
Data acquisition and integration 6.
 University of West Hungary, Faculty of Geoinformatics Malgorzata Verőné Wojtaszek Data acquisition and integration 6. module DAI6 Remote Sensing SZÉKESFEHÉRVÁR 2010 The right to this intellectual property
Remote Sensing. Measuring an object from a distance. For GIS, that means using photographic or satellite images to gather spatial data
 Remote Sensing Measuring an object from a distance For GIS, that means using photographic or satellite images to gather spatial data Remote Sensing measures electromagnetic energy reflected or emitted
PLANET SURFACE REFLECTANCE PRODUCT
 PLANET SURFACE REFLECTANCE PRODUCT FEBRUARY 2018 SUPPORT@PLANET.COM PLANET.COM VERSION 1.0 TABLE OF CONTENTS 3 Product Description 3 Atmospheric Correction Methodology 5 Product Limitations 6 Product Assessment
Remote Sensing (Test) Topic: Climate Change Processes*
 Topic: Climate Change Processes*") Scioly Summer Study Session 2017 Remote Sensing (Test) Topic: Climate Change Processes* By user whythelongface (merge) Name(s): Test format: This test is worth 150 points. There are four sections: 1. Remote
Scioly Summer Study Session 2017 Remote Sensing (Test) Topic: Climate Change Processes* By user whythelongface (merge) Name(s): Test format: This test is worth 150 points. There are four sections: 1. Remote