Present and future of marine production in Boka Kotorska
|
|
|
- Garey Henderson
- 5 years ago
- Views:
Transcription
1 Present and future of marine production in Boka Kotorska First results from satellite remote sensing for the breeding areas of filter feeders in the Bay of Kotor
2 INTRODUCTION Environmental monitoring is one of the ways to verify the evolution of an ecosystem, and studying the biodiversity that typifies it is the basis to study its possible changes over time. Assessing the effects on organisms and environments of the many anthropic activities is extremely important to ensure proper management and preservation of natural resources. In the last decades the choice of methods for environmental quality assessment aimed in particular to the study of those biological components of the ecosystem that are able to respond, with various sensitivities, to the changes of the environment. Remotely sensed images are an essential instrument for this purpose since their informative features can make a meaningful contribution to the study of the evolution or regression of the ecosystem itself.

3 IMAGE ACQUISITION AND SELECTION - SENSOR 30 images were acquired in total, but the ones from Landsat 5 TM were selected since Landsat 7 ETM+ images show gaps due to a sensor failure in images from Landsat5 TM and 12 images from Landsat7 ETM+ were downloaded
4 IMAGE ACQUISITION AND SELECTION - DATE 7 images were selected among all from Landsat 5 TM considering the coverage of the area of study, clouds and season (date) of acquisition: low tide high tide Landsat 5 24/07/1987 Landsat 5 01/09/1984 Landsat 5 09/08/1987 Landsat 5 04/07/2003 Landsat 5 23/07/2010 Landsat 5 24/08/2010 Another factor that has to be considered when analysing images for an inshore, shallow water area is the tide phase. The confrontation between different years should be made for similar conditions, both of season and tide.


5 IMAGE ACQUISITION AND SELECTION - TIDE July 24, 1987 July 23, 2010 August 9, 1987 August 24, 2010 The low tide satellite images were captured at 9.17 AM
6 COLOR COMPOSITE Example of RGB color composite from bands (red-green-blue): true color composite, it is like a photograph and enhances submerged areas and smoke columns
7 COLOR COMPOSITE Example of RGB color composite from bands (NIR-red-green): it is similar to photos taken with an infrared camera. The vegetation appears red, urban areas are blue. The shoreline is well defined and water is well distinguished from land, although it is possible to define some partially submerged structures.
8 COLOR COMPOSITE Example of RGB color composite from bands (NIR-SWIR-red): The water-land boundary is very clear, humid terrains are darker.
9 COLOR COMPOSITE Example of RGB color composite from bands (SWIR-NIR-green): Algae appear in a light-blue color, conifer trees are darker than deciduous plants, water is dark blue, vegetation is green and urban or plant-free areas appear pink

10 COLOR COMPOSITE Example of RGB color composite from bands (TIR-green-blue): This color composite shows very well the differences in temperature within the water body. This composite required a masking for the land area to enhance the difference in temperature.

11 COLOR COMPOSITE Example of RGB color composite from bands (SWIR-green-blue): This composite is very useful for oil spills detection. The anomaly, if present, would take on a red color on a dark background
12 IMAGE CLASSIFICATION - UNSUPERVISED The unsupervised classification is a preliminary analysis that is performed on images when you have little or no information of what the image really shows. UC is used to cluster pixels in a dataset based on statistics only, without any userdefined training classes. The unsupervised classification techniques available are ISODATA and K-Means. K-Means UC calculates initial class means evenly distributed in the data space then iteratively clusters the pixels into the nearest class using a minimum distance technique. Each iteration recalculates class means and reclassifies pixels with respect to the new means. All pixels are classified to the nearest class unless a standard deviation or distance threshold is specified, in which case some pixels may be unclassified if they do not meet the selection criteria. This process continues until the number of pixels in each class changes by less than the selected pixel change threshold or the maximum number of iterations is reached.
13 IMAGE CLASSIFICATION CHOICE OF BANDS For the unsupervised classification, bands 1,2,3 and 4 were used, since: Band 1: Blue light ( nm) is scattered by the atmosphere and illuminates material in shadows better than longer wavelengths. Blue penetrates clear water better than other colors. It is absorbed by chlorophyll, and so plants don't show up very brightly in this band. However, it is useful for soil/vegetation discrimination, forest type mapping, and identifying man-made features. Band 2: Green light ( nm) penetrates clear water fairly well, and gives excellent contrast between clear and turbid (muddy) water. It helps find oil on the surface of water, and vegetation (plant life) reflects more green light than any other visible color. Manmade features are still visible. Band 3: Red light ( nm) has limited water penetration. It reflects well from dead foliage, but not well from live foliage with chlorophyll. It is useful for identifying vegetation types, soils, and urban (city and town) features. Band 4: Near IR (NIR, nm, redder than red, but not visible) is good for mapping shorelines and biomass content. It is very good at detecting and analyzing vegetation.
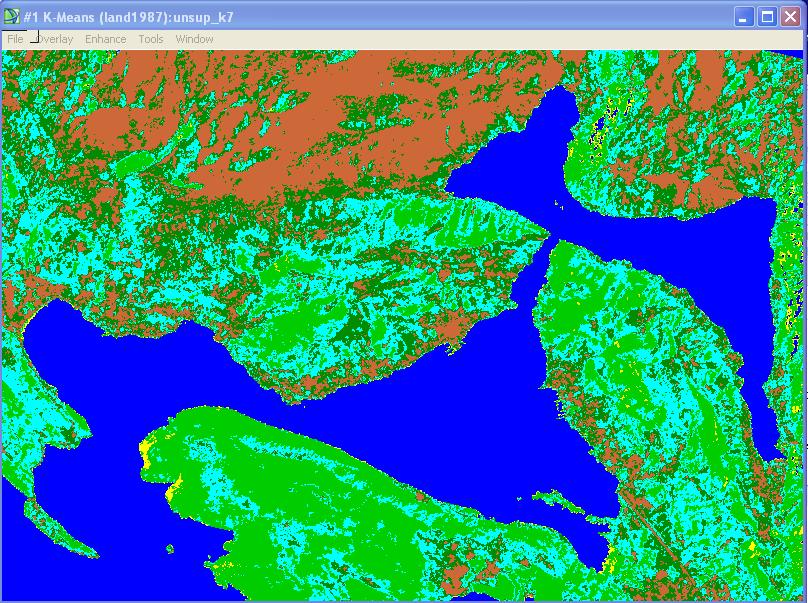
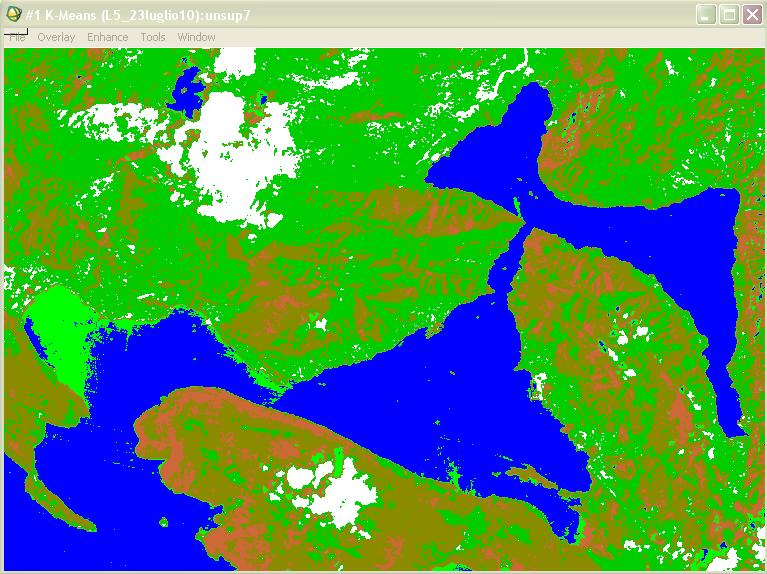
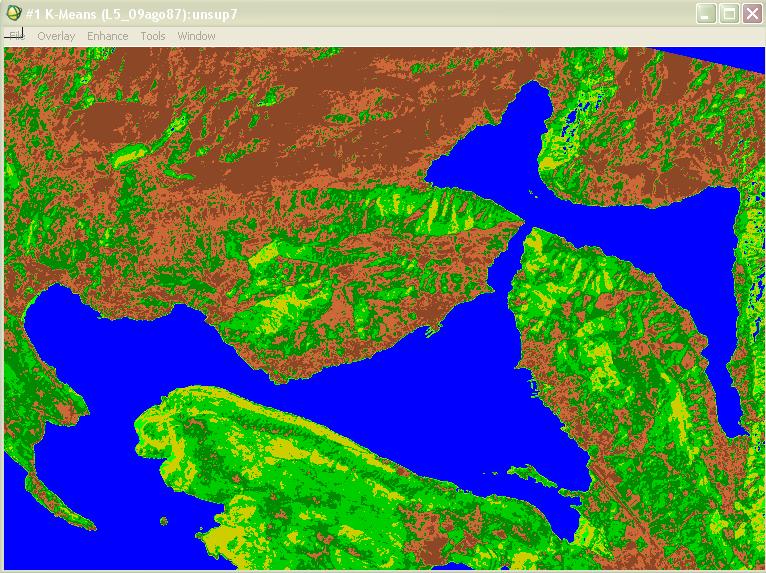
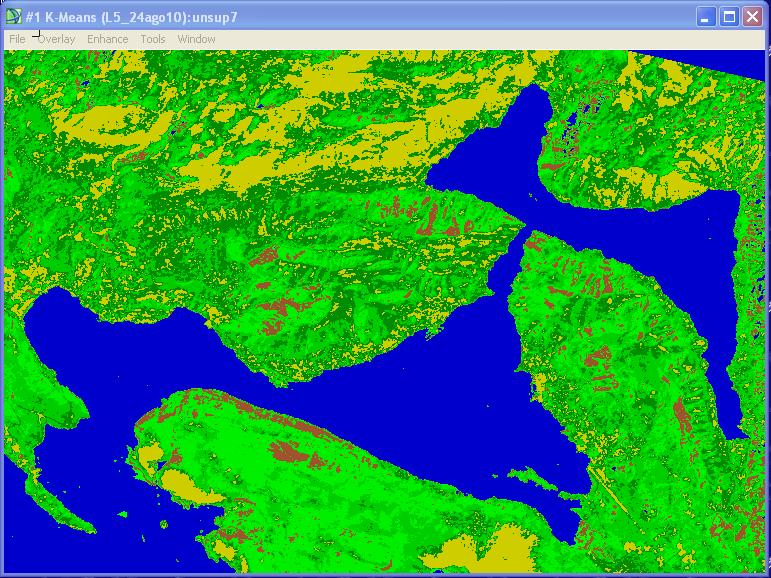
14 IMAGE CLASSIFICATION RESULTS July 24, 1987 July 23, 2010 August 9, 1987 August 24, 2010

15 MASKED IMAGE CLASSIFICATION RESULTS July 24, 1987 July 23, 2010 August 9, 1987 August 24, 2010
16 PRINCIPAL COMPONENTS ANALYSIS (PCA) When studying water depth and bottom structures, Principal Components Analysis (PCA), of the visible bands of TM, has been shown to be a significant support to other classifiers. Of the many algorithms discussed in the literature, for determining bathymetric properties from Landsat TM data, PCA appears to be the best alternative when in situ field measurements were not performed during sensor overpass. PCA is a statistical technique that transforms a multivariate data set consisting of inter-correlated variables into a data set consisting of variables that are uncorrelated linear combinations of the original variables. For remote sensing investigations, principal component transformation is based on the analysis of the relationship between the different bands; the rotation of the axes produces a set of image bands, uncorrelated with each other. Band 1 and Band 2 were used in a PCA for this research The first component (PC1) contained the variance related to water depth The second component (PC2), orthogonal to the first, contained the variance associated with bottom structure


17 PCA RESULTS - PRINCIPAL COMPONENT 1 July 24, 1987 July 23, 2010 August 9, 1987 August 24, 2010


18 PCA RESULTS - PRINCIPAL COMPONENT 2 July 24, 1987 July 23, 2010 August 9, 1987 August 24, 2010
19 PCA 1, PCA 2 AND BAND 3 - RESULTS July 24, 1987 July 23, 2010 August 9, 1987 August 24, 2010 The two PCAs were then combined in a hybrid routine, with TM3, to yield a shallow water environment classification
20 IMAGE ANALYSIS BAND RATIO A satellite image gives a great number of potential data While studying a sea water body, a few factors that are important are: dissolved oxygen BOD (biological oxygen demand) ph Salinity Chlorophyll Turbidity Fluorescence Water temperature Redox potential and organic matter in sediment Some of this parameters were studied with a band ratioing approach on the images and several indexes were calculated, so that a relative difference in intensity of a certain value is highlighted Dessì et Al., MODIS data processing for coastal and marine environment monitoring : a study on anomaly detection and evolution in Gulf of Cagliari (Sardinia Italy)
21 FLUORESCENCE INDEX Oily substances generally have greater reflectance in relation to the marine water, especially in the blue spectral range: this is due to fluorescence induced by λ<400 nm sunlight rays A relative fluorescence index (F) was developed. F= (Blue-Red)/(Blue+Red)=(B1-B3)/(B1+B3) The algorithm is based on the relationship between blue and red ranges (respectively bands 3 and 1 in Landsat data) in which the higher is the value of the contribution of blue and the greater is F. The elaboration allows a better enhancement of the anomalies in relation to a simple true color composite, and the higher values of F index may let presume that the anomaly substance has hydrocarbon components. Dessì et Al., MODIS data processing for coastal and marine environment monitoring : a study on anomaly detection and evolution in Gulf of Cagliari (Sardinia Italy)
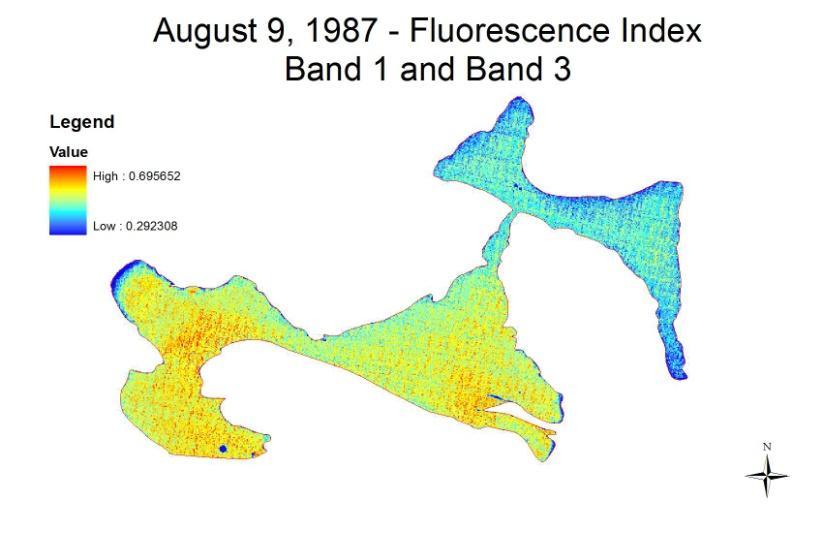
22 FLUORESCENCE INDEX
23 CHLOROPHYLL INDEX Eutrophication of water bodies can be quantified in term of concentration of chlorophyll contained in the algal plankton cells. Chlorophyll is one of the photosynthetic agents, contributing to the color of water. A large volume of literature exists on using remote sensing for mapping chlorophyll a, an indicator of algal concentration and a key parameter for assessment of water quality Knowledge about the amount of phytoplankton has important implications for primary production and carbon cycle models as well as for monitoring the state of water bodies Most remote sensing studies of chlorophyll in water are based on empirical relationship between radiance in narrow bands or bands ratio and chlorophyll concentration. Techniques used were band rationing where the ratios were found the most effective in estimating chlorophyll a. A relative chlorophyll index (C) was developed. C= Blue/Red = B1/B3 Usali et Al., 2008 Use of remote sensing and GIS in monitoring water quality
24 CHLOROPHYLL INDEX
25 TURBIDITY INDEX Water turbidity is an expression of the optical properties of water, which cause the light to be scattered and absorbed rather than transmitted in straight lines. It is therefore commonly regarded as the opposite of clarity. As water turbidity is mainly caused by the presence of suspended matter, turbidity measurement has often been used to calculate fluvial suspended sediment concentrations The best correlation of turbidity of reflectance was red reflectance Other studies have been conducted in turbidity mapping; it was found found that Landsat 5 TM Band 3/Band 2, Band 4/Band 3 are good for predicting turbidity. Since what we are dealing with here is not a lake but a semi-closed marine basin, we investigated on the effectiveness of both indexes. Two relative turbidity indexes (T) were developed. TRG= Red/Green = B3/B2 TIR = Near Infrared / Red = B4/B3 Usali et Al., 2008 Use of remote sensing and GIS in monitoring water quality
26 TURBIDITY INDEX - 1
27 TURBIDITY INDEX - 2
28 WATER TEMPERATURE Digital numbers associated to each pixel that builds the image are converted into spectral radiance using the following equation (Markham and Barker, 1986): L DN Spectral radiances are then converted into satellite brightness temperature using the following relationship that is similar to the Planck equation with two free parameters (Schott and Volchok, 1985; Wukelic et al., 1989): T B K K1 ln L 2 1 where L is the blackbody radiance for a temperature, T B, integrated over band 6, and K1 and K2 are two free parameters with the values of K1= mwcm -2 sr -1 m -1 and K2= K
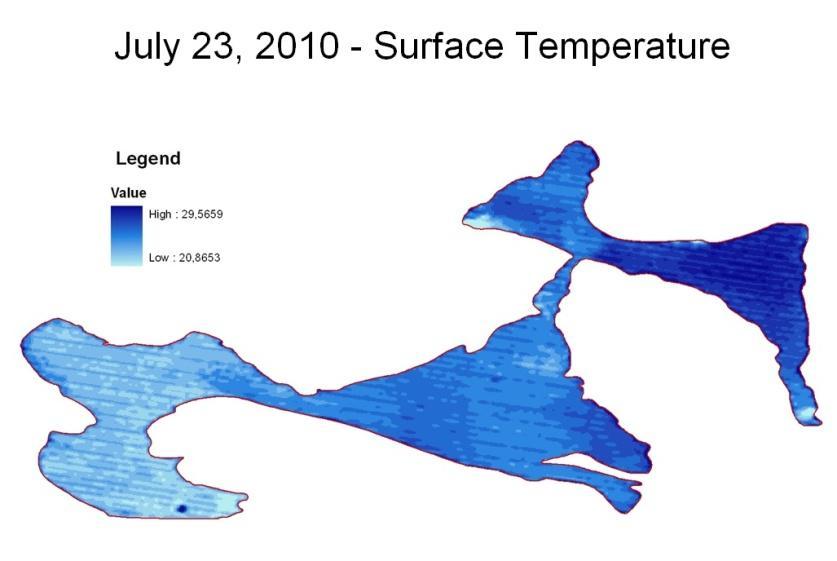
29 WATER TEMPERATURE
30 CONCLUSION The importance and complexity of the marine environment requires a continuous multidisciplinary study A limitation of a satellite data monitoring system is given by meteorological conditions, as cloud cover may prevent radiance penetration from sea surface When using satellite imagery for environmental studies it is important to consider spatial and spectral resolution A proper validation of the procedure and of the results should be done by direct on-ground measurements
On the use of water color missions for lakes in 2021
 Lakes and Climate: The Role of Remote Sensing June 01-02, 2017 On the use of water color missions for lakes in 2021 Cédric G. Fichot Department of Earth and Environment 1 Overview 1. Past and still-ongoing
Interpreting land surface features. SWAC module 3
 Interpreting land surface features SWAC module 3 Interpreting land surface features SWAC module 3 Different kinds of image Panchromatic image True-color image False-color image EMR : NASA Echo the bat
Image interpretation and analysis
 Image interpretation and analysis Grundlagen Fernerkundung, Geo 123.1, FS 2014 Lecture 7a Rogier de Jong Michael Schaepman Why are snow, foam, and clouds white? Why are snow, foam, and clouds white? Today
746A27 Remote Sensing and GIS. Multi spectral, thermal and hyper spectral sensing and usage
 746A27 Remote Sensing and GIS Lecture 3 Multi spectral, thermal and hyper spectral sensing and usage Chandan Roy Guest Lecturer Department of Computer and Information Science Linköping University Multi
Remote Sensing. The following figure is grey scale display of SPOT Panchromatic without stretching.
 Remote Sensing Objectives This unit will briefly explain display of remote sensing image, geometric correction, spatial enhancement, spectral enhancement and classification of remote sensing image. At
Dirty REMOTE SENSING Lecture 3: First Steps in classifying Stuart Green Earthobservation.wordpress.com
 Dirty REMOTE SENSING Lecture 3: First Steps in classifying Stuart Green Earthobservation.wordpress.com Stuart.Green@Teagasc.ie You have your image, but is it any good? Is it full of cloud? Is it the right
Image Band Transformations
 Image Band Transformations Content Band math Band ratios Vegetation Index Tasseled Cap Transform Principal Component Analysis (PCA) Decorrelation Stretch Image Band Transformation Purposes Image band transforms
An Introduction to Remote Sensing & GIS. Introduction
 An Introduction to Remote Sensing & GIS Introduction Remote sensing is the measurement of object properties on Earth s surface using data acquired from aircraft and satellites. It attempts to measure something
The techniques with ERDAS IMAGINE include:
 The techniques with ERDAS IMAGINE include: 1. Data correction - radiometric and geometric correction 2. Radiometric enhancement - enhancing images based on the values of individual pixels 3. Spatial enhancement
University of Texas at San Antonio EES 5053 Term Project CORRELATION BETWEEN NDVI AND SURFACE TEMPERATURES USING LANDSAT ETM + IMAGERY NEWFEL MAZARI
 University of Texas at San Antonio EES 5053 Term Project CORRELATION BETWEEN NDVI AND SURFACE TEMPERATURES USING LANDSAT ETM + IMAGERY NEWFEL MAZARI Introduction and Objectives The present study is a correlation
GEOG432: Remote sensing Lab 3 Unsupervised classification
 GEOG432: Remote sensing Lab 3 Unsupervised classification Goal: This lab involves identifying land cover types by using agorithms to identify pixels with similar Digital Numbers (DN) and spectral signatures
NON-PHOTOGRAPHIC SYSTEMS: Multispectral Scanners Medium and coarse resolution sensor comparisons: Landsat, SPOT, AVHRR and MODIS
 NON-PHOTOGRAPHIC SYSTEMS: Multispectral Scanners Medium and coarse resolution sensor comparisons: Landsat, SPOT, AVHRR and MODIS CLASSIFICATION OF NONPHOTOGRAPHIC REMOTE SENSORS PASSIVE ACTIVE DIGITAL
Land Cover Analysis to Determine Areas of Clear-cut and Forest Cover in Olney, Montana. Geob 373 Remote Sensing. Dr Andreas Varhola, Kathry De Rego
 1 Land Cover Analysis to Determine Areas of Clear-cut and Forest Cover in Olney, Montana Geob 373 Remote Sensing Dr Andreas Varhola, Kathry De Rego Zhu an Lim (14292149) L2B 17 Apr 2016 2 Abstract Montana
GEOG432: Remote sensing Lab 3 Unsupervised classification
 GEOG432: Remote sensing Lab 3 Unsupervised classification Goal: This lab involves identifying land cover types by using agorithms to identify pixels with similar Digital Numbers (DN) and spectral signatures
Remote Sensing Mapping of Turbidity in the Upper San Francisco Estuary. Francine Mejia, Geography 342
 Remote Sensing Mapping of Turbidity in the Upper San Francisco Estuary Francine Mejia, Geography 342 Introduction The sensitivity of reflectance to sediment, chlorophyll a, and colored DOM (CDOM) in the
IKONOS High Resolution Multispectral Scanner Sensor Characteristics
 High Spatial Resolution and Hyperspectral Scanners IKONOS High Resolution Multispectral Scanner Sensor Characteristics Launch Date View Angle Orbit 24 September 1999 Vandenberg Air Force Base, California,
REMOTE SENSING. Topic 10 Fundamentals of Digital Multispectral Remote Sensing MULTISPECTRAL SCANNERS MULTISPECTRAL SCANNERS
 REMOTE SENSING Topic 10 Fundamentals of Digital Multispectral Remote Sensing Chapter 5: Lillesand and Keifer Chapter 6: Avery and Berlin MULTISPECTRAL SCANNERS Record EMR in a number of discrete portions
Remote Sensing for Rangeland Applications
 Remote Sensing for Rangeland Applications Jay Angerer Ecological Training June 16, 2012 Remote Sensing The term "remote sensing," first used in the United States in the 1950s by Ms. Evelyn Pruitt of the
Sensors and Data Interpretation II. Michael Horswell
 Sensors and Data Interpretation II Michael Horswell Defining remote sensing 1. When was the last time you did any remote sensing? acquiring information about something without direct contact 2. What are
NORMALIZING ASTER DATA USING MODIS PRODUCTS FOR LAND COVER CLASSIFICATION
 NORMALIZING ASTER DATA USING MODIS PRODUCTS FOR LAND COVER CLASSIFICATION F. Gao a, b, *, J. G. Masek a a Biospheric Sciences Branch, NASA Goddard Space Flight Center, Greenbelt, MD 20771, USA b Earth
Comparing of Landsat 8 and Sentinel 2A using Water Extraction Indexes over Volta River
 Journal of Geography and Geology; Vol. 10, No. 1; 2018 ISSN 1916-9779 E-ISSN 1916-9787 Published by Canadian Center of Science and Education Comparing of Landsat 8 and Sentinel 2A using Water Extraction
Figure 1: Percent reflectance for various features, including the five spectra from Table 1, at different wavelengths from 0.4µm to 1.4µm.
 Section 1: The Electromagnetic Spectrum 1. The wavelength range that has the highest reflectance for broadleaf vegetation and needle leaf vegetation is 0.75µm to 1.05µm. 2. Dry soil can be distinguished
6th Beirut Water Week 27th February - 1st March 2017
 Assessment of chlorophyll-a concentration using Landsat Operational Land Imager in Lake Qaraoun, Lebanon Ali Fadel 6th Beirut Water Week 27th February - 1st March 2017 Introduction & problematic Worldwide
Remote sensing in archaeology from optical to lidar. Krištof Oštir ModeLTER Scientific Research Centre of the Slovenian Academy of Sciences and Arts
 Remote sensing in archaeology from optical to lidar Krištof Oštir ModeLTER Scientific Research Centre of the Slovenian Academy of Sciences and Arts Introduction Optical remote sensing Systems Search for
An investigation of the Eye of Quebec. by means of PCA, NDVI and Tasseled Cap Transformations
 An investigation of the Eye of Quebec by means of PCA, NDVI and Tasseled Cap Transformations Advanced Digital Image Processing Prepared For: Trevor Milne Prepared By: Philipp Schnetzer March 28, 2008 Index
Center for Advanced Land Management Information Technologies (CALMIT), School of Natural Resources, University of Nebraska-Lincoln
, School of Natural Resources, University of Nebraska-Lincoln") Geoffrey M. Henebry, Andrés Viña, and Anatoly A. Gitelson Center for Advanced Land Management Information Technologies (CALMIT), School of Natural Resources, University of Nebraska-Lincoln Introduction
Geoffrey M. Henebry, Andrés Viña, and Anatoly A. Gitelson Center for Advanced Land Management Information Technologies (CALMIT), School of Natural Resources, University of Nebraska-Lincoln Introduction
Study of Chlorophyll-a Distribution of Microalgae at Tasik Aman and Tasik Harapan in Penang Island Malaysia using Landsat Image
 ISSN 2407-289 Study of Chlorophyll-a Distribution of Microalgae at Tasik Aman and Tasik Harapan in Penang Island Malaysia using Landsat Image a b c Fairooz Johan, Mohd Zubir Mat Jafri, Lim Hwee San,Wan
Introduction to image processing for remote sensing: Practical examples
 Università degli studi di Roma Tor Vergata Corso di Telerilevamento e Diagnostica Elettromagnetica Anno accademico 2010/2011 Introduction to image processing for remote sensing: Practical examples Dr.
Relationship Between Landsat 8 Spectral Reflectance and Chlorophyll-a in Grand Lake, Oklahoma
 Relationship Between Landsat 8 Spectral Reflectance and Chlorophyll-a in Grand Lake, Oklahoma Presented by: Abu Mansaray Research Team Dr. Andrew Dzialowski (PI), Oklahoma State University Dr. Scott Stoodley
Mod. 2 p. 1. Prof. Dr. Christoph Kleinn Institut für Waldinventur und Waldwachstum Arbeitsbereich Fernerkundung und Waldinventur
 Histograms of gray values for TM bands 1-7 for the example image - Band 4 and 5 show more differentiation than the others (contrast=the ratio of brightest to darkest areas of a landscape). - Judging from
Remote Sensing And Gis Application in Image Classification And Identification Analysis.
 Quest Journals Journal of Research in Environmental and Earth Science Volume 3~ Issue 5 (2017) pp: 55-66 ISSN(Online) : 2348-2532 www.questjournals.org Research Paper Remote Sensing And Gis Application
Satellite Remote Sensing: Earth System Observations
 Satellite Remote Sensing: Earth System Observations Land surface Water Atmosphere Climate Ecosystems 1 EOS (Earth Observing System) Develop an understanding of the total Earth system, and the effects of
Image transformations
 Image transformations Digital Numbers may be composed of three elements: Atmospheric interference (e.g. haze) ATCOR Illumination (angle of reflection) - transforms Albedo (surface cover) Image transformations
Application of Remote Sensing in the Monitoring of Marine pollution. By Atif Shahzad Institute of Environmental Studies University of Karachi
 Application of Remote Sensing in the Monitoring of Marine pollution By Atif Shahzad Institute of Environmental Studies University of Karachi Remote Sensing "Remote sensing is the science (and to some extent,
Lecture 13: Remotely Sensed Geospatial Data
 Lecture 13: Remotely Sensed Geospatial Data A. The Electromagnetic Spectrum: The electromagnetic spectrum (Figure 1) indicates the different forms of radiation (or simply stated light) emitted by nature.
Remote Sensing. in Agriculture. Dr. Baqer Ramadhan CRP 514 Geographic Information System. Adel M. Al-Rebh G Term Paper.
 Remote Sensing in Agriculture Term Paper to Dr. Baqer Ramadhan CRP 514 Geographic Information System By Adel M. Al-Rebh G199325390 May 2012 Table of Contents 1.0 Introduction... 4 2.0 Objective... 4 3.0
A Study on Retrieval Algorithm of Black Water Aggregation in Taihu Lake Based on HJ-1 Satellite Images
 IOP Conference Series: Earth and Environmental Science OPEN ACCESS A Study on Retrieval Algorithm of Black Water Aggregation in Taihu Lake Based on HJ-1 Satellite Images To cite this article: Zou Lei et
What is Remote Sensing? Contents. Image Fusion in Remote Sensing. 1. Optical imagery in remote sensing. Electromagnetic Spectrum
 Contents Image Fusion in Remote Sensing Optical imagery in remote sensing Image fusion in remote sensing New development on image fusion Linhai Jing Applications Feb. 17, 2011 2 1. Optical imagery in remote
Course overview; Remote sensing introduction; Basics of image processing & Color theory
 GEOL 1460 /2461 Ramsey Introduction to Remote Sensing Fall, 2018 Course overview; Remote sensing introduction; Basics of image processing & Color theory Week #1: 29 August 2018 I. Syllabus Review we will
APCAS/10/21 April 2010 ASIA AND PACIFIC COMMISSION ON AGRICULTURAL STATISTICS TWENTY-THIRD SESSION. Siem Reap, Cambodia, April 2010
 APCAS/10/21 April 2010 Agenda Item 8 ASIA AND PACIFIC COMMISSION ON AGRICULTURAL STATISTICS TWENTY-THIRD SESSION Siem Reap, Cambodia, 26-30 April 2010 The Use of Remote Sensing for Area Estimation by Robert
Introduction to Remote Sensing
 Introduction to Remote Sensing Spatial, spectral, temporal resolutions Image display alternatives Vegetation Indices Image classifications Image change detections Accuracy assessment Satellites & Air-Photos
Sommersemester Prof. Dr. Christoph Kleinn Institut für Waldinventur und Waldwachstum Arbeitsbereich Fernerkundung und Waldinventur.
 Basics of Remote Sensing Some literature references Franklin, SE 2001 Remote Sensing for Sustainable Forest Management Lewis Publishers 407p Lillesand, Kiefer 2000 Remote Sensing and Image Interpretation
Urban Classification of Metro Manila for Seismic Risk Assessment using Satellite Images
 Urban Classification of Metro Manila for Seismic Risk Assessment using Satellite Images Fumio YAMAZAKI/ yamazaki@edm.bosai.go.jp Hajime MITOMI/ mitomi@edm.bosai.go.jp Yalkun YUSUF/ yalkun@edm.bosai.go.jp
MULTISPECTRAL IMAGE PROCESSING I
 TM1 TM2 337 TM3 TM4 TM5 TM6 Dr. Robert A. Schowengerdt TM7 Landsat Thematic Mapper (TM) multispectral images of desert and agriculture near Yuma, Arizona MULTISPECTRAL IMAGE PROCESSING I SENSORS Multispectral
Spectral Signatures. Vegetation. 40 Soil. Water WAVELENGTH (microns)
") Spectral Signatures % REFLECTANCE VISIBLE NEAR INFRARED Vegetation Soil Water.5. WAVELENGTH (microns). Spectral Reflectance of Urban Materials 5 Parking Lot 5 (5=5%) Reflectance 5 5 5 5 5 Wavelength (nm)
Spectral Signatures % REFLECTANCE VISIBLE NEAR INFRARED Vegetation Soil Water.5. WAVELENGTH (microns). Spectral Reflectance of Urban Materials 5 Parking Lot 5 (5=5%) Reflectance 5 5 5 5 5 Wavelength (nm)
An NDVI image provides critical crop information that is not visible in an RGB or NIR image of the same scene. For example, plants may appear green
 Normalized Difference Vegetation Index (NDVI) Spectral Band calculation that uses the visible (RGB) and near-infrared (NIR) bands of the electromagnetic spectrum NDVI= + An NDVI image provides critical
1. Theory of remote sensing and spectrum
 1. Theory of remote sensing and spectrum 7 August 2014 ONUMA Takumi Outline of Presentation Electromagnetic wave and wavelength Sensor type Spectrum Spatial resolution Spectral resolution Mineral mapping
Remote sensing monitoring of coastline change in Pearl River estuary
 Remote sensing monitoring of coastline change in Pearl River estuary Xiaoge Zhu Remote Sensing Geology Department Research Institute of Petroleum Exploration and Development (RIPED) PetroChina Company
GE 113 REMOTE SENSING
 GE 113 REMOTE SENSING Topic 8. Image Classification and Accuracy Assessment Lecturer: Engr. Jojene R. Santillan jrsantillan@carsu.edu.ph Division of Geodetic Engineering College of Engineering and Information
Light penetration within a clear water body. E z = E 0 e -kz
 THE BLUE PLANET 1 2 Light penetration within a clear water body E z = E 0 e -kz 3 4 5 Pure Seawater Phytoplankton b w 10-2 m -1 b w 10-2 m -1 b w, Morel (1974) a w, Pope and Fry (1997) b chl,loisel and
Remote Sensing and GIS
 Remote Sensing and GIS Atmosphere Reflected radiation, e.g. Visible Emitted radiation, e.g. Infrared Backscattered radiation, e.g. Radar (λ) Visible TIR Radar & Microwave 11/9/2017 Geo327G/386G, U Texas,
Enhancement of Multispectral Images and Vegetation Indices
 Enhancement of Multispectral Images and Vegetation Indices ERDAS Imagine 2016 Description: We will use ERDAS Imagine with multispectral images to learn how an image can be enhanced for better interpretation.
Basic Digital Image Processing. The Structure of Digital Images. An Overview of Image Processing. Image Restoration: Line Drop-outs
 Basic Digital Image Processing A Basic Introduction to Digital Image Processing ~~~~~~~~~~ Rev. Ronald J. Wasowski, C.S.C. Associate Professor of Environmental Science University of Portland Portland,
CLASSIFICATION OF VEGETATION AREA FROM SATELLITE IMAGES USING IMAGE PROCESSING TECHNIQUES ABSTRACT
 CLASSIFICATION OF VEGETATION AREA FROM SATELLITE IMAGES USING IMAGE PROCESSING TECHNIQUES Arpita Pandya Research Scholar, Computer Science, Rai University, Ahmedabad Dr. Priya R. Swaminarayan Professor
Lab 6: Multispectral Image Processing Using Band Ratios
 Lab 6: Multispectral Image Processing Using Band Ratios due Dec. 11, 2017 Goals: 1. To learn about the spectral characteristics of vegetation and geologic materials. 2. To experiment with vegetation indices
Land Remote Sensing Lab 4: Classication and Change Detection Assigned: October 15, 2017 Due: October 27, Classication
 Name: Land Remote Sensing Lab 4: Classication and Change Detection Assigned: October 15, 2017 Due: October 27, 2017 In this lab, you will generate several gures. Please sensibly name these images, save
RADAR (RAdio Detection And Ranging)
") RADAR (RAdio Detection And Ranging) CLASSIFICATION OF NONPHOTOGRAPHIC REMOTE SENSORS PASSIVE ACTIVE DIGITAL CAMERA THERMAL (e.g. TIMS) VIDEO CAMERA MULTI- SPECTRAL SCANNERS VISIBLE & NIR MICROWAVE Real
RADAR (RAdio Detection And Ranging) CLASSIFICATION OF NONPHOTOGRAPHIC REMOTE SENSORS PASSIVE ACTIVE DIGITAL CAMERA THERMAL (e.g. TIMS) VIDEO CAMERA MULTI- SPECTRAL SCANNERS VISIBLE & NIR MICROWAVE Real
F2 - Fire 2 module: Remote Sensing Data Classification
 F2 - Fire 2 module: Remote Sensing Data Classification F2.1 Task_1: Supervised and Unsupervised classification examples of a Landsat 5 TM image from the Center of Portugal, year 2005 F2.1 Task_2: Burnt
Introduction of Satellite Remote Sensing
 Introduction of Satellite Remote Sensing Spatial Resolution (Pixel size) Spectral Resolution (Bands) Resolutions of Remote Sensing 1. Spatial (what area and how detailed) 2. Spectral (what colors bands)
Detecting Greenery in Near Infrared Images of Ground-level Scenes
 Detecting Greenery in Near Infrared Images of Ground-level Scenes Piotr Łabędź Agnieszka Ozimek Institute of Computer Science Cracow University of Technology Digital Landscape Architecture, Dessau Bernburg
Coral Reef Remote Sensing
 Coral Reef Remote Sensing Spectral, Spatial, Temporal Scaling Phillip Dustan Sensor Spatial Resolutio n Number of Bands Useful Bands coverage cycle Operation Landsat 80m 2 2 18 1972-97 Thematic 30m 7
How to Access Imagery and Carry Out Remote Sensing Analysis Using Landsat Data in a Browser
 How to Access Imagery and Carry Out Remote Sensing Analysis Using Landsat Data in a Browser Including Introduction to Remote Sensing Concepts Based on: igett Remote Sensing Concept Modules and GeoTech
typical spectral signatures of photosynthetically active and non-photosynthetically active vegetation (Beeri et al., 2007)
") typical spectral signatures of photosynthetically active and non-photosynthetically active vegetation (Beeri et al., 2007) Xie, Y. et al. J Plant Ecol 2008 1:9-23; doi:10.1093/jpe/rtm005 Copyright restrictions
typical spectral signatures of photosynthetically active and non-photosynthetically active vegetation (Beeri et al., 2007) Xie, Y. et al. J Plant Ecol 2008 1:9-23; doi:10.1093/jpe/rtm005 Copyright restrictions
IMPROVEMENT IN THE DETECTION OF LAND COVER CLASSES USING THE WORLDVIEW-2 IMAGERY
 IMPROVEMENT IN THE DETECTION OF LAND COVER CLASSES USING THE WORLDVIEW-2 IMAGERY Ahmed Elsharkawy 1,2, Mohamed Elhabiby 1,3 & Naser El-Sheimy 1,4 1 Dept. of Geomatics Engineering, University of Calgary
MULTI-TEMPORAL IMAGE ANALYSIS OF THE COASTAL WATERSHED, NH INTRODUCTION
 MULTI-TEMPORAL IMAGE ANALYSIS OF THE COASTAL WATERSHED, NH Meghan Graham MacLean, PhD Student Alexis M. Rudko, MS Student Dr. Russell G. Congalton, Professor Department of Natural Resources and the Environment
Land cover change methods. Ned Horning
 Land cover change methods Ned Horning Version: 1.0 Creation Date: 2004-01-01 Revision Date: 2004-01-01 License: This document is licensed under a Creative Commons Attribution-Share Alike 3.0 Unported License.
Geometric Validation of Hyperion Data at Coleambally Irrigation Area
 Geometric Validation of Hyperion Data at Coleambally Irrigation Area Tim McVicar, Tom Van Niel, David Jupp CSIRO, Australia Jay Pearlman, and Pamela Barry TRW, USA Background RICE SOYBEANS The Coleambally
1. INTRODUCTION. GOCI : Geostationary Ocean Color Imager
 1. INTRODUCTION The Korea Ocean Research and Development Institute (KORDI) releases an announcement of opportunity (AO) to carry out scientific research for the utilization of GOCI data. GOCI is the world
Remote Sensing. Odyssey 7 Jun 2012 Benjamin Post
 Remote Sensing Odyssey 7 Jun 2012 Benjamin Post Definitions Applications Physics Image Processing Classifiers Ancillary Data Data Sources Related Concepts Outline Big Picture Definitions Remote Sensing
Haze Detection and Removal in Sentinel 3 OLCI Level 1B Imagery Using a New Multispectral Data Dehazing Method
 Haze Detection and Removal in Sentinel 3 OLCI Level 1B Imagery Using a New Multispectral Data Dehazing Method Xinxin Busch Li, Stephan Recher, Peter Scheidgen July 27 th, 2018 Outline Introduction» Why
Keywords: Agriculture, Olive Trees, Supervised Classification, Landsat TM, QuickBird, Remote Sensing.
 Classification of agricultural fields by using Landsat TM and QuickBird sensors. The case study of olive trees in Lesvos island. Christos Vasilakos, University of the Aegean, Department of Environmental
Outline for today. Geography 411/611 Remote sensing: Principles and Applications. Remote sensing: RS for biogeochemical cycles
 Geography 411/611 Remote sensing: Principles and Applications Thomas Albright, Associate Professor Laboratory for Conservation Biogeography, Department of Geography & Program in Ecology, Evolution, & Conservation
CHARACTERISTICS OF REMOTELY SENSED IMAGERY. Radiometric Resolution
 CHARACTERISTICS OF REMOTELY SENSED IMAGERY Radiometric Resolution There are a number of ways in which images can differ. One set of important differences relate to the various resolutions that images express.
Evaluating the Effects of Shadow Detection on QuickBird Image Classification and Spectroradiometric Restoration
 Remote Sens. 2013, 5, 4450-4469; doi:10.3390/rs5094450 Article OPEN ACCESS Remote Sensing ISSN 2072-4292 www.mdpi.com/journal/remotesensing Evaluating the Effects of Shadow Detection on QuickBird Image
Using Color-Infrared Imagery for Impervious Surface Analysis. Chris Behee City of Bellingham Planning & Community Development
 Using Color-Infrared Imagery for Impervious Surface Analysis. Chris Behee City of Bellingham Planning & Community Development NW GIS Users Group - March 18, 2005 Outline What is Color Infrared Imagery?
EnMAP Environmental Mapping and Analysis Program
 EnMAP Environmental Mapping and Analysis Program www.enmap.org Mathias Schneider Mission Objectives Regular provision of high-quality calibrated hyperspectral data Precise measurement of ecosystem parameters
Using Freely Available. Remote Sensing to Create a More Powerful GIS
 Using Freely Available Government Data and Remote Sensing to Create a More Powerful GIS All rights reserved. ENVI, E3De, IAS, and IDL are trademarks of Exelis, Inc. All other marks are the property of
Chapter 8. Remote sensing
 1. Remote sensing 8.1 Introduction 8.2 Remote sensing 8.3 Resolution 8.4 Landsat 8.5 Geostationary satellites GOES 8.1 Introduction What is remote sensing? One can describe remote sensing in different
remote sensing? What are the remote sensing principles behind these Definition
 Introduction to remote sensing: Content (1/2) Definition: photogrammetry and remote sensing (PRS) Radiation sources: solar radiation (passive optical RS) earth emission (passive microwave or thermal infrared
GIS Data Collection. Remote Sensing
 GIS Data Collection Remote Sensing Data Collection Remote sensing Introduction Concepts Spectral signatures Resolutions: spectral, spatial, temporal Digital image processing (classification) Other systems
MULTI-TEMPORAL SATELLITE IMAGES WITH BATHYMETRY CORRECTION FOR MAPPING AND ASSESSING SEAGRASS BED CHANGES IN DONGSHA ATOLL
 MULTI-TEMPORAL SATELLITE IMAGES WITH BATHYMETRY CORRECTION FOR MAPPING AND ASSESSING SEAGRASS BED CHANGES IN DONGSHA ATOLL Chih -Yuan Lin and Hsuan Ren Center for Space and Remote Sensing Research, National
Development of normalized vegetation, soil and water indices derived from satellite remote sensing data
 Development of normalized vegetation, soil and water indices derived from satellite remote sensing data Takeuchi, W. & Yasuoka, Y. IIS/UT, Japan E-mail: wataru@iis.u-tokyo.ac.jp Nov. 25th, 2004 ACRS2004
Application of GIS to Fast Track Planning and Monitoring of Development Agenda
 Application of GIS to Fast Track Planning and Monitoring of Development Agenda Radiometric, Atmospheric & Geometric Preprocessing of Optical Remote Sensing 13 17 June 2018 Outline 1. Why pre-process remotely
Introduction. Introduction. Introduction. Introduction. Introduction
 Identifying habitat change and conservation threats with satellite imagery Extinction crisis Volker Radeloff Department of Forest Ecology and Management Extinction crisis Extinction crisis Conservationists
FOR 353: Air Photo Interpretation and Photogrammetry. Lecture 2. Electromagnetic Energy/Camera and Film characteristics
 FOR 353: Air Photo Interpretation and Photogrammetry Lecture 2 Electromagnetic Energy/Camera and Film characteristics Lecture Outline Electromagnetic Radiation Theory Digital vs. Analog (i.e. film ) Systems
RGB colours: Display onscreen = RGB
 RGB colours: http://www.colorspire.com/rgb-color-wheel/ Display onscreen = RGB DIGITAL DATA and DISPLAY Myth: Most satellite images are not photos Photographs are also 'images', but digital images are
Viewing New Hampshire from Space
 Viewing New Hampshire from Space A Bird s-eye View of the Granite State! Introduction Environmental changes are a major concern for researchers and policy makers today since these changes have both human
Evaluation of FLAASH atmospheric correction. Note. Note no SAMBA/10/12. Authors. Øystein Rudjord and Øivind Due Trier
 Evaluation of FLAASH atmospheric correction Note Note no Authors SAMBA/10/12 Øystein Rudjord and Øivind Due Trier Date 16 February 2012 Norsk Regnesentral Norsk Regnesentral (Norwegian Computing Center,
RECENT DYNAMICS OF SUBMERGED SHOALS AND CHANNELS AROUND THE KERKENNAH ARCHIPELAGO (TUNISIA) FROM LANDSAT TM AND MODIS
 FROM LANDSAT TM AND MODIS") 2 nd International Conference - Water resources and wetlands. 11-13 September, 2014 Tulcea (Romania); Available online at http://www.limnology.ro/water2014/proceedings.html Editors: Petre Gâştescu ; Włodzimierz
2 nd International Conference - Water resources and wetlands. 11-13 September, 2014 Tulcea (Romania); Available online at http://www.limnology.ro/water2014/proceedings.html Editors: Petre Gâştescu ; Włodzimierz
The studies began when the Tiros satellites (1960) provided man s first synoptic view of the Earth s weather systems.
 provided man s first synoptic view of the Earth s weather systems.") Remote sensing of the Earth from orbital altitudes was recognized in the mid-1960 s as a potential technique for obtaining information important for the effective use and conservation of natural resources.
Remote sensing of the Earth from orbital altitudes was recognized in the mid-1960 s as a potential technique for obtaining information important for the effective use and conservation of natural resources.
REMOTE SENSING INTERPRETATION
 REMOTE SENSING INTERPRETATION Jan Clevers Centre for Geo-Information - WU Remote Sensing --> RS Sensor at a distance EARTH OBSERVATION EM energy Earth RS is a tool; one of the sources of information! 1
TRACS A-B-C Acquisition and Processing and LandSat TM Processing
 TRACS A-B-C Acquisition and Processing and LandSat TM Processing Mark Hess, Ocean Imaging Corp. Kevin Hoskins, Marine Spill Response Corp. TRACS: Level A AIRCRAFT Ocean Imaging Corporation Multispectral/TIR
Shallow Water Remote Sensing
 Shallow Water Remote Sensing John Hedley, IOCCG Summer Class 2018 Overview - different methods and applications Physics-based model inversion methods High spatial resolution imagery and Sentinel-2 Bottom
Using Multi-spectral Imagery in MapInfo Pro Advanced
 Using Multi-spectral Imagery in MapInfo Pro Advanced MapInfo Pro Advanced Tom Probert, Global Product Manager MapInfo Pro Advanced: Intuitive interface for using multi-spectral / hyper-spectral imagery
Remote Sensing of Environment (RSE)
") I N T R O Introduction to Introduction to Remote Sensing T O R S E Remote Sensing of Environment (RSE) with TNTmips page 1 TNTview Before Getting Started Imagery acquired by airborne or satellite sensors
I N T R O Introduction to Introduction to Remote Sensing T O R S E Remote Sensing of Environment (RSE) with TNTmips page 1 TNTview Before Getting Started Imagery acquired by airborne or satellite sensors
Activity Data (AD) Monitoring in the frame of REDD+ MRV
 Monitoring in the frame of REDD+ MRV") Activity Data (AD) Monitoring in the frame of REDD+ MRV Preliminary comments REDD+ is sustainable low emissions, high carbon rural development Monitoring efforts should support this effort Challenges Diversity
Activity Data (AD) Monitoring in the frame of REDD+ MRV Preliminary comments REDD+ is sustainable low emissions, high carbon rural development Monitoring efforts should support this effort Challenges Diversity
Spatial Analyst is an extension in ArcGIS specially designed for working with raster data.
 Spatial Analyst is an extension in ArcGIS specially designed for working with raster data. 1 Do you remember the difference between vector and raster data in GIS? 2 In Lesson 2 you learned about the difference
Remote Sensing Instruction Laboratory
 Laboratory Session 217513 Geographic Information System and Remote Sensing - 1 - Remote Sensing Instruction Laboratory Assist.Prof.Dr. Weerakaset Suanpaga Department of Civil Engineering, Faculty of Engineering
Augment the Spatial Resolution of Multispectral Image Using PCA Fusion Method and Classified It s Region Using Different Techniques.
 Augment the Spatial Resolution of Multispectral Image Using PCA Fusion Method and Classified It s Region Using Different Techniques. Israa Jameel Muhsin 1, Khalid Hassan Salih 2, Ebtesam Fadhel 3 1,2 Department
Monitoring water pollution in the river Ganga with innovations in airborne remote sensing and drone technology
 Monitoring water pollution in the river Ganga with innovations in airborne remote sensing and drone technology RAJIV SINHA, DIPRO SARKAR DEPARTMENT OF EARTH SCIENCES, INDIAN INSTITUTE OF TECHNOLOGY KANPUR,