How to Access Imagery and Carry Out Remote Sensing Analysis Using Landsat Data in a Browser
|
|
|
- Angela Berry
- 5 years ago
- Views:
Transcription

1 How to Access Imagery and Carry Out Remote Sensing Analysis Using Landsat Data in a Browser Including Introduction to Remote Sensing Concepts Based on: igett Remote Sensing Concept Modules and GeoTech Center Model Courses Ann Johnson, GISP Associate Director ann@baremt.com Based upon work supported by the National Science Foundation under Grant DUE ATE and Any opinions, findings, and conclusions or recommendations expressed in this material are those of the author(s) and do not necessarily reflect the views of the National Science Foundation. Empowering Colleges: Expanding the Geospatial Workforce
2 What we will do today: Learn about important remote sensing concepts Learn about new browser based applications to access and study land use Tools and links to concepts using: Unlocking Earth s Secrets Exploring Landsat View a Poster on use of remote sensing using Publisher Hands on exercise using the two applications Use applications to create your own Poster using Publisher and Sipping Tool based on the GeoTech Poster GeoTech will print your Poster if you want it


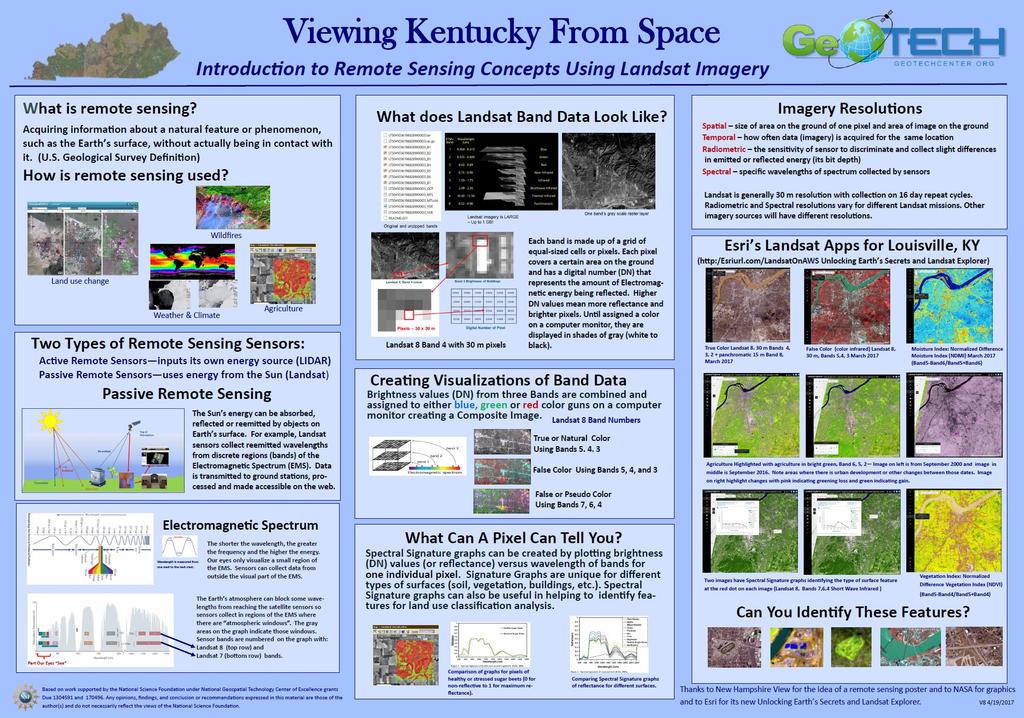
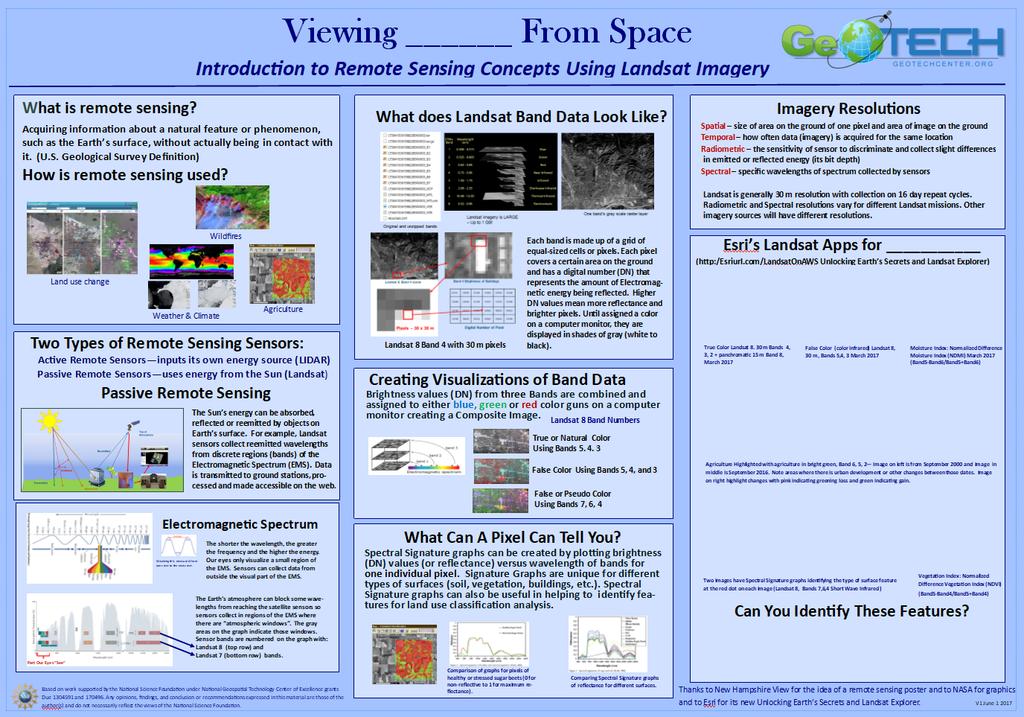
3 How is remote sensing imagery used? Natural Disaster Wildfires Change Detection: Land Use Change Las Vegas Agriculture Climate & Weather U.S. Geological Survey Definition Acquiring information about a natural feature or phenomenon, such as the Earth s surface, without actually being in contact with it.
4 Two Types of Sensors used for Remote Sensing Active Energy source is provided by method LIDAR Light Detection and Ranging using pulsed laser beam (of varying wavelengths) SAR Synthetic Aperture Radar pulses of radio Passive Sun as the energy source Landsat MODIS Aster Other imagery sources Sensors can be on satellites, manned and unmanned (UAS) aircraft, and even on vehicles on the ground.
5 The human eye is a passive sensor using reflected energy from the Sun. Our brain processes the data and we see the feature!
6 Electromagnetic Spectrum Our eyes use only a small region (400 to 700 nm) of the Electromagnetic Spectrum.


7 Sensors on satellites can collect data from multiple regions of the Electromagnetic Spectrum including regions our eyes can t see Top of Atmosphere Absorbed Reflected and Re-emitted Scattered Transmitted


8 For the Landsat Missions, sensor data are stored and transmitted to ground station where it can be processed and made accessible on the web! Top of Atmosphere Reflected or Re-emitted Scattered Transmitted Absorbed


9 Each sensor on a Landsat satellite mission collects data in specific wavelength regions! These regions are numbered and called bands or channels. Gray shading indicates regions of the EM where atmospheric windows permit reflected energy to reach the satellite s sensors! Landsat 8 band numbers Our eyes see this region Note: band numbers for the same region of the EM may vary depending on the Landsat missions Landsat 7 band numbers


10 What does raw band data look like? Each pixel for each band is displayed in gray scale values of relative brightness based on its Digital Number (DN) value Downloaded original data (tar) and unzipped once (tar.gz) and unzipped twice (bands and metadata) Landsat imagery is LARGE Up to 1 GB! Gray scale raster layer for one band


11 Landsat 8 Band 4 Brightness and its Digital Numbers (DN) Landsat 8, Band 4 scene Band 4 Brightness of Buildings Pixels 30 x 30 m Digital Number of Pixel

12 Esri.com help Creating Composite Images Brightness values (DN) from three Bands are combined and assigned to either the red, green, or blue color gun on a computer monitor creating a Composite Image

13 Landsat 7 Composite Images ` Natural or True Color Bands 3, 2, 1 False Color Band 4, 3, 2 Note: A maximum of 3 bands can be combined and visualized on a computer monitor Pseudo Color Bands 7, 5, 3
14 Remote Sensing Imagery Resolutions Spatial size of area on the ground of one pixel and size of image footprint Temporal how often data (imagery) is acquired for the same location Radiometric the sensitivity of sensor to collect very slight differences in emitted or reflected energy (its bit depth) Spectral specific wavelengths of spectrum collected by sensors
 Object")
 Objects smaller than 1 KM not observable Very large footprint http://biodiversityinformatics.amnh.")
15 Spatial Resolution Comparison Scale High spatial resolution: Meter to sub meter pixels Small objects can be identified Small area for each image footprint Moderate spatial resolution Generally 30 meter pixels (Landsat) Object identification generally greater than 30 meters Moderate area image footprint Low spatial resolution Km or larger pixels (MODIS) Objects smaller than 1 KM not observable Very large footprint
16 Radiometric Resolution The sensitivity of the sensors Sensors with low radiometric resolution detect only large differences Sensors with high radiometric resolution can detect smaller differences The range of values each pixel can store for its radiometric resolution Landsat 7 has 256 possible values (2 8 ) and is 8-bit Landsat 8 has possible values of and is 16-bit or (2 16 ) While both Landsat 7 and 8 have 30 m pixels, the greater radiometric sensuosity can provide better visualizations

17 Why Focus on Landsat Data? Cost Free Access Download imagery from websites Continuity - Archive of data over decades 1972 to present Ease of use can be used by various software packages Is available via free Esri ArcWeb Server applications at Unlock Earth s Secrets, and Landsat Explorer Landsat 8 Landsat Missions and dates of operation
18 Different Landsat Missions Use Different Band Numbers and Wavelengths to Visualize Imagery Note: Difference between Landsat 5 and 7 and Landsat 8 bands

19 Spectral Signature graphs can help identify type of feature seen in an image A Spectral Signature Graph uses Digital Number values for one pixel using all bands in an image Useful in Image Classification of features This graph compares Spectral Signatures for health versus stressed sugar beets This graph compares Spectral Signatures for different types of features (soil, vegetation, water, urban, etc.)


20 Determining Land Use Types Image Classification - Unsupervised Classification software clusters like-valued pixels and user defines what the feature is and colors it appropriately - Supervised Classification user creates a sample file of identified land use types and pixel values and software clusters pixels using the sample file values Natural Color Composite of San Fernando Valley, CA Unsupervised Classification - Data clustered by software and colored to match Land Use types. blue = water, green = vegetation, Soil = brown, Beige = urban built up (road, building, etc.)
/(NIR Red) ArcGIS Pro NDVI where green indicates")
21 Visualization of Land Use Patterns Band algebra equations can be used to visualize patterns One common band algebra equation is Normalized Difference Vegetation Index (NDVI) used to visualize greenness of vegetation The NDVI algorithm uses two bands: Near Infra Red and Red NDVI equation using NIR and Red Band DNs NDVI = (NIR + Red)/(NIR Red) ArcGIS Pro NDVI where green indicates vegetation
22 Normal Workflow For Remote Sensing Analysis Using Landsat Imagery Identify a problem you want to investigate Find study area location and determine its Landsat path and row Determine how many scenes and what dates are needed Go to website for imagery data and determine if dates are available if not available, reevaluate needed data that can work for project analysis Download imagery data up to 1 GB per Landsat scene Unzip data twice and store all bands in folders Create a Project and add imagery data Mosaic and Clip imagery bands to study area Create composites of each scene (natural, false, pseudo) Create signature graphs to identify features (urban, soil, vegetation, etc.) Start analysis (NDVI, Classification,....) This process can take days!
23 Instead how about spending an hour or two to quickly review data for your study area before doing more work?
24 Esri s Unlock Earth s Secrets AWS App This is the default opening location Redlands, California using Agriculture composite bands Note: Find a place is not filled in.
25 Esri s Unlock Earth s Secrets AWS App This is the Agriculture button

26 Esri s Unlock Earth s Secrets This is the Natural Color button
27 Esri s Unlock Earth s Secrets This is the Color Infrared button
28 Esri s Unlock Earth s Secrets This is the Vegetation Index button (NDVI)

29 Esri s Unlock Earth s Secrets This is the Moisture Index button
30 Key For Buttons: Landsat 8 Bands Agriculture: Highlights agriculture in bright green. Bands 6,5,2 Natural Color: Sharpened with 15m panchromatic band. Bands 4,3,2+8 Color Infrared (False Color): Healthy vegetation is bright red. Bands 5,4,3 SWIR (Short Wave Infrared): Highlights rock formations. Bands 7,6,4 Geology: Highlights geologic features. Bands 7,4,2 Bathymetric: Highlights underwater features. Bands 4,3,1 Panchromatic: Panchromatic image at 15m. Band 8 Vegetation Index: Normalized Difference Vegetation Index (NDVI). (Band5-Band4)/(Band5+Band4) Moisture Index: Normalized Difference Moisture Index (NDMI). (Band5-Band6)/(Band5+Band6)


31 Search on Washington, D. C. Use + to zoom as far as you can (can you see the Capital and the National Mall Clicking on the clock opens time slider Sliding on the date to November 16 Clicking on the other buttons changes what bands are rendered. How does the scene change? About tells what each render uses. You can change the date to June or July and look again at all buttons to see how it changes. Click on the identify button and different features in the image what does the graph tell you?

32 To start Landsat Explorer scroll down from Unlocking Earth s Secrets and click on Launch Landsat Explorer blue button
 See Story Map examples Tutorial for Landsat Explorer Learn more about")
33 Landsat Explorer data from many Landsat missions New buttons and capabilities Setting your own render (bands) Picking dates Swipe tool between two dates Mask Change Detection Create Spectral Signature graphs Add data from ArcGIS Online Export top layer to AGO Export top layer as image (tif, jpg) See Story Map examples Tutorial for Landsat Explorer Learn more about Landsat


34 Render Pick one and use? to find out more Select the type of composite


35 Both Swipe and Change Detection need two imagery dates Note: you may need to change the render to different composite images and extents: Use Time Slider to find early imagery date and click on Set as Secondary Layer button Then Use Time Slider for a recent imagery date Then go back to either Swipe or Change Detection
")

36 Signature Signature Graphs and information about an image (its Mission, Date, and other information) Select a render Click on the i Click on a different types of Land Cover in image Graph will appear with suggested
37
38
39 Items you have access to: PowerPoint on Concepts and Examples PDF of Kentucky Poster Publisher Poster with blank lines or spaces for your Poster Snipping Tool Internet Access to Unlocking Earth s Secrets and Landsat Explorer Click on Try It Live button Organizational Account Login (not required unless you want to use it) Hands On Browser-based Landsat Exercise
40 Using Snipping Tool Click on the Snipping Tool and then change Mode to Rectangle and set a time delay (this allows you to have dropdowns if you want them). Organize your computer monitor for what you can to capture. Open Snipping Tools and click on New When it is ready (look transparent) click/drag a rectangle around what you want to capture When it is captured and displayed, right click and copy it. Go to where you want to place it, right click and Paste.
. See the project website (http://igettremotesensing.")

41 Material for this module was developed by igett-remote Sensing grant from the National Science Foundation (DUE ). See the project website ( for additional instructional resources including student exercises and videos. Remote sensing Concept Modules can be found on YouTube at the igett Remote Sensing Education Channel
Introduction to Remote Sensing Fundamentals of Satellite Remote Sensing. Mads Olander Rasmussen
 Introduction to Remote Sensing Fundamentals of Satellite Remote Sensing Mads Olander Rasmussen (mora@dhi-gras.com) 01. Introduction to Remote Sensing DHI What is remote sensing? the art, science, and technology
Module 3 Introduction to GIS. Lecture 8 GIS data acquisition
 Module 3 Introduction to GIS Lecture 8 GIS data acquisition GIS workflow Data acquisition (geospatial data input) GPS Remote sensing (satellites, UAV s) LiDAR Digitized maps Attribute Data Management Data
Enhancement of Multispectral Images and Vegetation Indices
 Enhancement of Multispectral Images and Vegetation Indices ERDAS Imagine 2016 Description: We will use ERDAS Imagine with multispectral images to learn how an image can be enhanced for better interpretation.
Lecture 13: Remotely Sensed Geospatial Data
 Lecture 13: Remotely Sensed Geospatial Data A. The Electromagnetic Spectrum: The electromagnetic spectrum (Figure 1) indicates the different forms of radiation (or simply stated light) emitted by nature.
2017 REMOTE SENSING EVENT TRAINING STRATEGIES 2016 SCIENCE OLYMPIAD COACHING ACADEMY CENTERVILLE, OH
 2017 REMOTE SENSING EVENT TRAINING STRATEGIES 2016 SCIENCE OLYMPIAD COACHING ACADEMY CENTERVILLE, OH This presentation was prepared using draft rules. There may be some changes in the final copy of the
An Introduction to Remote Sensing & GIS. Introduction
 An Introduction to Remote Sensing & GIS Introduction Remote sensing is the measurement of object properties on Earth s surface using data acquired from aircraft and satellites. It attempts to measure something
Introduction to Remote Sensing Part 1
 Introduction to Remote Sensing Part 1 A Primer on Electromagnetic Radiation Digital, Multi-Spectral Imagery The 4 Resolutions Displaying Images Corrections and Enhancements Passive vs. Active Sensors Radar
Satellite Remote Sensing: Earth System Observations
 Satellite Remote Sensing: Earth System Observations Land surface Water Atmosphere Climate Ecosystems 1 EOS (Earth Observing System) Develop an understanding of the total Earth system, and the effects of
NON-PHOTOGRAPHIC SYSTEMS: Multispectral Scanners Medium and coarse resolution sensor comparisons: Landsat, SPOT, AVHRR and MODIS
 NON-PHOTOGRAPHIC SYSTEMS: Multispectral Scanners Medium and coarse resolution sensor comparisons: Landsat, SPOT, AVHRR and MODIS CLASSIFICATION OF NONPHOTOGRAPHIC REMOTE SENSORS PASSIVE ACTIVE DIGITAL
Lab 3: Introduction to Image Analysis with ArcGIS 10
 Lab 3: Introduction to Image Analysis with ArcGIS 10 Peter E. Price TerraView 2010 Peter E. Price All rights reserved. Revised 03/2011. Revised for Geob 373 by BK Feb 7, 2017. V9 The information contained
Lesson 3: Working with Landsat Data
 Lesson 3: Working with Landsat Data Lesson Description The Landsat Program is the longest-running and most extensive collection of satellite imagery for Earth. These datasets are global in scale, continuously
Module 11 Digital image processing
 Introduction Geo-Information Science Practical Manual Module 11 Digital image processing 11. INTRODUCTION 11-1 START THE PROGRAM ERDAS IMAGINE 11-2 PART 1: DISPLAYING AN IMAGE DATA FILE 11-3 Display of
GIS Data Collection. Remote Sensing
 GIS Data Collection Remote Sensing Data Collection Remote sensing Introduction Concepts Spectral signatures Resolutions: spectral, spatial, temporal Digital image processing (classification) Other systems
An Introduction to Geomatics. Prepared by: Dr. Maher A. El-Hallaq خاص بطلبة مساق مقدمة في علم. Associate Professor of Surveying IUG
 An Introduction to Geomatics خاص بطلبة مساق مقدمة في علم الجيوماتكس Prepared by: Dr. Maher A. El-Hallaq Associate Professor of Surveying IUG 1 Airborne Imagery Dr. Maher A. El-Hallaq Associate Professor
Sommersemester Prof. Dr. Christoph Kleinn Institut für Waldinventur und Waldwachstum Arbeitsbereich Fernerkundung und Waldinventur.
 Basics of Remote Sensing Some literature references Franklin, SE 2001 Remote Sensing for Sustainable Forest Management Lewis Publishers 407p Lillesand, Kiefer 2000 Remote Sensing and Image Interpretation
Spectral Signatures. Vegetation. 40 Soil. Water WAVELENGTH (microns)
") Spectral Signatures % REFLECTANCE VISIBLE NEAR INFRARED Vegetation Soil Water.5. WAVELENGTH (microns). Spectral Reflectance of Urban Materials 5 Parking Lot 5 (5=5%) Reflectance 5 5 5 5 5 Wavelength (nm)
Spectral Signatures % REFLECTANCE VISIBLE NEAR INFRARED Vegetation Soil Water.5. WAVELENGTH (microns). Spectral Reflectance of Urban Materials 5 Parking Lot 5 (5=5%) Reflectance 5 5 5 5 5 Wavelength (nm)
REMOTE SENSING. Topic 10 Fundamentals of Digital Multispectral Remote Sensing MULTISPECTRAL SCANNERS MULTISPECTRAL SCANNERS
 REMOTE SENSING Topic 10 Fundamentals of Digital Multispectral Remote Sensing Chapter 5: Lillesand and Keifer Chapter 6: Avery and Berlin MULTISPECTRAL SCANNERS Record EMR in a number of discrete portions
Introduction of Satellite Remote Sensing
 Introduction of Satellite Remote Sensing Spatial Resolution (Pixel size) Spectral Resolution (Bands) Resolutions of Remote Sensing 1. Spatial (what area and how detailed) 2. Spectral (what colors bands)
Remote Sensing in an
 Chapter 11: Creating a Composite Image from Landsat Imagery Remote Sensing in an ArcMap Environment Remote Sensing Analysis in an ArcMap Environment Tammy E. Parece Image source: landsat.usgs.gov Tammy
Fundamentals of Remote Sensing
 Climate Variability, Hydrology, and Flooding Fundamentals of Remote Sensing May 19-22, 2015 GEO-Latin American & Caribbean Water Cycle Capacity Building Workshop Cartagena, Colombia 1 Objective To provide
A (very) brief introduction to Remote Sensing: From satellites to maps!
 brief introduction to Remote Sensing: From satellites to maps!") Spatial Data Analysis and Modeling for Agricultural Development, with R - Workshop A (very) brief introduction to Remote Sensing: From satellites to maps! Earthlights DMSP 1994-1995 https://wikimedia.org/
Spatial Data Analysis and Modeling for Agricultural Development, with R - Workshop A (very) brief introduction to Remote Sensing: From satellites to maps! Earthlights DMSP 1994-1995 https://wikimedia.org/
Assessment of Spatiotemporal Changes in Vegetation Cover using NDVI in The Dangs District, Gujarat
 Assessment of Spatiotemporal Changes in Vegetation Cover using NDVI in The Dangs District, Gujarat Using SAGA GIS and Quantum GIS Tutorial ID: IGET_CT_003 This tutorial has been developed by BVIEER as
Using Imagery for Intelligence Analysis. Jim Michel Renee Bernstein
 Using Imagery for Intelligence Analysis Jim Michel Renee Bernstein Deriving Value from GIS and Imagery Capabilities Evolved Along Separate but Parallel Paths GIS Imagery brings value Imagery Contextual
1. Theory of remote sensing and spectrum
 1. Theory of remote sensing and spectrum 7 August 2014 ONUMA Takumi Outline of Presentation Electromagnetic wave and wavelength Sensor type Spectrum Spatial resolution Spectral resolution Mineral mapping
Remote sensing in archaeology from optical to lidar. Krištof Oštir ModeLTER Scientific Research Centre of the Slovenian Academy of Sciences and Arts
 Remote sensing in archaeology from optical to lidar Krištof Oštir ModeLTER Scientific Research Centre of the Slovenian Academy of Sciences and Arts Introduction Optical remote sensing Systems Search for
Using Multi-spectral Imagery in MapInfo Pro Advanced
 Using Multi-spectral Imagery in MapInfo Pro Advanced MapInfo Pro Advanced Tom Probert, Global Product Manager MapInfo Pro Advanced: Intuitive interface for using multi-spectral / hyper-spectral imagery
Introduction to Remote Sensing
 Introduction to Remote Sensing Spatial, spectral, temporal resolutions Image display alternatives Vegetation Indices Image classifications Image change detections Accuracy assessment Satellites & Air-Photos
The (False) Color World
 Color World") There s more to the world than meets the eye In this activity, your group will explore: The Value of False Color Images Different Types of Color Images The Use of Contextual Clues for Feature Identification
There s more to the world than meets the eye In this activity, your group will explore: The Value of False Color Images Different Types of Color Images The Use of Contextual Clues for Feature Identification
Remote Sensing for Rangeland Applications
 Remote Sensing for Rangeland Applications Jay Angerer Ecological Training June 16, 2012 Remote Sensing The term "remote sensing," first used in the United States in the 1950s by Ms. Evelyn Pruitt of the
Remote Sensing in an
 Chapter 15: Spatial Enhancement of Landsat Imagery Remote Sensing in an ArcMap Environment Remote Sensing Analysis in an ArcMap Environment Tammy E. Parece Image source: landsat.usgs.gov Tammy Parece James
Introduction to Remote Sensing
 Introduction to Remote Sensing Trainer Khaled Mashfiq 15 / Nov / 2017 Training Module A2 Session 1 Introduction to the Use of Geospatial Information Technology for Drought Risk Management Phnom Penh, Cambodia
Geo/SAT 2 INTRODUCTION TO REMOTE SENSING
 Geo/SAT 2 INTRODUCTION TO REMOTE SENSING Paul R. Baumann, Professor Emeritus State University of New York College at Oneonta Oneonta, New York 13820 USA COPYRIGHT 2008 Paul R. Baumann Introduction Remote
Interpreting land surface features. SWAC module 3
 Interpreting land surface features SWAC module 3 Interpreting land surface features SWAC module 3 Different kinds of image Panchromatic image True-color image False-color image EMR : NASA Echo the bat
GEOG432: Remote sensing Lab 3 Unsupervised classification
 GEOG432: Remote sensing Lab 3 Unsupervised classification Goal: This lab involves identifying land cover types by using agorithms to identify pixels with similar Digital Numbers (DN) and spectral signatures
earthobservation.wordpress.com
 Dirty REMOTE SENSING earthobservation.wordpress.com Stuart Green Teagasc Stuart.Green@Teagasc.ie 1 Purpose Give you a very basic skill set and software training so you can: find free satellite image data.
Outline for today. Geography 411/611 Remote sensing: Principles and Applications. Remote sensing: RS for biogeochemical cycles
 Geography 411/611 Remote sensing: Principles and Applications Thomas Albright, Associate Professor Laboratory for Conservation Biogeography, Department of Geography & Program in Ecology, Evolution, & Conservation
Remote Sensing Platforms
 Types of Platforms Lighter-than-air Remote Sensing Platforms Free floating balloons Restricted by atmospheric conditions Used to acquire meteorological/atmospheric data Blimps/dirigibles Major role - news
Downloading and formatting remote sensing imagery using GLOVIS
 Downloading and formatting remote sensing imagery using GLOVIS Students will become familiarized with the characteristics of LandSat, Aerial Photos, and ASTER medium resolution imagery through the USGS
Remote Sensing. The following figure is grey scale display of SPOT Panchromatic without stretching.
 Remote Sensing Objectives This unit will briefly explain display of remote sensing image, geometric correction, spatial enhancement, spectral enhancement and classification of remote sensing image. At
Lecture 6: Multispectral Earth Resource Satellites. The University at Albany Fall 2018 Geography and Planning
 Lecture 6: Multispectral Earth Resource Satellites The University at Albany Fall 2018 Geography and Planning Outline SPOT program and other moderate resolution systems High resolution satellite systems
Remote Sensing and GIS
 Remote Sensing and GIS Atmosphere Reflected radiation, e.g. Visible Emitted radiation, e.g. Infrared Backscattered radiation, e.g. Radar (λ) Visible TIR Radar & Microwave 11/9/2017 Geo327G/386G, U Texas,
INTRODUCTORY REMOTE SENSING. Geob 373
 INTRODUCTORY REMOTE SENSING Geob 373 Landsat 7 15 m image highlighting the geology of Oman http://www.satimagingcorp.com/gallery-landsat.html ASTER 15 m SWIR image, Escondida Mine, Chile http://www.satimagingcorp.com/satellite-sensors/aster.html
White paper brief IdahoView Imagery Services: LISA 1 Technical Report no. 2 Setup and Use Tutorial
 White paper brief IdahoView Imagery Services: LISA 1 Technical Report no. 2 Setup and Use Tutorial Keith T. Weber, GISP, GIS Director, Idaho State University, 921 S. 8th Ave., stop 8104, Pocatello, ID
Introduction to image processing for remote sensing: Practical examples
 Università degli studi di Roma Tor Vergata Corso di Telerilevamento e Diagnostica Elettromagnetica Anno accademico 2010/2011 Introduction to image processing for remote sensing: Practical examples Dr.
Lesson 9: Multitemporal Analysis
 Lesson 9: Multitemporal Analysis Lesson Description Multitemporal change analyses require the identification of features and measurement of their change through time. In this lesson, we will examine vegetation
Satellite Imagery and Remote Sensing. DeeDee Whitaker SW Guilford High EES & Chemistry
 Satellite Imagery and Remote Sensing DeeDee Whitaker SW Guilford High EES & Chemistry whitakd@gcsnc.com Outline What is remote sensing? How does remote sensing work? What role does the electromagnetic
Standing Up NAIP and Landsat Image Services as a Processing Resource. Andrew Leason
 Standing Up NAIP and Landsat Image Services as a Processing Resource Andrew Leason NAIP and Landsat services Differences Different general uses - Landsat - Available from USGS - Designed as an analytical
Some Basic Concepts of Remote Sensing. Lecture 2 August 31, 2005
 Some Basic Concepts of Remote Sensing Lecture 2 August 31, 2005 What is remote sensing Remote Sensing: remote sensing is science of acquiring, processing, and interpreting images and related data that
A broad survey of remote sensing applications for many environmental disciplines
 1 2 3 4 A broad survey of remote sensing applications for many environmental disciplines 5 6 7 8 9 10 1. First definition is very general and applies to many types of remote sensing. You use your eyes
remote sensing? What are the remote sensing principles behind these Definition
 Introduction to remote sensing: Content (1/2) Definition: photogrammetry and remote sensing (PRS) Radiation sources: solar radiation (passive optical RS) earth emission (passive microwave or thermal infrared
Land Cover Analysis to Determine Areas of Clear-cut and Forest Cover in Olney, Montana. Geob 373 Remote Sensing. Dr Andreas Varhola, Kathry De Rego
 1 Land Cover Analysis to Determine Areas of Clear-cut and Forest Cover in Olney, Montana Geob 373 Remote Sensing Dr Andreas Varhola, Kathry De Rego Zhu an Lim (14292149) L2B 17 Apr 2016 2 Abstract Montana
9/12/2011. Training Course Remote Sensing Basic Theory & Image Processing Methods September 2011
 Training Course Remote Sensing Basic Theory & Image Processing Methods 19 23 September 2011 Popular Remote Sensing Sensors & their Selection Michiel Damen (September 2011) damen@itc.nl 1 Overview Low resolution
Visualizing a Pixel. Simulate a Sensor s View from Space. In this activity, you will:
 Simulate a Sensor s View from Space In this activity, you will: Measure and mark pixel boundaries Learn about spatial resolution, pixels, and satellite imagery Classify land cover types Gain exposure to
Using Freely Available. Remote Sensing to Create a More Powerful GIS
 Using Freely Available Government Data and Remote Sensing to Create a More Powerful GIS All rights reserved. ENVI, E3De, IAS, and IDL are trademarks of Exelis, Inc. All other marks are the property of
Unsupervised Classification
 Unsupervised Classification Using SAGA Tutorial ID: IGET_RS_007 This tutorial has been developed by BVIEER as part of the IGET web portal intended to provide easy access to geospatial education. This tutorial
DISTINGUISHING URBAN BUILT-UP AND BARE SOIL FEATURES FROM LANDSAT 8 OLI IMAGERY USING DIFFERENT DEVELOPED BAND INDICES
 DISTINGUISHING URBAN BUILT-UP AND BARE SOIL FEATURES FROM LANDSAT 8 OLI IMAGERY USING DIFFERENT DEVELOPED BAND INDICES Mark Daryl C. Janiola (1), Jigg L. Pelayo (1), John Louis J. Gacad (1) (1) Central
Land Cover Change Analysis An Introduction to Land Cover Change Analysis using the Multispectral Image Data Analysis System (MultiSpec )
") Land Cover Change Analysis An Introduction to Land Cover Change Analysis using the Multispectral Image Data Analysis System (MultiSpec ) Level: Grades 9 to 12 Windows version With Teacher Notes Earth Observation
Land Cover Change Analysis An Introduction to Land Cover Change Analysis using the Multispectral Image Data Analysis System (MultiSpec ) Level: Grades 9 to 12 Windows version With Teacher Notes Earth Observation
Using Soil Productivity to Assess Agricultural Land Values in North Dakota
 Using Soil Productivity to Assess Agricultural Land Values in North Dakota STUDENT HANDOUT Overview Why is assigning a true and full value to agricultural land parcels important? Agricultural production
LAND SURFACE TEMPERATURE MONITORING THROUGH GIS TECHNOLOGY USING SATELLITE LANDSAT IMAGES
 Abstract LAND SURFACE TEMPERATURE MONITORING THROUGH GIS TECHNOLOGY USING SATELLITE LANDSAT IMAGES Aurelian Stelian HILA, Zoltán FERENCZ, Sorin Mihai CIMPEANU University of Agronomic Sciences and Veterinary
Separation of crop and vegetation based on Digital Image Processing
 Separation of crop and vegetation based on Digital Image Processing Mayank Singh Sakla 1, Palak Jain 2 1 M.TECH GEOMATICS student, CEPT UNIVERSITY 2 M.TECH GEOMATICS student, CEPT UNIVERSITY Word Limit
Lab 1 Introduction to ENVI
 Remote sensing for agricultural applications: principles and methods (2013-2014) Instructor: Prof. Tao Cheng (tcheng@njau.edu.cn) Nanjing Agricultural University Lab 1 Introduction to ENVI April 1 st,
Int n r t o r d o u d c u ti t on o n to t o Remote Sensing
 Introduction to Remote Sensing Definition of Remote Sensing Remote sensing refers to the activities of recording/observing/perceiving(sensing)objects or events at far away (remote) places. In remote sensing,
White paper brief IdahoView Imagery Services: LISA 1 Technical Report no. 1 Processing and Evaluation
 White paper brief IdahoView Imagery Services: LISA 1 Technical Report no. 1 Processing and Evaluation Keith T. Weber, GISP, GIS Director, Idaho State University, 921 S. 8th Ave., stop 8104, Pocatello,
Making NDVI Images using the Sony F717 Nightshot Digital Camera and IR Filters and Software Created for Interpreting Digital Images.
 Making NDVI Images using the Sony F717 Nightshot Digital Camera and IR Filters and Software Created for Interpreting Digital Images Draft 1 John Pickle Museum of Science October 14, 2004 Digital Cameras
Chapter 1 Overview of imaging GIS
 Chapter 1 Overview of imaging GIS Imaging GIS, a term used in the medical imaging community (Wang 2012), is adopted here to describe a geographic information system (GIS) that displays, enhances, and facilitates
Introduction to Remote Sensing
 Introduction to Remote Sensing Outline Remote Sensing Defined Resolution Electromagnetic Energy (EMR) Types Interpretation Applications Remote Sensing Defined Remote Sensing is: The art and science of
IKONOS High Resolution Multispectral Scanner Sensor Characteristics
 High Spatial Resolution and Hyperspectral Scanners IKONOS High Resolution Multispectral Scanner Sensor Characteristics Launch Date View Angle Orbit 24 September 1999 Vandenberg Air Force Base, California,
GEOG432: Remote sensing Lab 3 Unsupervised classification
 GEOG432: Remote sensing Lab 3 Unsupervised classification Goal: This lab involves identifying land cover types by using agorithms to identify pixels with similar Digital Numbers (DN) and spectral signatures
Remote Sensing 1 Principles of visible and radar remote sensing & sensors
 Remote Sensing 1 Principles of visible and radar remote sensing & sensors Nick Barrand School of Geography, Earth & Environmental Sciences University of Birmingham, UK Field glaciologist collecting data
In late April of 1986 a nuclear accident damaged a reactor at the Chernobyl nuclear
 CHERNOBYL NUCLEAR POWER PLANT ACCIDENT Long Term Effects on Land Use Patterns Project Introduction: In late April of 1986 a nuclear accident damaged a reactor at the Chernobyl nuclear power plant in Ukraine.
Remote Sensing. Division C. Written Exam
 Remote Sensing Division C Written Exam Team Name: Team #: Team Members: _ Score: /132 A. Matching (10 points) 1. Nadir 2. Albedo 3. Diffraction 4. Refraction 5. Spatial Resolution 6. Temporal Resolution
John P. Stevens HS: Remote Sensing Test
 Name(s): Date: Team name: John P. Stevens HS: Remote Sensing Test 1 Scoring: Part I - /18 Part II - /40 Part III - /16 Part IV - /14 Part V - /93 Total: /181 2 I. History (3 pts. each) 1. What is the name
INTRODUCTION TO REMOTE SENSING AND ITS APPLICATIONS
 INTRODUCTION TO REMOTE SENSING AND ITS APPLICATIONS Prof. Dr. Abudeif A. Bakheit Geology Department. Faculty of Science Assiut University This representation was prepared from different power point representations
The New Rig Camera Process in TNTmips Pro 2018
 The New Rig Camera Process in TNTmips Pro 2018 Jack Paris, Ph.D. Paris Geospatial, LLC, 3017 Park Ave., Clovis, CA 93611, 559-291-2796, jparis37@msn.com Kinds of Digital Cameras for Drones Two kinds of
Remote Sensing. Odyssey 7 Jun 2012 Benjamin Post
 Remote Sensing Odyssey 7 Jun 2012 Benjamin Post Definitions Applications Physics Image Processing Classifiers Ancillary Data Data Sources Related Concepts Outline Big Picture Definitions Remote Sensing
Basic Hyperspectral Analysis Tutorial
 Basic Hyperspectral Analysis Tutorial This tutorial introduces you to visualization and interactive analysis tools for working with hyperspectral data. In this tutorial, you will: Analyze spectral profiles
Quantifying Land Cover Changes in Maine
 Quantifying Land Cover Changes in Maine! STUDENT HANDOUT Introduction Change detection tools enable us to compare satellite data from different times to assess damage from natural disasters, characterize
Raster is faster but vector is corrector
 Account not required Raster is faster but vector is corrector The old GIS adage raster is faster but vector is corrector comes from the two different fundamental GIS models: vector and raster. Each of
Monitoring agricultural plantations with remote sensing imagery
 MPRA Munich Personal RePEc Archive Monitoring agricultural plantations with remote sensing imagery Camelia Slave and Anca Rotman University of Agronomic Sciences and Veterinary Medicine - Bucharest Romania,
Saturation And Value Modulation (SVM): A New Method For Integrating Color And Grayscale Imagery
: A New Method For Integrating Color And Grayscale Imagery") 87 Saturation And Value Modulation (SVM): A New Method For Integrating Color And Grayscale Imagery By David W. Viljoen 1 and Jeff R. Harris 2 Geological Survey of Canada 615 Booth St. Ottawa, ON, K1A 0E9
87 Saturation And Value Modulation (SVM): A New Method For Integrating Color And Grayscale Imagery By David W. Viljoen 1 and Jeff R. Harris 2 Geological Survey of Canada 615 Booth St. Ottawa, ON, K1A 0E9
Course overview; Remote sensing introduction; Basics of image processing & Color theory
 GEOL 1460 /2461 Ramsey Introduction to Remote Sensing Fall, 2018 Course overview; Remote sensing introduction; Basics of image processing & Color theory Week #1: 29 August 2018 I. Syllabus Review we will
QGIS LAB SERIES GST 101: Introduction to Geospatial Technology Lab 6: Understanding Remote Sensing and Analysis
 QGIS LAB SERIES GST 101: Introduction to Geospatial Technology Lab 6: Understanding Remote Sensing and Analysis Objective Explore and Understand How to Display and Analyze Remotely Sensed Imagery Document
Govt. Engineering College Jhalawar Model Question Paper Subject- Remote Sensing & GIS
 Govt. Engineering College Jhalawar Model Question Paper Subject- Remote Sensing & GIS Time: Max. Marks: Q1. What is remote Sensing? Explain the basic components of a Remote Sensing system. Q2. What is
Blacksburg, VA July 24 th 30 th, 2010 Remote Sensing Page 1. A condensed overview. For our purposes
 A condensed overview George McLeod Prepared by: With support from: NSF DUE-0903270 in partnership with: Geospatial Technician Education Through Virginia s Community Colleges (GTEVCC) The art and science
Aral Sea profile Selection of area 24 February April May 1998
 250 km Aral Sea profile 1960 1960 1985 1986 1987 1988 1989 1990 1991 1992 1993 1994 1995 1996 1997 1998 2010? Selection of area Area of interest Kzyl-Orda Dried seabed 185 km Syrdarya river Aral Sea Salt
CHANGE DETECTION USING OPTICAL DATA IN SNAP
 CHANGE DETECTION USING OPTICAL DATA IN SNAP EXERCISE 1 (Water change detection) Data: Sentinel-2A Level 2A: S2A_MSIL2A_20170101T082332_N0204_R121_T34HCH_20170101T084543.SAFE S2A_MSIL2A_20180116T082251_N0206_R121_T34HCH_20180116T120458.SAFE
The studies began when the Tiros satellites (1960) provided man s first synoptic view of the Earth s weather systems.
 provided man s first synoptic view of the Earth s weather systems.") Remote sensing of the Earth from orbital altitudes was recognized in the mid-1960 s as a potential technique for obtaining information important for the effective use and conservation of natural resources.
Remote sensing of the Earth from orbital altitudes was recognized in the mid-1960 s as a potential technique for obtaining information important for the effective use and conservation of natural resources.
Remote Sensing Platforms
 Remote Sensing Platforms Remote Sensing Platforms - Introduction Allow observer and/or sensor to be above the target/phenomena of interest Two primary categories Aircraft Spacecraft Each type offers different
Spatial Analyst is an extension in ArcGIS specially designed for working with raster data.
 Spatial Analyst is an extension in ArcGIS specially designed for working with raster data. 1 Do you remember the difference between vector and raster data in GIS? 2 In Lesson 2 you learned about the difference
29 th Annual Louisiana RS/GIS Workshop April 23, 2013 Cajundome Convention Center Lafayette, Louisiana
 Landsat Data Continuity Mission 29 th Annual Louisiana RS/GIS Workshop April 23, 2013 Cajundome Convention Center Lafayette, Louisiana http://landsat.usgs.gov/index.php# Landsat 5 Sets Guinness World Record
Overview of how remote sensing is used by the wildland fire community.
 Overview of how remote sensing is used by the wildland fire community. Presented to the ASEN 6210 Remote Sensing Seminar on 2/18/04 by: Jeff Baranyi ESRI Denver Reported by Gary Fager. Images are from
RADAR (RAdio Detection And Ranging)
") RADAR (RAdio Detection And Ranging) CLASSIFICATION OF NONPHOTOGRAPHIC REMOTE SENSORS PASSIVE ACTIVE DIGITAL CAMERA THERMAL (e.g. TIMS) VIDEO CAMERA MULTI- SPECTRAL SCANNERS VISIBLE & NIR MICROWAVE Real
RADAR (RAdio Detection And Ranging) CLASSIFICATION OF NONPHOTOGRAPHIC REMOTE SENSORS PASSIVE ACTIVE DIGITAL CAMERA THERMAL (e.g. TIMS) VIDEO CAMERA MULTI- SPECTRAL SCANNERS VISIBLE & NIR MICROWAVE Real
Introduction to Remote Sensing
 Introduction to Remote Sensing Dr. Mathias (Mat) Disney UCL Geography Office: 301, 3rd Floor, Chandler House Tel: 7670 4290 Email: mdisney@ucl.geog.ac.uk www.geog.ucl.ac.uk/~mdisney 1 Course outline Format
Aerial photography and Remote Sensing. Bikini Atoll, 2013 (60 years after nuclear bomb testing)
") Aerial photography and Remote Sensing Bikini Atoll, 2013 (60 years after nuclear bomb testing) Computers have linked mapping techniques under the umbrella term : Geomatics includes all the following spatial
Aerial photography and Remote Sensing Bikini Atoll, 2013 (60 years after nuclear bomb testing) Computers have linked mapping techniques under the umbrella term : Geomatics includes all the following spatial
Active and Passive Microwave Remote Sensing
 Active and Passive Microwave Remote Sensing Passive remote sensing system record EMR that was reflected (e.g., blue, green, red, and near IR) or emitted (e.g., thermal IR) from the surface of the Earth.
Land Cover Change Analysis An Introduction to Land Cover Change Analysis using the Multispectral Image Data Analysis System (MultiSpec )
") Land Cover Change Analysis An Introduction to Land Cover Change Analysis using the Multispectral Image Data Analysis System (MultiSpec ) Level: Grades 9 to 12 Macintosh version Earth Observation Day Tutorial
Land Cover Change Analysis An Introduction to Land Cover Change Analysis using the Multispectral Image Data Analysis System (MultiSpec ) Level: Grades 9 to 12 Macintosh version Earth Observation Day Tutorial
Lecture 2. Electromagnetic radiation principles. Units, image resolutions.
 NRMT 2270, Photogrammetry/Remote Sensing Lecture 2 Electromagnetic radiation principles. Units, image resolutions. Tomislav Sapic GIS Technologist Faculty of Natural Resources Management Lakehead University
APCAS/10/21 April 2010 ASIA AND PACIFIC COMMISSION ON AGRICULTURAL STATISTICS TWENTY-THIRD SESSION. Siem Reap, Cambodia, April 2010
 APCAS/10/21 April 2010 Agenda Item 8 ASIA AND PACIFIC COMMISSION ON AGRICULTURAL STATISTICS TWENTY-THIRD SESSION Siem Reap, Cambodia, 26-30 April 2010 The Use of Remote Sensing for Area Estimation by Robert
Lecture 1 Introduction to Remote Sensing
 Lecture 1 Introduction to Remote Sensing Dr Ian Leiper School of Environmental and Life Sciences Bldg Purple 12.2.27 1 2 Lecture Outline Introductions Unit admin Learning outcomes Unit outline Practicals
9/12/2011. Training Course Remote Sensing Basic Theory & Image Processing Methods September 2011
 Training Course Remote Sensing Basic Theory & Image Processing Methods 19 23 September 2011 Introduction to Remote Sensing Michiel Damen (September 2011) damen@itc.nl 1 Overview Some definitions Remote