OPTICAL RS IMAGE INTERPRETATION
|
|
|
- Jonas Burns
- 6 years ago
- Views:
Transcription
1 1 OPTICAL RS IMAGE INTERPRETATION Lecture 8
2 Visible Middle Infrared Image Bands 2 Data Processing Information data in a useable form Interpretation Visual AI (Machine learning) Recognition, Classification, Knowledge


3 Interpretation 3 Major issues: Scale Perspective Wavelengths
4 Interpretation : Visual Interpretation 4 Key image characteristics used in visual image interpretations Shape Size Pattern Tone or hue Texture Shadows Site Association Resolution

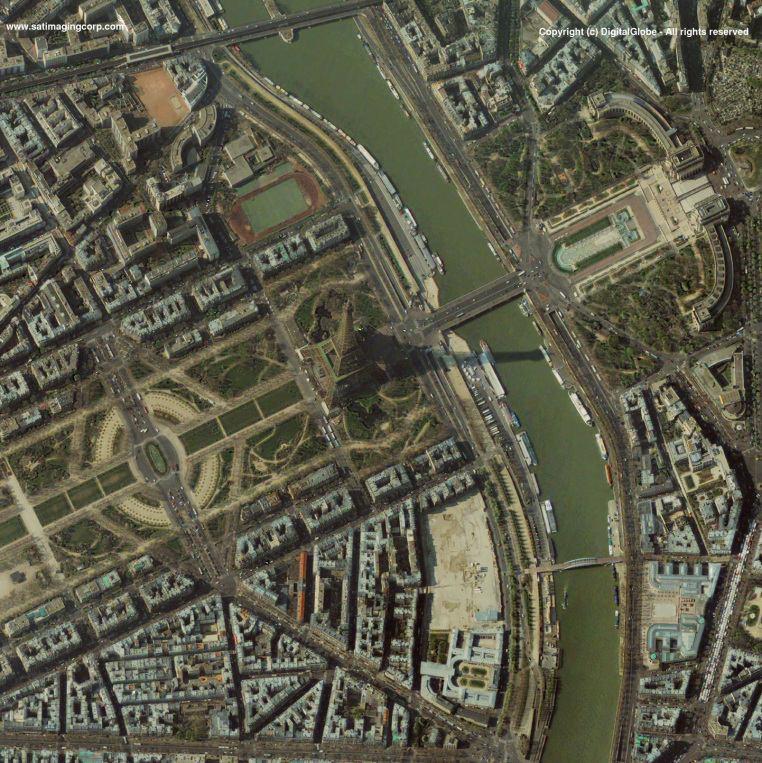
5 Interpretation : Shape 5 General form Configuration Outline of objects. Some objects identified based exclusively on shape, for example, cultural features.
6 Interpretation : Shadows 6 Offer a profile view, hence easier to interpret (natural way of looking) However, objects in the shadows are dark, hence not seen clearly
7 Interpretation : Shadows 7
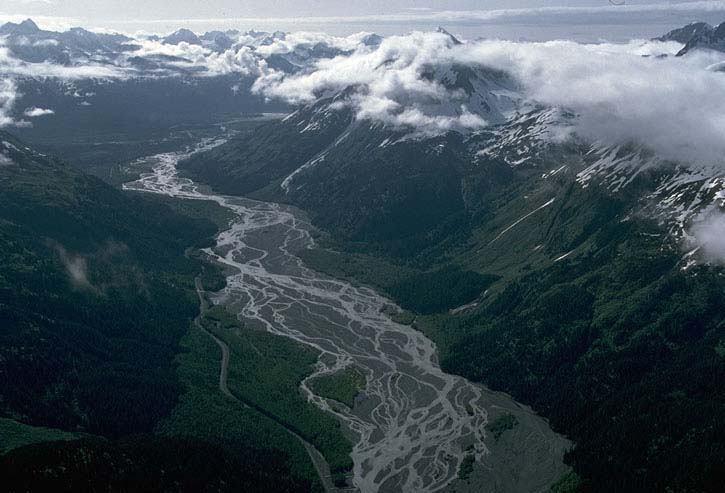
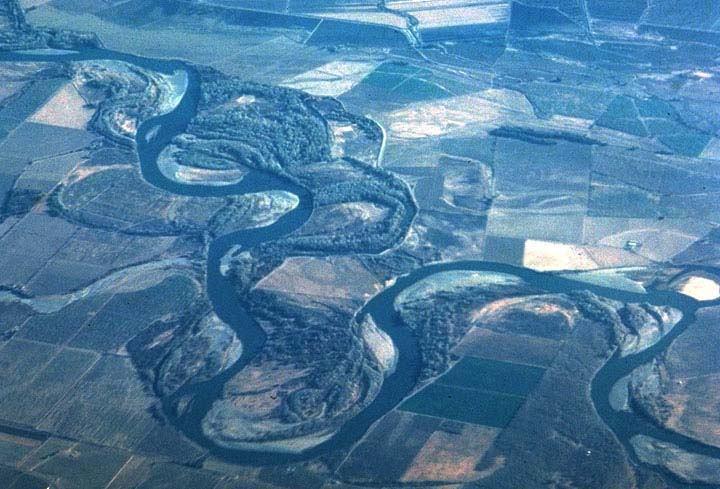
8 Interpretation : Pattern 8 Spatial arrangement of objects. Repetition of certain forms or relationships. Forest, cultivated land, orchards, urban areas etc.

9 Color model : RGB 9 The RGB color model The RGB color model is additive in the sense that the three light beams are added together, and their light spectra add, wavelength for wavelength, to make the final color's spectrum

10 Color model : CMY 10 The CMY color model The CMY color model is a subtractive because it describes what kind of inks need to be applied so the light reflected from the substrate and through the inks produces a given color.
")
11 Color model : HSV 11 HSV is the most common cylindrical-coordinate representations of points in an RGB color model, which rearrange the geometry of RGB in an attempt to be more intuitive and perceptually relevant than the Cartesian (cube) representation.
12 Color model : HSV 12 Amplitude 0.5 μm Wavelength Hue: Dominant wavelength in the colour that is, the wavelength within the EM spectrum at which the energy output from a source is greatest. Saturation : The relative bandwidth of the energy output, defined by the slope and spread of the curves Value: A relative expression of the intensity of the energy output. It can be expressed as the amplitude at the wavelength where the intensity is greatest.


 variations, one can neither discern patterns,")
13 Interpretation : Tone or Hue, Saturation, and Brightness (Value) 13 Critical properties that are dependent on the spectral reflectance characteristics, Hence indicate physical and chemical properties of objects Change in tone indicates a change in shape (geometrical configuration), or in physical/chemical composition Without tonal (or hue, saturation and brightness) variations, one can neither discern patterns, nor shape nor size nor texture

14 14 The Anti-Atlas Mountains of Morocco formed as a result of the collision of the African and Eurasian tectonic plates about 80 million years ago. This collision destroyed the Tethys Ocean; the limestone, sandstone, claystone, and gypsum layers that formed the ocean bed were folded and crumpled to create the Atlas and Anti-Atlas Mountains. In this ASTER image, short wavelength infrared bands are combined to dramatically highlight the different rock types, and illustrate the complex folding. The yellowish, orange and green areas are limestones, sandstones and gypsum; the dark blue and green areas are underlying granitic rocks. The ability to map geology using ASTER data is enhanced by the multiple SWIR bands, that are sensitive to differences in rock mineralogy.
15 Interpretation : Pattern 15


16 16 ASTER image in the German state of North Rhine Westphalia covers an area of 30 by 36 km, and was acquired on August 26, On the right side of the image are 3 enormous opencast coal mines. The Hambach opencast coal mine has recently been brought to full output capacity
 and a large agricultural development effort (the Tierras Baja project) has lead to this area's")

17 17 These images from 1986 and 2001 are for an area of tropical dry forest lying east of Santa Cruz de la Sierra, Bolivia. Since the mid-1980s, the resettlement of people from the Altiplano (the Andean high plains) and a large agricultural development effort (the Tierras Baja project) has lead to this area's deforestation. Soybean production began in earnest in the early 1970s following a substantial increase in the crop's world price. The pie or radial patterned fields are part of the San Javier resettlement scheme. At the center of each unit is a small community that includes a church, bar/café, school, and soccer field. The rectangular, light colored areas are fields of soybeans cultivated for export, mostly funded by foreign loans. The dark strips running through the fields are windbreaks, which are advantageous because the soils in this area are fine and prone to wind erosion. Each image covers an area of 17.6 x 35 km. The 1986 Landsat image was acquired on August 4, 1986, and the ASTER image on August 11, The image is centered at 17.8 degrees south latitude, 63 degrees west longitude.


18 Santa Cruz de la Sierra, Bolivia 18


19 19 This May 19, 2000 sub-scene of the US- Mexico border in California, covers an area of 24 by 30 km. The combination of visible and near infrared bands displays vegetation in red. The border town of Mexicali-Calexico spans the border in the middle of the image; El Centro, California is in the upper left. The dramatic difference in land use patterns between the US and Mexico is highlighted by the lush, regularly gridded agricultural fields of the US, and the more barren fields of Mexico. The Imperial Valley of California is one of the major fruit and vegetable producers for the US, watered by canals fed from the Colorado River. The image is centered at 32.7 degrees north latitude, degrees west longitude Mexicali-Calexico
20 20
21 Interpreting Optical Remote Sensing Images 21 Four main types of information contained in an optical image are often utilized for image interpretation: Radiometric Information (i.e. brightness, intensity, tone) Spectral Information (i.e. colour, hue) Textural Information Geometric and Contextual Information.
22 Interpreting Optical Remote Sensing Images 22 Panchromatic Images A panchromatic image consists of only one band. It is usually displayed as a grey scale image, i.e. the displayed brightness of a particular pixel is proportional to the pixel digital number which is related to the intensity of solar radiation reflected by the targets in the pixel and detected by the detector. Thus, a panchromatic image may be similarly interpreted as a black-and-white aerial photograph of the area. The Radiometric Information is the main information type utilized in the interpretation.

23 SPOT Panchromatic 23 A panchromatic image extracted from a SPOT panchromatic scene at a ground resolution of 10 m. The ground coverage is about 6.5 km (width) by 5.5 km (height). The urban area at the bottom left and a clearing near the top of the image have high reflected intensity, while the vegetated areas on the right part of the image are generally dark. Roads and blocks of buildings in the urban area are visible. A river flowing through the vegetated area, cutting across the top right corner of the image can be seen. The river appears bright due to sediments while the sea at the bottom edge of the image appears dark.
24 24 SPOT Multi-spectral Multispectral Images A multispectral consists of several bands of data. For visual display, each band of the image may be displayed one band at a time as a grey scale image, or in combination of three bands at a time as a colour composite image. Interpretation of a multispectral colour composite image will require the knowledge of the spectral reflectance signature of the targets in the scene. In this case, the spectral information content of the image is utilized in the interpretation. The following three images show the three bands of a multispectral image extracted from a SPOT multispectral scene at a ground resolution of 20 m. The area covered is the same as that shown in the above panchromatic image. Note that both the XSI (Green) and XS2 (Red) bands look almost identical to the panchromatic image. In contrast, the vegetated areas now appear bright in the XS3 (Near Infrared) band due to high reflectance of leaves in the near infrared wavelength region. Several shades of grey can be identified for the vegetated areas, corresponding to different types of vegetation. Water mass (both the river and the sea) appear dark in the XS3 (near IR) band. XS1 (Green) XS2 (Red) XS3 (Near IR)
25 Colour composites 25 True Colour Composites If a multispectral image consists of the three visual primary colour bands (Red, Green, Blue), the three bands may be combined to produce a "true colour" image. For example, the bands 3 (red band), 2 (green band) and 1 (blue band) of a Landsat TM image or an IKONOS multispectral image can be assigned respectively to the R, G, and B colours for display. In this way, the colours of the resulting colour composite image resemble closely what would be observed by the human eyes.

26 True Colour Composite 26 A 1-m resolution true-colour IKONOS image.
27 Colour composites 27 False Colour Composites (FCC) Colour assignment for any band of a multispectral image can be done in an entirely arbitrary manner. The colour of a target in the displayed image does not have any resemblance to its actual colour. The resulting product is known as a false colour composite image. There are many possible schemes of producing false colour composite images. However, some scheme may be more suitable for detecting certain objects in the image. A very common false colour composite scheme for displaying a SPOT multispectral image is shown below: R = XS3 (NIR band) G = XS2 (red band) B = XS1 (green band) This false colour composite scheme allows vegetation to be detected readily in the image. In this type of false colour composite images, vegetation appears in different shades of red depending on the types and conditions of the vegetation, since it has a high reflectance in the NIR band as in the graph of spectral reflectance signature

28 False Colour Composite 28 False colour composite multispectral SPOT image: Red: XS3; Green: XS2; Blue: XS1
29 False Colour Composite 29 Another common false colour composite scheme for displaying an optical image with a short-wave infrared (SWIR) band is shown below: R = SWIR band (SPOT4 band 4, Landsat TM band 5) G = NIR band (SPOT4 band 3, Landsat TM band 4) B = Red band (SPOT4 band 2, Landsat TM band 3)


30 30 False Colour Composite : FCCof a SPOT 4 multispectral image including the SWIR/excluding SWIR Including the SWIR band: Red: SWIR band; Green: NIR band; Blue: Red band. In this display scheme, vegetation appears in shades of green. Bare soils and clearcut areas appear purplish or magenta. The patch of bright red area on the left is the location of active fires. A smoke plume originating from the active fire site appears faint bluish in colour. Excluding the SWIR band: Red: NIR band; Green: Red band; Blue: Green band. Vegetation appears in shades of red. The smoke plume appears bright bluish white.
31 Natural Colour Composites (NCC) 31 For optical images lacking one or more of the three visual primary colour bands (i.e. red, green and blue), the spectral bands (some of which may not be in the visible region) may be combined in such a way that the appearance of the displayed image resembles a visible colour photograph, i.e. vegetation in green, water in blue, soil in brown or grey, etc. Many people refer to this composite as a "true colour" composite. However, this term is misleading since in many instances the colours are only simulated to look similar to the "true" colours of the targets. The term "natural colour" is preferred.
32 Natural Colour Composites (NCC) 32 The SPOT HRV multispectral sensor does not have a blue band. The three bands, XS1, XS2 and XS3 correspond to the green, red, and NIR bands respectively. But a reasonably good natural colour composite can be produced by the following combination of the spectral bands: R = XS2 G = (3 XS1 + XS3)/4 B = (3 XS1 - XS3)/4

33 Natural Colour Composites (NCC) 33 Natural colour composite multispectral SPOT image: Red: XS2 Green: 0.75 XS XS3 Blue: 0.75 XS XS3
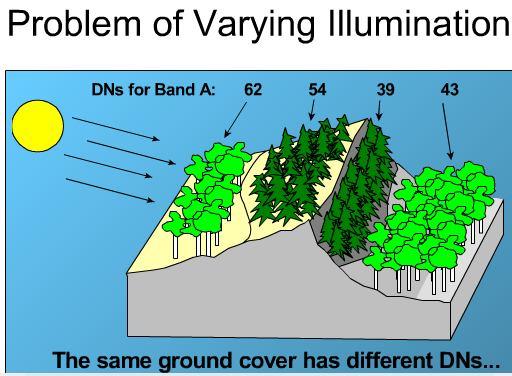
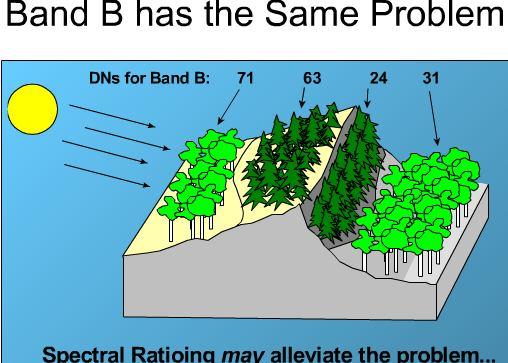
34 Band Ratio 34 A simple but very useful combination for multispectral imagery is the ratio of one spectral band to another In an individual spectral band, identical surface materials can have different brightness values from place to place because illumination varies with slope angle, slope direction (aspect), and shadowing by adjacent features
35 35
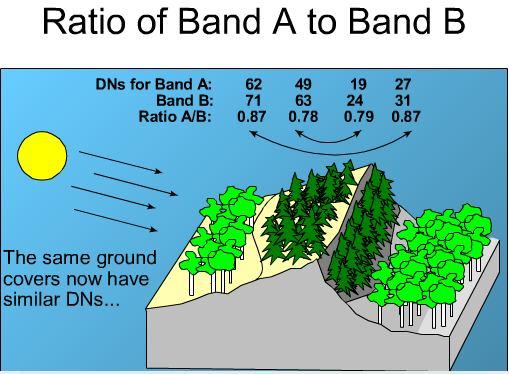
36 Band Ratio 36 These illumination effects have about the same magnitude regardless of wavelength, they tend to cancel out when one band is divided by another A band ratio image therefore emphasizes the inherent properties of the surface materials. In a grayscale display of a ratio image, the darkest and lightest tones identify areas with the greatest difference in reflectance for the two spectral bands.
37 Band Ratio 37 Areas with similar reflectance appear in intermediate gray tones Different band ratio combinations emphasize particular types of surface materials. The ratio of near-infrared (Landsat TM4) to red (Landsat TM3) is widely used as a vegetation index Green vegetation exhibits a large and unique difference in reflectance in these two bands, appearing bright in the near-infrared and dark in the red band.
38 Band Ratio 38 In a Landsat TM4/Landsat TM3 ratio image the areas with a full plant canopy appear very bright, and the ratio value decreases as the proportion of plant cover to soil background decreases Using the commonly available multispectral bands, useful ratio values generally range from 0.4 to 15.0.
39 Band Ratio 39 Other examples : red (Landsat TM3) / blue (Landsat TM1) Highlight reddish coloured iron oxides minerals Infrared red (Landsat TM5) / Middle infrared (Landsat TM7) clay minerals along with the carbonate minerals that makes limestone and dolomite
40 Normalized Difference Vegetation Index (NDVI) 40 Simple band ratio images have several disadvantages. Sensor noise (which is usually specific to particular bands) is accentuated by the ratio calculation The ratio result includes the fractional values (A /B is less than 1 when A < B) and values greater than1 (for A > B). If these values are scaled to the 8-bit data range (0 to 255) by multiplying by a constant scale factor, the lower range (for A < B) is compressed and the upper range is expanded.
41 Normalized Difference Vegetation Index (NDVI) 41 The normalized difference index is a variant form of ratio calculation that alleviates these problems The difference between corresponding values in two spectral bands (B-A) is normalized by dividing by their sum (B+A) As with a simple band ratio, brightness variations due to topography are largely eliminated. Output values can vary from -1 to +1, so the data range is symmetrical around 0 (B = A).
42 Normalized Difference Vegetation Index (NDVI) 42 The Normalized Difference Vegetation Index (NDVI) is a widely used index for green vegetation cover. It assigns the near-infrared channel to B and the red channel to A Higher values for NDVI (brighter tones) indicate a greater proportion of ground cover by green vegetation.
 absorbs most of the visible light that hits it, and reflects a large portion of the near-infrared light.")
43 Normalized Difference Vegetation Index (NDVI) 43 NDVI is calculated from the visible and near-infrared light reflected by vegetation. Healthy vegetation (left) absorbs most of the visible light that hits it, and reflects a large portion of the near-infrared light. Unhealthy or sparse vegetation (right) reflects more visible light and less nearinfrared light. The numbers on the figure above are representative of actual values.
 are generally dark.")
44 NDVI (SPOT) 44 XS2 (Red) XS3 (Near IR) NDVI In the NDVI map, the bright areas are vegetated while the nonvegetated areas (buildings, clearings, river, sea) are generally dark. Note that the trees lining the roads are clearly visible as grey linear features against the dark background.
45 Color Composite with NDVI 45 The NDVI band may also be combined with other bands of the multispectral image to form a colour composite image which helps to discriminate different types of vegetation R = XS3 (Near IR band) G = (XS3 - XS2)/(XS3 + XS2) (NDVI band) B = XS1 (green band) NDVI Colour Composite of the SPOT Red: XS3; Green: NDVI; Blue: XS1. At least three types of vegetation can be discriminated in this colour composite image: green, bright yellow and golden yellow areas. The green areas consist of dense trees with closed canopy. The bright yellow areas are covered with shrubs or less dense trees. The golden yellow areas are covered with grass. The non vegetated areas appear in dark blue and magenta.
Image interpretation I and II
 Image interpretation I and II Looking at satellite image, identifying different objects, according to scale and associated information and to communicate this information to others is what we call as IMAGE
Interpreting land surface features. SWAC module 3
 Interpreting land surface features SWAC module 3 Interpreting land surface features SWAC module 3 Different kinds of image Panchromatic image True-color image False-color image EMR : NASA Echo the bat
Remote Sensing. The following figure is grey scale display of SPOT Panchromatic without stretching.
 Remote Sensing Objectives This unit will briefly explain display of remote sensing image, geometric correction, spatial enhancement, spectral enhancement and classification of remote sensing image. At
Aral Sea profile Selection of area 24 February April May 1998
 250 km Aral Sea profile 1960 1960 1985 1986 1987 1988 1989 1990 1991 1992 1993 1994 1995 1996 1997 1998 2010? Selection of area Area of interest Kzyl-Orda Dried seabed 185 km Syrdarya river Aral Sea Salt
Remote sensing in archaeology from optical to lidar. Krištof Oštir ModeLTER Scientific Research Centre of the Slovenian Academy of Sciences and Arts
 Remote sensing in archaeology from optical to lidar Krištof Oštir ModeLTER Scientific Research Centre of the Slovenian Academy of Sciences and Arts Introduction Optical remote sensing Systems Search for
An Introduction to Remote Sensing & GIS. Introduction
 An Introduction to Remote Sensing & GIS Introduction Remote sensing is the measurement of object properties on Earth s surface using data acquired from aircraft and satellites. It attempts to measure something
Sensors and Data Interpretation II. Michael Horswell
 Sensors and Data Interpretation II Michael Horswell Defining remote sensing 1. When was the last time you did any remote sensing? acquiring information about something without direct contact 2. What are
MODULE 4 LECTURE NOTES 1 CONCEPTS OF COLOR
 MODULE 4 LECTURE NOTES 1 CONCEPTS OF COLOR 1. Introduction The field of digital image processing relies on mathematical and probabilistic formulations accompanied by human intuition and analysis based
Enhancement of Multispectral Images and Vegetation Indices
 Enhancement of Multispectral Images and Vegetation Indices ERDAS Imagine 2016 Description: We will use ERDAS Imagine with multispectral images to learn how an image can be enhanced for better interpretation.
Image Band Transformations
 Image Band Transformations Content Band math Band ratios Vegetation Index Tasseled Cap Transform Principal Component Analysis (PCA) Decorrelation Stretch Image Band Transformation Purposes Image band transforms
REMOTE SENSING. Topic 10 Fundamentals of Digital Multispectral Remote Sensing MULTISPECTRAL SCANNERS MULTISPECTRAL SCANNERS
 REMOTE SENSING Topic 10 Fundamentals of Digital Multispectral Remote Sensing Chapter 5: Lillesand and Keifer Chapter 6: Avery and Berlin MULTISPECTRAL SCANNERS Record EMR in a number of discrete portions
Introduction to Remote Sensing
 Introduction to Remote Sensing Outline Remote Sensing Defined Resolution Electromagnetic Energy (EMR) Types Interpretation Applications Remote Sensing Defined Remote Sensing is: The art and science of
Introduction to Remote Sensing
 Introduction to Remote Sensing Spatial, spectral, temporal resolutions Image display alternatives Vegetation Indices Image classifications Image change detections Accuracy assessment Satellites & Air-Photos
Overview. Introduction. Elements of Image Interpretation. LA502 Special Studies Remote Sensing
 LA502 Special Studies Remote Sensing Elements of Image Interpretation Dr. Ragab Khalil Department of Landscape Architecture Faculty of Environmental Design King AbdulAziz University Room 103 Overview Introduction
Lab 6: Multispectral Image Processing Using Band Ratios
 Lab 6: Multispectral Image Processing Using Band Ratios due Dec. 11, 2017 Goals: 1. To learn about the spectral characteristics of vegetation and geologic materials. 2. To experiment with vegetation indices
Using Multi-spectral Imagery in MapInfo Pro Advanced
 Using Multi-spectral Imagery in MapInfo Pro Advanced MapInfo Pro Advanced Tom Probert, Global Product Manager MapInfo Pro Advanced: Intuitive interface for using multi-spectral / hyper-spectral imagery
IKONOS High Resolution Multispectral Scanner Sensor Characteristics
 High Spatial Resolution and Hyperspectral Scanners IKONOS High Resolution Multispectral Scanner Sensor Characteristics Launch Date View Angle Orbit 24 September 1999 Vandenberg Air Force Base, California,
Module 3 Introduction to GIS. Lecture 8 GIS data acquisition
 Module 3 Introduction to GIS Lecture 8 GIS data acquisition GIS workflow Data acquisition (geospatial data input) GPS Remote sensing (satellites, UAV s) LiDAR Digitized maps Attribute Data Management Data
Important Missions. weather forecasting and monitoring communication navigation military earth resource observation LANDSAT SEASAT SPOT IRS
 Fundamentals of Remote Sensing Pranjit Kr. Sarma, Ph.D. Assistant Professor Department of Geography Mangaldai College Email: prangis@gmail.com Ph. No +91 94357 04398 Remote Sensing Remote sensing is defined
Remote Sensing of Environment (RSE)
") I N T R O Introduction to Introduction to Remote Sensing T O R S E Remote Sensing of Environment (RSE) with TNTmips page 1 TNTview Before Getting Started Imagery acquired by airborne or satellite sensors
I N T R O Introduction to Introduction to Remote Sensing T O R S E Remote Sensing of Environment (RSE) with TNTmips page 1 TNTview Before Getting Started Imagery acquired by airborne or satellite sensors
Remote Sensing Part 3 Examples & Applications
 Remote Sensing Part 3 Examples & Applications Review: Spectral Signatures Review: Spectral Resolution Review: Computer Display of Remote Sensing Images Individual bands of satellite data are mapped to
remote sensing? What are the remote sensing principles behind these Definition
 Introduction to remote sensing: Content (1/2) Definition: photogrammetry and remote sensing (PRS) Radiation sources: solar radiation (passive optical RS) earth emission (passive microwave or thermal infrared
Making NDVI Images using the Sony F717 Nightshot Digital Camera and IR Filters and Software Created for Interpreting Digital Images.
 Making NDVI Images using the Sony F717 Nightshot Digital Camera and IR Filters and Software Created for Interpreting Digital Images Draft 1 John Pickle Museum of Science October 14, 2004 Digital Cameras
Introduction to Remote Sensing Fundamentals of Satellite Remote Sensing. Mads Olander Rasmussen
 Introduction to Remote Sensing Fundamentals of Satellite Remote Sensing Mads Olander Rasmussen (mora@dhi-gras.com) 01. Introduction to Remote Sensing DHI What is remote sensing? the art, science, and technology
CHARACTERISTICS OF REMOTELY SENSED IMAGERY. Radiometric Resolution
 CHARACTERISTICS OF REMOTELY SENSED IMAGERY Radiometric Resolution There are a number of ways in which images can differ. One set of important differences relate to the various resolutions that images express.
REMOTE SENSING INTERPRETATION
 REMOTE SENSING INTERPRETATION Jan Clevers Centre for Geo-Information - WU Remote Sensing --> RS Sensor at a distance EARTH OBSERVATION EM energy Earth RS is a tool; one of the sources of information! 1
CHARACTERISTICS OF REMOTELY SENSED IMAGERY. Spatial Resolution
 CHARACTERISTICS OF REMOTELY SENSED IMAGERY Spatial Resolution There are a number of ways in which images can differ. One set of important differences relate to the various resolutions that images express.
Remote Sensing and GIS
 Remote Sensing and GIS Atmosphere Reflected radiation, e.g. Visible Emitted radiation, e.g. Infrared Backscattered radiation, e.g. Radar (λ) Visible TIR Radar & Microwave 11/9/2017 Geo327G/386G, U Texas,
MODULE 4 LECTURE NOTES 4 DENSITY SLICING, THRESHOLDING, IHS, TIME COMPOSITE AND SYNERGIC IMAGES
 MODULE 4 LECTURE NOTES 4 DENSITY SLICING, THRESHOLDING, IHS, TIME COMPOSITE AND SYNERGIC IMAGES 1. Introduction Digital image processing involves manipulation and interpretation of the digital images so
Figure 1: Percent reflectance for various features, including the five spectra from Table 1, at different wavelengths from 0.4µm to 1.4µm.
 Section 1: The Electromagnetic Spectrum 1. The wavelength range that has the highest reflectance for broadleaf vegetation and needle leaf vegetation is 0.75µm to 1.05µm. 2. Dry soil can be distinguished
Black Dot shows actual Point location
 207 Plate 1 Use of scanned archive aerial photographs, digital photogrammetry and GIS to plot river channel erosion along the Afon Trannon, Wales (part of the study by Mount et al 2000, 2003). Plate 2
RADAR (RAdio Detection And Ranging)
") RADAR (RAdio Detection And Ranging) CLASSIFICATION OF NONPHOTOGRAPHIC REMOTE SENSORS PASSIVE ACTIVE DIGITAL CAMERA THERMAL (e.g. TIMS) VIDEO CAMERA MULTI- SPECTRAL SCANNERS VISIBLE & NIR MICROWAVE Real
RADAR (RAdio Detection And Ranging) CLASSIFICATION OF NONPHOTOGRAPHIC REMOTE SENSORS PASSIVE ACTIVE DIGITAL CAMERA THERMAL (e.g. TIMS) VIDEO CAMERA MULTI- SPECTRAL SCANNERS VISIBLE & NIR MICROWAVE Real
HYPERSPECTRAL IMAGERY FOR SAFEGUARDS APPLICATIONS. International Atomic Energy Agency, Vienna, Austria
 HYPERSPECTRAL IMAGERY FOR SAFEGUARDS APPLICATIONS G. A. Borstad 1, Leslie N. Brown 1, Q.S. Bob Truong 2, R. Kelley, 3 G. Healey, 3 J.-P. Paquette, 3 K. Staenz 4, and R. Neville 4 1 Borstad Associates Ltd.,
Digital Image Processing (DIP)
") University of Kurdistan Digital Image Processing (DIP) Lecture 6: Color Image Processing Instructor: Kaveh Mollazade, Ph.D. Department of Biosystems Engineering, Faculty of Agriculture, University of Kurdistan,
University of Kurdistan Digital Image Processing (DIP) Lecture 6: Color Image Processing Instructor: Kaveh Mollazade, Ph.D. Department of Biosystems Engineering, Faculty of Agriculture, University of Kurdistan,
Remote Sensing for Rangeland Applications
 Remote Sensing for Rangeland Applications Jay Angerer Ecological Training June 16, 2012 Remote Sensing The term "remote sensing," first used in the United States in the 1950s by Ms. Evelyn Pruitt of the
Land Cover Analysis to Determine Areas of Clear-cut and Forest Cover in Olney, Montana. Geob 373 Remote Sensing. Dr Andreas Varhola, Kathry De Rego
 1 Land Cover Analysis to Determine Areas of Clear-cut and Forest Cover in Olney, Montana Geob 373 Remote Sensing Dr Andreas Varhola, Kathry De Rego Zhu an Lim (14292149) L2B 17 Apr 2016 2 Abstract Montana
746A27 Remote Sensing and GIS. Multi spectral, thermal and hyper spectral sensing and usage
 746A27 Remote Sensing and GIS Lecture 3 Multi spectral, thermal and hyper spectral sensing and usage Chandan Roy Guest Lecturer Department of Computer and Information Science Linköping University Multi
How to Access Imagery and Carry Out Remote Sensing Analysis Using Landsat Data in a Browser
 How to Access Imagery and Carry Out Remote Sensing Analysis Using Landsat Data in a Browser Including Introduction to Remote Sensing Concepts Based on: igett Remote Sensing Concept Modules and GeoTech
COMPARISON OF INFORMATION CONTENTS OF HIGH RESOLUTION SPACE IMAGES
 COMPARISON OF INFORMATION CONTENTS OF HIGH RESOLUTION SPACE IMAGES H. Topan*, G. Büyüksalih*, K. Jacobsen ** * Karaelmas University Zonguldak, Turkey ** University of Hannover, Germany htopan@karaelmas.edu.tr,
1. Theory of remote sensing and spectrum
 1. Theory of remote sensing and spectrum 7 August 2014 ONUMA Takumi Outline of Presentation Electromagnetic wave and wavelength Sensor type Spectrum Spatial resolution Spectral resolution Mineral mapping
For a long time I limited myself to one color as a form of discipline. Pablo Picasso. Color Image Processing
 For a long time I limited myself to one color as a form of discipline. Pablo Picasso Color Image Processing 1 Preview Motive - Color is a powerful descriptor that often simplifies object identification
Mod. 2 p. 1. Prof. Dr. Christoph Kleinn Institut für Waldinventur und Waldwachstum Arbeitsbereich Fernerkundung und Waldinventur
 Histograms of gray values for TM bands 1-7 for the example image - Band 4 and 5 show more differentiation than the others (contrast=the ratio of brightest to darkest areas of a landscape). - Judging from
GIS Data Collection. Remote Sensing
 GIS Data Collection Remote Sensing Data Collection Remote sensing Introduction Concepts Spectral signatures Resolutions: spectral, spatial, temporal Digital image processing (classification) Other systems
Course overview; Remote sensing introduction; Basics of image processing & Color theory
 GEOL 1460 /2461 Ramsey Introduction to Remote Sensing Fall, 2018 Course overview; Remote sensing introduction; Basics of image processing & Color theory Week #1: 29 August 2018 I. Syllabus Review we will
Spectral Signatures. Vegetation. 40 Soil. Water WAVELENGTH (microns)
") Spectral Signatures % REFLECTANCE VISIBLE NEAR INFRARED Vegetation Soil Water.5. WAVELENGTH (microns). Spectral Reflectance of Urban Materials 5 Parking Lot 5 (5=5%) Reflectance 5 5 5 5 5 Wavelength (nm)
Spectral Signatures % REFLECTANCE VISIBLE NEAR INFRARED Vegetation Soil Water.5. WAVELENGTH (microns). Spectral Reflectance of Urban Materials 5 Parking Lot 5 (5=5%) Reflectance 5 5 5 5 5 Wavelength (nm)
Introduction to Remote Sensing Part 1
 Introduction to Remote Sensing Part 1 A Primer on Electromagnetic Radiation Digital, Multi-Spectral Imagery The 4 Resolutions Displaying Images Corrections and Enhancements Passive vs. Active Sensors Radar
Lecture 13: Remotely Sensed Geospatial Data
 Lecture 13: Remotely Sensed Geospatial Data A. The Electromagnetic Spectrum: The electromagnetic spectrum (Figure 1) indicates the different forms of radiation (or simply stated light) emitted by nature.
SEMI-SUPERVISED CLASSIFICATION OF LAND COVER BASED ON SPECTRAL REFLECTANCE DATA EXTRACTED FROM LISS IV IMAGE
 SEMI-SUPERVISED CLASSIFICATION OF LAND COVER BASED ON SPECTRAL REFLECTANCE DATA EXTRACTED FROM LISS IV IMAGE B. RayChaudhuri a *, A. Sarkar b, S. Bhattacharyya (nee Bhaumik) c a Department of Physics,
Apply Colour Sequences to Enhance Filter Results. Operations. What Do I Need? Filter
 Apply Colour Sequences to Enhance Filter Results Operations What Do I Need? Filter Single band images from the SPOT and Landsat platforms can sometimes appear flat (i.e., they are low contrast images).
An Introduction to Geomatics. Prepared by: Dr. Maher A. El-Hallaq خاص بطلبة مساق مقدمة في علم. Associate Professor of Surveying IUG
 An Introduction to Geomatics خاص بطلبة مساق مقدمة في علم الجيوماتكس Prepared by: Dr. Maher A. El-Hallaq Associate Professor of Surveying IUG 1 Airborne Imagery Dr. Maher A. El-Hallaq Associate Professor
INTRODUCTORY REMOTE SENSING. Geob 373
 INTRODUCTORY REMOTE SENSING Geob 373 Landsat 7 15 m image highlighting the geology of Oman http://www.satimagingcorp.com/gallery-landsat.html ASTER 15 m SWIR image, Escondida Mine, Chile http://www.satimagingcorp.com/satellite-sensors/aster.html
NON-PHOTOGRAPHIC SYSTEMS: Multispectral Scanners Medium and coarse resolution sensor comparisons: Landsat, SPOT, AVHRR and MODIS
 NON-PHOTOGRAPHIC SYSTEMS: Multispectral Scanners Medium and coarse resolution sensor comparisons: Landsat, SPOT, AVHRR and MODIS CLASSIFICATION OF NONPHOTOGRAPHIC REMOTE SENSORS PASSIVE ACTIVE DIGITAL
Lecture Series SGL 308: Introduction to Geological Mapping Lecture 8 LECTURE 8 REMOTE SENSING METHODS: THE USE AND INTERPRETATION OF SATELLITE IMAGES
 LECTURE 8 REMOTE SENSING METHODS: THE USE AND INTERPRETATION OF SATELLITE IMAGES LECTURE OUTLINE Page 8.0 Introduction 114 8.1 Objectives 115 115 8.2 Remote Sensing: Method of Operation 8.3 Importance
ACTIVE SENSORS RADAR
 ACTIVE SENSORS RADAR RADAR LiDAR: Light Detection And Ranging RADAR: RAdio Detection And Ranging SONAR: SOund Navigation And Ranging Used to image the ocean floor (produce bathymetic maps) and detect objects
Exploring the Earth with Remote Sensing: Tucson
 Exploring the Earth with Remote Sensing: Tucson Project ASTRO Chile March 2006 1. Introduction In this laboratory you will explore Tucson and its surroundings with remote sensing. Remote sensing is the
Image interpretation and analysis
 Image interpretation and analysis Grundlagen Fernerkundung, Geo 123.1, FS 2014 Lecture 7a Rogier de Jong Michael Schaepman Why are snow, foam, and clouds white? Why are snow, foam, and clouds white? Today
CanImage. (Landsat 7 Orthoimages at the 1: Scale) Standards and Specifications Edition 1.0
 Standards and Specifications Edition 1.0") CanImage (Landsat 7 Orthoimages at the 1:50 000 Scale) Standards and Specifications Edition 1.0 Centre for Topographic Information Customer Support Group 2144 King Street West, Suite 010 Sherbrooke, QC
CanImage (Landsat 7 Orthoimages at the 1:50 000 Scale) Standards and Specifications Edition 1.0 Centre for Topographic Information Customer Support Group 2144 King Street West, Suite 010 Sherbrooke, QC
Remote Sensing Platforms
 Remote Sensing Platforms Remote Sensing Platforms - Introduction Allow observer and/or sensor to be above the target/phenomena of interest Two primary categories Aircraft Spacecraft Each type offers different
USE OF COLOR IN REMOTE SENSING
 1 USE OF COLOR IN REMOTE SENSING (David Sandwell, Copyright, 2004) Display of large data sets - Most remote sensing systems create arrays of numbers representing an area on the surface of the Earth. The
DEVELOPMENT OF A NEW SOUTH AFRICAN LAND-COVER DATASET USING AUTOMATED MAPPING TECHINQUES. Mark Thompson 1
 DEVELOPMENT OF A NEW SOUTH AFRICAN LAND-COVER DATASET USING AUTOMATED MAPPING TECHINQUES. Mark Thompson 1 1 GeoTerraImage Pty Ltd, Pretoria, South Africa Abstract This talk will discuss the development
Remote Sensing Platforms
 Types of Platforms Lighter-than-air Remote Sensing Platforms Free floating balloons Restricted by atmospheric conditions Used to acquire meteorological/atmospheric data Blimps/dirigibles Major role - news
Monitoring agricultural plantations with remote sensing imagery
 MPRA Munich Personal RePEc Archive Monitoring agricultural plantations with remote sensing imagery Camelia Slave and Anca Rotman University of Agronomic Sciences and Veterinary Medicine - Bucharest Romania,
Abstract Quickbird Vs Aerial photos in identifying man-made objects
 Abstract Quickbird Vs Aerial s in identifying man-made objects Abdullah Mah abdullah.mah@aramco.com Remote Sensing Group, emap Division Integrated Solutions Services Department (ISSD) Saudi Aramco, Dhahran
Outline Remote Sensing Defined Resolution Electromagnetic Energy (EMR) Types Interpretation Applications 2
 Types Interpretation Applications 2") Introduction to Remote Sensing 1 Outline Remote Sensing Defined Resolution Electromagnetic Energy (EMR) Types Interpretation Applications 2 Remote Sensing Defined Remote Sensing is: The art and science
Introduction to Remote Sensing 1 Outline Remote Sensing Defined Resolution Electromagnetic Energy (EMR) Types Interpretation Applications 2 Remote Sensing Defined Remote Sensing is: The art and science
The techniques with ERDAS IMAGINE include:
 The techniques with ERDAS IMAGINE include: 1. Data correction - radiometric and geometric correction 2. Radiometric enhancement - enhancing images based on the values of individual pixels 3. Spatial enhancement
Saturation And Value Modulation (SVM): A New Method For Integrating Color And Grayscale Imagery
: A New Method For Integrating Color And Grayscale Imagery") 87 Saturation And Value Modulation (SVM): A New Method For Integrating Color And Grayscale Imagery By David W. Viljoen 1 and Jeff R. Harris 2 Geological Survey of Canada 615 Booth St. Ottawa, ON, K1A 0E9
87 Saturation And Value Modulation (SVM): A New Method For Integrating Color And Grayscale Imagery By David W. Viljoen 1 and Jeff R. Harris 2 Geological Survey of Canada 615 Booth St. Ottawa, ON, K1A 0E9
Chapter 1. Introduction
 Chapter 1 Introduction One of the major achievements of mankind is to record the data of what we observe in the form of photography which is dated to 1826. Man has always tried to reach greater heights
Sommersemester Prof. Dr. Christoph Kleinn Institut für Waldinventur und Waldwachstum Arbeitsbereich Fernerkundung und Waldinventur.
 Basics of Remote Sensing Some literature references Franklin, SE 2001 Remote Sensing for Sustainable Forest Management Lewis Publishers 407p Lillesand, Kiefer 2000 Remote Sensing and Image Interpretation
FOR 353: Air Photo Interpretation and Photogrammetry. Lecture 2. Electromagnetic Energy/Camera and Film characteristics
 FOR 353: Air Photo Interpretation and Photogrammetry Lecture 2 Electromagnetic Energy/Camera and Film characteristics Lecture Outline Electromagnetic Radiation Theory Digital vs. Analog (i.e. film ) Systems
Color Image Processing
 Color Image Processing Jesus J. Caban Outline Discuss Assignment #1 Project Proposal Color Perception & Analysis 1 Discuss Assignment #1 Project Proposal Due next Monday, Oct 4th Project proposal Submit
Introduction. Introduction. Introduction. Introduction. Introduction
 Identifying habitat change and conservation threats with satellite imagery Extinction crisis Volker Radeloff Department of Forest Ecology and Management Extinction crisis Extinction crisis Conservationists
Aerial Photo Interpretation
 Aerial Photo Interpretation Aerial Photo Interpretation To date, course has focused on skills of photogrammetry Scale Distance Direction Area Height There s another side to Aerial Photography: Interpretation
GE 113 REMOTE SENSING. Topic 7. Image Enhancement
 GE 113 REMOTE SENSING Topic 7. Image Enhancement Lecturer: Engr. Jojene R. Santillan jrsantillan@carsu.edu.ph Division of Geodetic Engineering College of Engineering and Information Technology Caraga State
Lecture 6: Multispectral Earth Resource Satellites. The University at Albany Fall 2018 Geography and Planning
 Lecture 6: Multispectral Earth Resource Satellites The University at Albany Fall 2018 Geography and Planning Outline SPOT program and other moderate resolution systems High resolution satellite systems
Introduction to Remote Sensing
 Introduction to Remote Sensing 1 Outline Remote Sensing Defined Electromagnetic Energy (EMR) Resolution Interpretation 2 Remote Sensing Defined Remote Sensing is: The art and science of obtaining information
Geo/SAT 2 INTRODUCTION TO REMOTE SENSING
 Geo/SAT 2 INTRODUCTION TO REMOTE SENSING Paul R. Baumann, Professor Emeritus State University of New York College at Oneonta Oneonta, New York 13820 USA COPYRIGHT 2008 Paul R. Baumann Introduction Remote
Keywords: Agriculture, Olive Trees, Supervised Classification, Landsat TM, QuickBird, Remote Sensing.
 Classification of agricultural fields by using Landsat TM and QuickBird sensors. The case study of olive trees in Lesvos island. Christos Vasilakos, University of the Aegean, Department of Environmental
Urban Classification of Metro Manila for Seismic Risk Assessment using Satellite Images
 Urban Classification of Metro Manila for Seismic Risk Assessment using Satellite Images Fumio YAMAZAKI/ yamazaki@edm.bosai.go.jp Hajime MITOMI/ mitomi@edm.bosai.go.jp Yalkun YUSUF/ yalkun@edm.bosai.go.jp
Fig Color spectrum seen by passing white light through a prism.
 1. Explain about color fundamentals. Color of an object is determined by the nature of the light reflected from it. When a beam of sunlight passes through a glass prism, the emerging beam of light is not
Image transformations
 Image transformations Digital Numbers may be composed of three elements: Atmospheric interference (e.g. haze) ATCOR Illumination (angle of reflection) - transforms Albedo (surface cover) Image transformations
Assessment of Spatiotemporal Changes in Vegetation Cover using NDVI in The Dangs District, Gujarat
 Assessment of Spatiotemporal Changes in Vegetation Cover using NDVI in The Dangs District, Gujarat Using SAGA GIS and Quantum GIS Tutorial ID: IGET_CT_003 This tutorial has been developed by BVIEER as
INTRODUCTION TO REMOTE SENSING AND ITS APPLICATIONS
 INTRODUCTION TO REMOTE SENSING AND ITS APPLICATIONS Prof. Dr. Abudeif A. Bakheit Geology Department. Faculty of Science Assiut University This representation was prepared from different power point representations
GEOG432: Remote sensing Lab 3 Unsupervised classification
 GEOG432: Remote sensing Lab 3 Unsupervised classification Goal: This lab involves identifying land cover types by using agorithms to identify pixels with similar Digital Numbers (DN) and spectral signatures
Using Color-Infrared Imagery for Impervious Surface Analysis. Chris Behee City of Bellingham Planning & Community Development
 Using Color-Infrared Imagery for Impervious Surface Analysis. Chris Behee City of Bellingham Planning & Community Development NW GIS Users Group - March 18, 2005 Outline What is Color Infrared Imagery?
Colors in Images & Video
 LECTURE 8 Colors in Images & Video CS 5513 Multimedia Systems Spring 2009 Imran Ihsan Principal Design Consultant OPUSVII www.opuseven.com Faculty of Engineering & Applied Sciences 1. Light and Spectra
Outline Remote Sensing Defined Resolution Electromagnetic Energy (EMR) Types Interpretation Applications
 Types Interpretation Applications") Introduction to Remote Sensing Outline Remote Sensing Defined Resolution Electromagnetic Energy (EMR) Types Interpretation Applications Remote Sensing Defined Remote Sensing is: The art and science of
Introduction to Remote Sensing Outline Remote Sensing Defined Resolution Electromagnetic Energy (EMR) Types Interpretation Applications Remote Sensing Defined Remote Sensing is: The art and science of
Introduction of Satellite Remote Sensing
 Introduction of Satellite Remote Sensing Spatial Resolution (Pixel size) Spectral Resolution (Bands) Resolutions of Remote Sensing 1. Spatial (what area and how detailed) 2. Spectral (what colors bands)
Lecture 2. Electromagnetic radiation principles. Units, image resolutions.
 NRMT 2270, Photogrammetry/Remote Sensing Lecture 2 Electromagnetic radiation principles. Units, image resolutions. Tomislav Sapic GIS Technologist Faculty of Natural Resources Management Lakehead University
Introduction to image processing for remote sensing: Practical examples
 Università degli studi di Roma Tor Vergata Corso di Telerilevamento e Diagnostica Elettromagnetica Anno accademico 2010/2011 Introduction to image processing for remote sensing: Practical examples Dr.
RGB colours: Display onscreen = RGB
 RGB colours: http://www.colorspire.com/rgb-color-wheel/ Display onscreen = RGB DIGITAL DATA and DISPLAY Myth: Most satellite images are not photos Photographs are also 'images', but digital images are
GEOG432: Remote sensing Lab 3 Unsupervised classification
 GEOG432: Remote sensing Lab 3 Unsupervised classification Goal: This lab involves identifying land cover types by using agorithms to identify pixels with similar Digital Numbers (DN) and spectral signatures
Int n r t o r d o u d c u ti t on o n to t o Remote Sensing
 Introduction to Remote Sensing Definition of Remote Sensing Remote sensing refers to the activities of recording/observing/perceiving(sensing)objects or events at far away (remote) places. In remote sensing,
Viewing New Hampshire from Space
 Viewing New Hampshire from Space A Bird s-eye View of the Granite State! Introduction Environmental changes are a major concern for researchers and policy makers today since these changes have both human
VC 16/17 TP4 Colour and Noise
 VC 16/17 TP4 Colour and Noise Mestrado em Ciência de Computadores Mestrado Integrado em Engenharia de Redes e Sistemas Informáticos Hélder Filipe Pinto de Oliveira Outline Colour spaces Colour processing
Remote Sensing. Measuring an object from a distance. For GIS, that means using photographic or satellite images to gather spatial data
 Remote Sensing Measuring an object from a distance For GIS, that means using photographic or satellite images to gather spatial data Remote Sensing measures electromagnetic energy reflected or emitted
LECTURE 07 COLORS IN IMAGES & VIDEO
 MULTIMEDIA TECHNOLOGIES LECTURE 07 COLORS IN IMAGES & VIDEO IMRAN IHSAN ASSISTANT PROFESSOR LIGHT AND SPECTRA Visible light is an electromagnetic wave in the 400nm 700 nm range. The eye is basically similar
Seasonal Progression of the Normalized Difference Vegetation Index (NDVI)
") Seasonal Progression of the Normalized Difference Vegetation Index (NDVI) For this exercise you will be using a series of six SPOT 4 images to look at the phenological cycle of a crop. The images are SPOT
Seasonal Progression of the Normalized Difference Vegetation Index (NDVI) For this exercise you will be using a series of six SPOT 4 images to look at the phenological cycle of a crop. The images are SPOT
Satellite Imagery and Remote Sensing. DeeDee Whitaker SW Guilford High EES & Chemistry
 Satellite Imagery and Remote Sensing DeeDee Whitaker SW Guilford High EES & Chemistry whitakd@gcsnc.com Outline What is remote sensing? How does remote sensing work? What role does the electromagnetic
Some Basic Concepts of Remote Sensing. Lecture 2 August 31, 2005
 Some Basic Concepts of Remote Sensing Lecture 2 August 31, 2005 What is remote sensing Remote Sensing: remote sensing is science of acquiring, processing, and interpreting images and related data that
Satellite Remote Sensing: Earth System Observations
 Satellite Remote Sensing: Earth System Observations Land surface Water Atmosphere Climate Ecosystems 1 EOS (Earth Observing System) Develop an understanding of the total Earth system, and the effects of