Dirty REMOTE SENSING Lecture 3: First Steps in classifying Stuart Green Earthobservation.wordpress.com
|
|
|
- Darren Oliver
- 6 years ago
- Views:
Transcription
1 Dirty REMOTE SENSING Lecture 3: First Steps in classifying Stuart Green Earthobservation.wordpress.com
2 You have your image, but is it any good? Is it full of cloud? Is it the right time of year? Is it the right resolution?
3 Atmospheric effects The atmosphere, as we have seen, can interfere with the picture the satellite is taking. Clouds and their shadows are obvious but atmospheric effects that are not readily visible can distort the image, reduce the signal/noise ratio, introduce errors in classification
4 Atmospheric Correction Raw Image: The image recorded at the satellite- this is uncalibrated data that contains all the errors from the atmosphere and the sensor. Level 0 Level 1 usually corrects for satellite level errors and presents the data in Digital Numbers. Sometime terrain corrections are included.
5 Top of Atmosphere reflectance correction converts the L1 DN to a number representing the percentage of light that fell on the earth as reflected back to sensor. Full atmospheric correction, to surface reflectance. This is either a supplied commercial image or using free software like LEDAPS you can perform this correction yourself.
6 Atmospheric correction corrects for scattering and absorption in the atmosphere. At its most sophisticated it used models of the atmosphere like 6S along with estimate of optical parameters of the atmosphere from satellites. At its simplest- we use the dark target approach
7 If you need accurate, transferable, repeatable measurements you will need to atmospherically correct your imagery. This will mean your image values are equivalent to surface measurements. HOWEVER Landsat data are available as a atmospherically corrected data set (level 2a)
8 First Automation find Vegation Sources Online for Vegetation detection :net_primary_productivity ftp://ftp.biosfera.dea.ufv.br/users/francisca/franciz/papers/running %20et%20al.%20Bioscience% pdf AES2012 L6 NDVI

9 Video: Global Seasonal Vegetation Growth: a planetary phenology AES2012 L6 NDVI
10 How do we measure what veg is there? Biomass: The mass per unit area of vegetation. Cover: The vertical projection of the plant parts on the ground surface per unit area of ground. Usually expressed as a percent. No species can have more than 100% cover. Leaf Area Index: The ratio of the area of leaves and green vegetation in theplant canopy per unit area of ground surface. LAI can exceed 1.The only way to get true leaf area is to strip all the leaves off the plants and measure their area. All other methods provide an index of this value Normalized Difference Vegetation Index (NDVI): An index of vegetation greenness derived from remote sensing methods. Often used as an index of biomass. FPAR measures the proportion of available radiation in the photosynthetically active wavelengths (400 to 700 nm) that a canopy absorbs. AES2012 L6 NDVI

11 AES2012 L6 NDVI

12 AES2012 L6 NDVI

13 AES2012 L6 NDVI
14 We can measure with the sateelite sensors the ratio of red to NIR light- this ratio is called a Vegetaion Index AES2012 L6 NDVI
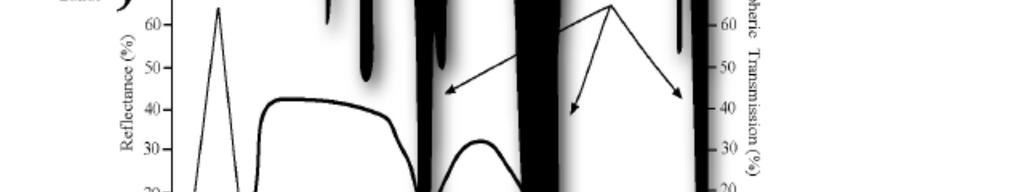
15 Vegetation Indices? The gigantic chlorophyll absorption well distinguishes vegetation from nonvegetation. Its size tells us chlorophyll concentration in the leaf and the canopy. Many vegetation indices are a simplistic attempt to estimate the size of this absorption well. AES2012 L6 NDVI
16 Vegetation Indices Vegetation indices (VI s) can be broken up into two basic categories: Ratio based indices VI s based on the ratio of two or more radiance, reflectance, or DN values (or linear combinations thereof). Difference indices VI s based on the difference between the spectral response of vegetation and the soil background. AES2012 L6 NDVI
17 Common Ratio Indices Simple Ratio Index (SR) = NIR/R Normalized Difference Vegetation Index (NDVI) = NIR NIR R R AES2012 L6 NDVI
18 What are Vegetation Indices? Estimating the size of the absorption well 0.5 reflectance(%) density 1 density 2 density 3 density 4 density 5 density 6 sunlit soil wavelength AES2012 L6 NDVI
19 (B4-B3)/(B4+B3) for Landsat A pixel by pixel mathematical process AES2012 L6 NDVI

20 AES2012 L6 NDVI
21 Remember the images are stored in the image file (eg. Jpeg) as xy matrices with a pixel in one band corresponding with the pixel in another band with same xy coordinates B B2 AES2012 L6 NDVI B1+B2
22 Other Indices SAVI = NDII= (VNIR-NIR)/(VNIR+NIR) AES2012 L6 NDVI
23 Create and NDVI image See And
24 Practical
25 Load Curragh17.Tiff into ARC MAP and open the ToolBox window

26 WE need to convert the image to a floating point format
. Call the outputs RED and NIR")
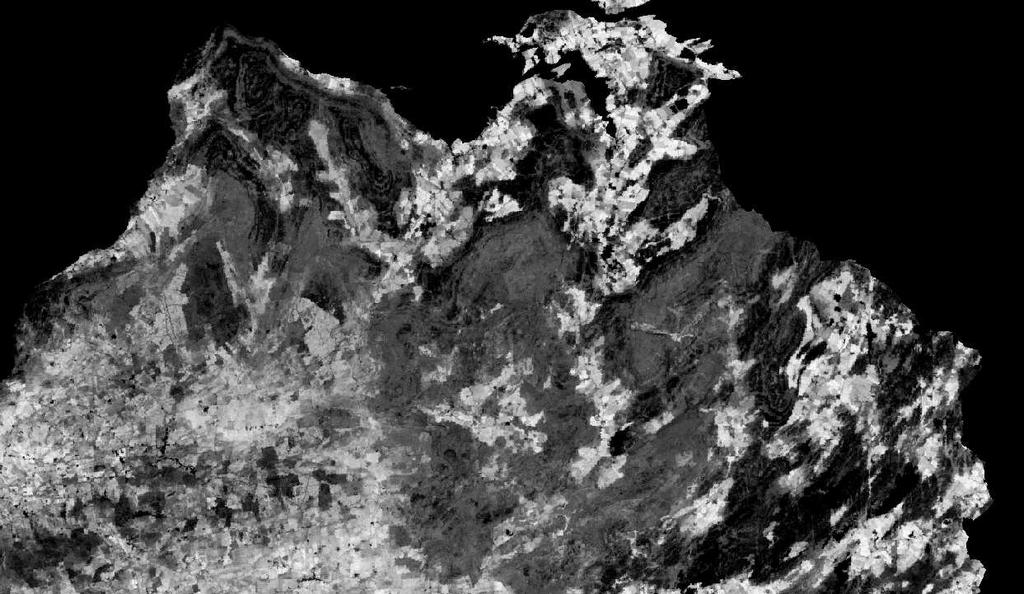
27 Do this for Band 4 (red) and Band 5 (NIR). Call the outputs RED and NIR

28 Use Map Calculator to calculate the NDVI image

29 This is the calculation Press OK
30 Use the Info button to click around and see the values
31 Load up the Sites.shp file What are the NDVI values for the 6 sites. What s the relationship between landcover and NDVI? (list the landcover types and NDVI score) Click around the image- find an NDVI value that represents no vegeation


32 Click onto reclass->reclassify and load your NDVI image into pop up menu- we are going to create a vegeation/no-vegetaion map.

33 On the reclassify menu click classify and change the number of classes to 2. Then change the 1st break values to be your bare soil ndvi value (o.3 in this example) and the second to 1. Click OK

34 Clcik the output button and enter a value a name in YOUR directory do not add an extension. Click OK


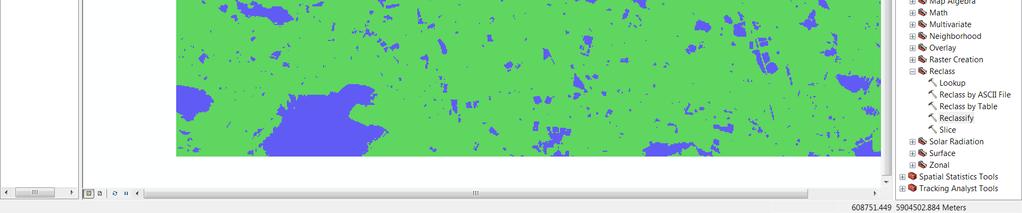
35 Your output will look a little like this. You have created a vegetation/no-vegetation mask
Image Band Transformations
 Image Band Transformations Content Band math Band ratios Vegetation Index Tasseled Cap Transform Principal Component Analysis (PCA) Decorrelation Stretch Image Band Transformation Purposes Image band transforms
typical spectral signatures of photosynthetically active and non-photosynthetically active vegetation (Beeri et al., 2007)
") typical spectral signatures of photosynthetically active and non-photosynthetically active vegetation (Beeri et al., 2007) Xie, Y. et al. J Plant Ecol 2008 1:9-23; doi:10.1093/jpe/rtm005 Copyright restrictions
typical spectral signatures of photosynthetically active and non-photosynthetically active vegetation (Beeri et al., 2007) Xie, Y. et al. J Plant Ecol 2008 1:9-23; doi:10.1093/jpe/rtm005 Copyright restrictions
Present and future of marine production in Boka Kotorska
 Present and future of marine production in Boka Kotorska First results from satellite remote sensing for the breeding areas of filter feeders in the Bay of Kotor INTRODUCTION Environmental monitoring is
Atmospheric Correction (including ATCOR)
") Technical Specifications Atmospheric Correction (including ATCOR) The data obtained by optical satellite sensors with high spatial resolution has become an invaluable tool for many groups interested in
Technical Specifications Atmospheric Correction (including ATCOR) The data obtained by optical satellite sensors with high spatial resolution has become an invaluable tool for many groups interested in
The techniques with ERDAS IMAGINE include:
 The techniques with ERDAS IMAGINE include: 1. Data correction - radiometric and geometric correction 2. Radiometric enhancement - enhancing images based on the values of individual pixels 3. Spatial enhancement
Lab 3: Image Enhancements I 65 pts Due > Canvas by 10pm
 Geo 448/548 Spring 2016 Lab 3: Image Enhancements I 65 pts Due > Canvas by 3/11 @ 10pm For this lab, you will learn different ways to calculate spectral vegetation indices (SVIs). These are one category
Remote Sensing and Image Processing: 4
 Remote Sensing and Image Processing: 4 Dr. Mathias (Mat) Disney UCL Geography Office: 301, 3rd Floor, Chandler House Tel: 7670 4290 Email: mdisney@geog.ucl.ac.uk www.geog.ucl.ac.uk/~mdisney 1 Image display
earthobservation.wordpress.com
 Dirty REMOTE SENSING earthobservation.wordpress.com Stuart Green Teagasc Stuart.Green@Teagasc.ie 1 Purpose Give you a very basic skill set and software training so you can: find free satellite image data.
Center for Advanced Land Management Information Technologies (CALMIT), School of Natural Resources, University of Nebraska-Lincoln
, School of Natural Resources, University of Nebraska-Lincoln") Geoffrey M. Henebry, Andrés Viña, and Anatoly A. Gitelson Center for Advanced Land Management Information Technologies (CALMIT), School of Natural Resources, University of Nebraska-Lincoln Introduction
Geoffrey M. Henebry, Andrés Viña, and Anatoly A. Gitelson Center for Advanced Land Management Information Technologies (CALMIT), School of Natural Resources, University of Nebraska-Lincoln Introduction
An Introduction to Remote Sensing & GIS. Introduction
 An Introduction to Remote Sensing & GIS Introduction Remote sensing is the measurement of object properties on Earth s surface using data acquired from aircraft and satellites. It attempts to measure something
Interpreting land surface features. SWAC module 3
 Interpreting land surface features SWAC module 3 Interpreting land surface features SWAC module 3 Different kinds of image Panchromatic image True-color image False-color image EMR : NASA Echo the bat
Remote Sensing for Rangeland Applications
 Remote Sensing for Rangeland Applications Jay Angerer Ecological Training June 16, 2012 Remote Sensing The term "remote sensing," first used in the United States in the 1950s by Ms. Evelyn Pruitt of the
Image interpretation and analysis
 Image interpretation and analysis Grundlagen Fernerkundung, Geo 123.1, FS 2014 Lecture 7a Rogier de Jong Michael Schaepman Why are snow, foam, and clouds white? Why are snow, foam, and clouds white? Today
Course overview; Remote sensing introduction; Basics of image processing & Color theory
 GEOL 1460 /2461 Ramsey Introduction to Remote Sensing Fall, 2018 Course overview; Remote sensing introduction; Basics of image processing & Color theory Week #1: 29 August 2018 I. Syllabus Review we will
Evaluation of Sentinel-2 bands over the spectrum
 Evaluation of Sentinel-2 bands over the spectrum S.E. Hosseini Aria, M. Menenti, Geoscience and Remote sensing Department Delft University of Technology, Netherlands 1 outline ointroduction - Concept odata
Assessment of Spatiotemporal Changes in Vegetation Cover using NDVI in The Dangs District, Gujarat
 Assessment of Spatiotemporal Changes in Vegetation Cover using NDVI in The Dangs District, Gujarat Using SAGA GIS and Quantum GIS Tutorial ID: IGET_CT_003 This tutorial has been developed by BVIEER as
Development of normalized vegetation, soil and water indices derived from satellite remote sensing data
 Development of normalized vegetation, soil and water indices derived from satellite remote sensing data Takeuchi, W. & Yasuoka, Y. IIS/UT, Japan E-mail: wataru@iis.u-tokyo.ac.jp Nov. 25th, 2004 ACRS2004
746A27 Remote Sensing and GIS. Multi spectral, thermal and hyper spectral sensing and usage
 746A27 Remote Sensing and GIS Lecture 3 Multi spectral, thermal and hyper spectral sensing and usage Chandan Roy Guest Lecturer Department of Computer and Information Science Linköping University Multi
Geo/SAT 2 TROPICAL WET REALMS OF CENTRAL AFRICA, PART II
 Geo/SAT 2 TROPICAL WET REALMS OF CENTRAL AFRICA, PART II Paul R. Baumann Professor of Geography (Emeritus) State University of New York College at Oneonta Oneonta, New York 13820 USA COPYRIGHT 2009 Paul
BV NNET User manual. V0.2 (Draft) Rémi Lecerf, Marie Weiss
 Rémi Lecerf, Marie Weiss") BV NNET User manual V0.2 (Draft) Rémi Lecerf, Marie Weiss 1. Introduction... 2 2. Installation... 2 3. Prerequisites... 2 3.1. Image file format... 2 3.2. Retrieving atmospheric data... 3 3.2.1. Using
BV NNET User manual V0.2 (Draft) Rémi Lecerf, Marie Weiss 1. Introduction... 2 2. Installation... 2 3. Prerequisites... 2 3.1. Image file format... 2 3.2. Retrieving atmospheric data... 3 3.2.1. Using
Ground Truth for Calibrating Optical Imagery to Reflectance
 Visual Information Solutions Ground Truth for Calibrating Optical Imagery to Reflectance The by: Thomas Harris Whitepaper Introduction: Atmospheric Effects on Optical Imagery Remote sensing of the Earth
Spectral compatibility of vegetation indices across sensors: band decomposition analysis with Hyperion data
 Journal of Applied Remote Sensing, Vol. 4, 043520 (30 March 2010) Spectral compatibility of vegetation indices across sensors: band decomposition analysis with Hyperion data Youngwook Kim,a Alfredo R.
On the use of water color missions for lakes in 2021
 Lakes and Climate: The Role of Remote Sensing June 01-02, 2017 On the use of water color missions for lakes in 2021 Cédric G. Fichot Department of Earth and Environment 1 Overview 1. Past and still-ongoing
Enhancement of Multispectral Images and Vegetation Indices
 Enhancement of Multispectral Images and Vegetation Indices ERDAS Imagine 2016 Description: We will use ERDAS Imagine with multispectral images to learn how an image can be enhanced for better interpretation.
Seasonal Progression of the Normalized Difference Vegetation Index (NDVI)
") Seasonal Progression of the Normalized Difference Vegetation Index (NDVI) For this exercise you will be using a series of six SPOT 4 images to look at the phenological cycle of a crop. The images are SPOT
Seasonal Progression of the Normalized Difference Vegetation Index (NDVI) For this exercise you will be using a series of six SPOT 4 images to look at the phenological cycle of a crop. The images are SPOT
REMOTE SENSING. Topic 10 Fundamentals of Digital Multispectral Remote Sensing MULTISPECTRAL SCANNERS MULTISPECTRAL SCANNERS
 REMOTE SENSING Topic 10 Fundamentals of Digital Multispectral Remote Sensing Chapter 5: Lillesand and Keifer Chapter 6: Avery and Berlin MULTISPECTRAL SCANNERS Record EMR in a number of discrete portions
Remote Sensing Phenology. Bradley Reed Principal Scientist USGS National Center for Earth Resources Observation and Science Sioux Falls, SD
 Remote Sensing Phenology Bradley Reed Principal Scientist USGS National Center for Earth Resources Observation and Science Sioux Falls, SD Remote Sensing Phenology Potential to provide wall-to-wall phenology
Quantifying Land Cover Changes in Maine
 Quantifying Land Cover Changes in Maine! STUDENT HANDOUT Introduction Change detection tools enable us to compare satellite data from different times to assess damage from natural disasters, characterize
GIS Data Collection. Remote Sensing
 GIS Data Collection Remote Sensing Data Collection Remote sensing Introduction Concepts Spectral signatures Resolutions: spectral, spatial, temporal Digital image processing (classification) Other systems
Lesson 9: Multitemporal Analysis
 Lesson 9: Multitemporal Analysis Lesson Description Multitemporal change analyses require the identification of features and measurement of their change through time. In this lesson, we will examine vegetation
An NDVI image provides critical crop information that is not visible in an RGB or NIR image of the same scene. For example, plants may appear green
 Normalized Difference Vegetation Index (NDVI) Spectral Band calculation that uses the visible (RGB) and near-infrared (NIR) bands of the electromagnetic spectrum NDVI= + An NDVI image provides critical
Introduction to Remote Sensing
 Introduction to Remote Sensing Daniel McInerney Urban Institute Ireland, University College Dublin, Richview Campus, Clonskeagh Drive, Dublin 14. 16th June 2009 Presentation Outline 1 2 Spaceborne Sensors
Using Color-Infrared Imagery for Impervious Surface Analysis. Chris Behee City of Bellingham Planning & Community Development
 Using Color-Infrared Imagery for Impervious Surface Analysis. Chris Behee City of Bellingham Planning & Community Development NW GIS Users Group - March 18, 2005 Outline What is Color Infrared Imagery?
SEN3APP Stakeholder Workshop, Helsinki Yrjö Rauste/VTT Kaj Andersson/VTT Eija Parmes/VTT
 Optical Products from Sentinel-2 and Suomi- NPP/VIIRS SEN3APP Stakeholder Workshop, Helsinki 19.11.2015 Yrjö Rauste/VTT Kaj Andersson/VTT Eija Parmes/VTT Structure of Presentation High-resolution data
Lecture 13: Remotely Sensed Geospatial Data
 Lecture 13: Remotely Sensed Geospatial Data A. The Electromagnetic Spectrum: The electromagnetic spectrum (Figure 1) indicates the different forms of radiation (or simply stated light) emitted by nature.
Monitoring of mine tailings using satellite and lidar data
 Surveying Monitoring of mine tailings using satellite and lidar data by Prevlan Chetty, Southern Mapping Geospatial This study looks into the use of high resolution satellite imagery from RapidEye and
CHARACTERISTICS OF REMOTELY SENSED IMAGERY. Radiometric Resolution
 CHARACTERISTICS OF REMOTELY SENSED IMAGERY Radiometric Resolution There are a number of ways in which images can differ. One set of important differences relate to the various resolutions that images express.
FluorCam PAR- Absorptivity Module & NDVI Measurement
 FluorCam PAR- Absorptivity Module & NDVI Measurement Instruction Manual Please read this manual before operating this product P PSI, spol. s r. o., Drásov 470, 664 24 Drásov, Czech Republic FAX: +420 511
NON-PHOTOGRAPHIC SYSTEMS: Multispectral Scanners Medium and coarse resolution sensor comparisons: Landsat, SPOT, AVHRR and MODIS
 NON-PHOTOGRAPHIC SYSTEMS: Multispectral Scanners Medium and coarse resolution sensor comparisons: Landsat, SPOT, AVHRR and MODIS CLASSIFICATION OF NONPHOTOGRAPHIC REMOTE SENSORS PASSIVE ACTIVE DIGITAL
Atmospheric interactions; Aerial Photography; Imaging systems; Intro to Spectroscopy Week #3: September 12, 2018
 GEOL 1460/2461 Ramsey Introduction/Advanced Remote Sensing Fall, 2018 Atmospheric interactions; Aerial Photography; Imaging systems; Intro to Spectroscopy Week #3: September 12, 2018 I. Quick Review from
Figure 1: Percent reflectance for various features, including the five spectra from Table 1, at different wavelengths from 0.4µm to 1.4µm.
 Section 1: The Electromagnetic Spectrum 1. The wavelength range that has the highest reflectance for broadleaf vegetation and needle leaf vegetation is 0.75µm to 1.05µm. 2. Dry soil can be distinguished
The (False) Color World
 Color World") There s more to the world than meets the eye In this activity, your group will explore: The Value of False Color Images Different Types of Color Images The Use of Contextual Clues for Feature Identification
There s more to the world than meets the eye In this activity, your group will explore: The Value of False Color Images Different Types of Color Images The Use of Contextual Clues for Feature Identification
Lecture 2. Electromagnetic radiation principles. Units, image resolutions.
 NRMT 2270, Photogrammetry/Remote Sensing Lecture 2 Electromagnetic radiation principles. Units, image resolutions. Tomislav Sapic GIS Technologist Faculty of Natural Resources Management Lakehead University
RADIOMETRIC CALIBRATION
 1 RADIOMETRIC CALIBRATION Lecture 10 Digital Image Data 2 Digital data are matrices of digital numbers (DNs) There is one layer (or matrix) for each satellite band Each DN corresponds to one pixel 3 Digital
QUANTITATIVE GLOBAL MAPPING OF TERRESTRIAL VEGETATION PHOTOSYNTHESIS: THE FLUORESCENCE EXPLORER (FLEX) MISSION
 MISSION") 2017 IEEE International Geoscience and Remote Sensing Symposium July 23 28, 2017 Fort Worth, Texas, USA Session MO3.L12 - International Spaceborne Imaging Spectroscopy Missions: Updates and News I QUANTITATIVE
2017 IEEE International Geoscience and Remote Sensing Symposium July 23 28, 2017 Fort Worth, Texas, USA Session MO3.L12 - International Spaceborne Imaging Spectroscopy Missions: Updates and News I QUANTITATIVE
Valuable New Information for Precision Agriculture. Mike Ritter Founder & CEO - SLANTRANGE, Inc.
 Valuable New Information for Precision Agriculture Mike Ritter Founder & CEO - SLANTRANGE, Inc. SENSORS Accurate, Platform- Agnostic ANALYTICS On-Board, On-Location SLANTRANGE Delivering Valuable New Information
IKONOS High Resolution Multispectral Scanner Sensor Characteristics
 High Spatial Resolution and Hyperspectral Scanners IKONOS High Resolution Multispectral Scanner Sensor Characteristics Launch Date View Angle Orbit 24 September 1999 Vandenberg Air Force Base, California,
Files Used in This Tutorial. Background. Calibrating Images Tutorial
 In this tutorial, you will calibrate a QuickBird Level-1 image to spectral radiance and reflectance while learning about the various metadata fields that ENVI uses to perform calibration. This tutorial
SEMI-SUPERVISED CLASSIFICATION OF LAND COVER BASED ON SPECTRAL REFLECTANCE DATA EXTRACTED FROM LISS IV IMAGE
 SEMI-SUPERVISED CLASSIFICATION OF LAND COVER BASED ON SPECTRAL REFLECTANCE DATA EXTRACTED FROM LISS IV IMAGE B. RayChaudhuri a *, A. Sarkar b, S. Bhattacharyya (nee Bhaumik) c a Department of Physics,
University of Texas at San Antonio EES 5053 Term Project CORRELATION BETWEEN NDVI AND SURFACE TEMPERATURES USING LANDSAT ETM + IMAGERY NEWFEL MAZARI
 University of Texas at San Antonio EES 5053 Term Project CORRELATION BETWEEN NDVI AND SURFACE TEMPERATURES USING LANDSAT ETM + IMAGERY NEWFEL MAZARI Introduction and Objectives The present study is a correlation
Int n r t o r d o u d c u ti t on o n to t o Remote Sensing
 Introduction to Remote Sensing Definition of Remote Sensing Remote sensing refers to the activities of recording/observing/perceiving(sensing)objects or events at far away (remote) places. In remote sensing,
Remote Sensing. Odyssey 7 Jun 2012 Benjamin Post
 Remote Sensing Odyssey 7 Jun 2012 Benjamin Post Definitions Applications Physics Image Processing Classifiers Ancillary Data Data Sources Related Concepts Outline Big Picture Definitions Remote Sensing
FOR 353: Air Photo Interpretation and Photogrammetry. Lecture 2. Electromagnetic Energy/Camera and Film characteristics
 FOR 353: Air Photo Interpretation and Photogrammetry Lecture 2 Electromagnetic Energy/Camera and Film characteristics Lecture Outline Electromagnetic Radiation Theory Digital vs. Analog (i.e. film ) Systems
MULTISPECTRAL AGRICULTURAL ASSESSMENT. Normalized Difference Vegetation Index. Federal Robotics INSPECTION & DOCUMENTATION
 MULTISPECTRAL AGRICULTURAL ASSESSMENT Normalized Difference Vegetation Index INSPECTION & DOCUMENTATION Federal Robotics Clearwater Dr. Amherst, New York 14228 716-221-4181 Sales@FedRobot.com www.fedrobot.com
Application of GIS to Fast Track Planning and Monitoring of Development Agenda
 Application of GIS to Fast Track Planning and Monitoring of Development Agenda Radiometric, Atmospheric & Geometric Preprocessing of Optical Remote Sensing 13 17 June 2018 Outline 1. Why pre-process remotely
Lab 6: Multispectral Image Processing Using Band Ratios
 Lab 6: Multispectral Image Processing Using Band Ratios due Dec. 11, 2017 Goals: 1. To learn about the spectral characteristics of vegetation and geologic materials. 2. To experiment with vegetation indices
Zoltán Vekerdy Szent István Univ. János Tamás Debrecen University
 WATER PONDING IN HUNGARY: COLLECTION OF GROUND AND DRONE DATA GROUND REFLECTANCES Zoltán Vekerdy Szent István Univ. János Tamás Debrecen University 7th ADVANCED TRAINING COURSE ON LAND REMOTE SENSING 4
MULTI-TEMPORAL IMAGE ANALYSIS OF THE COASTAL WATERSHED, NH INTRODUCTION
 MULTI-TEMPORAL IMAGE ANALYSIS OF THE COASTAL WATERSHED, NH Meghan Graham MacLean, PhD Student Alexis M. Rudko, MS Student Dr. Russell G. Congalton, Professor Department of Natural Resources and the Environment
CALMIT Field Program. Center for Advanced Land Management Information Technologies (CALMIT) University of Nebraska Lincoln
 University of Nebraska Lincoln") CALMIT Field Program Center for Advanced Land Management Information Technologies (CALMIT) University of Nebraska Lincoln Field Program: Three Areas Agriculture Surface Waters Coastal / Marine 1) Agriculture
CALMIT Field Program Center for Advanced Land Management Information Technologies (CALMIT) University of Nebraska Lincoln Field Program: Three Areas Agriculture Surface Waters Coastal / Marine 1) Agriculture
Activity Data (AD) Monitoring in the frame of REDD+ MRV
 Monitoring in the frame of REDD+ MRV") Activity Data (AD) Monitoring in the frame of REDD+ MRV Preliminary comments REDD+ is sustainable low emissions, high carbon rural development Monitoring efforts should support this effort Challenges Diversity
Activity Data (AD) Monitoring in the frame of REDD+ MRV Preliminary comments REDD+ is sustainable low emissions, high carbon rural development Monitoring efforts should support this effort Challenges Diversity
NORMALIZING ASTER DATA USING MODIS PRODUCTS FOR LAND COVER CLASSIFICATION
 NORMALIZING ASTER DATA USING MODIS PRODUCTS FOR LAND COVER CLASSIFICATION F. Gao a, b, *, J. G. Masek a a Biospheric Sciences Branch, NASA Goddard Space Flight Center, Greenbelt, MD 20771, USA b Earth
Chapter 5. Preprocessing in remote sensing
 Chapter 5. Preprocessing in remote sensing 5.1 Introduction Remote sensing images from spaceborne sensors with resolutions from 1 km to < 1 m become more and more available at reasonable costs. For some
Sommersemester Prof. Dr. Christoph Kleinn Institut für Waldinventur und Waldwachstum Arbeitsbereich Fernerkundung und Waldinventur.
 Basics of Remote Sensing Some literature references Franklin, SE 2001 Remote Sensing for Sustainable Forest Management Lewis Publishers 407p Lillesand, Kiefer 2000 Remote Sensing and Image Interpretation
How to Access Imagery and Carry Out Remote Sensing Analysis Using Landsat Data in a Browser
 How to Access Imagery and Carry Out Remote Sensing Analysis Using Landsat Data in a Browser Including Introduction to Remote Sensing Concepts Based on: igett Remote Sensing Concept Modules and GeoTech
INTRODUCTION TO SNAP TOOLBOX
 INTRODUCTION TO SNAP TOOLBOX EXERCISE 1 (Exploring S2 data) Data: Sentinel-2A Level 1C: S2A_MSIL1C_20180303T170201_N0206_R069_T14QNG_20180303T221319.SAFE 1. Open file 1.1. File / Open Product 1.2. Browse
Land Cover Analysis to Determine Areas of Clear-cut and Forest Cover in Olney, Montana. Geob 373 Remote Sensing. Dr Andreas Varhola, Kathry De Rego
 1 Land Cover Analysis to Determine Areas of Clear-cut and Forest Cover in Olney, Montana Geob 373 Remote Sensing Dr Andreas Varhola, Kathry De Rego Zhu an Lim (14292149) L2B 17 Apr 2016 2 Abstract Montana
Application of Remote Sensing in the Monitoring of Marine pollution. By Atif Shahzad Institute of Environmental Studies University of Karachi
 Application of Remote Sensing in the Monitoring of Marine pollution By Atif Shahzad Institute of Environmental Studies University of Karachi Remote Sensing "Remote sensing is the science (and to some extent,
Satellite Imagery and Remote Sensing. DeeDee Whitaker SW Guilford High EES & Chemistry
 Satellite Imagery and Remote Sensing DeeDee Whitaker SW Guilford High EES & Chemistry whitakd@gcsnc.com Outline What is remote sensing? How does remote sensing work? What role does the electromagnetic
Crop and Irrigation Water Management Using High-resolution Airborne Remote Sensing
 Crop and Irrigation Water Management Using High-resolution Airborne Remote Sensing Christopher M. U. Neale and Hari Jayanthi Dept. of Biological and Irrigation Eng. Utah State University & James L.Wright
1. Theory of remote sensing and spectrum
 1. Theory of remote sensing and spectrum 7 August 2014 ONUMA Takumi Outline of Presentation Electromagnetic wave and wavelength Sensor type Spectrum Spatial resolution Spectral resolution Mineral mapping
DIGITALGLOBE ATMOSPHERIC COMPENSATION
 See a better world. DIGITALGLOBE BEFORE ACOMP PROCESSING AFTER ACOMP PROCESSING Summary KOBE, JAPAN High-quality imagery gives you answers and confidence when you face critical problems. Guided by our
Passive Microwave Sensors LIDAR Remote Sensing Laser Altimetry. 28 April 2003
 Passive Microwave Sensors LIDAR Remote Sensing Laser Altimetry 28 April 2003 Outline Passive Microwave Radiometry Rayleigh-Jeans approximation Brightness temperature Emissivity and dielectric constant
Outline for today. Geography 411/611 Remote sensing: Principles and Applications. Remote sensing: RS for biogeochemical cycles
 Geography 411/611 Remote sensing: Principles and Applications Thomas Albright, Associate Professor Laboratory for Conservation Biogeography, Department of Geography & Program in Ecology, Evolution, & Conservation
IMPROVEMENT IN THE DETECTION OF LAND COVER CLASSES USING THE WORLDVIEW-2 IMAGERY
 IMPROVEMENT IN THE DETECTION OF LAND COVER CLASSES USING THE WORLDVIEW-2 IMAGERY Ahmed Elsharkawy 1,2, Mohamed Elhabiby 1,3 & Naser El-Sheimy 1,4 1 Dept. of Geomatics Engineering, University of Calgary
GE 113 REMOTE SENSING
 GE 113 REMOTE SENSING Topic 8. Image Classification and Accuracy Assessment Lecturer: Engr. Jojene R. Santillan jrsantillan@carsu.edu.ph Division of Geodetic Engineering College of Engineering and Information
2007 Land-cover Classification and Accuracy Assessment of the Greater Puget Sound Region
 2007 Land-cover Classification and Accuracy Assessment of the Greater Puget Sound Region Urban Ecology Research Laboratory Department of Urban Design and Planning University of Washington May 2009 1 1.
Exploring the Earth with Remote Sensing: Tucson
 Exploring the Earth with Remote Sensing: Tucson Project ASTRO Chile March 2006 1. Introduction In this laboratory you will explore Tucson and its surroundings with remote sensing. Remote sensing is the
CHANGE DETECTION USING OPTICAL DATA IN SNAP
 CHANGE DETECTION USING OPTICAL DATA IN SNAP EXERCISE 1 (Water change detection) Data: Sentinel-2A Level 2A: S2A_MSIL2A_20170101T082332_N0204_R121_T34HCH_20170101T084543.SAFE S2A_MSIL2A_20180116T082251_N0206_R121_T34HCH_20180116T120458.SAFE
Remote Sensing 4113 Lab 10: Lunar Classification April 11, 2018
 Remote Sensing 4113 Lab 10: Lunar Classification April 11, 2018 Part I Introduction In this lab we ll explore the use of sophisticated band math to estimate composition, and we ll also explore the use
MOVING FROM PIXELS TO PRODUCTS
 TRUE COLOR RGB MOSAIC, OSAKA, JAPAN MOVING FROM PIXELS TO PRODUCTS and data to insight AUTOMATED STRUCTURE IDENTIFICATION, OSAKA, JAPAN Table of Contents Moving from Pixels to Products 3 Doubling the Spectral
2017 REMOTE SENSING EVENT TRAINING STRATEGIES 2016 SCIENCE OLYMPIAD COACHING ACADEMY CENTERVILLE, OH
 2017 REMOTE SENSING EVENT TRAINING STRATEGIES 2016 SCIENCE OLYMPIAD COACHING ACADEMY CENTERVILLE, OH This presentation was prepared using draft rules. There may be some changes in the final copy of the
Environmental Remote Sensing GEOG 2021
 Environmental Remote Sensing GEOG 2021 Lecture 2 Image display and enhancement 2 Image Display and Enhancement Purpose visual enhancement to aid interpretation enhancement for improvement of information
Land Cover Change Analysis An Introduction to Land Cover Change Analysis using the Multispectral Image Data Analysis System (MultiSpec )
") Land Cover Change Analysis An Introduction to Land Cover Change Analysis using the Multispectral Image Data Analysis System (MultiSpec ) Level: Grades 9 to 12 Windows version With Teacher Notes Earth Observation
Land Cover Change Analysis An Introduction to Land Cover Change Analysis using the Multispectral Image Data Analysis System (MultiSpec ) Level: Grades 9 to 12 Windows version With Teacher Notes Earth Observation
Introduction to Remote Sensing
 Introduction to Remote Sensing Spatial, spectral, temporal resolutions Image display alternatives Vegetation Indices Image classifications Image change detections Accuracy assessment Satellites & Air-Photos
remote sensing? What are the remote sensing principles behind these Definition
 Introduction to remote sensing: Content (1/2) Definition: photogrammetry and remote sensing (PRS) Radiation sources: solar radiation (passive optical RS) earth emission (passive microwave or thermal infrared
Spectral Reflectance Sensor SRS-NDVI
 The Spectral Reflectance Sensor NDVI continuously monitors the NDVI of our plant canopy. Measure NDVI or PRI vegetation indices at the plot or plant stand scale. Non-destructive sampling of canopy greenup,
RADAR (RAdio Detection And Ranging)
") RADAR (RAdio Detection And Ranging) CLASSIFICATION OF NONPHOTOGRAPHIC REMOTE SENSORS PASSIVE ACTIVE DIGITAL CAMERA THERMAL (e.g. TIMS) VIDEO CAMERA MULTI- SPECTRAL SCANNERS VISIBLE & NIR MICROWAVE Real
RADAR (RAdio Detection And Ranging) CLASSIFICATION OF NONPHOTOGRAPHIC REMOTE SENSORS PASSIVE ACTIVE DIGITAL CAMERA THERMAL (e.g. TIMS) VIDEO CAMERA MULTI- SPECTRAL SCANNERS VISIBLE & NIR MICROWAVE Real
APCAS/10/21 April 2010 ASIA AND PACIFIC COMMISSION ON AGRICULTURAL STATISTICS TWENTY-THIRD SESSION. Siem Reap, Cambodia, April 2010
 APCAS/10/21 April 2010 Agenda Item 8 ASIA AND PACIFIC COMMISSION ON AGRICULTURAL STATISTICS TWENTY-THIRD SESSION Siem Reap, Cambodia, 26-30 April 2010 The Use of Remote Sensing for Area Estimation by Robert
A (very) brief introduction to Remote Sensing: From satellites to maps!
 brief introduction to Remote Sensing: From satellites to maps!") Spatial Data Analysis and Modeling for Agricultural Development, with R - Workshop A (very) brief introduction to Remote Sensing: From satellites to maps! Earthlights DMSP 1994-1995 https://wikimedia.org/
Spatial Data Analysis and Modeling for Agricultural Development, with R - Workshop A (very) brief introduction to Remote Sensing: From satellites to maps! Earthlights DMSP 1994-1995 https://wikimedia.org/
Making NDVI Images using the Sony F717 Nightshot Digital Camera and IR Filters and Software Created for Interpreting Digital Images.
 Making NDVI Images using the Sony F717 Nightshot Digital Camera and IR Filters and Software Created for Interpreting Digital Images Draft 1 John Pickle Museum of Science October 14, 2004 Digital Cameras
ATCOR Workflow for IMAGINE 2018
 ATCOR Workflow for IMAGINE 2018 Version 1.1 User Manual Mai 2018 ATCOR Workflow for IMAGINE Page 2/73 The ATCOR trademark is owned by DLR German Aerospace Center D-82234 Wessling, Germany URL: www.dlr.de
TimeSync V3 User Manual. January Introduction
 TimeSync V3 User Manual January 2017 Introduction TimeSync is an application that allows researchers and managers to characterize and quantify disturbance and landscape change by facilitating plot-level
Mod. 2 p. 1. Prof. Dr. Christoph Kleinn Institut für Waldinventur und Waldwachstum Arbeitsbereich Fernerkundung und Waldinventur
 Histograms of gray values for TM bands 1-7 for the example image - Band 4 and 5 show more differentiation than the others (contrast=the ratio of brightest to darkest areas of a landscape). - Judging from
SeNtinel Application Platform & Scientific Toolbox Exploitation Platform. Fabrizio Ramoino [SERCO c/o ESA-ESRIN]
![SeNtinel Application Platform & Scientific Toolbox Exploitation Platform. Fabrizio Ramoino [SERCO c/o ESA-ESRIN]](/thumbs/77/76408461.jpg "SeNtinel Application Platform & Scientific Toolbox Exploitation Platform. Fabrizio Ramoino [SERCO c/o ESA-ESRIN]") SeNtinel Application Platform & Scientific Toolbox Exploitation Platform Fabrizio Ramoino [SERCO c/o ESA-ESRIN] SNAP/STEP SNAP Overview The common architecture for all Sentinel Toolboxes and SMOS Toolbox
SeNtinel Application Platform & Scientific Toolbox Exploitation Platform Fabrizio Ramoino [SERCO c/o ESA-ESRIN] SNAP/STEP SNAP Overview The common architecture for all Sentinel Toolboxes and SMOS Toolbox
Introduction to Remote Sensing Fundamentals of Satellite Remote Sensing. Mads Olander Rasmussen
 Introduction to Remote Sensing Fundamentals of Satellite Remote Sensing Mads Olander Rasmussen (mora@dhi-gras.com) 01. Introduction to Remote Sensing DHI What is remote sensing? the art, science, and technology
Image transformations
 Image transformations Digital Numbers may be composed of three elements: Atmospheric interference (e.g. haze) ATCOR Illumination (angle of reflection) - transforms Albedo (surface cover) Image transformations
Prelab Exercise. Stop and Think: Reflectance. % Reflectance. Absorbance Spectra of Photosynthetic Pigments. Contents
 Contents 1 Prelab Exercise 2 Stop and Think: Reflectance 3 The Role of Light in Carbohydrate Synthesis 4 Measuring Absorbance Prelab Exercise 1. Fill the Color field in the table below 2. Use plot.ly to
Lab 1 Introduction to ENVI
 Remote sensing for agricultural applications: principles and methods (2013-2014) Instructor: Prof. Tao Cheng (tcheng@njau.edu.cn) Nanjing Agricultural University Lab 1 Introduction to ENVI April 1 st,
Study of Chlorophyll-a Distribution of Microalgae at Tasik Aman and Tasik Harapan in Penang Island Malaysia using Landsat Image
 ISSN 2407-289 Study of Chlorophyll-a Distribution of Microalgae at Tasik Aman and Tasik Harapan in Penang Island Malaysia using Landsat Image a b c Fairooz Johan, Mohd Zubir Mat Jafri, Lim Hwee San,Wan
Introduction to image processing for remote sensing: Practical examples
 Università degli studi di Roma Tor Vergata Corso di Telerilevamento e Diagnostica Elettromagnetica Anno accademico 2010/2011 Introduction to image processing for remote sensing: Practical examples Dr.