The techniques with ERDAS IMAGINE include:
|
|
|
- Mervyn Holt
- 5 years ago
- Views:
Transcription
1 The techniques with ERDAS IMAGINE include: 1. Data correction - radiometric and geometric correction 2. Radiometric enhancement - enhancing images based on the values of individual pixels 3. Spatial enhancement - enhancing images based on the values of individual and neighboring pixels 4. Spectral enhancement - enhancing images by transforming the values of each pixel on a multi-band basis Spectral Enhancement Compress spectral bands of data that are similar Extract new bands of data that are more interpretable Apply mathematical transforms and algorithms Display a wider variety of information in the three available color combinations (R,G,B) Some of these enhancements can be used to prepare data for classification. However, this is a risky practice unless you are very familiar with your data, and the changes that you are making to it. Anytime you alter values, you risk losing some information. 1
 is often used as a method of data")

2 Principal Components Analysis (PCA) Principal components analysis (or PCA) is often used as a method of data compression. It allows redundant data to be compacted into fewer bands that is, the dimensionality of the data is reduced. 2
3 Principal Components Analysis (PCA) The bands of PCA data are non-correlated and independent, and are often more interpretable than the source data. The process is easily explained graphically with an example of a two-band scatter-plot, which shows the relationships of data file values in two bands. If both bands have normal distributions, an ellipse shape results. 3
4 4

5 PC1 PC2 PC3 PC4 PC5 PC6 5

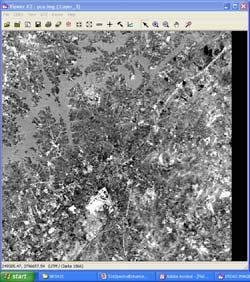
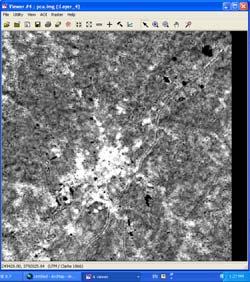
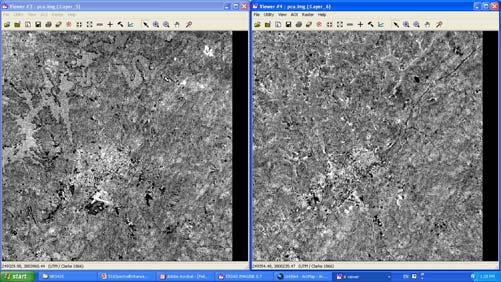
6 Landsat TM bands 4,5,3 in RGB PCA bands 1,2,3 in RGB 6
7 Eigenvalues: Although there are n output bands in a principal components analysis, the first few bands accounts for a high proportion of the variance in the data in some cases almost 100%. Therefore, PCA is useful for compressing data into few bands. What do the data in new bands mean? 7
8 Tasseled Cap or Kauth-Thomas Transformation The Tasseled Cap transformation offers a way to optimize data viewing for vegetation studies. Research has produced three data structure axes which define the vegetation information content (Crist et al 1986, Crist & Kauth 1986): This transformation produces from original MSS data space to a new four-dimensional feature space, called: The soil brightness index (B), Greenness vegetation index (G), Yellow stuff index (Y), and Non-such (N) Tasseled Cap or Kauth-Thomas Transformation The transformation consists of linear combinations of the four MSS bands to produce a set of four new variables. 8

9 Tasseled Cap Transformation 1985: The Transformation was extended using Landsat TM data: 1. Brightness: a weighted sum of all bands, defined in the direction of the principal variation in soil reflectance. 2. Greenness: orthogonal to brightness, a contrast between the near-infrared and visible bands. Strongly related to the amount of green vegetation in the scene. 3. Wetness: relates to canopy and soil moisture (Lillesand and Kiefer 1987). (TM Band 4) (TM Band 3) (TM Band 3) The name suggests the characteristics the indices were intended to measure. 9
10 Tasseled Cap Transformation A simple calculation (linear combination) then rotates the data space to present any of these axes to the user. These rotations are sensor-dependent, but once defined for a particular sensor, the same rotation will work for any scene taken by that sensor. For Landsat-4 TM, for example, the calculations are: Brightness =.3037(TM1) )(TM2) (TM3) (TM4) (TM5) (TM7) Greenness = (TM1) (TM2) (TM3) (TM4) (TM5) (TM7) Wetness =.1509 (TM1) (TM2) (TM3) (TM4) (TM5) (TM7) Haze =.8832 (TM1) (TM2) (TM3) (TM4) (TM5) (TM7) Source: Modified from Crist et al 1986, Jensen
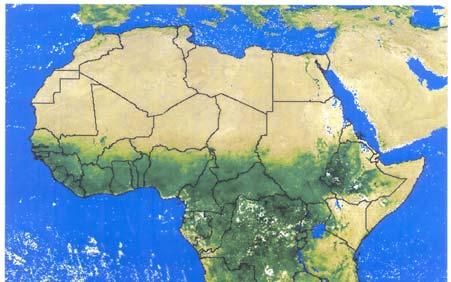
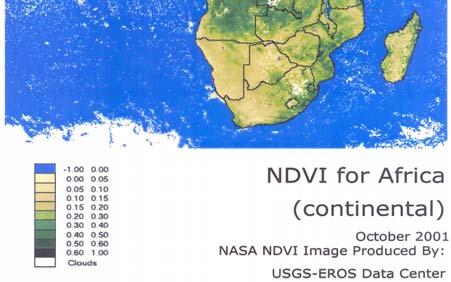
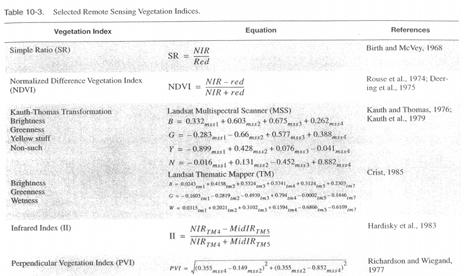
11 The Tasseled Cap transformation is a global vegetation index. Theoretically, it may be used anywhere in the world to disaggregate the amount of soil brightness, vegetation, and moisture content in individual pixels in a Landsat MSS or TM image. Other Vegetation Indices Since 1960's, much of the remote sensing efforts in vegetation has gone into the development of vegetation indices. Vegetation indices can be defined as dimensionless, radiometric measures that function as indicators of relative abundance and activity of green vegetation, often including leaf-area-index (LAI), percentage green cover, chlorophyll content, green biomass, and absorbed photosynthetically active radiation. There are more than 20 vegetation indices in use. 11

12 Normalized Difference Vegetation Index (NDVI) The NDVI index was widely adopted and applied to the original Landsat MSS digital remote sensing data. 12
13 13
Image Band Transformations
 Image Band Transformations Content Band math Band ratios Vegetation Index Tasseled Cap Transform Principal Component Analysis (PCA) Decorrelation Stretch Image Band Transformation Purposes Image band transforms
Image transformations
 Image transformations Digital Numbers may be composed of three elements: Atmospheric interference (e.g. haze) ATCOR Illumination (angle of reflection) - transforms Albedo (surface cover) Image transformations
Remote Sensing. The following figure is grey scale display of SPOT Panchromatic without stretching.
 Remote Sensing Objectives This unit will briefly explain display of remote sensing image, geometric correction, spatial enhancement, spectral enhancement and classification of remote sensing image. At
Image interpretation and analysis
 Image interpretation and analysis Grundlagen Fernerkundung, Geo 123.1, FS 2014 Lecture 7a Rogier de Jong Michael Schaepman Why are snow, foam, and clouds white? Why are snow, foam, and clouds white? Today
MULTISPECTRAL CHANGE DETECTION AND INTERPRETATION USING SELECTIVE PRINCIPAL COMPONENTS AND THE TASSELED CAP TRANSFORMATION
 MULTSPECTRAL CHANGE DETECTON AND NTERPRETATON USNG SELECTVE PRNCPAL COMPONENTS AND THE TASSELED CAP TRANSFORMATON Abstract Temporal change is typically observed in all six reflective LANDSAT bands. The
An investigation of the Eye of Quebec. by means of PCA, NDVI and Tasseled Cap Transformations
 An investigation of the Eye of Quebec by means of PCA, NDVI and Tasseled Cap Transformations Advanced Digital Image Processing Prepared For: Trevor Milne Prepared By: Philipp Schnetzer March 28, 2008 Index
Preparing Remote Sensing Data for Natural Resources Mapping (image enhancement, rectifications )
") Preparing Remote Sensing Data for Natural Resources Mapping (image enhancement, rectifications ) Why is this important What are the major approaches Examples of digital image enhancement Follow up exercises
Preparing Remote Sensing Data for Natural Resources Mapping (image enhancement, rectifications ) Why is this important What are the major approaches Examples of digital image enhancement Follow up exercises
Dirty REMOTE SENSING Lecture 3: First Steps in classifying Stuart Green Earthobservation.wordpress.com
 Dirty REMOTE SENSING Lecture 3: First Steps in classifying Stuart Green Earthobservation.wordpress.com Stuart.Green@Teagasc.ie You have your image, but is it any good? Is it full of cloud? Is it the right
An Introduction to Remote Sensing & GIS. Introduction
 An Introduction to Remote Sensing & GIS Introduction Remote sensing is the measurement of object properties on Earth s surface using data acquired from aircraft and satellites. It attempts to measure something
Course overview; Remote sensing introduction; Basics of image processing & Color theory
 GEOL 1460 /2461 Ramsey Introduction to Remote Sensing Fall, 2018 Course overview; Remote sensing introduction; Basics of image processing & Color theory Week #1: 29 August 2018 I. Syllabus Review we will
Sommersemester Prof. Dr. Christoph Kleinn Institut für Waldinventur und Waldwachstum Arbeitsbereich Fernerkundung und Waldinventur.
 Basics of Remote Sensing Some literature references Franklin, SE 2001 Remote Sensing for Sustainable Forest Management Lewis Publishers 407p Lillesand, Kiefer 2000 Remote Sensing and Image Interpretation
Basic Digital Image Processing. The Structure of Digital Images. An Overview of Image Processing. Image Restoration: Line Drop-outs
 Basic Digital Image Processing A Basic Introduction to Digital Image Processing ~~~~~~~~~~ Rev. Ronald J. Wasowski, C.S.C. Associate Professor of Environmental Science University of Portland Portland,
Present and future of marine production in Boka Kotorska
 Present and future of marine production in Boka Kotorska First results from satellite remote sensing for the breeding areas of filter feeders in the Bay of Kotor INTRODUCTION Environmental monitoring is
An NDVI image provides critical crop information that is not visible in an RGB or NIR image of the same scene. For example, plants may appear green
 Normalized Difference Vegetation Index (NDVI) Spectral Band calculation that uses the visible (RGB) and near-infrared (NIR) bands of the electromagnetic spectrum NDVI= + An NDVI image provides critical
REMOTE SENSING. Topic 10 Fundamentals of Digital Multispectral Remote Sensing MULTISPECTRAL SCANNERS MULTISPECTRAL SCANNERS
 REMOTE SENSING Topic 10 Fundamentals of Digital Multispectral Remote Sensing Chapter 5: Lillesand and Keifer Chapter 6: Avery and Berlin MULTISPECTRAL SCANNERS Record EMR in a number of discrete portions
Enhancement of Multispectral Images and Vegetation Indices
 Enhancement of Multispectral Images and Vegetation Indices ERDAS Imagine 2016 Description: We will use ERDAS Imagine with multispectral images to learn how an image can be enhanced for better interpretation.
MULTISPECTRAL IMAGE PROCESSING I
 TM1 TM2 337 TM3 TM4 TM5 TM6 Dr. Robert A. Schowengerdt TM7 Landsat Thematic Mapper (TM) multispectral images of desert and agriculture near Yuma, Arizona MULTISPECTRAL IMAGE PROCESSING I SENSORS Multispectral
8. EDITING AND VIEWING COORDINATES, CREATING SCATTERGRAMS AND PRINCIPAL COMPONENTS ANALYSIS
 Editing and viewing coordinates, scattergrams and PCA 8. EDITING AND VIEWING COORDINATES, CREATING SCATTERGRAMS AND PRINCIPAL COMPONENTS ANALYSIS Aim: To introduce you to (i) how you can apply a geographical
Remote Sensing Instruction Laboratory
 Laboratory Session 217513 Geographic Information System and Remote Sensing - 1 - Remote Sensing Instruction Laboratory Assist.Prof.Dr. Weerakaset Suanpaga Department of Civil Engineering, Faculty of Engineering
BIOMASS AND HEALTH BASED FOREST COVER DELINEATION USING SPECTRAL UN-MIXING INTRODUCTION
 BIOMASS AND HEALTH BASED FOREST COVER DELINEATION USING SPECTRAL UN-MIXING ABSTRACT Mohan P. Tiruveedhula 1, PhD candidate Joseph Fan 1, Assistant Professor Ravi R. Sadasivuni 2, PhD candidate Surya S.
REMOTE SENSING FOR FLOOD HAZARD STUDIES.
 REMOTE SENSING FOR FLOOD HAZARD STUDIES. OPTICAL SENSORS. 1 DRS. NANETTE C. KINGMA 1 Optical Remote Sensing for flood hazard studies. 2 2 Floods & use of remote sensing. Floods often leaves its imprint
typical spectral signatures of photosynthetically active and non-photosynthetically active vegetation (Beeri et al., 2007)
") typical spectral signatures of photosynthetically active and non-photosynthetically active vegetation (Beeri et al., 2007) Xie, Y. et al. J Plant Ecol 2008 1:9-23; doi:10.1093/jpe/rtm005 Copyright restrictions
typical spectral signatures of photosynthetically active and non-photosynthetically active vegetation (Beeri et al., 2007) Xie, Y. et al. J Plant Ecol 2008 1:9-23; doi:10.1093/jpe/rtm005 Copyright restrictions
Center for Advanced Land Management Information Technologies (CALMIT), School of Natural Resources, University of Nebraska-Lincoln
, School of Natural Resources, University of Nebraska-Lincoln") Geoffrey M. Henebry, Andrés Viña, and Anatoly A. Gitelson Center for Advanced Land Management Information Technologies (CALMIT), School of Natural Resources, University of Nebraska-Lincoln Introduction
Geoffrey M. Henebry, Andrés Viña, and Anatoly A. Gitelson Center for Advanced Land Management Information Technologies (CALMIT), School of Natural Resources, University of Nebraska-Lincoln Introduction
Image interpretation I and II
 Image interpretation I and II Looking at satellite image, identifying different objects, according to scale and associated information and to communicate this information to others is what we call as IMAGE
Mod. 2 p. 1. Prof. Dr. Christoph Kleinn Institut für Waldinventur und Waldwachstum Arbeitsbereich Fernerkundung und Waldinventur
 Histograms of gray values for TM bands 1-7 for the example image - Band 4 and 5 show more differentiation than the others (contrast=the ratio of brightest to darkest areas of a landscape). - Judging from
Atmospheric Correction (including ATCOR)
") Technical Specifications Atmospheric Correction (including ATCOR) The data obtained by optical satellite sensors with high spatial resolution has become an invaluable tool for many groups interested in
Technical Specifications Atmospheric Correction (including ATCOR) The data obtained by optical satellite sensors with high spatial resolution has become an invaluable tool for many groups interested in
GE 113 REMOTE SENSING. Topic 7. Image Enhancement
 GE 113 REMOTE SENSING Topic 7. Image Enhancement Lecturer: Engr. Jojene R. Santillan jrsantillan@carsu.edu.ph Division of Geodetic Engineering College of Engineering and Information Technology Caraga State
Remote Sensing. Odyssey 7 Jun 2012 Benjamin Post
 Remote Sensing Odyssey 7 Jun 2012 Benjamin Post Definitions Applications Physics Image Processing Classifiers Ancillary Data Data Sources Related Concepts Outline Big Picture Definitions Remote Sensing
Evaluation of Sentinel-2 bands over the spectrum
 Evaluation of Sentinel-2 bands over the spectrum S.E. Hosseini Aria, M. Menenti, Geoscience and Remote sensing Department Delft University of Technology, Netherlands 1 outline ointroduction - Concept odata
Lecture 13: Remotely Sensed Geospatial Data
 Lecture 13: Remotely Sensed Geospatial Data A. The Electromagnetic Spectrum: The electromagnetic spectrum (Figure 1) indicates the different forms of radiation (or simply stated light) emitted by nature.
Interpreting land surface features. SWAC module 3
 Interpreting land surface features SWAC module 3 Interpreting land surface features SWAC module 3 Different kinds of image Panchromatic image True-color image False-color image EMR : NASA Echo the bat
Temporal Change Enhancement in Multispectral Images Remotely Sensed from Satellites
 Temporal Change Enhancement in Multispectral mages Remotely Sensed from Satellites Bill Pfaff Utah State University 12 June 1997 ABSTRACT The application of principal components analysis to multispectral
CHANGE DETECTION BY THE IR-MAD AND KERNEL MAF METHODS IN LANDSAT TM DATA COVERING A SWEDISH FOREST REGION
 CHANGE DETECTION BY THE IR-MAD AND KERNEL MAF METHODS IN LANDSAT TM DATA COVERING A SWEDISH FOREST REGION Allan A. NIELSEN a, Håkan OLSSON b a Technical University of Denmark, National Space Institute
FAQs by Jack F Tutorials about Remote Sensing Science and Geospatial Information Technologies
 F: TASSELED CAP TRANSFORMATION IMAGES Like Frequently Asked Questions, a question is posed, e.g., F1. What is the Tasseled Cap Transformation? Then, an answer is given 1 with comments and opinions. For
746A27 Remote Sensing and GIS. Multi spectral, thermal and hyper spectral sensing and usage
 746A27 Remote Sensing and GIS Lecture 3 Multi spectral, thermal and hyper spectral sensing and usage Chandan Roy Guest Lecturer Department of Computer and Information Science Linköping University Multi
Lab 6: Multispectral Image Processing Using Band Ratios
 Lab 6: Multispectral Image Processing Using Band Ratios due Dec. 11, 2017 Goals: 1. To learn about the spectral characteristics of vegetation and geologic materials. 2. To experiment with vegetation indices
Wetlands Investigation Utilizing GIS and Remote Sensing Technology for Lucas County, Ohio: a hybrid analysis.
 Wetlands Investigation Utilizing GIS and Remote Sensing Technology for Lucas County, Ohio: a hybrid analysis. Update on current wetlands research in GISAG Nathan Torbick Spring 2003 Component One Remote
Vineyard identification in an oak woodland landscape with airborne digital camera imagery
 INT. J. REMOTE SENSING, 2003, VOL. 24, NO. 6, 1303 1315 Vineyard identification in an oak woodland landscape with airborne digital camera imagery P. GONG, S. A. MAHLER, G. S. BIGING and D. A. NEWBURN International
Application of GIS to Fast Track Planning and Monitoring of Development Agenda
 Application of GIS to Fast Track Planning and Monitoring of Development Agenda Radiometric, Atmospheric & Geometric Preprocessing of Optical Remote Sensing 13 17 June 2018 Outline 1. Why pre-process remotely
USING LANDSAT MULTISPECTRAL IMAGES IN ANALYSING FOREST VEGETATION
 Technical Sciences 243 USING LANDSAT MULTISPECTRAL IMAGES IN ANALYSING FOREST VEGETATION Teodor TODERA teotoderas@yahoo.com Traian CR CEA traiancracea@yahoo.com Alina NEGOESCU alina.negoescu@yahoo.com
GEOI 313: Digital Image Processing - I
 GEOI 33: Digital Image Processing - I Module I: Image Representation Image Display For remote sensing computing, the image display is especially important because the analyst must be able to examine images
Introduction to Remote Sensing
 Introduction to Remote Sensing Spatial, spectral, temporal resolutions Image display alternatives Vegetation Indices Image classifications Image change detections Accuracy assessment Satellites & Air-Photos
A (very) brief introduction to Remote Sensing: From satellites to maps!
 brief introduction to Remote Sensing: From satellites to maps!") Spatial Data Analysis and Modeling for Agricultural Development, with R - Workshop A (very) brief introduction to Remote Sensing: From satellites to maps! Earthlights DMSP 1994-1995 https://wikimedia.org/
Spatial Data Analysis and Modeling for Agricultural Development, with R - Workshop A (very) brief introduction to Remote Sensing: From satellites to maps! Earthlights DMSP 1994-1995 https://wikimedia.org/
TimeSync V3 User Manual. January Introduction
 TimeSync V3 User Manual January 2017 Introduction TimeSync is an application that allows researchers and managers to characterize and quantify disturbance and landscape change by facilitating plot-level
Remote Sensing for Rangeland Applications
 Remote Sensing for Rangeland Applications Jay Angerer Ecological Training June 16, 2012 Remote Sensing The term "remote sensing," first used in the United States in the 1950s by Ms. Evelyn Pruitt of the
Digital Image Processing
 Digital Image Processing 1 Patrick Olomoshola, 2 Taiwo Samuel Afolayan 1,2 Surveying & Geoinformatic Department, Faculty of Environmental Sciences, Rufus Giwa Polytechnic, Owo. Nigeria Abstract: This paper
RGB colours: Display onscreen = RGB
 RGB colours: http://www.colorspire.com/rgb-color-wheel/ Display onscreen = RGB DIGITAL DATA and DISPLAY Myth: Most satellite images are not photos Photographs are also 'images', but digital images are
Monitoring agricultural plantations with remote sensing imagery
 MPRA Munich Personal RePEc Archive Monitoring agricultural plantations with remote sensing imagery Camelia Slave and Anca Rotman University of Agronomic Sciences and Veterinary Medicine - Bucharest Romania,
Land Cover Change Analysis An Introduction to Land Cover Change Analysis using the Multispectral Image Data Analysis System (MultiSpec )
") Land Cover Change Analysis An Introduction to Land Cover Change Analysis using the Multispectral Image Data Analysis System (MultiSpec ) Level: Grades 9 to 12 Windows version With Teacher Notes Earth Observation
Land Cover Change Analysis An Introduction to Land Cover Change Analysis using the Multispectral Image Data Analysis System (MultiSpec ) Level: Grades 9 to 12 Windows version With Teacher Notes Earth Observation
Student Name: Maitha Aylan Almuhairi. ID number: Instructor: Dr. M. M. Yagoub
 United Arab Emirates University Humanities & Social Science Collage Geography Department GIS Program Student Name: Maitha Aylan Almuhairi ID number: 200503003 Instructor: Dr. M. M. Yagoub Fall 2008 Content
Outline for today. Geography 411/611 Remote sensing: Principles and Applications. Remote sensing: RS for biogeochemical cycles
 Geography 411/611 Remote sensing: Principles and Applications Thomas Albright, Associate Professor Laboratory for Conservation Biogeography, Department of Geography & Program in Ecology, Evolution, & Conservation
Digitization and fundamental techniques
 Digitization and fundamental techniques Chapter 2.2-2.6 Robin Strand Centre for Image analysis Swedish University of Agricultural Sciences Uppsala University Outline Imaging Digitization Sampling Labeling
Exercise 4-1 Image Exploration
 Exercise 4-1 Image Exploration With this exercise, we begin an extensive exploration of remotely sensed imagery and image processing techniques. Because remotely sensed imagery is a common source of data
Chapter Eighteen: Vegetation Indices
 Chapter Eighteen: Vegetation Indices by Amadou Thiam and J. Ronald Eastman Introduction Analysis of vegetation and detection of changes in vegetation patterns are keys to natural resource assessment and
Application of Remote Sensing in the Monitoring of Marine pollution. By Atif Shahzad Institute of Environmental Studies University of Karachi
 Application of Remote Sensing in the Monitoring of Marine pollution By Atif Shahzad Institute of Environmental Studies University of Karachi Remote Sensing "Remote sensing is the science (and to some extent,
Introduction to TimeSync A Tool For Landsat Time Series Visualization. Warren B Cohen, USDA Forest Service Zhiqiang Yang, Oregon State University
 Introduction to TimeSync A Tool For Landsat Time Series Visualization Warren B Cohen, USDA Forest Service Zhiqiang Yang, Oregon State University TimeSync Introduction Landsat time series visualization
MULTI-TEMPORAL IMAGE ANALYSIS OF THE COASTAL WATERSHED, NH INTRODUCTION
 MULTI-TEMPORAL IMAGE ANALYSIS OF THE COASTAL WATERSHED, NH Meghan Graham MacLean, PhD Student Alexis M. Rudko, MS Student Dr. Russell G. Congalton, Professor Department of Natural Resources and the Environment
Image Fusion. Pan Sharpening. Pan Sharpening. Pan Sharpening: ENVI. Multi-spectral and PAN. Magsud Mehdiyev Geoinfomatics Center, AIT
 1 Image Fusion Sensor Merging Magsud Mehdiyev Geoinfomatics Center, AIT Image Fusion is a combination of two or more different images to form a new image by using certain algorithms. ( Pohl et al 1998)
Geo/SAT 2 TROPICAL WET REALMS OF CENTRAL AFRICA, PART II
 Geo/SAT 2 TROPICAL WET REALMS OF CENTRAL AFRICA, PART II Paul R. Baumann Professor of Geography (Emeritus) State University of New York College at Oneonta Oneonta, New York 13820 USA COPYRIGHT 2009 Paul
Ordination of multispectral imagery for multitemporal change analysis using Principal Components Analysis
 62 Prairie Perspectives Ordination of multispectral imagery for multitemporal change analysis using Principal Components Analysis Joseph M. Piwowar, University of Regina Andrew A. Millward, University
Remote sensing in archaeology from optical to lidar. Krištof Oštir ModeLTER Scientific Research Centre of the Slovenian Academy of Sciences and Arts
 Remote sensing in archaeology from optical to lidar Krištof Oštir ModeLTER Scientific Research Centre of the Slovenian Academy of Sciences and Arts Introduction Optical remote sensing Systems Search for
Chapter 5. Preprocessing in remote sensing
 Chapter 5. Preprocessing in remote sensing 5.1 Introduction Remote sensing images from spaceborne sensors with resolutions from 1 km to < 1 m become more and more available at reasonable costs. For some
LAND USE/LAND COVER MAPPING: ACCURACY COMPARISON OF. CLASSIFICATION OF VARIOUS BAND COMBINATIONS: (Ejisu Juaben Municipality Area)
") KWAME NKRUMAH UNIVERSITY OF SCIENCE AND TECHNOLOGY COLLEGE OF ENGINEERING DEPARTMENT OF GEOMATIC ENGINEERING LAND USE/LAND COVER MAPPING: ACCURACY COMPARISON OF CLASSIFICATION OF VARIOUS BAND COMBINATIONS:
KWAME NKRUMAH UNIVERSITY OF SCIENCE AND TECHNOLOGY COLLEGE OF ENGINEERING DEPARTMENT OF GEOMATIC ENGINEERING LAND USE/LAND COVER MAPPING: ACCURACY COMPARISON OF CLASSIFICATION OF VARIOUS BAND COMBINATIONS:
Using Color-Infrared Imagery for Impervious Surface Analysis. Chris Behee City of Bellingham Planning & Community Development
 Using Color-Infrared Imagery for Impervious Surface Analysis. Chris Behee City of Bellingham Planning & Community Development NW GIS Users Group - March 18, 2005 Outline What is Color Infrared Imagery?
earthobservation.wordpress.com
 Dirty REMOTE SENSING earthobservation.wordpress.com Stuart Green Teagasc Stuart.Green@Teagasc.ie 1 Purpose Give you a very basic skill set and software training so you can: find free satellite image data.
Detecting Greenery in Near Infrared Images of Ground-level Scenes
 Detecting Greenery in Near Infrared Images of Ground-level Scenes Piotr Łabędź Agnieszka Ozimek Institute of Computer Science Cracow University of Technology Digital Landscape Architecture, Dessau Bernburg
MRLC 2001 IMAGE PREPROCESSING PROCEDURE
 MRLC 2001 IMAGE PREPROCESSING PROCEDURE The core dataset of the MRLC 2001 database consists of Landsat 7 ETM+ images. Image selection is based on vegetation greenness profiles defined by a multi-year normalized
Satellite Remote Sensing: Earth System Observations
 Satellite Remote Sensing: Earth System Observations Land surface Water Atmosphere Climate Ecosystems 1 EOS (Earth Observing System) Develop an understanding of the total Earth system, and the effects of
Seasonal Progression of the Normalized Difference Vegetation Index (NDVI)
") Seasonal Progression of the Normalized Difference Vegetation Index (NDVI) For this exercise you will be using a series of six SPOT 4 images to look at the phenological cycle of a crop. The images are SPOT
Seasonal Progression of the Normalized Difference Vegetation Index (NDVI) For this exercise you will be using a series of six SPOT 4 images to look at the phenological cycle of a crop. The images are SPOT
GE 113 REMOTE SENSING
 GE 113 REMOTE SENSING Topic 5. Introduction to Digital Image Interpretation and Analysis Lecturer: Engr. Jojene R. Santillan jrsantillan@carsu.edu.ph Division of Geodetic Engineering College of Engineering
Image enhancement. Introduction to Photogrammetry and Remote Sensing (SGHG 1473) Dr. Muhammad Zulkarnain Abdul Rahman
 Dr. Muhammad Zulkarnain Abdul Rahman") Image enhancement Introduction to Photogrammetry and Remote Sensing (SGHG 1473) Dr. Muhammad Zulkarnain Abdul Rahman Image enhancement Enhancements are used to make it easier for visual interpretation
Image enhancement Introduction to Photogrammetry and Remote Sensing (SGHG 1473) Dr. Muhammad Zulkarnain Abdul Rahman Image enhancement Enhancements are used to make it easier for visual interpretation
IMAGE ENHANCEMENT. Component-I(A) - Personal Details. Component-I (B) - Description of Module. Role Name Affiliation
 - Personal Details. Component-I (B) - Description of Module. Role Name Affiliation") Component-I(A) - Personal Details Role Name Affiliation Principal Investigator Prof.MasoodAhsanSiddiqui Department of Geography, JamiaMilliaIslamia, New Delhi Paper Coordinator, if any Dr. M P Punia Head,
Component-I(A) - Personal Details Role Name Affiliation Principal Investigator Prof.MasoodAhsanSiddiqui Department of Geography, JamiaMilliaIslamia, New Delhi Paper Coordinator, if any Dr. M P Punia Head,
Face Recognition System Based on Infrared Image
 International Journal of Engineering Inventions e-issn: 2278-7461, p-issn: 2319-6491 Volume 6, Issue 1 [October. 217] PP: 47-56 Face Recognition System Based on Infrared Image Yong Tang School of Electronics
Environmental Remote Sensing GEOG 2021
 Environmental Remote Sensing GEOG 2021 Lecture 2 Image display and enhancement 2 Image Display and Enhancement Purpose visual enhancement to aid interpretation enhancement for improvement of information
Introduction to Remote Sensing
 Introduction to Remote Sensing Daniel McInerney Urban Institute Ireland, University College Dublin, Richview Campus, Clonskeagh Drive, Dublin 14. 16th June 2009 Presentation Outline 1 2 Spaceborne Sensors
INTEGRATION OF MULTITEMPORAL ERS SAR AND LANDSAT TM DATA FOR SOIL MOISTURE ASSESSMENT
 INTEGRATION OF MULTITEMPORAL ERS SAR AND LANDSAT TM DATA FOR SOIL MOISTURE ASSESSMENT Beata HEJMANOWSKA, Stanisław MULARZ University of Mining and Metallurgy, Krakow, Poland Department of Photogrammetry
Introduction to DSP ECE-S352 Fall Quarter 2000 Matlab Project 1
 Objective: Introduction to DSP ECE-S352 Fall Quarter 2000 Matlab Project 1 This Matlab Project is an extension of the basic correlation theory presented in the course. It shows a practical application
Land cover change methods. Ned Horning
 Land cover change methods Ned Horning Version: 1.0 Creation Date: 2004-01-01 Revision Date: 2004-01-01 License: This document is licensed under a Creative Commons Attribution-Share Alike 3.0 Unported License.
GE 113 REMOTE SENSING
 GE 113 REMOTE SENSING Topic 8. Image Classification and Accuracy Assessment Lecturer: Engr. Jojene R. Santillan jrsantillan@carsu.edu.ph Division of Geodetic Engineering College of Engineering and Information
Using Multi-spectral Imagery in MapInfo Pro Advanced
 Using Multi-spectral Imagery in MapInfo Pro Advanced MapInfo Pro Advanced Tom Probert, Global Product Manager MapInfo Pro Advanced: Intuitive interface for using multi-spectral / hyper-spectral imagery
MOVING FROM PIXELS TO PRODUCTS
 TRUE COLOR RGB MOSAIC, OSAKA, JAPAN MOVING FROM PIXELS TO PRODUCTS and data to insight AUTOMATED STRUCTURE IDENTIFICATION, OSAKA, JAPAN Table of Contents Moving from Pixels to Products 3 Doubling the Spectral
Module 11 Digital image processing
 Introduction Geo-Information Science Practical Manual Module 11 Digital image processing 11. INTRODUCTION 11-1 START THE PROGRAM ERDAS IMAGINE 11-2 PART 1: DISPLAYING AN IMAGE DATA FILE 11-3 Display of
The effects of uncertainty in forest inventory plot locations. Ronald E. McRoberts, Geoffrey R. Holden, and Greg C. Liknes
 The effects of uncertainty in forest inventory plot locations Ronald E. McRoberts, Geoffrey R. Holden, and Greg C. Liknes North Central Research Station, USDA Forest Service, Saint Paul, Minnesota 55108
The New Rig Camera Process in TNTmips Pro 2018
 The New Rig Camera Process in TNTmips Pro 2018 Jack Paris, Ph.D. Paris Geospatial, LLC, 3017 Park Ave., Clovis, CA 93611, 559-291-2796, jparis37@msn.com Kinds of Digital Cameras for Drones Two kinds of
AN ABSTRACT OF THE ThESIS OF. SEN WANG for the degree of MASTER OF SCIENCE in. FOREST MANAGEMENT presented on MAY 2, 1988
 AN ABSTRACT OF THE ThESIS OF SEN WANG for the degree of MASTER OF SCIENCE in FOREST MANAGEMENT presented on MAY 2, 1988 Title: MULTITEMPOPAL CLASSIFICATION OF VEGETATION IN THE OREGON COASTAL RANGE USING
GEOG432: Remote sensing Lab 3 Unsupervised classification
 GEOG432: Remote sensing Lab 3 Unsupervised classification Goal: This lab involves identifying land cover types by using agorithms to identify pixels with similar Digital Numbers (DN) and spectral signatures
MODULE 4 LECTURE NOTES 4 DENSITY SLICING, THRESHOLDING, IHS, TIME COMPOSITE AND SYNERGIC IMAGES
 MODULE 4 LECTURE NOTES 4 DENSITY SLICING, THRESHOLDING, IHS, TIME COMPOSITE AND SYNERGIC IMAGES 1. Introduction Digital image processing involves manipulation and interpretation of the digital images so
GEOG432: Remote sensing Lab 3 Unsupervised classification
 GEOG432: Remote sensing Lab 3 Unsupervised classification Goal: This lab involves identifying land cover types by using agorithms to identify pixels with similar Digital Numbers (DN) and spectral signatures
USE OF COLOR IN REMOTE SENSING
 1 USE OF COLOR IN REMOTE SENSING (David Sandwell, Copyright, 2004) Display of large data sets - Most remote sensing systems create arrays of numbers representing an area on the surface of the Earth. The
Using Indexes to Detect the Environmental Changes of Hor Al-Dalmaj and Surrounding Areas in Central Sector of Mesopotamia Plain
 Using Indexes to Detect the Environmental Changes of Hor Al-Dalmaj and Surrounding Areas in Central Sector of Mesopotamia Plain Mousa Ahmed Remote Sensing Division, Department of Information Technology,
GIS Data Collection. Remote Sensing
 GIS Data Collection Remote Sensing Data Collection Remote sensing Introduction Concepts Spectral signatures Resolutions: spectral, spatial, temporal Digital image processing (classification) Other systems
Figure 1: Percent reflectance for various features, including the five spectra from Table 1, at different wavelengths from 0.4µm to 1.4µm.
 Section 1: The Electromagnetic Spectrum 1. The wavelength range that has the highest reflectance for broadleaf vegetation and needle leaf vegetation is 0.75µm to 1.05µm. 2. Dry soil can be distinguished
Remote Sensing 4113 Lab 08: Filtering and Principal Components Mar. 28, 2018
 Remote Sensing 4113 Lab 08: Filtering and Principal Components Mar. 28, 2018 In this lab we will explore Filtering and Principal Components analysis. We will again use the Aster data of the Como Bluffs
Some Basic Concepts of Remote Sensing. Lecture 2 August 31, 2005
 Some Basic Concepts of Remote Sensing Lecture 2 August 31, 2005 What is remote sensing Remote Sensing: remote sensing is science of acquiring, processing, and interpreting images and related data that
COMPARISON ON URBAN CLASSIFICATIONS USING LANDSAT-TM AND LINEAR SPECTRAL MIXTURE ANALYSIS EXTRACTED IMAGES: NAKHON RATCHASIMA MUNICIPAL AREA, THAILAND
 Suranaree J. Sci. Technol. Vol. 17 No. 4; Oct - Dec 2010 401 COMPARISON ON URBAN CLASSIFICATIONS USING LANDSAT-TM AND LINEAR SPECTRAL MIXTURE ANALYSIS EXTRACTED IMAGES: NAKHON RATCHASIMA MUNICIPAL AREA,
Crop and Irrigation Water Management Using High-resolution Airborne Remote Sensing
 Crop and Irrigation Water Management Using High-resolution Airborne Remote Sensing Christopher M. U. Neale and Hari Jayanthi Dept. of Biological and Irrigation Eng. Utah State University & James L.Wright
NON-PHOTOGRAPHIC SYSTEMS: Multispectral Scanners Medium and coarse resolution sensor comparisons: Landsat, SPOT, AVHRR and MODIS
 NON-PHOTOGRAPHIC SYSTEMS: Multispectral Scanners Medium and coarse resolution sensor comparisons: Landsat, SPOT, AVHRR and MODIS CLASSIFICATION OF NONPHOTOGRAPHIC REMOTE SENSORS PASSIVE ACTIVE DIGITAL
Introduction to Remote Sensing Fundamentals of Satellite Remote Sensing. Mads Olander Rasmussen
 Introduction to Remote Sensing Fundamentals of Satellite Remote Sensing Mads Olander Rasmussen (mora@dhi-gras.com) 01. Introduction to Remote Sensing DHI What is remote sensing? the art, science, and technology
Int n r t o r d o u d c u ti t on o n to t o Remote Sensing
 Introduction to Remote Sensing Definition of Remote Sensing Remote sensing refers to the activities of recording/observing/perceiving(sensing)objects or events at far away (remote) places. In remote sensing,
CORRECTION OF ATMOSPHERIC HAZE IN RESOURCESAT-1 LISS-4 MX DATA FOR URBAN ANALYSIS: AN IMPROVED DARK OBJECT SUBTRACTION APPROACH
 CORRECTION OF ATMOSPHERIC HAZE IN RESOURCESAT-1 LISS-4 MX DATA FOR URBAN ANALYSIS: AN IMPROVED DARK OBJECT SUBTRACTION APPROACH Sk. Mustak Research Scholar (Ph.D.), School of Studies in Geography Pt. Ravishankar