GE 113 REMOTE SENSING. Topic 7. Image Enhancement
|
|
|
- Arron Blair
- 5 years ago
- Views:
Transcription


1 GE 113 REMOTE SENSING Topic 7. Image Enhancement Lecturer: Engr. Jojene R. Santillan Division of Geodetic Engineering College of Engineering and Information Technology Caraga State University


2 Outline Part 1. Image Enhancement Concepts Part 2. Contrast Manipulation Techniques 2
3 Expected Outcomes The students would be able to: Learn the concepts behind image enhancement Identify the various computer-assisted procedures of image enhancement Learn how to conduct the computer-assisted procedures through laboratory exercises 3
4 PART 1. IMAGE ENHANCEMENT CONCEPTS 4
5 Image Enhancement The goal is to improve the visual interpretability of an image by increasing the apparent distinction between the features in the scene. Why do we need a computer to do the enhancement? Our eyes are poor at discriminating the slight radiometric or spectral differences that may characterize such features With computers, these slight differences can be visually amplified to make them readily observable by our eyes. 5
6 6
7 7
8 8
9 9
10 10
11 Types of Image Enhancement Operations Point Operations Brightness values of each pixel in an image data are modified independently Local Operations Brightness values of each pixel in an image data are modified based on neighboring brightness values Note: Either form of enhancement can be performed on single-band images or on the individual components of multi-image composites. 11
12 When are image enhancement techniques applied? Normally applied to image data after the appropriate image rectification and restoration procedures have been performed. Noise removal very important to conduct prior to image enhancement Image enhancement techniques may enhance noise if they are not removed the interpreter will end up analyzing enhanced noise! 12
13 Categories of Image Enhancement Techniques Contrast Manipulation Techniques Discussed in detail in Part 2 Spatial Feature Manipulation Techniques Used to emphasize or deemphasize image data of various spatial frequencies Spatial frequency refers to the roughness of the tonal variations occurring in an image These are local operations pixel values in an original image are modified on the basis of the gray scale/brightness/dn values of neighboring pixels Examples: Spatial filters Multi-image Manipulation Techniques Enhancements involving multiple spectral bands of imagery Examples: Spectral ratioing Principal and canonical components transformation Vegetation components transformation Intensity-hue-saturation color space transformation 13
14 PART 2. CONTRAST MANIPULATION TECHNIQUES 14


15 Contrast Manipulation Focused on manipulating the brightness values/dns of an image data to reveal specific or new information or to enhance existing image information Commonly used contrast manipulation procedures: Gray-level thresholding Level slicing Contrast stretching These are all point operations 15
16 Gray-level Thresholding A segmentation procedure An input image band is segmented into two classes: One class for those pixels having values below a defined gray level (DN) One class for those pixels above this value The result is a binary classification This binary classification can then be applied to a particular image band data to enable display of brightness variations in only a particular class 16

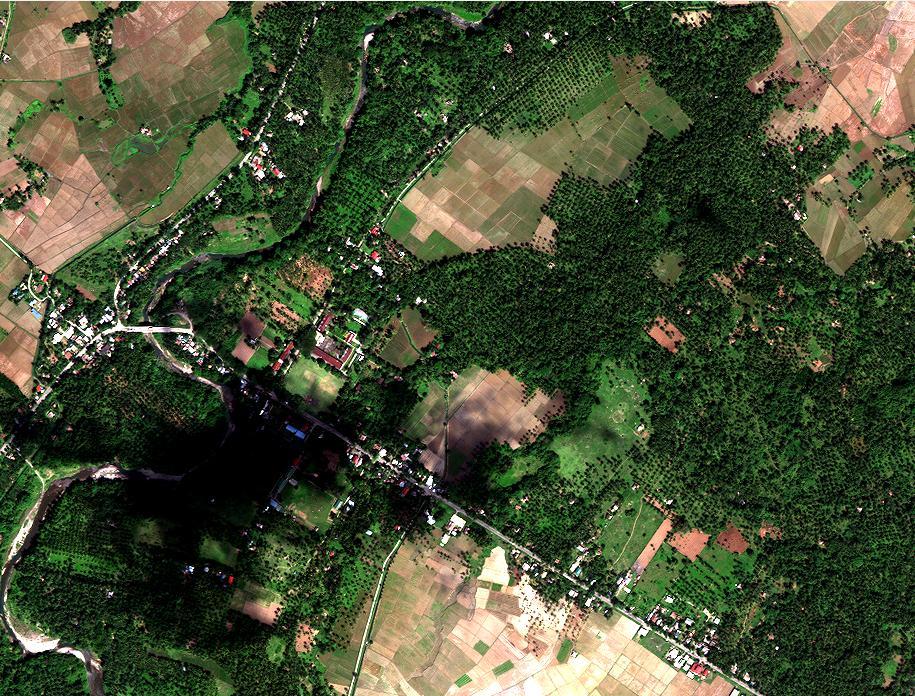
 True Color Image Showing only Class 1")
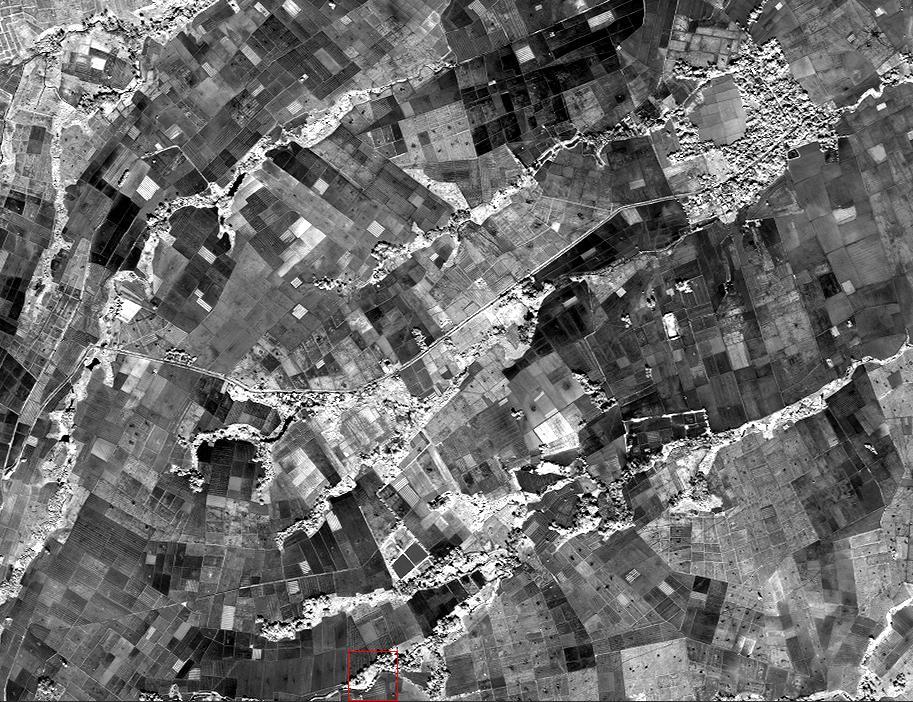
17 NIR Band of Landsat 7 ETM+ Example: Histogram of DN values of NIR Band DN Range: 0 30 water bodies Gray-scale Thresholded Image: Class 1: 0-30 (Water) Class 2: (Others) NIR Band of Landsat 7 ETM+ Showing only Class 1 (Water) True Color Image Showing only Class 1 (Water) 17
18 Level Slicing An enhancement technique whereby the DNs distributed along the x axis of an image histogram are divided into a series of intervals or slices. All of the DNs falling within a slice are then displayed at a single DN in the output image 18
")
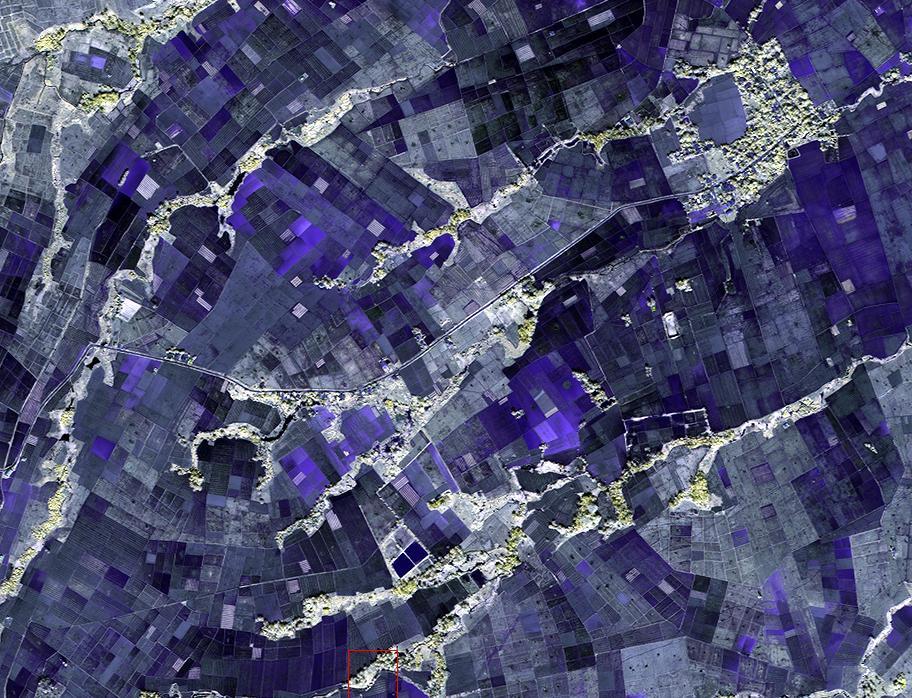
19 NIR Band of Landsat 7 ETM+ Example: Histogram of DN values of NIR Band Sliced NIR Band of Landsat 7 ETM+ (6 classes) 19

20 Example: Sliced NIR Band (Water Portion only) 20
 Image http://www.mdpi.com/2072-4292/7/4/4268/htm 21")
21 Example: Level slicing the TIR Band of Landsat 7 to show land surface temperature (LST) Image 21
22 Contrast Stretching (1) Recall: An image can have DN values ranging from 0 to a maximum value depending on its radiometric resolution: E.g., an 8-bit image can have DNs ranging from A 12-bit image can have DNs ranging from Etc. When the image data are visualized on a screen of a computer, they are displayed as brightness values for each screen pixel A data pixel with a larger value is brighter than one with a smaller value However, unlike the image data, screen pixels can only have 256 unique brightness values (i.e., 0 to 255). This limitation prevents the data from being displayed with brightness exactly equal to their real (DN) value 22
23 Contrast Stretching (2) Stretching the image data refers to a method by which the data pixels are rescaled from their original values into a range that the monitor can display - namely, into integer values between 0 and 255. But what about contrast stretching? 23
24 Contrast Stretching (3) The parameters of the stretch can be adjusted to maximize the information content of the display for the features of interest this process is referred to as contrast stretching. Contrast stretching changes contrast in the image Contrast = the relative differences in the brightness of the data values: increasing an image's contrast means the dark pixels will become darker, and the bright pixels will become brighter brightness difference between the two increases 24

25 Contrast Stretching as an Image Enhancement Procedure Used to expand the narrow range of brightness values typically present in an input image over a wide range of values Contrast stretching results to an output image or image display that is designed to emphasize the contrast between features of interest. 25
26 Types of Contrast Stretching (as implemented in various image processing software, e.g., Envi) Linear Linear Linear 2% Gaussian Equalization Square root ALL OF THESE OPERATIONS RELY ON THE MANIPULATION OF THE IMAGE HISTOGRAMS 26

27 Number of Students What is a Histogram? a graphical representation of the distribution of numerical data. To construct a histogram, the first step is to "bin" the range of values that is, divide the entire range of values into a series of intervals and then count how many values fall into each interval. The bins are usually specified as consecutive, nonoverlapping intervals of a variable. Exam Score The bins (intervals) must be adjacent, and are usually equal size 27
28 What is a Image Histogram? A type of histogram that acts as a graphical representation of the tonal ( DN ) distribution in a digital image. It plots the number of pixels for each tonal/dn value. By looking at the histogram for a specific image a viewer will be able to judge the entire tonal distribution at a glance. 28
29 Linear Contrast Stretching Sets the image minimum and maximum DN values to values of 0 and 255, and stretches all other data values linearly between 0 to 255. Example: If a band of an image has DN values ranging from 30 to 200, linear contrast stretching will expand the range such that when displayed/outputted to an image file, the new DN values will range from 0 to 255: Screen value of 0 will be assigned to 30 Screen value of 200 will be assigned to 255 All other values will be linearly stretched Algorithm: Where: New DN = DN = [(DN MIN) / (MAX MIN) ] * 255 DN = original DN of a pixel MIN = the image s minimum DN value that will be assigned a new value of 0 MAX = the image s maximum DN value that will be assigned a new value of
30 30

31 Example: Linear Contrast Stretching Original Band 1 Stretched 31
32 Linear Sets the image s DN value of 0 to a new value of 0, and the image s DN value of 255 to a new value of 255 No stretching 32

33 Example: Linear Original Band 1 Stretched 33
34 Linear 2% Sets the highest and lowest 2% of the original image DN values to new values of 0 and 255, and it stretches all other data values linearly 34
35 Example: Linear 2% Original Band 1 Stretched 35
36 Gaussian Sets: the original image s mean DN value to a new value of 127, the DN value 3 standard deviations below the mean value to a new value of 0, and the DN value 3 standard deviations above the mean value to a new value of 255. Intermediate values are assigned new value using a Gaussian curve 36
37 Example: Gaussian Original Band 1 Stretched 37
38 Histogram Equalization Scales the original image DN values to equalize the number of DNs in each display histogram bin In this approach, image DN values are assigned to the display levels on the basis of their frequency of occurrence 38

39 Example: Histogram Equalization Original Band 1 Stretched 39
40 Square root takes the square of the input histogram and applies a linear stretch Original Band 1 Stretched 40

41 Questions or clarifications? 41
42 References/Further Reading Lillesand, T. M., Kiefer, R. W., & Chipman, J. W. (2008). Remote Sensing and Image Interpretation 6th Edition. United States of America: John Wiley & Sons, Inc. Online Tutorial: Fundamentals of Remote Sensing Image Enhancement. Available at 42
GE 113 REMOTE SENSING
 GE 113 REMOTE SENSING Topic 5. Introduction to Digital Image Interpretation and Analysis Lecturer: Engr. Jojene R. Santillan jrsantillan@carsu.edu.ph Division of Geodetic Engineering College of Engineering
GE 113 REMOTE SENSING
 GE 113 REMOTE SENSING Topic 8. Image Classification and Accuracy Assessment Lecturer: Engr. Jojene R. Santillan jrsantillan@carsu.edu.ph Division of Geodetic Engineering College of Engineering and Information
Preparing Remote Sensing Data for Natural Resources Mapping (image enhancement, rectifications )
") Preparing Remote Sensing Data for Natural Resources Mapping (image enhancement, rectifications ) Why is this important What are the major approaches Examples of digital image enhancement Follow up exercises
Preparing Remote Sensing Data for Natural Resources Mapping (image enhancement, rectifications ) Why is this important What are the major approaches Examples of digital image enhancement Follow up exercises
MODULE 4 LECTURE NOTES 4 DENSITY SLICING, THRESHOLDING, IHS, TIME COMPOSITE AND SYNERGIC IMAGES
 MODULE 4 LECTURE NOTES 4 DENSITY SLICING, THRESHOLDING, IHS, TIME COMPOSITE AND SYNERGIC IMAGES 1. Introduction Digital image processing involves manipulation and interpretation of the digital images so
Enhancement of Multispectral Images and Vegetation Indices
 Enhancement of Multispectral Images and Vegetation Indices ERDAS Imagine 2016 Description: We will use ERDAS Imagine with multispectral images to learn how an image can be enhanced for better interpretation.
TDI2131 Digital Image Processing
 TDI2131 Digital Image Processing Image Enhancement in Spatial Domain Lecture 3 John See Faculty of Information Technology Multimedia University Some portions of content adapted from Zhu Liu, AT&T Labs.
Exercise 4-1 Image Exploration
 Exercise 4-1 Image Exploration With this exercise, we begin an extensive exploration of remotely sensed imagery and image processing techniques. Because remotely sensed imagery is a common source of data
Mod. 2 p. 1. Prof. Dr. Christoph Kleinn Institut für Waldinventur und Waldwachstum Arbeitsbereich Fernerkundung und Waldinventur
 Histograms of gray values for TM bands 1-7 for the example image - Band 4 and 5 show more differentiation than the others (contrast=the ratio of brightest to darkest areas of a landscape). - Judging from
Digital Image Processing. Lecture # 3 Image Enhancement
 Digital Image Processing Lecture # 3 Image Enhancement 1 Image Enhancement Image Enhancement 3 Image Enhancement 4 Image Enhancement Process an image so that the result is more suitable than the original
Image interpretation and analysis
 Image interpretation and analysis Grundlagen Fernerkundung, Geo 123.1, FS 2014 Lecture 7a Rogier de Jong Michael Schaepman Why are snow, foam, and clouds white? Why are snow, foam, and clouds white? Today
Remote Sensing. The following figure is grey scale display of SPOT Panchromatic without stretching.
 Remote Sensing Objectives This unit will briefly explain display of remote sensing image, geometric correction, spatial enhancement, spectral enhancement and classification of remote sensing image. At
Digital Image Processing
 Digital Image Processing 1 Patrick Olomoshola, 2 Taiwo Samuel Afolayan 1,2 Surveying & Geoinformatic Department, Faculty of Environmental Sciences, Rufus Giwa Polytechnic, Owo. Nigeria Abstract: This paper
DIGITAL IMAGE PROCESSING Quiz exercises preparation for the midterm exam
 DIGITAL IMAGE PROCESSING Quiz exercises preparation for the midterm exam In the following set of questions, there are, possibly, multiple correct answers (1, 2, 3 or 4). Mark the answers you consider correct.
ECC419 IMAGE PROCESSING
 ECC419 IMAGE PROCESSING INTRODUCTION Image Processing Image processing is a subclass of signal processing concerned specifically with pictures. Digital Image Processing, process digital images by means
Environmental Remote Sensing GEOG 2021
 Environmental Remote Sensing GEOG 2021 Lecture 2 Image display and enhancement 2 Image Display and Enhancement Purpose visual enhancement to aid interpretation enhancement for improvement of information
CoE4TN4 Image Processing. Chapter 3: Intensity Transformation and Spatial Filtering
 CoE4TN4 Image Processing Chapter 3: Intensity Transformation and Spatial Filtering Image Enhancement Enhancement techniques: to process an image so that the result is more suitable than the original image
Application of GIS to Fast Track Planning and Monitoring of Development Agenda
 Application of GIS to Fast Track Planning and Monitoring of Development Agenda Radiometric, Atmospheric & Geometric Preprocessing of Optical Remote Sensing 13 17 June 2018 Outline 1. Why pre-process remotely
USE OF HISTOGRAM EQUALIZATION IN IMAGE PROCESSING FOR IMAGE ENHANCEMENT
 USE OF HISTOGRAM EQUALIZATION IN IMAGE PROCESSING FOR IMAGE ENHANCEMENT Sapana S. Bagade M.E,Computer Engineering, Sipna s C.O.E.T,Amravati, Amravati,India sapana.bagade@gmail.com Vijaya K. Shandilya Assistant
The techniques with ERDAS IMAGINE include:
 The techniques with ERDAS IMAGINE include: 1. Data correction - radiometric and geometric correction 2. Radiometric enhancement - enhancing images based on the values of individual pixels 3. Spatial enhancement
RGB colours: Display onscreen = RGB
 RGB colours: http://www.colorspire.com/rgb-color-wheel/ Display onscreen = RGB DIGITAL DATA and DISPLAY Myth: Most satellite images are not photos Photographs are also 'images', but digital images are
Apply Colour Sequences to Enhance Filter Results. Operations. What Do I Need? Filter
 Apply Colour Sequences to Enhance Filter Results Operations What Do I Need? Filter Single band images from the SPOT and Landsat platforms can sometimes appear flat (i.e., they are low contrast images).
LAB 2: Sampling & aliasing; quantization & false contouring
 CEE 615: Digital Image Processing Spring 2016 1 LAB 2: Sampling & aliasing; quantization & false contouring A. SAMPLING: Observe the effects of the sampling interval near the resolution limit. The goal
Using QuickBird Imagery in ESRI Software Products
 Using QuickBird Imagery in ESRI Software Products TABLE OF CONTENTS 1. Introduction...2 Purpose Scope Image Stretching Color Guns 2. Imagery Usage Instructions...4 ArcView 3.x...4 ArcGIS...7 i Using QuickBird
Prof. Vidya Manian Dept. of Electrical and Comptuer Engineering
 Image Processing Intensity Transformations Chapter 3 Prof. Vidya Manian Dept. of Electrical and Comptuer Engineering INEL 5327 ECE, UPRM Intensity Transformations 1 Overview Background Basic intensity
Remote Sensing Instruction Laboratory
 Laboratory Session 217513 Geographic Information System and Remote Sensing - 1 - Remote Sensing Instruction Laboratory Assist.Prof.Dr. Weerakaset Suanpaga Department of Civil Engineering, Faculty of Engineering
Image Processing Lecture 4
 Image Enhancement Image enhancement aims to process an image so that the output image is more suitable than the original. It is used to solve some computer imaging problems, or to improve image quality.
REMOTE SENSING. Topic 10 Fundamentals of Digital Multispectral Remote Sensing MULTISPECTRAL SCANNERS MULTISPECTRAL SCANNERS
 REMOTE SENSING Topic 10 Fundamentals of Digital Multispectral Remote Sensing Chapter 5: Lillesand and Keifer Chapter 6: Avery and Berlin MULTISPECTRAL SCANNERS Record EMR in a number of discrete portions
Basic Digital Image Processing. The Structure of Digital Images. An Overview of Image Processing. Image Restoration: Line Drop-outs
 Basic Digital Image Processing A Basic Introduction to Digital Image Processing ~~~~~~~~~~ Rev. Ronald J. Wasowski, C.S.C. Associate Professor of Environmental Science University of Portland Portland,
NON UNIFORM BACKGROUND REMOVAL FOR PARTICLE ANALYSIS BASED ON MORPHOLOGICAL STRUCTURING ELEMENT:
 IJCE January-June 2012, Volume 4, Number 1 pp. 59 67 NON UNIFORM BACKGROUND REMOVAL FOR PARTICLE ANALYSIS BASED ON MORPHOLOGICAL STRUCTURING ELEMENT: A COMPARATIVE STUDY Prabhdeep Singh1 & A. K. Garg2
December 28, Dr. Praveen Sankaran (Department of ECE NIT Calicut DIP)
") Dr. Praveen Sankaran Department of ECE NIT Calicut December 28, 2012 Winter 2013 December 28, 2012 1 / 18 Outline 1 Piecewise-Linear Functions Review 2 Histogram Processing Winter 2013 December 28, 2012
Dr. Praveen Sankaran Department of ECE NIT Calicut December 28, 2012 Winter 2013 December 28, 2012 1 / 18 Outline 1 Piecewise-Linear Functions Review 2 Histogram Processing Winter 2013 December 28, 2012
Digital Image Processing
 Digital Image Processing Lecture # 5 Image Enhancement in Spatial Domain- I ALI JAVED Lecturer SOFTWARE ENGINEERING DEPARTMENT U.E.T TAXILA Email:: ali.javed@uettaxila.edu.pk Office Room #:: 7 Presentation
Revised 9/10/2015 Page 1 of 5
 MultiSpec Tutorial: Image Enhancement Requirements: MultiSpec application and image titled ag020522_dpac_cd.lan. Open the image if it is not already displayed in a multispectral image window following
Module 11 Digital image processing
 Introduction Geo-Information Science Practical Manual Module 11 Digital image processing 11. INTRODUCTION 11-1 START THE PROGRAM ERDAS IMAGINE 11-2 PART 1: DISPLAYING AN IMAGE DATA FILE 11-3 Display of
Land Cover Analysis to Determine Areas of Clear-cut and Forest Cover in Olney, Montana. Geob 373 Remote Sensing. Dr Andreas Varhola, Kathry De Rego
 1 Land Cover Analysis to Determine Areas of Clear-cut and Forest Cover in Olney, Montana Geob 373 Remote Sensing Dr Andreas Varhola, Kathry De Rego Zhu an Lim (14292149) L2B 17 Apr 2016 2 Abstract Montana
Image Processing. 2. Point Processes. Computer Engineering, Sejong University Dongil Han. Spatial domain processing
 Image Processing 2. Point Processes Computer Engineering, Sejong University Dongil Han Spatial domain processing g(x,y) = T[f(x,y)] f(x,y) : input image g(x,y) : processed image T[.] : operator on f, defined
SECTION I - CHAPTER 2 DIGITAL IMAGING PROCESSING CONCEPTS
 RADT 3463 - COMPUTERIZED IMAGING Section I: Chapter 2 RADT 3463 Computerized Imaging 1 SECTION I - CHAPTER 2 DIGITAL IMAGING PROCESSING CONCEPTS RADT 3463 COMPUTERIZED IMAGING Section I: Chapter 2 RADT
What is image enhancement? Point operation
 IMAGE ENHANCEMENT 1 What is image enhancement? Image enhancement techniques Point operation 2 What is Image Enhancement? Image enhancement is to process an image so that the result is more suitable than
Basic Hyperspectral Analysis Tutorial
 Basic Hyperspectral Analysis Tutorial This tutorial introduces you to visualization and interactive analysis tools for working with hyperspectral data. In this tutorial, you will: Analyze spectral profiles
Center for Advanced Land Management Information Technologies (CALMIT), School of Natural Resources, University of Nebraska-Lincoln
, School of Natural Resources, University of Nebraska-Lincoln") Geoffrey M. Henebry, Andrés Viña, and Anatoly A. Gitelson Center for Advanced Land Management Information Technologies (CALMIT), School of Natural Resources, University of Nebraska-Lincoln Introduction
Geoffrey M. Henebry, Andrés Viña, and Anatoly A. Gitelson Center for Advanced Land Management Information Technologies (CALMIT), School of Natural Resources, University of Nebraska-Lincoln Introduction
CS 376A Digital Image Processing
 CS 376A Digital Image Processing 02 / 15 / 2017 Instructor: Michael Eckmann Today s Topics Questions? Comments? Color Image processing Fixing tonal problems Start histograms histogram equalization for
Introduction to Remote Sensing Part 1
 Introduction to Remote Sensing Part 1 A Primer on Electromagnetic Radiation Digital, Multi-Spectral Imagery The 4 Resolutions Displaying Images Corrections and Enhancements Passive vs. Active Sensors Radar
University of Texas at San Antonio EES 5053 Term Project CORRELATION BETWEEN NDVI AND SURFACE TEMPERATURES USING LANDSAT ETM + IMAGERY NEWFEL MAZARI
 University of Texas at San Antonio EES 5053 Term Project CORRELATION BETWEEN NDVI AND SURFACE TEMPERATURES USING LANDSAT ETM + IMAGERY NEWFEL MAZARI Introduction and Objectives The present study is a correlation
from: Point Operations (Single Operands)
") from: http://www.khoral.com/contrib/contrib/dip2001 Point Operations (Single Operands) Histogram Equalization Histogram equalization is as a contrast enhancement technique with the objective to obtain
from: http://www.khoral.com/contrib/contrib/dip2001 Point Operations (Single Operands) Histogram Equalization Histogram equalization is as a contrast enhancement technique with the objective to obtain
BSB663 Image Processing Pinar Duygulu. Slides are adapted from Gonzales & Woods, Emmanuel Agu Suleyman Tosun
 BSB663 Image Processing Pinar Duygulu Slides are adapted from Gonzales & Woods, Emmanuel Agu Suleyman Tosun Histograms Histograms Histograms Histograms Histograms Interpreting histograms Histograms Image
Image Enhancement in the Spatial Domain (Part 1)
") Image Enhancement in the Spatial Domain (Part 1) Lecturer: Dr. Hossam Hassan Email : hossameldin.hassan@eng.asu.edu.eg Computers and Systems Engineering Principle Objective of Enhancement Process an image
Image Enhancement in the Spatial Domain (Part 1) Lecturer: Dr. Hossam Hassan Email : hossameldin.hassan@eng.asu.edu.eg Computers and Systems Engineering Principle Objective of Enhancement Process an image
TimeSync V3 User Manual. January Introduction
 TimeSync V3 User Manual January 2017 Introduction TimeSync is an application that allows researchers and managers to characterize and quantify disturbance and landscape change by facilitating plot-level
Sommersemester Prof. Dr. Christoph Kleinn Institut für Waldinventur und Waldwachstum Arbeitsbereich Fernerkundung und Waldinventur.
 Basics of Remote Sensing Some literature references Franklin, SE 2001 Remote Sensing for Sustainable Forest Management Lewis Publishers 407p Lillesand, Kiefer 2000 Remote Sensing and Image Interpretation
Hello, welcome to the video lecture series on Digital Image Processing.
 Digital Image Processing. Professor P. K. Biswas. Department of Electronics and Electrical Communication Engineering. Indian Institute of Technology, Kharagpur. Lecture-33. Contrast Stretching Operation.
Interpreting land surface features. SWAC module 3
 Interpreting land surface features SWAC module 3 Interpreting land surface features SWAC module 3 Different kinds of image Panchromatic image True-color image False-color image EMR : NASA Echo the bat
Removing Thick Clouds in Landsat Images
 Removing Thick Clouds in Landsat Images S. Brindha, S. Archana, V. Divya, S. Manoshruthy & R. Priya Dept. of Electronics and Communication Engineering, Avinashilingam Institute for Home Science and Higher
IMAGE PROCESSING PROJECT REPORT NUCLEUS CLASIFICATION
 ABSTRACT : The Main agenda of this project is to segment and analyze the a stack of image, where it contains nucleus, nucleolus and heterochromatin. Find the volume, Density, Area and circularity of the
Introduction to Remote Sensing
 Introduction to Remote Sensing Spatial, spectral, temporal resolutions Image display alternatives Vegetation Indices Image classifications Image change detections Accuracy assessment Satellites & Air-Photos
GGS 412 Air Photography Interpretation
 GGS 412 Air Photography Interpretation 15019-001 Syllabus Instructor: Dr. Ron Resmini Course description and objective: GGS 412, Air Photography Interpretation, will provide students with the concepts,
IMAGE ENHANCEMENT - POINT PROCESSING
 1 IMAGE ENHANCEMENT - POINT PROCESSING KOM3212 Image Processing in Industrial Systems Some of the contents are adopted from R. C. Gonzalez, R. E. Woods, Digital Image Processing, 2nd edition, Prentice
University of Technology Building & Construction Department / Remote Sensing & GIS lecture
 8. Image Enhancement 8.1 Image Reduction and Magnification. 8.2 Transects (Spatial Profile) 8.3 Spectral Profile 8.4 Contrast Enhancement 8.4.1 Linear Contrast Enhancement 8.4.2 Non-Linear Contrast Enhancement
CHARACTERISTICS OF REMOTELY SENSED IMAGERY. Radiometric Resolution
 CHARACTERISTICS OF REMOTELY SENSED IMAGERY Radiometric Resolution There are a number of ways in which images can differ. One set of important differences relate to the various resolutions that images express.
8. EDITING AND VIEWING COORDINATES, CREATING SCATTERGRAMS AND PRINCIPAL COMPONENTS ANALYSIS
 Editing and viewing coordinates, scattergrams and PCA 8. EDITING AND VIEWING COORDINATES, CREATING SCATTERGRAMS AND PRINCIPAL COMPONENTS ANALYSIS Aim: To introduce you to (i) how you can apply a geographical
1. What values did you use for bands 2, 3 & 4? Populate the table below. Compile the relevant data for the additional bands in the data below:
 Graham Emde GEOG3200: Remote Sensing Lab # 3: Atmospheric Correction Introduction: This lab teachs how to use INDRISI to correct for atmospheric haze in remotely sensed imagery. There are three models
-f/d-b '') o, q&r{laniels, Advisor. 20rt. lmage Processing of Petrographic and SEM lmages. By James Gonsiewski. The Ohio State University
 o, q&r{laniels, Advisor. 20rt. lmage Processing of Petrographic and SEM lmages. By James Gonsiewski. The Ohio State University") lmage Processing of Petrographic and SEM lmages Senior Thesis Submitted in partial fulfillment of the requirements for the Bachelor of Science Degree At The Ohio State Universitv By By James Gonsiewski
lmage Processing of Petrographic and SEM lmages Senior Thesis Submitted in partial fulfillment of the requirements for the Bachelor of Science Degree At The Ohio State Universitv By By James Gonsiewski
Exercise questions for Machine vision
 Exercise questions for Machine vision This is a collection of exercise questions. These questions are all examination alike which means that similar questions may appear at the written exam. I ve divided
DodgeCmd Image Dodging Algorithm A Technical White Paper
 DodgeCmd Image Dodging Algorithm A Technical White Paper July 2008 Intergraph ZI Imaging 170 Graphics Drive Madison, AL 35758 USA www.intergraph.com Table of Contents ABSTRACT...1 1. INTRODUCTION...2 2.
Saturation And Value Modulation (SVM): A New Method For Integrating Color And Grayscale Imagery
: A New Method For Integrating Color And Grayscale Imagery") 87 Saturation And Value Modulation (SVM): A New Method For Integrating Color And Grayscale Imagery By David W. Viljoen 1 and Jeff R. Harris 2 Geological Survey of Canada 615 Booth St. Ottawa, ON, K1A 0E9
87 Saturation And Value Modulation (SVM): A New Method For Integrating Color And Grayscale Imagery By David W. Viljoen 1 and Jeff R. Harris 2 Geological Survey of Canada 615 Booth St. Ottawa, ON, K1A 0E9
INSTITUTIONEN FÖR SYSTEMTEKNIK LULEÅ TEKNISKA UNIVERSITET
 INSTITUTIONEN FÖR SYSTEMTEKNIK LULEÅ TEKNISKA UNIVERSITET Some color images on this slide Last Lecture 2D filtering frequency domain The magnitude of the 2D DFT gives the amplitudes of the sinusoids and
Fig Color spectrum seen by passing white light through a prism.
 1. Explain about color fundamentals. Color of an object is determined by the nature of the light reflected from it. When a beam of sunlight passes through a glass prism, the emerging beam of light is not
An Introduction to Remote Sensing & GIS. Introduction
 An Introduction to Remote Sensing & GIS Introduction Remote sensing is the measurement of object properties on Earth s surface using data acquired from aircraft and satellites. It attempts to measure something
Image enhancement. Introduction to Photogrammetry and Remote Sensing (SGHG 1473) Dr. Muhammad Zulkarnain Abdul Rahman
 Dr. Muhammad Zulkarnain Abdul Rahman") Image enhancement Introduction to Photogrammetry and Remote Sensing (SGHG 1473) Dr. Muhammad Zulkarnain Abdul Rahman Image enhancement Enhancements are used to make it easier for visual interpretation
Image enhancement Introduction to Photogrammetry and Remote Sensing (SGHG 1473) Dr. Muhammad Zulkarnain Abdul Rahman Image enhancement Enhancements are used to make it easier for visual interpretation
Image and video processing
 Image and video processing Processing Colour Images Dr. Yi-Zhe Song The agenda Introduction to colour image processing Pseudo colour image processing Full-colour image processing basics Transforming colours
GE 113 REMOTE SENSING
 GE 113 REMOTE SENSING Topic 9. Introduction to Global Positioning Systems (GPS) and Other GNSS Technologies Lecturer: Engr. Jojene R. Santillan jrsantillan@carsu.edu.ph Division of Geodetic Engineering
1.Discuss the frequency domain techniques of image enhancement in detail.
 1.Discuss the frequency domain techniques of image enhancement in detail. Enhancement In Frequency Domain: The frequency domain methods of image enhancement are based on convolution theorem. This is represented
4. Measuring Area in Digital Images
 Chapter 4 4. Measuring Area in Digital Images There are three ways to measure the area of objects in digital images using tools in the AnalyzingDigitalImages software: Rectangle tool, Polygon tool, and
ANALYSIS OF IMAGE ENHANCEMENT TECHNIQUES USING MATLAB
 ANALYSIS OF IMAGE ENHANCEMENT TECHNIQUES USING MATLAB Abstract Ms. Jyoti kumari Asst. Professor, Department of Computer Science, Acharya Institute of Graduate Studies, jyothikumari@acharya.ac.in This study
Introduction to image processing for remote sensing: Practical examples
 Università degli studi di Roma Tor Vergata Corso di Telerilevamento e Diagnostica Elettromagnetica Anno accademico 2010/2011 Introduction to image processing for remote sensing: Practical examples Dr.
CS/ECE 545 (Digital Image Processing) Midterm Review
 Midterm Review") CS/ECE 545 (Digital Image Processing) Midterm Review Prof Emmanuel Agu Computer Science Dept. Worcester Polytechnic Institute (WPI) Exam Overview Wednesday, March 5, 2014 in class Will cover up to lecture
CS/ECE 545 (Digital Image Processing) Midterm Review Prof Emmanuel Agu Computer Science Dept. Worcester Polytechnic Institute (WPI) Exam Overview Wednesday, March 5, 2014 in class Will cover up to lecture
Digital Photogrammetry. Presented by: Dr. Hamid Ebadi
 Digital Photogrammetry Presented by: Dr. Hamid Ebadi Background First Generation Analog Photogrammetry Analytical Photogrammetry Digital Photogrammetry Photogrammetric Generations 2000 digital photogrammetry
Lab 3: Image Enhancements I 65 pts Due > Canvas by 10pm
 Geo 448/548 Spring 2016 Lab 3: Image Enhancements I 65 pts Due > Canvas by 3/11 @ 10pm For this lab, you will learn different ways to calculate spectral vegetation indices (SVIs). These are one category
AUTOMATIC DETECTION OF HEDGES AND ORCHARDS USING VERY HIGH SPATIAL RESOLUTION IMAGERY
 AUTOMATIC DETECTION OF HEDGES AND ORCHARDS USING VERY HIGH SPATIAL RESOLUTION IMAGERY Selim Aksoy Department of Computer Engineering, Bilkent University, Bilkent, 06800, Ankara, Turkey saksoy@cs.bilkent.edu.tr
(Refer Slide Time: 1:28)
") Introduction to Remote Sensing Dr. Arun K Saraf Department of Earth Sciences Indian Institute of Technology Roorkee Lecture 10 Image characteristics and different resolutions in Remote Sensing Hello everyone,
Introduction to Remote Sensing Dr. Arun K Saraf Department of Earth Sciences Indian Institute of Technology Roorkee Lecture 10 Image characteristics and different resolutions in Remote Sensing Hello everyone,
Image Enhancement using Histogram Equalization and Spatial Filtering
 Image Enhancement using Histogram Equalization and Spatial Filtering Fari Muhammad Abubakar 1 1 Department of Electronics Engineering Tianjin University of Technology and Education (TUTE) Tianjin, P.R.
Non Linear Image Enhancement
 Non Linear Image Enhancement SAIYAM TAKKAR Jaypee University of information technology, 2013 SIMANDEEP SINGH Jaypee University of information technology, 2013 Abstract An image enhancement algorithm based
An Introduction to Geomatics. Prepared by: Dr. Maher A. El-Hallaq خاص بطلبة مساق مقدمة في علم. Associate Professor of Surveying IUG
 An Introduction to Geomatics خاص بطلبة مساق مقدمة في علم الجيوماتكس Prepared by: Dr. Maher A. El-Hallaq Associate Professor of Surveying IUG 1 Airborne Imagery Dr. Maher A. El-Hallaq Associate Professor
Aim of Lesson. Objectives. Background Information
 Lesson 8: Mapping major inshore marine habitats 8: MAPPING THE MAJOR INSHORE MARINE HABITATS OF THE CAICOS BANK BY MULTISPECTRAL CLASSIFICATION USING LANDSAT TM Aim of Lesson To learn how to undertake
Color and More. Color basics
 Color and More In this lesson, you'll evaluate an image in terms of its overall tonal range (lightness, darkness, and contrast), its overall balance of color, and its overall appearance for areas that
Introduction to TimeSync A Tool For Landsat Time Series Visualization. Warren B Cohen, USDA Forest Service Zhiqiang Yang, Oregon State University
 Introduction to TimeSync A Tool For Landsat Time Series Visualization Warren B Cohen, USDA Forest Service Zhiqiang Yang, Oregon State University TimeSync Introduction Landsat time series visualization
Hyperspectral image processing and analysis
 Hyperspectral image processing and analysis Lecture 12 www.utsa.edu/lrsg/teaching/ees5083/l12-hyper.ppt Multi- vs. Hyper- Hyper-: Narrow bands ( 20 nm in resolution or FWHM) and continuous measurements.
DIGITAL IMAGE PROCESSING (COM-3371) Week 2 - January 14, 2002
 Week 2 - January 14, 2002") DIGITAL IMAGE PROCESSING (COM-3371) Week 2 - January 14, 22 Topics: Human eye Visual phenomena Simple image model Image enhancement Point processes Histogram Lookup tables Contrast compression and stretching
DIGITAL IMAGE PROCESSING (COM-3371) Week 2 - January 14, 22 Topics: Human eye Visual phenomena Simple image model Image enhancement Point processes Histogram Lookup tables Contrast compression and stretching
CHANGE DETECTION BY THE IR-MAD AND KERNEL MAF METHODS IN LANDSAT TM DATA COVERING A SWEDISH FOREST REGION
 CHANGE DETECTION BY THE IR-MAD AND KERNEL MAF METHODS IN LANDSAT TM DATA COVERING A SWEDISH FOREST REGION Allan A. NIELSEN a, Håkan OLSSON b a Technical University of Denmark, National Space Institute
ECE/OPTI533 Digital Image Processing class notes 288 Dr. Robert A. Schowengerdt 2003
 Motivation Large amount of data in images Color video: 200Mb/sec Landsat TM multispectral satellite image: 200MB High potential for compression Redundancy (aka correlation) in images spatial, temporal,
Image Processing : Introduction
 Image Processing : Introduction What is an Image? An image is a picture stored in electronic form. An image map is a file containing information that associates different location on a specified image.
Index of Command Functions
 Index of Command Functions version 2.3 Command description [keyboard shortcut]:description including special instructions. Keyboard short for a Windows PC: the Control key AND the shortcut key. For a MacIntosh:
8th ESA ADVANCED TRAINING COURSE ON LAND REMOTE SENSING
 Urban Mapping Practical Sebastian van der Linden, Akpona Okujeni, Franz Schug Humboldt Universität zu Berlin Instructions for practical Summary The Urban Mapping Practical introduces students to the work
Solution for Image & Video Processing
 Solution for Image & Video Processing December-2015 Index Q.1) a). 2-3 b). 4 (N.A.) c). 4 (N.A.) d). 4 (N.A.) e). 4-5 Q.2) a). 5 to 7 b). 7 (N.A.) Q.3) a). 8-9 b). 9 to 12 Q.4) a). 12-13 b). 13 to 16 Q.5)
Digital Image Processing. Lecture # 4 Image Enhancement (Histogram)
") Digital Image Processing Lecture # 4 Image Enhancement (Histogram) 1 Histogram of a Grayscale Image Let I be a 1-band (grayscale) image. I(r,c) is an 8-bit integer between 0 and 255. Histogram, h I, of
Digital Image Processing Lecture # 4 Image Enhancement (Histogram) 1 Histogram of a Grayscale Image Let I be a 1-band (grayscale) image. I(r,c) is an 8-bit integer between 0 and 255. Histogram, h I, of
Spectral Signatures. Vegetation. 40 Soil. Water WAVELENGTH (microns)
") Spectral Signatures % REFLECTANCE VISIBLE NEAR INFRARED Vegetation Soil Water.5. WAVELENGTH (microns). Spectral Reflectance of Urban Materials 5 Parking Lot 5 (5=5%) Reflectance 5 5 5 5 5 Wavelength (nm)
Spectral Signatures % REFLECTANCE VISIBLE NEAR INFRARED Vegetation Soil Water.5. WAVELENGTH (microns). Spectral Reflectance of Urban Materials 5 Parking Lot 5 (5=5%) Reflectance 5 5 5 5 5 Wavelength (nm)
An Efficient Color Image Segmentation using Edge Detection and Thresholding Methods
 19 An Efficient Color Image Segmentation using Edge Detection and Thresholding Methods T.Arunachalam* Post Graduate Student, P.G. Dept. of Computer Science, Govt Arts College, Melur - 625 106 Email-Arunac682@gmail.com
YIQ color model. Used in United States commercial TV broadcasting (NTSC system).
.") CMY color model Each color is represented by the three secondary colors --- cyan (C), magenta (M), and yellow (Y ). It is mainly used in devices such as color printers that deposit color pigments. It is
CMY color model Each color is represented by the three secondary colors --- cyan (C), magenta (M), and yellow (Y ). It is mainly used in devices such as color printers that deposit color pigments. It is
Digital Image Processing. Lecture # 6 Corner Detection & Color Processing
 Digital Image Processing Lecture # 6 Corner Detection & Color Processing 1 Corners Corners (interest points) Unlike edges, corners (patches of pixels surrounding the corner) do not necessarily correspond
RADIOMETRIC CALIBRATION
 1 RADIOMETRIC CALIBRATION Lecture 10 Digital Image Data 2 Digital data are matrices of digital numbers (DNs) There is one layer (or matrix) for each satellite band Each DN corresponds to one pixel 3 Digital
Image Fusion. Pan Sharpening. Pan Sharpening. Pan Sharpening: ENVI. Multi-spectral and PAN. Magsud Mehdiyev Geoinfomatics Center, AIT
 1 Image Fusion Sensor Merging Magsud Mehdiyev Geoinfomatics Center, AIT Image Fusion is a combination of two or more different images to form a new image by using certain algorithms. ( Pohl et al 1998)
High Dynamic Range (HDR) Photography in Photoshop CS2
 Photography in Photoshop CS2") Page 1 of 7 High dynamic range (HDR) images enable photographers to record a greater range of tonal detail than a given camera could capture in a single photo. This opens up a whole new set of lighting
Page 1 of 7 High dynamic range (HDR) images enable photographers to record a greater range of tonal detail than a given camera could capture in a single photo. This opens up a whole new set of lighting
Satellite image classification
 Satellite image classification EG2234 Earth Observation Image Classification Exercise 29 November & 6 December 2007 Introduction to the practical This practical, which runs over two weeks, is concerned