Wetlands Investigation Utilizing GIS and Remote Sensing Technology for Lucas County, Ohio: a hybrid analysis.
|
|
|
- Roxanne Chandler
- 6 years ago
- Views:
Transcription
1 Wetlands Investigation Utilizing GIS and Remote Sensing Technology for Lucas County, Ohio: a hybrid analysis. Update on current wetlands research in GISAG Nathan Torbick Spring 2003
2 Component One Remote Sensing The ERDAS Imagine Expert Classifier has two main elements; the Knowledge Engineer and the Knowledge Classifier. The Knowledge Engineer provides methodology for users with advanced information and experience to define variables, rules, and classifying interests to design a hierarchical decision tree and knowledge database. The Knowledge Classifier provides methodology to utilize the knowledge database created by the user and Engineer.

3 ERDAS Imagine Knowledge Engineer & Knowledge Classifier Previous attempts at classifying wetland types provides confirmed accurate training sites that can be utilized. Using the inquirer cursor function and signatures editor precise pixel values and signatures can be extracted for an AOI. With the hierarchical decision tree a hypothesis can be created with rules defining variables. The Knowledge Engineer feature allows the user to define nearly every aspect of the image. Hypothesis Rules Variables

4 2km coastal zone buffer
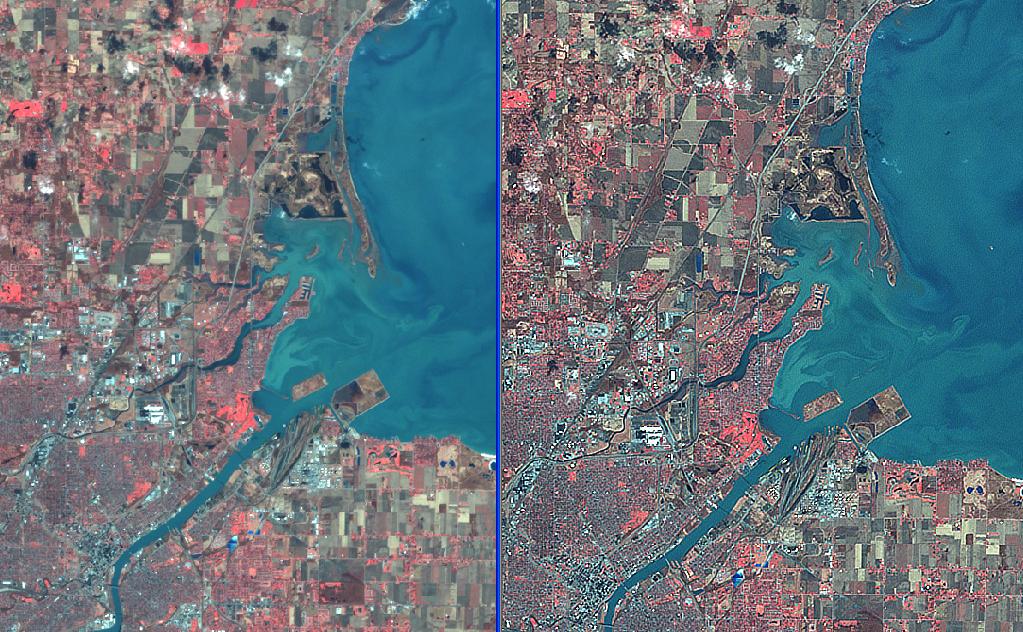
5 Radiometirc Enhancement Atmospheric Haze Reduction For multi-spectral images, this method is based on the Tasseled Cap transformation which yields a component that correlates with haze. This component is removed and the image is transformed back into RGB space. For panchromatic images, an inverse point spread convolution is used.

6 Histograms of Landsat 7 ETM reflectance responses. Left graph displays single image. Right graph displays spectral response of a multitemporal stacked image with an applied tasselcapped based algorithm for atmospheric haze enhancement.
7

8 Pixel value/histogram examination

9 Knowledge database output over Landsat image

10 Knowledge database output over Lucas aerial photo. Coastal Green = Wet Forest Yellow = Wet Prairie

11 Example of classified Landsat 7 ETM+ output from ERDAS. Ottawa Park off Brancroft St. across from UT. Blue = Wet Forest Red = Wet Prairie
12 Component Two. GIS
13 Soils DEM Drift thickness Bedrock/Geology Slope Layered LayeredMa p Map Matrix Matrix Landsat ETM classification Floodplains Water Table Hydrology Ground Water Wetlands Fig. 1. Conceptual framework for wetlands cartographic model.
14 Data Collection Flood data was complied from Ohio Department of Natural Resources. The flood data layer is a combination of the 100 & 500 year floodplains and flood hazard areas in Lucas County. The ODNR GIS also provided soils data.

15 Some wetland characteristics and parameters required large amounts of time and analysis for collection and processing. Water table depth, drift depth, and bedrock geology data was acquired from published hydrogeology reports. Maps required scanning into digital format, georeferencing, and digitizing.

16 Watershed Drainage Network. Channel networks with arbitrary drainage or resolution can be extracted from digital elevation data (Tarboton 1991). This method is based on elevation gradients, flow accumulation, and drainage networks. Using Arc/INFO a flow-order-accumulation network can be designed. This takes substantial experimenting to capture the desired results (1.53km 2).

17 GPS integration. Wet Prairie near Kitty Todd reserve.
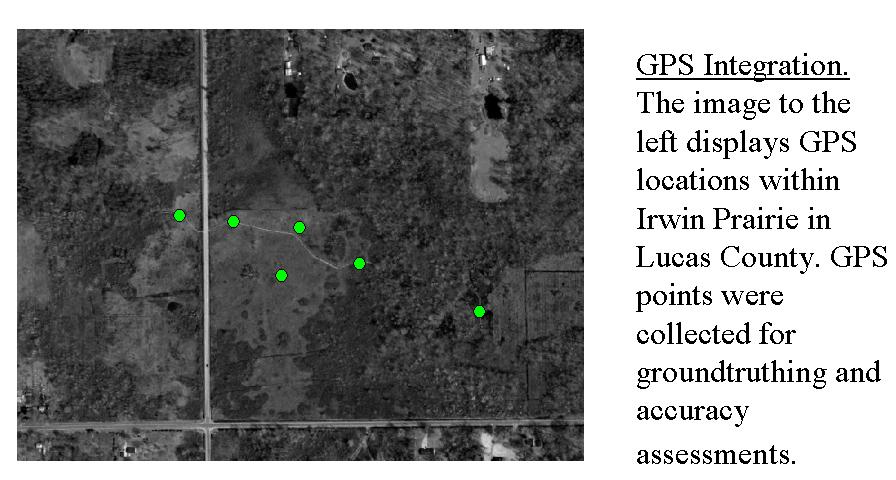
18 GPS Integration.
19 Soils DEM Drift thickness Bedrock/Geology Slope Layered LayeredMa p Map Matrix Matrix Landsat ETM classification Floodplains Water Table Hydrology Ground Water Wetlands Fig. 1. Conceptual framework for wetlands cartographic model.
20 Model Simulation and Analysis. A rating system has been/is being developed and tested for each model parameter. Within each coverage, value fields have been added to attribute tables and reclassified for model input. The amount of weight, percentage of input, and strength of variable for input to the model can be manipulated for desired results. This is the main human interaction/element in the project. Different scenarios with changes in parameter strength and methods can be run outputting different end results ranging from regression analysis to constraint mapping to weighted variables.
21 Scenario One. Percentage of Input - Strength Scenario One Output Table
22 q Theory: Higher values reflect wetland characteristics Matrix output for wetland model.

23 Future Directions CAUV & Additional season scenes Ground truthing/accuracy Assessment Summer REU Accessibility of Data Visual Basic Code of model manipulation and parameter adjustments
The techniques with ERDAS IMAGINE include:
 The techniques with ERDAS IMAGINE include: 1. Data correction - radiometric and geometric correction 2. Radiometric enhancement - enhancing images based on the values of individual pixels 3. Spatial enhancement
In late April of 1986 a nuclear accident damaged a reactor at the Chernobyl nuclear
 CHERNOBYL NUCLEAR POWER PLANT ACCIDENT Long Term Effects on Land Use Patterns Project Introduction: In late April of 1986 a nuclear accident damaged a reactor at the Chernobyl nuclear power plant in Ukraine.
This week we will work with your Landsat images and classify them using supervised classification.
 GEPL 4500/5500 Lab 4: Supervised Classification: Part I: Selecting Training Sets Due: 4/6/04 This week we will work with your Landsat images and classify them using supervised classification. There are
Keywords: Agriculture, Olive Trees, Supervised Classification, Landsat TM, QuickBird, Remote Sensing.
 Classification of agricultural fields by using Landsat TM and QuickBird sensors. The case study of olive trees in Lesvos island. Christos Vasilakos, University of the Aegean, Department of Environmental
Spatial Analyst is an extension in ArcGIS specially designed for working with raster data.
 Spatial Analyst is an extension in ArcGIS specially designed for working with raster data. 1 Do you remember the difference between vector and raster data in GIS? 2 In Lesson 2 you learned about the difference
Preparing Remote Sensing Data for Natural Resources Mapping (image enhancement, rectifications )
") Preparing Remote Sensing Data for Natural Resources Mapping (image enhancement, rectifications ) Why is this important What are the major approaches Examples of digital image enhancement Follow up exercises
Preparing Remote Sensing Data for Natural Resources Mapping (image enhancement, rectifications ) Why is this important What are the major approaches Examples of digital image enhancement Follow up exercises
ANNEX IV ERDAS IMAGINE OPERATION MANUAL
 ANNEX IV ERDAS IMAGINE OPERATION MANUAL Table of Contents 1. TOPIC 1 DATA IMPORT...1 1.1. Importing SPOT DATA directly from CDROM... 1 1.2. Importing SPOT (Panchromatic) using GENERIC BINARY... 7 1.3.
Basic Digital Image Processing. The Structure of Digital Images. An Overview of Image Processing. Image Restoration: Line Drop-outs
 Basic Digital Image Processing A Basic Introduction to Digital Image Processing ~~~~~~~~~~ Rev. Ronald J. Wasowski, C.S.C. Associate Professor of Environmental Science University of Portland Portland,
Module 11 Digital image processing
 Introduction Geo-Information Science Practical Manual Module 11 Digital image processing 11. INTRODUCTION 11-1 START THE PROGRAM ERDAS IMAGINE 11-2 PART 1: DISPLAYING AN IMAGE DATA FILE 11-3 Display of
COMPARISON OF INFORMATION CONTENTS OF HIGH RESOLUTION SPACE IMAGES
 COMPARISON OF INFORMATION CONTENTS OF HIGH RESOLUTION SPACE IMAGES H. Topan*, G. Büyüksalih*, K. Jacobsen ** * Karaelmas University Zonguldak, Turkey ** University of Hannover, Germany htopan@karaelmas.edu.tr,
APCAS/10/21 April 2010 ASIA AND PACIFIC COMMISSION ON AGRICULTURAL STATISTICS TWENTY-THIRD SESSION. Siem Reap, Cambodia, April 2010
 APCAS/10/21 April 2010 Agenda Item 8 ASIA AND PACIFIC COMMISSION ON AGRICULTURAL STATISTICS TWENTY-THIRD SESSION Siem Reap, Cambodia, 26-30 April 2010 The Use of Remote Sensing for Area Estimation by Robert
Irina SMIRNOVA, Alexandra RUSANOVA
 Irina SMIRNOVA, Alexandra RUSANOVA Monitoring of Landscape Changes Due to Petroleum Fields Exploitation, Construction of Oil Pipelines and Oil Terminal in the Northern Part of the Timan-Pechorian Petroleum
Remote sensing in archaeology from optical to lidar. Krištof Oštir ModeLTER Scientific Research Centre of the Slovenian Academy of Sciences and Arts
 Remote sensing in archaeology from optical to lidar Krištof Oštir ModeLTER Scientific Research Centre of the Slovenian Academy of Sciences and Arts Introduction Optical remote sensing Systems Search for
The effects of uncertainty in forest inventory plot locations. Ronald E. McRoberts, Geoffrey R. Holden, and Greg C. Liknes
 The effects of uncertainty in forest inventory plot locations Ronald E. McRoberts, Geoffrey R. Holden, and Greg C. Liknes North Central Research Station, USDA Forest Service, Saint Paul, Minnesota 55108
Managing and Monitoring Intertidal Oyster Reefs with Remote Sensing in Coastal South Carolina
 Managing and Monitoring Intertidal Oyster Reefs with Remote Sensing in Coastal South Carolina A cooperative effort between: Coastal Services Center South Carolina Department of Natural Resources City of
CLASSIFICATION OF HISTORIC LAKES AND WETLANDS
 CLASSIFICATION OF HISTORIC LAKES AND WETLANDS Golden Valley, Minnesota Image Analysis Heather Hegi & Kerry Ritterbusch 12/13/2010 Bassett Creek and Theodore Wirth Golf Course, 1947 FR 5262 Remote Sensing
REMOTE SENSING FOR FLOOD HAZARD STUDIES.
 REMOTE SENSING FOR FLOOD HAZARD STUDIES. OPTICAL SENSORS. 1 DRS. NANETTE C. KINGMA 1 Optical Remote Sensing for flood hazard studies. 2 2 Floods & use of remote sensing. Floods often leaves its imprint
Documenting Land Cover and Vegetation Productivity Changes in the NWT using the Landsat Satellite Archive
 Documenting Land Cover and Vegetation Productivity Changes in the NWT using the Landsat Satellite Archive Fraser, R.H 1, Olthof, I. 1, Deschamps, A. 1, Pregitzer, M. 1, Kokelj, S. 2, Lantz, T. 3,Wolfe,
Digital Image Processing
 Digital Image Processing 1 Patrick Olomoshola, 2 Taiwo Samuel Afolayan 1,2 Surveying & Geoinformatic Department, Faculty of Environmental Sciences, Rufus Giwa Polytechnic, Owo. Nigeria Abstract: This paper
Application of Satellite Image Processing to Earth Resistivity Map
 Application of Satellite Image Processing to Earth Resistivity Map KWANCHAI NORSANGSRI and THANATCHAI KULWORAWANICHPONG Power System Research Unit School of Electrical Engineering Suranaree University
Land Cover Type Changes Related to. Oil and Natural Gas Drill Sites in a. Selected Area of Williams County, ND
 Land Cover Type Changes Related to Oil and Natural Gas Drill Sites in a Selected Area of Williams County, ND FR 3262/5262 Lab Section 2 By: Andrew Kernan Tyler Kaebisch Introduction: In recent years, there
TEMPORAL ANALYSIS OF MULTI EPOCH LANDSAT GEOCOVER IMAGES IN ZONGULDAK TESTFIELD
 TEMPORAL ANALYSIS OF MULTI EPOCH LANDSAT GEOCOVER IMAGES IN ZONGULDAK TESTFIELD Şahin, H. a*, Oruç, M. a, Büyüksalih, G. a a Zonguldak Karaelmas University, Zonguldak, Turkey - (sahin@karaelmas.edu.tr,
A map says to you, 'Read me carefully, follow me closely, doubt me not.' It says, 'I am the Earth in the palm of your hand. Without me, you are alone
 A map says to you, 'Read me carefully, follow me closely, doubt me not.' It says, 'I am the Earth in the palm of your hand. Without me, you are alone and lost. Beryl Markham (West With the Night, 1946
Image transformations
 Image transformations Digital Numbers may be composed of three elements: Atmospheric interference (e.g. haze) ATCOR Illumination (angle of reflection) - transforms Albedo (surface cover) Image transformations
REMOTE SENSING. Topic 10 Fundamentals of Digital Multispectral Remote Sensing MULTISPECTRAL SCANNERS MULTISPECTRAL SCANNERS
 REMOTE SENSING Topic 10 Fundamentals of Digital Multispectral Remote Sensing Chapter 5: Lillesand and Keifer Chapter 6: Avery and Berlin MULTISPECTRAL SCANNERS Record EMR in a number of discrete portions
REMOTE SENSING INTERPRETATION
 REMOTE SENSING INTERPRETATION Jan Clevers Centre for Geo-Information - WU Remote Sensing --> RS Sensor at a distance EARTH OBSERVATION EM energy Earth RS is a tool; one of the sources of information! 1
An Introduction to Remote Sensing & GIS. Introduction
 An Introduction to Remote Sensing & GIS Introduction Remote sensing is the measurement of object properties on Earth s surface using data acquired from aircraft and satellites. It attempts to measure something
F2 - Fire 2 module: Remote Sensing Data Classification
 F2 - Fire 2 module: Remote Sensing Data Classification F2.1 Task_1: Supervised and Unsupervised classification examples of a Landsat 5 TM image from the Center of Portugal, year 2005 F2.1 Task_2: Burnt
CanImage. (Landsat 7 Orthoimages at the 1: Scale) Standards and Specifications Edition 1.0
 Standards and Specifications Edition 1.0") CanImage (Landsat 7 Orthoimages at the 1:50 000 Scale) Standards and Specifications Edition 1.0 Centre for Topographic Information Customer Support Group 2144 King Street West, Suite 010 Sherbrooke, QC
CanImage (Landsat 7 Orthoimages at the 1:50 000 Scale) Standards and Specifications Edition 1.0 Centre for Topographic Information Customer Support Group 2144 King Street West, Suite 010 Sherbrooke, QC
INTERNATIONAL JOURNAL OF ENVIRONMENTAL SCIENCES Volume 6, No 5, Copyright by the authors - Licensee IPA- Under Creative Commons license 3.
 INTERNATIONAL JOURNAL OF ENVIRONMENTAL SCIENCES Volume 6, No 5, 2016 Copyright by the authors - Licensee IPA- Under Creative Commons license 3.0 Research article ISSN 0976 4402 Normalised difference water
MULTI-TEMPORAL IMAGE ANALYSIS OF THE COASTAL WATERSHED, NH INTRODUCTION
 MULTI-TEMPORAL IMAGE ANALYSIS OF THE COASTAL WATERSHED, NH Meghan Graham MacLean, PhD Student Alexis M. Rudko, MS Student Dr. Russell G. Congalton, Professor Department of Natural Resources and the Environment
GE 113 REMOTE SENSING
 GE 113 REMOTE SENSING Topic 8. Image Classification and Accuracy Assessment Lecturer: Engr. Jojene R. Santillan jrsantillan@carsu.edu.ph Division of Geodetic Engineering College of Engineering and Information
Seasonal Progression of the Normalized Difference Vegetation Index (NDVI)
") Seasonal Progression of the Normalized Difference Vegetation Index (NDVI) For this exercise you will be using a series of six SPOT 4 images to look at the phenological cycle of a crop. The images are SPOT
Seasonal Progression of the Normalized Difference Vegetation Index (NDVI) For this exercise you will be using a series of six SPOT 4 images to look at the phenological cycle of a crop. The images are SPOT
Example of Analysis of Yield or Landsat Data Based on Assessing the Consistently Lowest 20 Percent by Using
 GIS Ag Maps www.gisagmaps.com Example of Analysis of Yield or Landsat Data Based on Assessing the Consistently Lowest 20 Percent by Using Soil Darkness, Flow Accumulation, Convex Areas, and Sinks Two aspects
Forest Resources Assessment using Synthe c Aperture Radar
 Forest Resources Assessment using Synthe c Aperture Radar Project Background F RA-SAR 2010 was initiated to support the Forest Resources Assessment (FRA) of the United Nations Food and Agriculture Organization
LIFE ENVIRONMENT STRYMON
 LIFE ENVIRONMENT STRYMON Ecosystem Based Water Resources Management to Minimize Environmental Impacts from Agriculture Using State of the Art Modeling Tools in Strymonas Basin LIFE03 ENV/GR/000217 Task
2007 Land-cover Classification and Accuracy Assessment of the Greater Puget Sound Region
 2007 Land-cover Classification and Accuracy Assessment of the Greater Puget Sound Region Urban Ecology Research Laboratory Department of Urban Design and Planning University of Washington May 2009 1 1.
NRS 415 Remote Sensing of Environment
 NRS 415 Remote Sensing of Environment 1 High Oblique Perspective (Side) Low Oblique Perspective (Relief) 2 Aerial Perspective (See What s Hidden) An example of high spatial resolution true color remote
Introduction of Satellite Remote Sensing
 Introduction of Satellite Remote Sensing Spatial Resolution (Pixel size) Spectral Resolution (Bands) Resolutions of Remote Sensing 1. Spatial (what area and how detailed) 2. Spectral (what colors bands)
Present and future of marine production in Boka Kotorska
 Present and future of marine production in Boka Kotorska First results from satellite remote sensing for the breeding areas of filter feeders in the Bay of Kotor INTRODUCTION Environmental monitoring is
Enhancement of Multispectral Images and Vegetation Indices
 Enhancement of Multispectral Images and Vegetation Indices ERDAS Imagine 2016 Description: We will use ERDAS Imagine with multispectral images to learn how an image can be enhanced for better interpretation.
Land Cover Analysis to Determine Areas of Clear-cut and Forest Cover in Olney, Montana. Geob 373 Remote Sensing. Dr Andreas Varhola, Kathry De Rego
 1 Land Cover Analysis to Determine Areas of Clear-cut and Forest Cover in Olney, Montana Geob 373 Remote Sensing Dr Andreas Varhola, Kathry De Rego Zhu an Lim (14292149) L2B 17 Apr 2016 2 Abstract Montana
DIFFERENTIAL APPROACH FOR MAP REVISION FROM NEW MULTI-RESOLUTION SATELLITE IMAGERY AND EXISTING TOPOGRAPHIC DATA
 DIFFERENTIAL APPROACH FOR MAP REVISION FROM NEW MULTI-RESOLUTION SATELLITE IMAGERY AND EXISTING TOPOGRAPHIC DATA Costas ARMENAKIS Centre for Topographic Information - Geomatics Canada 615 Booth Str., Ottawa,
Lecture 13: Remotely Sensed Geospatial Data
 Lecture 13: Remotely Sensed Geospatial Data A. The Electromagnetic Spectrum: The electromagnetic spectrum (Figure 1) indicates the different forms of radiation (or simply stated light) emitted by nature.
Ghazanfar A. Khattak National Centre of Excellence in Geology University of Peshawar
 INTRODUCTION TO REMOTE SENSING Ghazanfar A. Khattak National Centre of Excellence in Geology University of Peshawar WHAT IS REMOTE SENSING? Remote sensing is the science of acquiring information about
Image Band Transformations
 Image Band Transformations Content Band math Band ratios Vegetation Index Tasseled Cap Transform Principal Component Analysis (PCA) Decorrelation Stretch Image Band Transformation Purposes Image band transforms
Remote Sensing And Gis Application in Image Classification And Identification Analysis.
 Quest Journals Journal of Research in Environmental and Earth Science Volume 3~ Issue 5 (2017) pp: 55-66 ISSN(Online) : 2348-2532 www.questjournals.org Research Paper Remote Sensing And Gis Application
What is Remote Sensing? Contents. Image Fusion in Remote Sensing. 1. Optical imagery in remote sensing. Electromagnetic Spectrum
 Contents Image Fusion in Remote Sensing Optical imagery in remote sensing Image fusion in remote sensing New development on image fusion Linhai Jing Applications Feb. 17, 2011 2 1. Optical imagery in remote
Monitoring of mine tailings using satellite and lidar data
 Surveying Monitoring of mine tailings using satellite and lidar data by Prevlan Chetty, Southern Mapping Geospatial This study looks into the use of high resolution satellite imagery from RapidEye and
Land Cover Change in Saipan, CNMI from 1978 to 2009
 International Journal of Environment and Resource Volume 5, 2016 doi: 10.14355/ijer.2016.05.002 www.ij-er.org Land Cover Change in Saipan, CNMI from 1978 to 2009 Yuming Wen *1, Derek Chambers 2 1 Water
VALIDATION OF THE CLOUD AND CLOUD SHADOW ASSESSMENT SYSTEM FOR LANDSAT IMAGERY (CASA-L VERSION 1.3)
") GDA Corp. VALIDATION OF THE CLOUD AND CLOUD SHADOW ASSESSMENT SYSTEM FOR LANDSAT IMAGERY (-L VERSION 1.3) GDA Corp. has developed an innovative system for Cloud And cloud Shadow Assessment () in Landsat
GDA Corp. VALIDATION OF THE CLOUD AND CLOUD SHADOW ASSESSMENT SYSTEM FOR LANDSAT IMAGERY (-L VERSION 1.3) GDA Corp. has developed an innovative system for Cloud And cloud Shadow Assessment () in Landsat
Chapter 8. Using the GLM
 Chapter 8 Using the GLM This chapter presents the type of change products that can be derived from a GLM enhanced change detection procedure. One advantage to GLMs is that they model the probability of
EXPLORING THE POTENTIAL FOR A FUSED LANDSAT-MODIS SNOW COVERED AREA PRODUCT. David Selkowitz 1 ABSTRACT INTRODUCTION
 EXPLORING THE POTENTIAL FOR A FUSED LANDSAT-MODIS SNOW COVERED AREA PRODUCT David Selkowitz 1 ABSTRACT Results from nine 3 x 3 km study areas in the Rocky Mountains of Colorado, USA demonstrate there is
A Project to Map and Monitor Baldcypress Forests in Coastal Louisiana, using Landsat, MODIS, and ASTER Satellite Data
 A Project to Map and Monitor Baldcypress Forests in Coastal Louisiana, using Landsat, MODIS, and ASTER Satellite Data Presented to the 2012 Louisiana RS/GIS Workshop by: Joseph Spruce, Computer Sciences
Field size estimation, past and future opportunities
 Field size estimation, past and future opportunities Lin Yan & David Roy Geospatial Sciences Center of Excellence South Dakota State University February 13-15 th 2018 Advances in Emerging Technologies
INTEGRATION OF MULTITEMPORAL ERS SAR AND LANDSAT TM DATA FOR SOIL MOISTURE ASSESSMENT
 INTEGRATION OF MULTITEMPORAL ERS SAR AND LANDSAT TM DATA FOR SOIL MOISTURE ASSESSMENT Beata HEJMANOWSKA, Stanisław MULARZ University of Mining and Metallurgy, Krakow, Poland Department of Photogrammetry
ERDAS IMAGINE Suite Comparison
 ERDAS Suite Comparison A brief comparison of Essentials, Advantage and Professional age 1 of 7 Overview This document provides a brief comparison of the main features and capabilities found within the
Urban Classification of Metro Manila for Seismic Risk Assessment using Satellite Images
 Urban Classification of Metro Manila for Seismic Risk Assessment using Satellite Images Fumio YAMAZAKI/ yamazaki@edm.bosai.go.jp Hajime MITOMI/ mitomi@edm.bosai.go.jp Yalkun YUSUF/ yalkun@edm.bosai.go.jp
DEM GENERATION WITH WORLDVIEW-2 IMAGES
 DEM GENERATION WITH WORLDVIEW-2 IMAGES G. Büyüksalih a, I. Baz a, M. Alkan b, K. Jacobsen c a BIMTAS, Istanbul, Turkey - (gbuyuksalih, ibaz-imp)@yahoo.com b Zonguldak Karaelmas University, Zonguldak, Turkey
MULTISPECTRAL CHANGE DETECTION AND INTERPRETATION USING SELECTIVE PRINCIPAL COMPONENTS AND THE TASSELED CAP TRANSFORMATION
 MULTSPECTRAL CHANGE DETECTON AND NTERPRETATON USNG SELECTVE PRNCPAL COMPONENTS AND THE TASSELED CAP TRANSFORMATON Abstract Temporal change is typically observed in all six reflective LANDSAT bands. The
Chapter 1. Introduction
 Chapter 1 Introduction One of the major achievements of mankind is to record the data of what we observe in the form of photography which is dated to 1826. Man has always tried to reach greater heights
VALIDATION OF A SEMI-AUTOMATED CLASSIFICATION APPROACH FOR URBAN GREEN STRUCTURE
 VALIDATION OF A SEMI-AUTOMATED CLASSIFICATION APPROACH FOR URBAN GREEN STRUCTURE Øivind Due Trier a, * and Einar Lieng b a Norwegian Computing Center, Gaustadalléen 23, P.O. Box 114 Blindern, NO-0314 Oslo,
Remote Sensing. Odyssey 7 Jun 2012 Benjamin Post
 Remote Sensing Odyssey 7 Jun 2012 Benjamin Post Definitions Applications Physics Image Processing Classifiers Ancillary Data Data Sources Related Concepts Outline Big Picture Definitions Remote Sensing
Study Guide: Remote Sensing / GIS Exam #2 Fall 2015 Semester. A Basic Introduction to Thermal Infrared Imaging
 Study Guide: Remote Sensing / GIS Exam #2 Fall 2015 Semester A Basic Introduction to Thermal Infrared Imaging Thermal infrared is the only common radiated (rather than reflected) remote sensing system
Malaria Vector in Northeastern Venezuela. Sarah Anne Guagliardo MPH candidate, 2010 Yale University School of Epidemiology and Public Health
 Vegetation associated with the An. Aquasalis Malaria Vector in Northeastern Venezuela Sarah Anne Guagliardo g MPH candidate, 2010 Yale University School of Epidemiology and Public Health Outline Problem
Activity Data (AD) Monitoring in the frame of REDD+ MRV
 Monitoring in the frame of REDD+ MRV") Activity Data (AD) Monitoring in the frame of REDD+ MRV Preliminary comments REDD+ is sustainable low emissions, high carbon rural development Monitoring efforts should support this effort Challenges Diversity
Activity Data (AD) Monitoring in the frame of REDD+ MRV Preliminary comments REDD+ is sustainable low emissions, high carbon rural development Monitoring efforts should support this effort Challenges Diversity
Removing Thick Clouds in Landsat Images
 Removing Thick Clouds in Landsat Images S. Brindha, S. Archana, V. Divya, S. Manoshruthy & R. Priya Dept. of Electronics and Communication Engineering, Avinashilingam Institute for Home Science and Higher
Mapping Open Water Bodies with Optical Remote Sensing
 Mapping Open Water Bodies with Optical Remote Sensing M. O Donnell 1,2 and E. Podest 1 1.Jet Propulsion Laboratory, California Institute of Technology 2 Alliance Gertz-Ressler High School, Los Angeles,
RGB colours: Display onscreen = RGB
 RGB colours: http://www.colorspire.com/rgb-color-wheel/ Display onscreen = RGB DIGITAL DATA and DISPLAY Myth: Most satellite images are not photos Photographs are also 'images', but digital images are
GEOG432: Remote sensing Lab 3 Unsupervised classification
 GEOG432: Remote sensing Lab 3 Unsupervised classification Goal: This lab involves identifying land cover types by using agorithms to identify pixels with similar Digital Numbers (DN) and spectral signatures
PROGRESS REPORT MAPPING THE RIPARIAN VEGETATION USING MULTIPLE HYPERSPECTRAL AIRBORNE IMAGERY OVER THE REPUBLICAN RIVER, NEBRASKA
 PROGRESS REPORT MAPPING THE RIPARIAN VEGETATION USING MULTIPLE HYPERSPECTRAL AIRBORNE IMAGERY OVER THE REPUBLICAN RIVER, NEBRASKA PROJECT SUMMARY By Dr. Ayse Irmak and Dr. Sami Akasheh As the dependency
Land cover change methods. Ned Horning
 Land cover change methods Ned Horning Version: 1.0 Creation Date: 2004-01-01 Revision Date: 2004-01-01 License: This document is licensed under a Creative Commons Attribution-Share Alike 3.0 Unported License.
Remote Sensing for Rangeland Applications
 Remote Sensing for Rangeland Applications Jay Angerer Ecological Training June 16, 2012 Remote Sensing The term "remote sensing," first used in the United States in the 1950s by Ms. Evelyn Pruitt of the
Application of GIS to Fast Track Planning and Monitoring of Development Agenda
 Application of GIS to Fast Track Planning and Monitoring of Development Agenda Radiometric, Atmospheric & Geometric Preprocessing of Optical Remote Sensing 13 17 June 2018 Outline 1. Why pre-process remotely
SUGAR_GIS. From a user perspective. Provides spatial distribution of a wide range of sugarcane production data in an easy to use and sensitive way.
 SUGAR_GIS From a user perspective What is Sugar_GIS? A web-based, decision support tool. Provides spatial distribution of a wide range of sugarcane production data in an easy to use and sensitive way.
Caatinga - Appendix. Collection 3. Version 1. General coordinator Washington J. S. Franca Rocha (UEFS)
") Caatinga - Appendix Collection 3 Version 1 General coordinator Washington J. S. Franca Rocha (UEFS) Team Diego Pereira Costa (UEFS/GEODATIN) Frans Pareyn (APNE) José Luiz Vieira (APNE) Rodrigo N. Vasconcelos
Caatinga - Appendix Collection 3 Version 1 General coordinator Washington J. S. Franca Rocha (UEFS) Team Diego Pereira Costa (UEFS/GEODATIN) Frans Pareyn (APNE) José Luiz Vieira (APNE) Rodrigo N. Vasconcelos
Digitization of Trail Network Using Remotely-Sensed Data in the CFB Suffield National Wildlife Area
 Digitization of Trail Network Using Remotely-Sensed Data in the CFB Suffield National Wildlife Area Brent Smith DLE 5-5 and Mike Tulis G3 GIS Technician Department of National Defence 27 March 2007 Introduction
Figure 3: Map showing the extension of the six surveyed areas in Indonesia analysed in this study.
 5 2. METHODOLOGY The present study consisted of two phases. First a test study was conducted to evaluate whether Landsat 7 images could be used to identify the habitat of humphead wrasse in Indonesia.
INTEGRATED DEM AND PAN-SHARPENED SPOT-4 IMAGE IN URBAN STUDIES
 INTEGRATED DEM AND PAN-SHARPENED SPOT-4 IMAGE IN URBAN STUDIES G. Doxani, A. Stamou Dept. Cadastre, Photogrammetry and Cartography, Aristotle University of Thessaloniki, GREECE gdoxani@hotmail.com, katerinoudi@hotmail.com
Multi-temporal Analysis of Landsat Data to Determine Forest Age Classes for the Mississippi Statewide Forest Inventory Preliminary Results
 Multi-temporal Analysis of Landsat Data to Determine Forest Age Classes for the Mississippi Statewide Forest Inventory Preliminary Results Curtis A. Collins, David W. Wilkinson, and David L. Evans Forest
Image Registration Issues for Change Detection Studies
 Image Registration Issues for Change Detection Studies Steven A. Israel Roger A. Carman University of Otago Department of Surveying PO Box 56 Dunedin New Zealand israel@spheroid.otago.ac.nz Michael R.
Lesson 3: Working with Landsat Data
 Lesson 3: Working with Landsat Data Lesson Description The Landsat Program is the longest-running and most extensive collection of satellite imagery for Earth. These datasets are global in scale, continuously
At-Satellite Reflectance: A First Order Normalization Of Landsat 7 ETM+ Images
 University of Nebraska - Lincoln DigitalCommons@University of Nebraska - Lincoln Publications of the US Geological Survey US Geological Survey 21 At-Satellite Reflectance: A First Order Normalization Of
MULTIRESOLUTION SPOT-5 DATA FOR BOREAL FOREST MONITORING
 MULTIRESOLUTION SPOT-5 DATA FOR BOREAL FOREST MONITORING M. G. Rosengren, E. Willén Metria Miljöanalys, P.O. Box 24154, SE-104 51 Stockholm, Sweden - (mats.rosengren, erik.willen)@lm.se KEY WORDS: Remote
Automated GIS data collection and update
 Walter 267 Automated GIS data collection and update VOLKER WALTER, S tuttgart ABSTRACT This paper examines data from different sensors regarding their potential for an automatic change detection approach.
THE HYDROLOGIC IMPACT OF THE VERMONT INTERSTATE HIGHWAY SYSTEM. A Thesis Progress Report. Analeisha Vang. The Faculty of the Geology Department
 THE HYDROLOGIC IMPACT OF THE VERMONT INTERSTATE HIGHWAY SYSTEM A Thesis Progress Report by Analeisha Vang to The Faculty of the Geology Department of The University of Vermont November 2012 Accepted by
High Resolution Satellite Data for Forest Management. - Algorithm for Tree Counting -
 High Resolution Satellite Data for Forest Management - Algorithm for Tree Counting - Kiyoshi HONDA ACRoRS, Asian Institute of Technology NASDA ALOS (NASDA JAPAN) 2.5m Resolution Launch in 2002 Panchromatic
Geo/SAT 2 MAP MAKING IN THE INFORMATION AGE
 Geo/SAT 2 MAP MAKING IN THE INFORMATION AGE Professor Paul R. Baumann Department of Geography State University of New York College at Oneonta Oneonta, New York 13820 USA COPYRIGHT 2008 Paul R. Baumann
ILLUMINATION CORRECTION OF LANDSAT TM DATA IN SOUTH EAST NSW
 ILLUMINATION CORRECTION OF LANDSAT TM DATA IN SOUTH EAST NSW Elizabeth Roslyn McDonald 1, Xiaoliang Wu 2, Peter Caccetta 2 and Norm Campbell 2 1 Environmental Resources Information Network (ERIN), Department
Monitoring of Mosul Reservoir Using Remote Sensing Techniques For the Period After ISIS Attack in 9 June Muthanna Mohammed Abdulhameed AL Bayati
 For the Period After ISIS Attack in 9 June 2014 Lecture: University of Technology Baghdad- Building and Construction Dept 1- Introduction The Mosul Dam is the fourth largest dam in the Middle East,(1)established
Mod. 2 p. 1. Prof. Dr. Christoph Kleinn Institut für Waldinventur und Waldwachstum Arbeitsbereich Fernerkundung und Waldinventur
 Histograms of gray values for TM bands 1-7 for the example image - Band 4 and 5 show more differentiation than the others (contrast=the ratio of brightest to darkest areas of a landscape). - Judging from
LAND USE MAP PRODUCTION BY FUSION OF MULTISPECTRAL CLASSIFICATION OF LANDSAT IMAGES AND TEXTURE ANALYSIS OF HIGH RESOLUTION IMAGES
 LAND USE MAP PRODUCTION BY FUSION OF MULTISPECTRAL CLASSIFICATION OF LANDSAT IMAGES AND TEXTURE ANALYSIS OF HIGH RESOLUTION IMAGES Xavier OTAZU, Roman ARBIOL Institut Cartogràfic de Catalunya, Spain xotazu@icc.es,
Detecting Land Cover Changes by extracting features and using SVM supervised classification
 Detecting Land Cover Changes by extracting features and using SVM supervised classification ABSTRACT Mohammad Mahdi Mohebali MSc (RS & GIS) Shahid Beheshti Student mo.mohebali@gmail.com Ali Akbar Matkan,
Statistical Analysis of SPOT HRV/PA Data
 Statistical Analysis of SPOT HRV/PA Data Masatoshi MORl and Keinosuke GOTOR t Department of Management Engineering, Kinki University, Iizuka 82, Japan t Department of Civil Engineering, Nagasaki University,
Sommersemester Prof. Dr. Christoph Kleinn Institut für Waldinventur und Waldwachstum Arbeitsbereich Fernerkundung und Waldinventur.
 Basics of Remote Sensing Some literature references Franklin, SE 2001 Remote Sensing for Sustainable Forest Management Lewis Publishers 407p Lillesand, Kiefer 2000 Remote Sensing and Image Interpretation
GENERAL DEVELOPMENT APPLICATIONS. General Submission Requirements
 COMPLETE APPLICATION CHECKLIST Jan 2016 The following checklist has been compiled to assist the applicant in preparing their application for approval pursuant to Ontario Regulation 162/06. This checklist
GEOG432: Remote sensing Lab 3 Unsupervised classification
 GEOG432: Remote sensing Lab 3 Unsupervised classification Goal: This lab involves identifying land cover types by using agorithms to identify pixels with similar Digital Numbers (DN) and spectral signatures
Leica ADS80 - Digital Airborne Imaging Solution NAIP, Salt Lake City 4 December 2008
 Luzern, Switzerland, acquired at 5 cm GSD, 2008. Leica ADS80 - Digital Airborne Imaging Solution NAIP, Salt Lake City 4 December 2008 Shawn Slade, Doug Flint and Ruedi Wagner Leica Geosystems AG, Airborne
GEO/EVS 425/525 Unit 9 Aerial Photograph and Satellite Image Rectification
 GEO/EVS 425/525 Unit 9 Aerial Photograph and Satellite Image Rectification You have seen satellite imagery earlier in this course, and you have been looking at aerial photography for several years. You
CLASSIFICATION OF VEGETATION AREA FROM SATELLITE IMAGES USING IMAGE PROCESSING TECHNIQUES ABSTRACT
 CLASSIFICATION OF VEGETATION AREA FROM SATELLITE IMAGES USING IMAGE PROCESSING TECHNIQUES Arpita Pandya Research Scholar, Computer Science, Rai University, Ahmedabad Dr. Priya R. Swaminarayan Professor