RGB colours: Display onscreen = RGB
|
|
|
- Magnus Martin
- 6 years ago
- Views:
Transcription

1 RGB colours: Display onscreen = RGB
; Digital Photo from International Space")
2 DIGITAL DATA and DISPLAY Myth: Most satellite images are not photos Photographs are also 'images', but digital images are usually not photographs (no camera involved); Digital Photo from International Space Station
 http://earthnow.usgs.")
3 DIGITAL DATA and DISPLAY Satellite image data - capture Landsat 1 Onboard scanners capture the energy reflected by band (wavelength) for each pixel (picture element) by row and column (captured row by row) Data are recorded in a continuous swath and then cut into scenes several thousand pixels in both x and y.
 Each pixel records a digital number (DN) giving the amount of")
4 Data = digital measure of energy reflected from ground features (or reflection recorded on film in the case of photographs) Each pixel records a digital number (DN) giving the amount of reflection


5 Analogue and digital The analogue data unit is the photograph from a camera; the digital unit is the scene, composed of pixels, created by using a scanner. Analogue remote sensing involves interpretation, location & feature updating; digital applications include classification & feature extraction based on DN s
.")

6 Data characteristics: resolution Spatial resolution (pixel size) Spatial resolution is the size of the picture elements (pixels). This is determined by the sensor design, satellite altitude, and available energy. Remote sensing data generally varies from <1 metre to 10km Very high res: 25cm < 5m High resolution: 5-50metre Medium res: m Low res: > 500m (1km +)
 for easier handling and smaller overall file size: one value per pixel per band.")
7 Radiometric resolution Scanner input (amount of reflectance) is converted from a continuous radiance value (watts / sq metre) into a discrete value known as the digital number (DN). These are integer numbers.. commonly 8-bit (256 values) for easier handling and smaller overall file size: one value per pixel per band. Each value ranges from 0 (no reflection) to 255 (for 8 bit data). They can be converted back to radiance in real numbers if required ,536

8 Digital Numbers (DN) Each satellite image has multiple layers (bands) The pixels line up between bands The attribute = the brightness / reflection level e.g. dark = 0, bright = 255
9 Bands, Channels, and RGB Guns Bands scanned by the sensor (limited by the data captured) e.g. 1-7 for Landsat TM, 1-12 for Landsat 8 OLI Channels data layers (including bands) stored in a database: no limit PCI:.pix Esri:.img [.grd] Other:.tif (geotiff) RGB the three colour display guns (Red, Green, Blue) A monitor has 3 guns (RGB), so only 3 bands can be displayed at once

10 Landsat 5 Thematic Mapper bands ( )
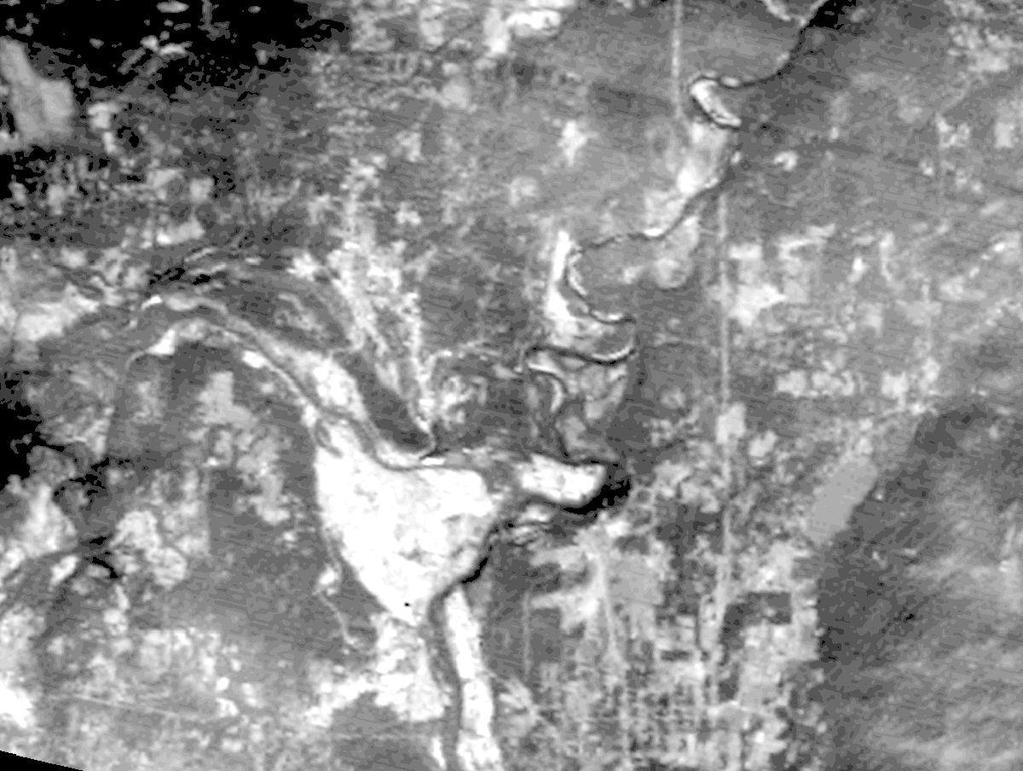
11 Individual Bands (Landsat TM) -displayed as grayscale (30m resolution) Dark = low reflection, Bright = high The next 7 slides show Tm 1-7 in sequence.. Except that 6 and 7 have been switched Note that look similar (visible) Band 4 is Near-IR; 5 and 7 are both mid-ir Band 6 (the last one) is thermal with 120m resolution
12
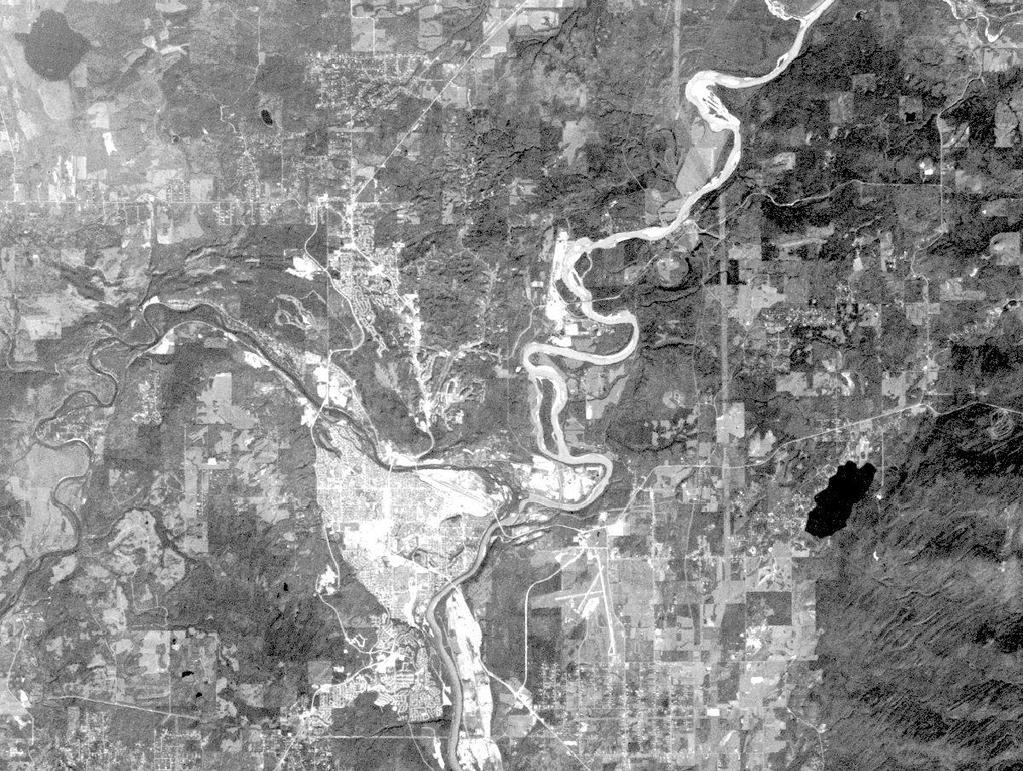
13
14
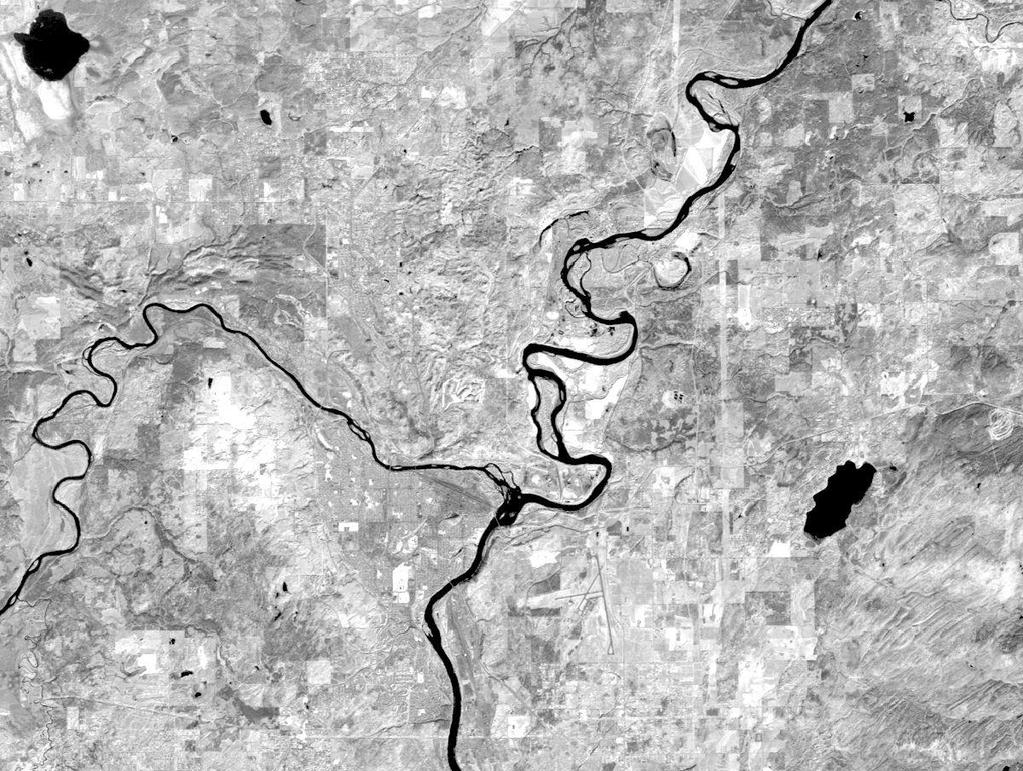
15
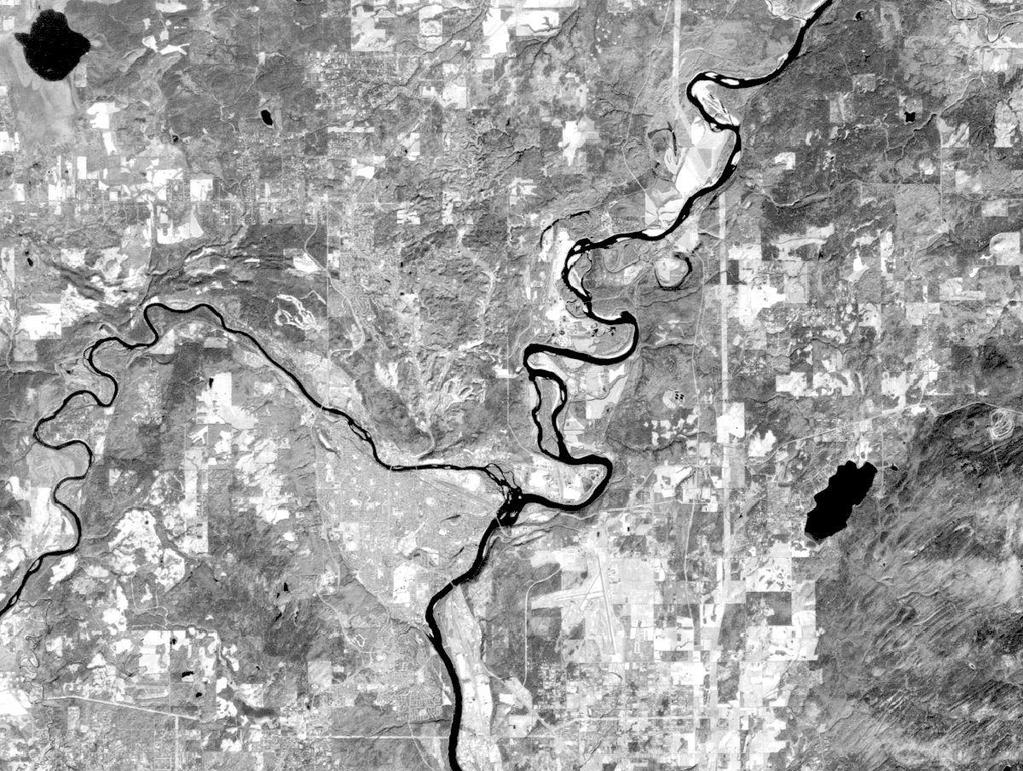
16
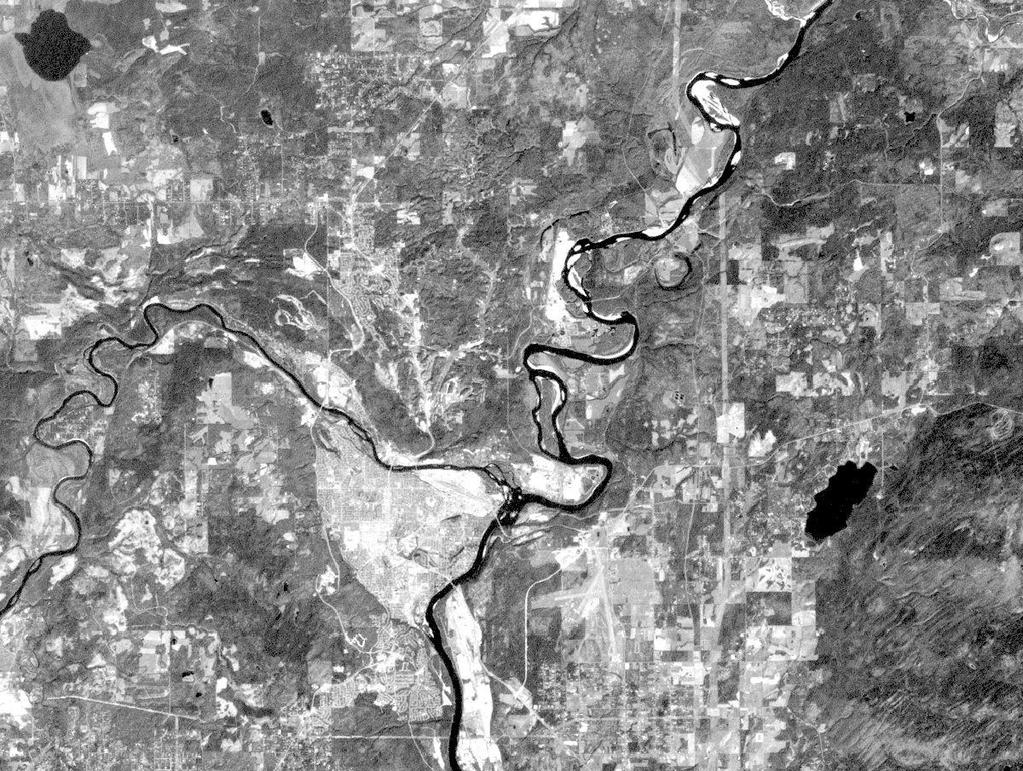
17
18

19 Pure and Mixed Pixels One pixel = one digital value per layer (often 0-255) Remote sensing data and raster GIS data give the impression that a pixel has one uniform value across its width. This may be true for a small pixel or a homogenous cover, such as a large lake, or field, but often we need to know the nature of geographic data and understand that what we are seeing is an average value for a variable forest or a mixture of different surface covers. Landsat example: Bowron Lakes 1 pixel = 30 x 30m
 for a realistic image (right) early PCs had fewer e.g. 2 bit = 4 colours (1982) and 8 bit = 256 colours (1990)")
20 Data display Modern computer screens display 24 bit colour - 8 bits each (256 shades) in red, green and blue (RGB) for a realistic image (right) early PCs had fewer e.g. 2 bit = 4 colours (1982) and 8 bit = 256 colours (1990)
21 RGB screens (Red-Green-Blue) Default display: to RGB Band Colour gun Flip B and R! Blue -> Red Green -> Green Red-> Blue False colour (camouflage film) Near-IR -> Red Red -> Green Green -> Blue Maximum contrast Mid-IR -> Red Near-IR -> Green Red -> Blue
22 Display Modes A: Colour composites Three different channels compose a RGB colour composite: any three channels can be selected. Selecting TM band 1 in Blue, 2 in Green and 3 in Red displays a 'normal colour' composite. Unfortunately, all software automatically loads these in reverse as the display is RGB (including ArcMap) so you need to flip them (3-2-1 instead of 1-2-3) A combination is similar to false colour film. A composition gives a higher contrast image as it incorporates 3 bands from different portions of the EM spectrum.
23 Blue-Green-Red
24 Red-Green-Blue
25 Enhanced (stretched)
26 Unstretched
27 False colour
 not stretched")
28 5-4-3 (Mid near IR Red) not stretched

29 TM 543 Enhanced (stretched)
: less useful for single bands, but used for ratios, etc.. a. Colour composite b.grayscale c.")
30 Display modes: Single band displays B. Grayscale C: Pseudocolour B. The same one band or channel in all three guns creates a grayscale image: C. One band or channel can also be displayed in pseudocolour (PC): less useful for single bands, but used for ratios, etc.. a. Colour composite b.grayscale c.pseudocolour

31 Pseudocolour display Hurricane Harvey; colours represent temperature
 e.g. 0-255, on the x-axis against the frequency of values with those DNs.")
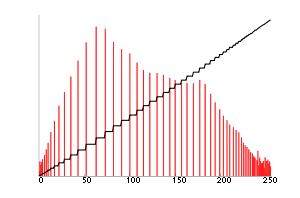
32 Enhancement / Histogram Stretching The data rarely fill the maximum display range, so the screen image lacks contrast at first. Stretching is the manipulation of display colours to fit the DN ranges: A histogram plots the Digital Numbers (DN) e.g , on the x-axis against the frequency of values with those DNs. Stretches include: None, Linear, Equal, Root, Special : (see next slide)

33 Histogram equalization / contrast stretching / image enhancement From Wikipedia, the free encyclopedia
34 A histogram plots the Digital Numbers (DN) e.g , on the x- axis against the frequency of values with those DNs. None Linear Root Special


35 Bands Histograms for Landsat TM Bands 5-4-3
1. Start a bit about Linux
 GEOG432/632 Fall 2017 Lab 1 Display, Digital numbers and Histograms 1. Start a bit about Linux Login to the linux environment you already have in order to view this webpage Linux enables both a command
Module 11 Digital image processing
 Introduction Geo-Information Science Practical Manual Module 11 Digital image processing 11. INTRODUCTION 11-1 START THE PROGRAM ERDAS IMAGINE 11-2 PART 1: DISPLAYING AN IMAGE DATA FILE 11-3 Display of
REMOTE SENSING. Topic 10 Fundamentals of Digital Multispectral Remote Sensing MULTISPECTRAL SCANNERS MULTISPECTRAL SCANNERS
 REMOTE SENSING Topic 10 Fundamentals of Digital Multispectral Remote Sensing Chapter 5: Lillesand and Keifer Chapter 6: Avery and Berlin MULTISPECTRAL SCANNERS Record EMR in a number of discrete portions
Remote Sensing. The following figure is grey scale display of SPOT Panchromatic without stretching.
 Remote Sensing Objectives This unit will briefly explain display of remote sensing image, geometric correction, spatial enhancement, spectral enhancement and classification of remote sensing image. At
Enhancement of Multispectral Images and Vegetation Indices
 Enhancement of Multispectral Images and Vegetation Indices ERDAS Imagine 2016 Description: We will use ERDAS Imagine with multispectral images to learn how an image can be enhanced for better interpretation.
Environmental Remote Sensing GEOG 2021
 Environmental Remote Sensing GEOG 2021 Lecture 2 Image display and enhancement 2 Image Display and Enhancement Purpose visual enhancement to aid interpretation enhancement for improvement of information
Image interpretation I and II
 Image interpretation I and II Looking at satellite image, identifying different objects, according to scale and associated information and to communicate this information to others is what we call as IMAGE
Introduction to image processing for remote sensing: Practical examples
 Università degli studi di Roma Tor Vergata Corso di Telerilevamento e Diagnostica Elettromagnetica Anno accademico 2010/2011 Introduction to image processing for remote sensing: Practical examples Dr.
GEOG432: Remote sensing Lab 3 Unsupervised classification
 GEOG432: Remote sensing Lab 3 Unsupervised classification Goal: This lab involves identifying land cover types by using agorithms to identify pixels with similar Digital Numbers (DN) and spectral signatures
CHARACTERISTICS OF REMOTELY SENSED IMAGERY. Radiometric Resolution
 CHARACTERISTICS OF REMOTELY SENSED IMAGERY Radiometric Resolution There are a number of ways in which images can differ. One set of important differences relate to the various resolutions that images express.
Spectral Signatures. Vegetation. 40 Soil. Water WAVELENGTH (microns)
") Spectral Signatures % REFLECTANCE VISIBLE NEAR INFRARED Vegetation Soil Water.5. WAVELENGTH (microns). Spectral Reflectance of Urban Materials 5 Parking Lot 5 (5=5%) Reflectance 5 5 5 5 5 Wavelength (nm)
Spectral Signatures % REFLECTANCE VISIBLE NEAR INFRARED Vegetation Soil Water.5. WAVELENGTH (microns). Spectral Reflectance of Urban Materials 5 Parking Lot 5 (5=5%) Reflectance 5 5 5 5 5 Wavelength (nm)
Introduction to Remote Sensing
 Introduction to Remote Sensing Spatial, spectral, temporal resolutions Image display alternatives Vegetation Indices Image classifications Image change detections Accuracy assessment Satellites & Air-Photos
An Introduction to Remote Sensing & GIS. Introduction
 An Introduction to Remote Sensing & GIS Introduction Remote sensing is the measurement of object properties on Earth s surface using data acquired from aircraft and satellites. It attempts to measure something
Geo/SAT 2 INTRODUCTION TO REMOTE SENSING
 Geo/SAT 2 INTRODUCTION TO REMOTE SENSING Paul R. Baumann, Professor Emeritus State University of New York College at Oneonta Oneonta, New York 13820 USA COPYRIGHT 2008 Paul R. Baumann Introduction Remote
8. EDITING AND VIEWING COORDINATES, CREATING SCATTERGRAMS AND PRINCIPAL COMPONENTS ANALYSIS
 Editing and viewing coordinates, scattergrams and PCA 8. EDITING AND VIEWING COORDINATES, CREATING SCATTERGRAMS AND PRINCIPAL COMPONENTS ANALYSIS Aim: To introduce you to (i) how you can apply a geographical
Course overview; Remote sensing introduction; Basics of image processing & Color theory
 GEOL 1460 /2461 Ramsey Introduction to Remote Sensing Fall, 2018 Course overview; Remote sensing introduction; Basics of image processing & Color theory Week #1: 29 August 2018 I. Syllabus Review we will
Mod. 2 p. 1. Prof. Dr. Christoph Kleinn Institut für Waldinventur und Waldwachstum Arbeitsbereich Fernerkundung und Waldinventur
 Histograms of gray values for TM bands 1-7 for the example image - Band 4 and 5 show more differentiation than the others (contrast=the ratio of brightest to darkest areas of a landscape). - Judging from
NON-PHOTOGRAPHIC SYSTEMS: Multispectral Scanners Medium and coarse resolution sensor comparisons: Landsat, SPOT, AVHRR and MODIS
 NON-PHOTOGRAPHIC SYSTEMS: Multispectral Scanners Medium and coarse resolution sensor comparisons: Landsat, SPOT, AVHRR and MODIS CLASSIFICATION OF NONPHOTOGRAPHIC REMOTE SENSORS PASSIVE ACTIVE DIGITAL
366 Glossary. Popular method for scale drawings in a computer similar to GIS but without the necessity for spatial referencing CEP
 366 Glossary GISci Glossary ASCII ASTER American Standard Code for Information Interchange Advanced Spaceborne Thermal Emission and Reflection Radiometer Computer Aided Design Circular Error Probability
Remote sensing image correction
 Remote sensing image correction Introductory readings remote sensing http://www.microimages.com/documentation/tutorials/introrse.pdf 1 Preprocessing Digital Image Processing of satellite images can be
Exercise 4-1 Image Exploration
 Exercise 4-1 Image Exploration With this exercise, we begin an extensive exploration of remotely sensed imagery and image processing techniques. Because remotely sensed imagery is a common source of data
Remote Sensing for Rangeland Applications
 Remote Sensing for Rangeland Applications Jay Angerer Ecological Training June 16, 2012 Remote Sensing The term "remote sensing," first used in the United States in the 1950s by Ms. Evelyn Pruitt of the
GEOG432: Remote sensing Lab 3 Unsupervised classification
 GEOG432: Remote sensing Lab 3 Unsupervised classification Goal: This lab involves identifying land cover types by using agorithms to identify pixels with similar Digital Numbers (DN) and spectral signatures
REMOTE SENSING INTERPRETATION
 REMOTE SENSING INTERPRETATION Jan Clevers Centre for Geo-Information - WU Remote Sensing --> RS Sensor at a distance EARTH OBSERVATION EM energy Earth RS is a tool; one of the sources of information! 1
(Refer Slide Time: 1:28)
") Introduction to Remote Sensing Dr. Arun K Saraf Department of Earth Sciences Indian Institute of Technology Roorkee Lecture 10 Image characteristics and different resolutions in Remote Sensing Hello everyone,
Introduction to Remote Sensing Dr. Arun K Saraf Department of Earth Sciences Indian Institute of Technology Roorkee Lecture 10 Image characteristics and different resolutions in Remote Sensing Hello everyone,
Aerial photography and Remote Sensing. Bikini Atoll, 2013 (60 years after nuclear bomb testing)
") Aerial photography and Remote Sensing Bikini Atoll, 2013 (60 years after nuclear bomb testing) Computers have linked mapping techniques under the umbrella term : Geomatics includes all the following spatial
Aerial photography and Remote Sensing Bikini Atoll, 2013 (60 years after nuclear bomb testing) Computers have linked mapping techniques under the umbrella term : Geomatics includes all the following spatial
CanImage. (Landsat 7 Orthoimages at the 1: Scale) Standards and Specifications Edition 1.0
 Standards and Specifications Edition 1.0") CanImage (Landsat 7 Orthoimages at the 1:50 000 Scale) Standards and Specifications Edition 1.0 Centre for Topographic Information Customer Support Group 2144 King Street West, Suite 010 Sherbrooke, QC
CanImage (Landsat 7 Orthoimages at the 1:50 000 Scale) Standards and Specifications Edition 1.0 Centre for Topographic Information Customer Support Group 2144 King Street West, Suite 010 Sherbrooke, QC
Using QuickBird Imagery in ESRI Software Products
 Using QuickBird Imagery in ESRI Software Products TABLE OF CONTENTS 1. Introduction...2 Purpose Scope Image Stretching Color Guns 2. Imagery Usage Instructions...4 ArcView 3.x...4 ArcGIS...7 i Using QuickBird
Image processing. Image formation. Brightness images. Pre-digitization image. Subhransu Maji. CMPSCI 670: Computer Vision. September 22, 2016
 Image formation Image processing Subhransu Maji : Computer Vision September 22, 2016 Slides credit: Erik Learned-Miller and others 2 Pre-digitization image What is an image before you digitize it? Continuous
Important Missions. weather forecasting and monitoring communication navigation military earth resource observation LANDSAT SEASAT SPOT IRS
 Fundamentals of Remote Sensing Pranjit Kr. Sarma, Ph.D. Assistant Professor Department of Geography Mangaldai College Email: prangis@gmail.com Ph. No +91 94357 04398 Remote Sensing Remote sensing is defined
Sommersemester Prof. Dr. Christoph Kleinn Institut für Waldinventur und Waldwachstum Arbeitsbereich Fernerkundung und Waldinventur.
 Basics of Remote Sensing Some literature references Franklin, SE 2001 Remote Sensing for Sustainable Forest Management Lewis Publishers 407p Lillesand, Kiefer 2000 Remote Sensing and Image Interpretation
Introduction to Remote Sensing Fundamentals of Satellite Remote Sensing. Mads Olander Rasmussen
 Introduction to Remote Sensing Fundamentals of Satellite Remote Sensing Mads Olander Rasmussen (mora@dhi-gras.com) 01. Introduction to Remote Sensing DHI What is remote sensing? the art, science, and technology
CHARACTERISTICS OF REMOTELY SENSED IMAGERY. Spatial Resolution
 CHARACTERISTICS OF REMOTELY SENSED IMAGERY Spatial Resolution There are a number of ways in which images can differ. One set of important differences relate to the various resolutions that images express.
Interpreting land surface features. SWAC module 3
 Interpreting land surface features SWAC module 3 Interpreting land surface features SWAC module 3 Different kinds of image Panchromatic image True-color image False-color image EMR : NASA Echo the bat
GE 113 REMOTE SENSING. Topic 7. Image Enhancement
 GE 113 REMOTE SENSING Topic 7. Image Enhancement Lecturer: Engr. Jojene R. Santillan jrsantillan@carsu.edu.ph Division of Geodetic Engineering College of Engineering and Information Technology Caraga State
Govt. Engineering College Jhalawar Model Question Paper Subject- Remote Sensing & GIS
 Govt. Engineering College Jhalawar Model Question Paper Subject- Remote Sensing & GIS Time: Max. Marks: Q1. What is remote Sensing? Explain the basic components of a Remote Sensing system. Q2. What is
CHAPTER 7: Multispectral Remote Sensing
 CHAPTER 7: Multispectral Remote Sensing REFERENCE: Remote Sensing of the Environment John R. Jensen (2007) Second Edition Pearson Prentice Hall Overview of How Digital Remotely Sensed Data are Transformed
Some Basic Concepts of Remote Sensing. Lecture 2 August 31, 2005
 Some Basic Concepts of Remote Sensing Lecture 2 August 31, 2005 What is remote sensing Remote Sensing: remote sensing is science of acquiring, processing, and interpreting images and related data that
Image interpretation and analysis
 Image interpretation and analysis Grundlagen Fernerkundung, Geo 123.1, FS 2014 Lecture 7a Rogier de Jong Michael Schaepman Why are snow, foam, and clouds white? Why are snow, foam, and clouds white? Today
Chapter 1 Overview of imaging GIS
 Chapter 1 Overview of imaging GIS Imaging GIS, a term used in the medical imaging community (Wang 2012), is adopted here to describe a geographic information system (GIS) that displays, enhances, and facilitates
Digital database creation of historical Remote Sensing Satellite data from Film Archives A case study
 Digital database creation of historical Remote Sensing Satellite data from Film Archives A case study N.Ganesh Kumar +, E.Venkateswarlu # Product Quality Control, Data Processing Area, NRSA, Hyderabad.
Lecture 13: Remotely Sensed Geospatial Data
 Lecture 13: Remotely Sensed Geospatial Data A. The Electromagnetic Spectrum: The electromagnetic spectrum (Figure 1) indicates the different forms of radiation (or simply stated light) emitted by nature.
Preparing Remote Sensing Data for Natural Resources Mapping (image enhancement, rectifications )
") Preparing Remote Sensing Data for Natural Resources Mapping (image enhancement, rectifications ) Why is this important What are the major approaches Examples of digital image enhancement Follow up exercises
Preparing Remote Sensing Data for Natural Resources Mapping (image enhancement, rectifications ) Why is this important What are the major approaches Examples of digital image enhancement Follow up exercises
Unsupervised Classification
 Unsupervised Classification Using SAGA Tutorial ID: IGET_RS_007 This tutorial has been developed by BVIEER as part of the IGET web portal intended to provide easy access to geospatial education. This tutorial
Introduction to Remote Sensing Part 1
 Introduction to Remote Sensing Part 1 A Primer on Electromagnetic Radiation Digital, Multi-Spectral Imagery The 4 Resolutions Displaying Images Corrections and Enhancements Passive vs. Active Sensors Radar
Apply Colour Sequences to Enhance Filter Results. Operations. What Do I Need? Filter
 Apply Colour Sequences to Enhance Filter Results Operations What Do I Need? Filter Single band images from the SPOT and Landsat platforms can sometimes appear flat (i.e., they are low contrast images).
Digital Image Processing
 Digital Image Processing 1 Patrick Olomoshola, 2 Taiwo Samuel Afolayan 1,2 Surveying & Geoinformatic Department, Faculty of Environmental Sciences, Rufus Giwa Polytechnic, Owo. Nigeria Abstract: This paper
Making NDVI Images using the Sony F717 Nightshot Digital Camera and IR Filters and Software Created for Interpreting Digital Images.
 Making NDVI Images using the Sony F717 Nightshot Digital Camera and IR Filters and Software Created for Interpreting Digital Images Draft 1 John Pickle Museum of Science October 14, 2004 Digital Cameras
Saturation And Value Modulation (SVM): A New Method For Integrating Color And Grayscale Imagery
: A New Method For Integrating Color And Grayscale Imagery") 87 Saturation And Value Modulation (SVM): A New Method For Integrating Color And Grayscale Imagery By David W. Viljoen 1 and Jeff R. Harris 2 Geological Survey of Canada 615 Booth St. Ottawa, ON, K1A 0E9
87 Saturation And Value Modulation (SVM): A New Method For Integrating Color And Grayscale Imagery By David W. Viljoen 1 and Jeff R. Harris 2 Geological Survey of Canada 615 Booth St. Ottawa, ON, K1A 0E9
Software requirements * : Part I: 1 hr. Part III: 2 hrs.
 Title: Product Type: Developer: Target audience: Format: Software requirements * : Data: Estimated time to complete: Using MODIS to Analyze the Seasonal Growing Cycle of Crops Part I: Understand and locate
Module 3 Introduction to GIS. Lecture 8 GIS data acquisition
 Module 3 Introduction to GIS Lecture 8 GIS data acquisition GIS workflow Data acquisition (geospatial data input) GPS Remote sensing (satellites, UAV s) LiDAR Digitized maps Attribute Data Management Data
Image and video processing
 Image and video processing Processing Colour Images Dr. Yi-Zhe Song The agenda Introduction to colour image processing Pseudo colour image processing Full-colour image processing basics Transforming colours
A map says to you, 'Read me carefully, follow me closely, doubt me not.' It says, 'I am the Earth in the palm of your hand. Without me, you are alone
 A map says to you, 'Read me carefully, follow me closely, doubt me not.' It says, 'I am the Earth in the palm of your hand. Without me, you are alone and lost. Beryl Markham (West With the Night, 1946
Histogram equalization
 Histogram equalization Contents Background... 2 Procedure... 3 Page 1 of 7 Background To understand histogram equalization, one must first understand the concept of contrast in an image. The contrast is
Introduction. Introduction. Introduction. Introduction. Introduction
 Identifying habitat change and conservation threats with satellite imagery Extinction crisis Volker Radeloff Department of Forest Ecology and Management Extinction crisis Extinction crisis Conservationists
Basic Hyperspectral Analysis Tutorial
 Basic Hyperspectral Analysis Tutorial This tutorial introduces you to visualization and interactive analysis tools for working with hyperspectral data. In this tutorial, you will: Analyze spectral profiles
earthobservation.wordpress.com
 Dirty REMOTE SENSING earthobservation.wordpress.com Stuart Green Teagasc Stuart.Green@Teagasc.ie 1 Purpose Give you a very basic skill set and software training so you can: find free satellite image data.
Sources of Geographic Information
 Sources of Geographic Information Data properties: Spatial data, i.e. data that are associated with geographic locations Data format: digital (analog data for traditional paper maps) Data Inputs: sampled
The techniques with ERDAS IMAGINE include:
 The techniques with ERDAS IMAGINE include: 1. Data correction - radiometric and geometric correction 2. Radiometric enhancement - enhancing images based on the values of individual pixels 3. Spatial enhancement
Remote Sensing in Daily Life. What Is Remote Sensing?
 Remote Sensing in Daily Life What Is Remote Sensing? First time term Remote Sensing was used by Ms Evelyn L Pruitt, a geographer of US in mid 1950s. Minimal definition (not very useful): remote sensing
University of Texas at San Antonio EES 5053 Term Project CORRELATION BETWEEN NDVI AND SURFACE TEMPERATURES USING LANDSAT ETM + IMAGERY NEWFEL MAZARI
 University of Texas at San Antonio EES 5053 Term Project CORRELATION BETWEEN NDVI AND SURFACE TEMPERATURES USING LANDSAT ETM + IMAGERY NEWFEL MAZARI Introduction and Objectives The present study is a correlation
Black Dot shows actual Point location
 207 Plate 1 Use of scanned archive aerial photographs, digital photogrammetry and GIS to plot river channel erosion along the Afon Trannon, Wales (part of the study by Mount et al 2000, 2003). Plate 2
ILLUMINATION CORRECTION OF LANDSAT TM DATA IN SOUTH EAST NSW
 ILLUMINATION CORRECTION OF LANDSAT TM DATA IN SOUTH EAST NSW Elizabeth Roslyn McDonald 1, Xiaoliang Wu 2, Peter Caccetta 2 and Norm Campbell 2 1 Environmental Resources Information Network (ERIN), Department
Int n r t o r d o u d c u ti t on o n to t o Remote Sensing
 Introduction to Remote Sensing Definition of Remote Sensing Remote sensing refers to the activities of recording/observing/perceiving(sensing)objects or events at far away (remote) places. In remote sensing,
Lecture 2. Electromagnetic radiation principles. Units, image resolutions.
 NRMT 2270, Photogrammetry/Remote Sensing Lecture 2 Electromagnetic radiation principles. Units, image resolutions. Tomislav Sapic GIS Technologist Faculty of Natural Resources Management Lakehead University
Aral Sea profile Selection of area 24 February April May 1998
 250 km Aral Sea profile 1960 1960 1985 1986 1987 1988 1989 1990 1991 1992 1993 1994 1995 1996 1997 1998 2010? Selection of area Area of interest Kzyl-Orda Dried seabed 185 km Syrdarya river Aral Sea Salt
Viewing Landsat TM images with Adobe Photoshop
 Viewing Landsat TM images with Adobe Photoshop Reformatting images into GeoTIFF format Of the several formats in which Landsat TM data are available, only a few formats (primarily TIFF or GeoTIFF) can
Land Cover Analysis to Determine Areas of Clear-cut and Forest Cover in Olney, Montana. Geob 373 Remote Sensing. Dr Andreas Varhola, Kathry De Rego
 1 Land Cover Analysis to Determine Areas of Clear-cut and Forest Cover in Olney, Montana Geob 373 Remote Sensing Dr Andreas Varhola, Kathry De Rego Zhu an Lim (14292149) L2B 17 Apr 2016 2 Abstract Montana
Lab 1 Introduction to ENVI
 Remote sensing for agricultural applications: principles and methods (2013-2014) Instructor: Prof. Tao Cheng (tcheng@njau.edu.cn) Nanjing Agricultural University Lab 1 Introduction to ENVI April 1 st,
MODULE 4 LECTURE NOTES 1 CONCEPTS OF COLOR
 MODULE 4 LECTURE NOTES 1 CONCEPTS OF COLOR 1. Introduction The field of digital image processing relies on mathematical and probabilistic formulations accompanied by human intuition and analysis based
Philpot & Philipson: Remote Sensing Fundamentals Color 6.1 W.D. Philpot, Cornell University, Fall 2012 W B = W (R + G) R = W (G + B)
 R = W (G + B)") Philpot & Philipson: Remote Sensing Fundamentals olor 6.1 6. OLOR The human visual system is capable of distinguishing among many more colors than it is levels of gray. The range of color perception is
Philpot & Philipson: Remote Sensing Fundamentals olor 6.1 6. OLOR The human visual system is capable of distinguishing among many more colors than it is levels of gray. The range of color perception is
MODULE 4 LECTURE NOTES 4 DENSITY SLICING, THRESHOLDING, IHS, TIME COMPOSITE AND SYNERGIC IMAGES
 MODULE 4 LECTURE NOTES 4 DENSITY SLICING, THRESHOLDING, IHS, TIME COMPOSITE AND SYNERGIC IMAGES 1. Introduction Digital image processing involves manipulation and interpretation of the digital images so
EXERCISE 1 - REMOTE SENSING: SENSORS WITH DIFFERENT RESOLUTION
 EXERCISE 1 - REMOTE SENSING: SENSORS WITH DIFFERENT RESOLUTION Program: ArcView 3.x 1. Copy the folder FYS_FA with its whole contents from: Kursdata: L:\FA\FYS_FA to C:\Tempdata 2. Open the folder and
INDIAN INSTITUTE OF TECHNOLOGY ROORKEE NPTEL NPTEL ONLINE CERTIFICATION COURES. Digital Image Processing of Remote Sensing Data
 INDIAN INSTITUTE OF TECHNOLOGY ROORKEE NPTEL NPTEL ONLINE CERTIFICATION COURES Digital Image Processing of Remote Sensing Data Lecture 01 What is a Remote Sensing Image and How it is Represented? Dr. Arun
Images and Graphics. 4. Images and Graphics - Copyright Denis Hamelin - Ryerson University
 Images and Graphics Images and Graphics Graphics and images are non-textual information that can be displayed and printed. Graphics (vector graphics) are an assemblage of lines, curves or circles with
SECTION I - CHAPTER 2 DIGITAL IMAGING PROCESSING CONCEPTS
 RADT 3463 - COMPUTERIZED IMAGING Section I: Chapter 2 RADT 3463 Computerized Imaging 1 SECTION I - CHAPTER 2 DIGITAL IMAGING PROCESSING CONCEPTS RADT 3463 COMPUTERIZED IMAGING Section I: Chapter 2 RADT
Blacksburg, VA July 24 th 30 th, 2010 Remote Sensing Page 1. A condensed overview. For our purposes
 A condensed overview George McLeod Prepared by: With support from: NSF DUE-0903270 in partnership with: Geospatial Technician Education Through Virginia s Community Colleges (GTEVCC) The art and science
Data Sources. The computer is used to assist the role of photointerpretation.
 Data Sources Digital Image Data - Remote Sensing case: data of the earth's surface acquired from either aircraft or spacecraft platforms available in digital format; spatially the data is composed of discrete
Outline. Introduction. Introduction: Film Emulsions. Sensor Systems. Types of Remote Sensing. A/Prof Linlin Ge. Photographic systems (cf(
 GMAT x600 Remote Sensing / Earth Observation Types of Sensor Systems (1) Outline Image Sensor Systems (i) Line Scanning Sensor Systems (passive) (ii) Array Sensor Systems (passive) (iii) Antenna Radar
Due Date: September 22
 Geography 309 Lab 1 Page 1 LAB 1: INTRODUCTION TO REMOTE SENSING Due Date: September 22 Objectives To familiarize yourself with: o remote sensing resources on the Internet o some remote sensing sensors
Remote Sensing And Gis Application in Image Classification And Identification Analysis.
 Quest Journals Journal of Research in Environmental and Earth Science Volume 3~ Issue 5 (2017) pp: 55-66 ISSN(Online) : 2348-2532 www.questjournals.org Research Paper Remote Sensing And Gis Application
Image enhancement. Introduction to Photogrammetry and Remote Sensing (SGHG 1473) Dr. Muhammad Zulkarnain Abdul Rahman
 Dr. Muhammad Zulkarnain Abdul Rahman") Image enhancement Introduction to Photogrammetry and Remote Sensing (SGHG 1473) Dr. Muhammad Zulkarnain Abdul Rahman Image enhancement Enhancements are used to make it easier for visual interpretation
Image enhancement Introduction to Photogrammetry and Remote Sensing (SGHG 1473) Dr. Muhammad Zulkarnain Abdul Rahman Image enhancement Enhancements are used to make it easier for visual interpretation
Evaluation of FLAASH atmospheric correction. Note. Note no SAMBA/10/12. Authors. Øystein Rudjord and Øivind Due Trier
 Evaluation of FLAASH atmospheric correction Note Note no Authors SAMBA/10/12 Øystein Rudjord and Øivind Due Trier Date 16 February 2012 Norsk Regnesentral Norsk Regnesentral (Norwegian Computing Center,
Atmospheric interactions; Aerial Photography; Imaging systems; Intro to Spectroscopy Week #3: September 12, 2018
 GEOL 1460/2461 Ramsey Introduction/Advanced Remote Sensing Fall, 2018 Atmospheric interactions; Aerial Photography; Imaging systems; Intro to Spectroscopy Week #3: September 12, 2018 I. Quick Review from
Remote Sensing in an
 Chapter 11: Creating a Composite Image from Landsat Imagery Remote Sensing in an ArcMap Environment Remote Sensing Analysis in an ArcMap Environment Tammy E. Parece Image source: landsat.usgs.gov Tammy
6 Color Image Processing
 6 Color Image Processing Angela Chih-Wei Tang ( 唐之瑋 ) Department of Communication Engineering National Central University JhongLi, Taiwan 2009 Fall Outline Color fundamentals Color models Pseudocolor image
Abstract Quickbird Vs Aerial photos in identifying man-made objects
 Abstract Quickbird Vs Aerial s in identifying man-made objects Abdullah Mah abdullah.mah@aramco.com Remote Sensing Group, emap Division Integrated Solutions Services Department (ISSD) Saudi Aramco, Dhahran
NORMALIZING ASTER DATA USING MODIS PRODUCTS FOR LAND COVER CLASSIFICATION
 NORMALIZING ASTER DATA USING MODIS PRODUCTS FOR LAND COVER CLASSIFICATION F. Gao a, b, *, J. G. Masek a a Biospheric Sciences Branch, NASA Goddard Space Flight Center, Greenbelt, MD 20771, USA b Earth
Textbook, Chapter 15 Textbook, Chapter 10 (only 10.6)
") AGOG 484/584/ APLN 551 Fall 2018 Concept definition Applications Instruments and platforms Techniques to process hyperspectral data A problem of mixed pixels and spectral unmixing Reading Textbook, Chapter
AGOG 484/584/ APLN 551 Fall 2018 Concept definition Applications Instruments and platforms Techniques to process hyperspectral data A problem of mixed pixels and spectral unmixing Reading Textbook, Chapter
Additive Color Synthesis
 Color Systems Defining Colors for Digital Image Processing Various models exist that attempt to describe color numerically. An ideal model should be able to record all theoretically visible colors in the
An Introduction to Geomatics. Prepared by: Dr. Maher A. El-Hallaq خاص بطلبة مساق مقدمة في علم. Associate Professor of Surveying IUG
 An Introduction to Geomatics خاص بطلبة مساق مقدمة في علم الجيوماتكس Prepared by: Dr. Maher A. El-Hallaq Associate Professor of Surveying IUG 1 Airborne Imagery Dr. Maher A. El-Hallaq Associate Professor
9/12/2011. Training Course Remote Sensing Basic Theory & Image Processing Methods September 2011
 Training Course Remote Sensing Basic Theory & Image Processing Methods 19 23 September 2011 Introduction to Remote Sensing Michiel Damen (September 2011) damen@itc.nl 1 Overview Some definitions Remote
1. What values did you use for bands 2, 3 & 4? Populate the table below. Compile the relevant data for the additional bands in the data below:
 Graham Emde GEOG3200: Remote Sensing Lab # 3: Atmospheric Correction Introduction: This lab teachs how to use INDRISI to correct for atmospheric haze in remotely sensed imagery. There are three models
Introduction to Remote Sensing
 Introduction to Remote Sensing Outline Remote Sensing Defined Resolution Electromagnetic Energy (EMR) Types Interpretation Applications Remote Sensing Defined Remote Sensing is: The art and science of
Unit 8: Color Image Processing
 Unit 8: Color Image Processing Colour Fundamentals In 666 Sir Isaac Newton discovered that when a beam of sunlight passes through a glass prism, the emerging beam is split into a spectrum of colours The
Spatial Analyst is an extension in ArcGIS specially designed for working with raster data.
 Spatial Analyst is an extension in ArcGIS specially designed for working with raster data. 1 Do you remember the difference between vector and raster data in GIS? 2 In Lesson 2 you learned about the difference
Satellite Remote Sensing: Earth System Observations
 Satellite Remote Sensing: Earth System Observations Land surface Water Atmosphere Climate Ecosystems 1 EOS (Earth Observing System) Develop an understanding of the total Earth system, and the effects of
Remote Sensing Platforms
 Types of Platforms Lighter-than-air Remote Sensing Platforms Free floating balloons Restricted by atmospheric conditions Used to acquire meteorological/atmospheric data Blimps/dirigibles Major role - news
Digital Image Processing. Lecture # 3 Image Enhancement
 Digital Image Processing Lecture # 3 Image Enhancement 1 Image Enhancement Image Enhancement 3 Image Enhancement 4 Image Enhancement Process an image so that the result is more suitable than the original
Lesson 3: Working with Landsat Data
 Lesson 3: Working with Landsat Data Lesson Description The Landsat Program is the longest-running and most extensive collection of satellite imagery for Earth. These datasets are global in scale, continuously