Documenting Land Cover and Vegetation Productivity Changes in the NWT using the Landsat Satellite Archive
|
|
|
- Erick Carpenter
- 5 years ago
- Views:
Transcription

 Geological Survey of Canada, Natural Resources Canada, Ottawa, ON (5) Department of Geography, University of")
1 Documenting Land Cover and Vegetation Productivity Changes in the NWT using the Landsat Satellite Archive Fraser, R.H 1, Olthof, I. 1, Deschamps, A. 1, Pregitzer, M. 1, Kokelj, S. 2, Lantz, T. 3,Wolfe, S. 4, Brooker, A. 5, Lacelle, D. 5, and Schwarz, S. 6 (1) Canada Centre for Remote Sensing, Natural Resources Canada, Ottawa, ON (2) NWT Geoscience Office, Govt of the Northwest Territories, Yellowknife, NWT (3) School of Environmental Studies, University of Victoria, Victoria, BC (4) Geological Survey of Canada, Natural Resources Canada, Ottawa, ON (5) Department of Geography, University of Ottawa, Ottawa, ON (6) NWT Centre for Geomatics, Govt of the Northwest Territories, Yellowknife, NWT
2 Outline 1. Need for large-area monitoring in the Northwest Territories 2. Potential of Landsat image archive for northern monitoring 3. Change detection using dense Landsat image stacks 4. NWT study regions and methods 5. NWT Trend detection results Landscape disturbances and tundra greening


3 1. Need for large-area monitoring in NWT NWT is a large and sparsely populated territory facing cumulative impacts from development and climate change Inuvik Annual Temperature Means (NWT Environment and Natural Resources) NWT Mines and Exploration Projects (NWT Geoscience Office)


4 1. Need for large-area monitoring in NWT Strong need for comprehensive environmental monitoring recently highlighted in the Rosenberg International Forum report on the Mackenzie River Basin: a strong, well-designed and ongoing monitoring program an absolutely essential precondition for effective management of the Mackenzie River Basin. NWT Cumulative Impacts Monitoring Program (CIMP) Supports numerous initiatives for building monitoring capacity including three projects with CCRS/NRCan involvement aimed at expanding scale of monitoring using EO The NRCan TRACS project also using EO to assess terrain sensitivity to permafrost degradation and potential impacts on transportation networks
 and extent (185 km) ideal for large-area monitoring.")

5 2. Potential of Landsat Image Archive for Northern Monitoring Landsat has a spatial grain (30 m) and extent (185 km) ideal for large-area monitoring. A rich 28-Year ( ) archive exists for Northern Canada Baseline monitoring and retrospective change analysis can be followed by forward monitoring USGS Archive Holdings WRS-2 Frame Overlap (CIMP study region)
 With the opening of the Landsat archive, more change detection initiatives have exploited dense time series of imagery (Wulder et al.")

6 3. Change Detecting Using Dense Landsat Image Stacks LandTrendr (Kennedy et al.) With the opening of the Landsat archive, more change detection initiatives have exploited dense time series of imagery (Wulder et al. 2012, RSE) Kennedy, Cohen et al. (LandTrendr), Huang et al., Masek et al., (Vegetation Change Tracker), Vogelman et al., Goodwin et al., Schroeder et al. Most have studied temperate forested ecosystems few the North Masek et al. 2012, Fraser et al., 2012 CCRS and Parks Canada investigated potential for using Landsat image stacks to monitor northern parks (ParkSPACE) ParkSPACE Ivvavik National Park Shrub
 2.")
7 4. Current NWT Landsat Analysis Landsat Study Regions Goal: Investigate potential to use Landsat archive for monitoring a range of landscape changes in NWT CIMP Study Regions: 1.Peel Plateau and Mackenzie Delta (NWT CIMP projects) 2.Great Slave Geological Province (TRACS projects) TRACS


8 4. Image Stack Change Method 1. Build 25-year Landsat Image Stack Cloud/shadow/SLC masking, TOA reflectance, peak-phenology screening using AVHRR/MODIS 2. Extract Pixel Time Series Values Unique database for each pixel of six Vegetation Indices 3. Derive Linear Trends in Landsat Indices (e.g. Tasseled Cap Brightness, Greenness, Wetness) 6. Relate TC Trends to Changes in Vegetation Composition (Scale up high res training data using regression trees) 5. Create Trend Images (RBG= TCB, TCG, TCW) 6. Change Classification Product (Decision tree classifier with ancillary GIS data)

 Yellow = B G W (e.g. water veg, fire")
 G=Greenness Change (green channel) W=Wetness")
 Blue = B G W (e.g.")
9 Methods: RGB Composite Trend Images for Visualizing Physical Changes TC Brightness Trend TC Greenness Trend TC Wetness Trend Interpretation Key Red = B G W (e.g. veg bare, dev.) Yellow = B G W (e.g. water veg, fire regen) RGB Composite Image draining lakes B=Brightness Change (red channel) G=Greenness Change (green channel) W=Wetness Change (blue channel) Blue = B G W (e.g. forest succession, slump disturbance) Light Blue = B G W (e.g. veg growth over bare) fire gravel pit


10 Mean = Results: Density of Growing Season Landsat Observations ( )


11 5. Results: Landscape Disturbance Examples Wildfires Landsat TC Trends ( ) Dates indicated from GNWT fire mapping polygons
")
 1968 fire")
12 Landsat TC Trends ( ) Inuvik Area B=Brightness Change (red channel) G=Greenness Change (green channel) W=Wetness Change (blue channel) 1968 fire Inuvik 2003 fire

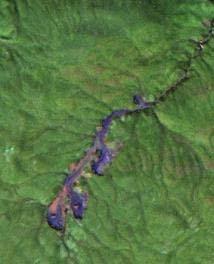
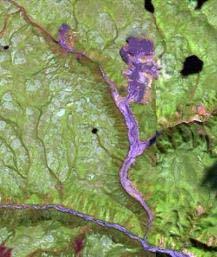
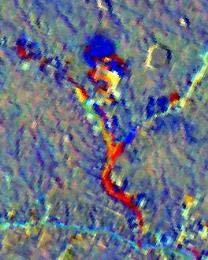
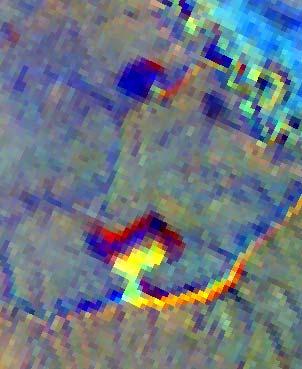
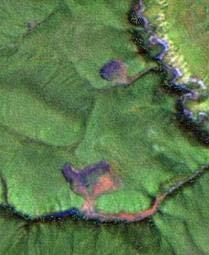
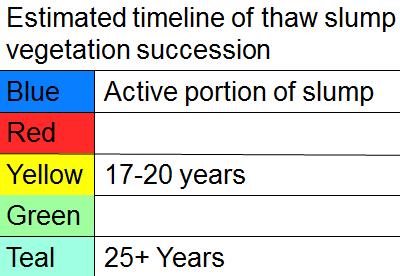
13 Landsat TC Trends ( ) Peel Plateau Thaw Slumps Trend trajectories related to decadal evolution of retrogressive slumps Recent 20m SPOT imagery


 Yellow = B G W (e.g.")
14 Landsat Trends ( ) Fire and Shallow Lake Drainage Higher prevalence of lake drainage in post-fire areas likely related to permafrost degradation Landsat TC Trends ( ) Yellow = B G W (e.g. water veg) GNWT ELC (2005)


")


15 Landsat Trends ( ) Norman Wells Area (35km extent) Regenerating Seismic Lines Old Disturbance and Forest Succession Old Canol Road

 Red = B G W (e.")
 Yellow = B G W (e.g. water veg) 2006 Landsat Ch.")
16 1984 Landsat Ch. 3 Yellowknife Area RGB Composite Change Image ( ) Dark Blue = B G W (e.g. veg water) Red = B G W (e.g. development) Light Blue = B G W (e.g. veg growth) Yellow = B G W (e.g. water veg) 2006 Landsat Ch. 3
 Dark Blue = B G W Red = B G W")

17 Along Yellowknife Highway RGB Composite Change Image ( ) Dark Blue = B G W Red = B G W New dev Fire regen Light Blue = B G W Old hwy Great Slave Lake Drying wetlands Yellow = B G W

 Google")


18 Drying and Greening of Wetlands on Great Slave Lake June 18, 2012 (south is up) Google Earth June 28, Landsat Wetness Trend Great Slave Lake water levels since 1934 Landsat Period
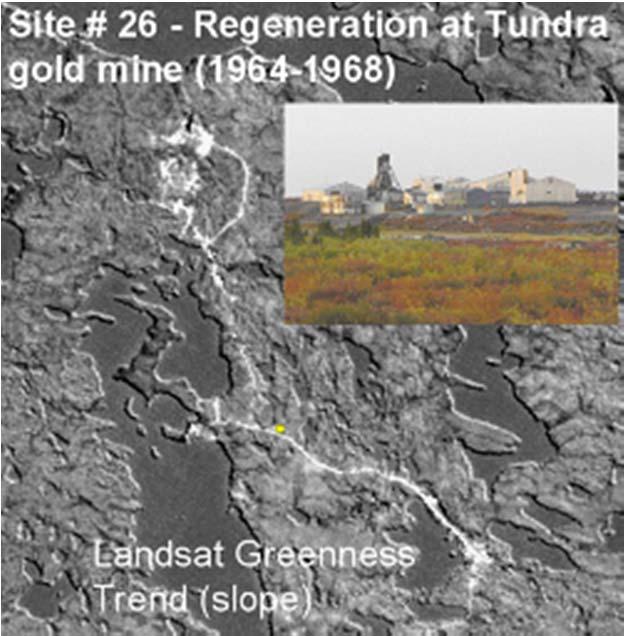
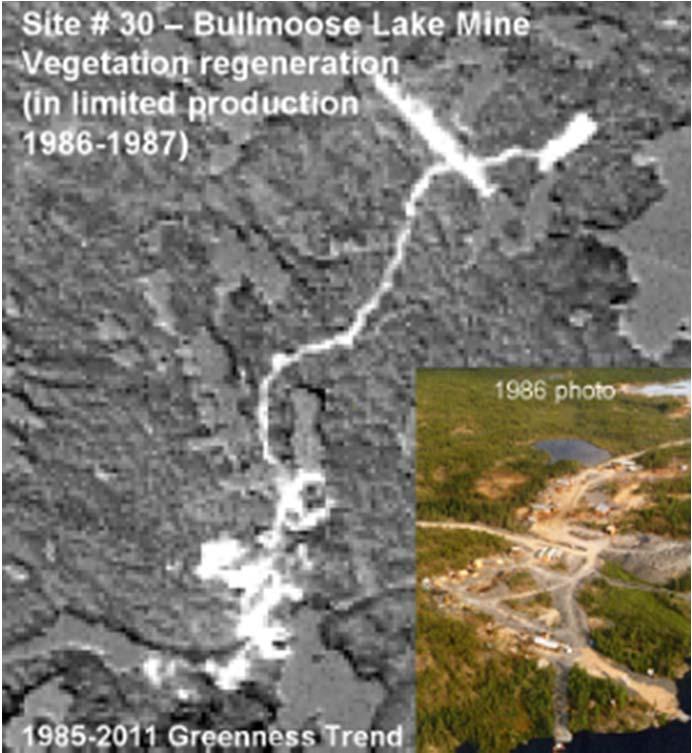
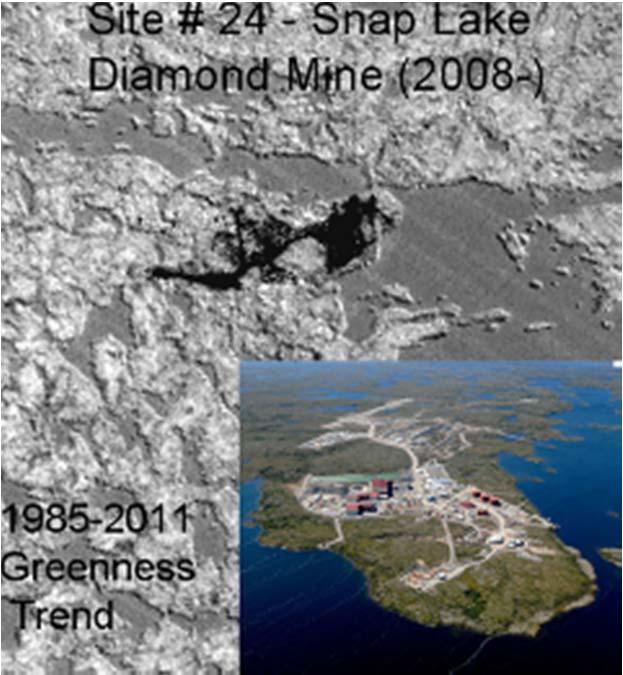
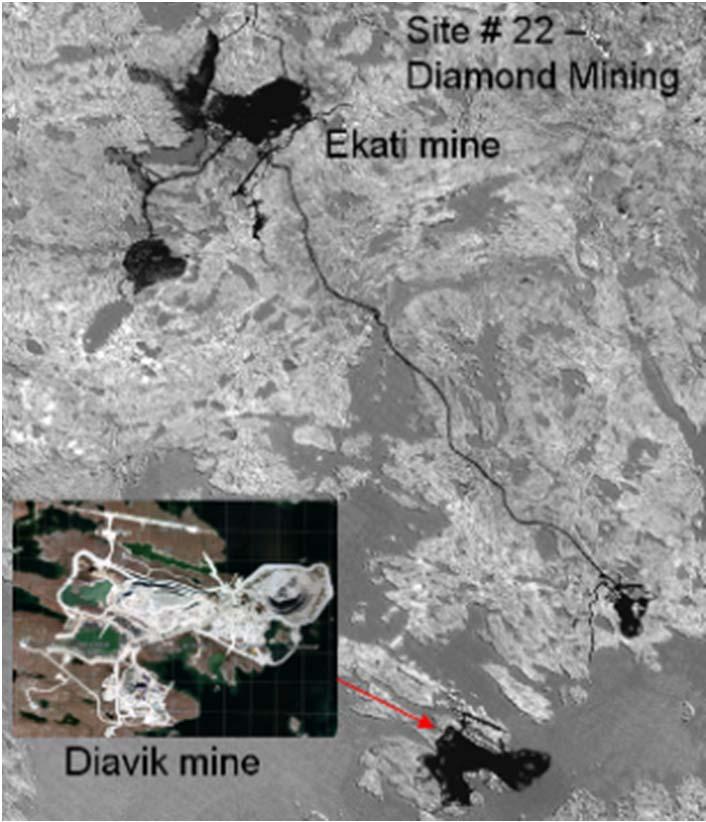
19 Mining Operations (New and Abandoned)


")


20 Landsat NDVI Trends (positive trends in green, negative trends in red) Increasing Tundra Productivity / Shrub Growth Pouliot et al AVHRR NDVI Trends
 July 25, 1992 July 23, 2000 Alder thicket visible in")
21 Increasing Tundra Productivity Near-Anniversary Date Landsat Images 8 Years Apart (RGB=SWIR TOA,NIR TOA,Red TOA, non-stretched, leafy vegetation appear green) July 25, 1992 July 23, 2000 Alder thicket visible in 1950

 Aug 6, 1980 Aug")

22 Validation: Will reacquire 1:2,000 Colour-Infrared Air Photos Captured in 1980 (Sims, 1983) Aug 6, 1980 Aug 8, 2013 Shrub Changes? Lichen Change? Alder thicket visible in m
 Decision Tree Classification Expert Decision Rules GIS Layers For Spatial Context Alder thicket visible in 1950 Change Classification")
23 Training Database Change Classes (718 polygons) Next Step: Developing Change Classification Products from Landsat Trends Training database Landsat VI Trends Binary Change Mask (Threshold) Decision Tree Classification Expert Decision Rules GIS Layers For Spatial Context Alder thicket visible in 1950 Change Classification Product


24 Changes Detected Over NWT Study Regions using Landsat Natural Wildfires and regen Thaw slumps Lake drainage and erosion Greening / increased growth of shrubs Succession of old disturbances and Vegetation flooding Anthropogenic Municipal developments Mining new footprint and regeneration of abandoned mines Highways new and regeneration of borrow pits

25 Thank You Support from: NWT CIMP NRCan TRACS Project Polar Continental Shelf Project
DEVELOPMENT OF A NEW SOUTH AFRICAN LAND-COVER DATASET USING AUTOMATED MAPPING TECHINQUES. Mark Thompson 1
 DEVELOPMENT OF A NEW SOUTH AFRICAN LAND-COVER DATASET USING AUTOMATED MAPPING TECHINQUES. Mark Thompson 1 1 GeoTerraImage Pty Ltd, Pretoria, South Africa Abstract This talk will discuss the development
IceTrendr - Polygon - Pixel
 INTRODUCTION Using the 1984-2015 Landsat satellite imagery as the primary information source, we want to observe and describe how the land cover changes through time. Using a pixel as the plot extent (30m
Vegetation Phenology. Quantifying climate impacts on ecosystems: Field and Satellite Assessments
 Vegetation Phenology Quantifying climate impacts on ecosystems: Field and Satellite Assessments Plants can tell us a story about climate. Timing of sugar maple leaf drop (Ollinger, S.V. Potential effects
Detecting and Mapping Invasive Phragmites australis in the coastal Great Lakes with ALOS PALSAR imagery
 Detecting and Mapping Invasive Phragmites australis in the coastal Great Lakes with ALOS PALSAR imagery Laura L. Bourgeau-Chavez, Kirk Scarbrough, Liza Jenkins, Kevin Riordan, Richard Powell, Colin Brooks,
Detecting and Mapping Invasive Phragmites australis in the Coastal Great Lakes with ALOS PALSAR Imagery
 Detecting and Mapping Invasive Phragmites australis in the Coastal Great Lakes with ALOS PALSAR Imagery Brian Huberty U.S Fish & Wildlife Service Region 3 Ecological Services Laura L. Bourgeau-Chavez,
Land Cover Analysis to Determine Areas of Clear-cut and Forest Cover in Olney, Montana. Geob 373 Remote Sensing. Dr Andreas Varhola, Kathry De Rego
 1 Land Cover Analysis to Determine Areas of Clear-cut and Forest Cover in Olney, Montana Geob 373 Remote Sensing Dr Andreas Varhola, Kathry De Rego Zhu an Lim (14292149) L2B 17 Apr 2016 2 Abstract Montana
NRS 415 Remote Sensing of Environment
 NRS 415 Remote Sensing of Environment 1 High Oblique Perspective (Side) Low Oblique Perspective (Relief) 2 Aerial Perspective (See What s Hidden) An example of high spatial resolution true color remote
IceTrendr - Polygon. 1 contact: Peder Nelson Anne Nolin Polygon Attribution Instructions
 INTRODUCTION We want to describe the process that caused a change on the landscape (in the entire area of the polygon outlined in red in the KML on Google Earth), and we want to record as much as possible
Interpreting land surface features. SWAC module 3
 Interpreting land surface features SWAC module 3 Interpreting land surface features SWAC module 3 Different kinds of image Panchromatic image True-color image False-color image EMR : NASA Echo the bat
NORMALIZING ASTER DATA USING MODIS PRODUCTS FOR LAND COVER CLASSIFICATION
 NORMALIZING ASTER DATA USING MODIS PRODUCTS FOR LAND COVER CLASSIFICATION F. Gao a, b, *, J. G. Masek a a Biospheric Sciences Branch, NASA Goddard Space Flight Center, Greenbelt, MD 20771, USA b Earth
TimeSync V3 User Manual. January Introduction
 TimeSync V3 User Manual January 2017 Introduction TimeSync is an application that allows researchers and managers to characterize and quantify disturbance and landscape change by facilitating plot-level
Wetlands Investigation Utilizing GIS and Remote Sensing Technology for Lucas County, Ohio: a hybrid analysis.
 Wetlands Investigation Utilizing GIS and Remote Sensing Technology for Lucas County, Ohio: a hybrid analysis. Update on current wetlands research in GISAG Nathan Torbick Spring 2003 Component One Remote
NON-PHOTOGRAPHIC SYSTEMS: Multispectral Scanners Medium and coarse resolution sensor comparisons: Landsat, SPOT, AVHRR and MODIS
 NON-PHOTOGRAPHIC SYSTEMS: Multispectral Scanners Medium and coarse resolution sensor comparisons: Landsat, SPOT, AVHRR and MODIS CLASSIFICATION OF NONPHOTOGRAPHIC REMOTE SENSORS PASSIVE ACTIVE DIGITAL
Activity Data (AD) Monitoring in the frame of REDD+ MRV
 Monitoring in the frame of REDD+ MRV") Activity Data (AD) Monitoring in the frame of REDD+ MRV Preliminary comments REDD+ is sustainable low emissions, high carbon rural development Monitoring efforts should support this effort Challenges Diversity
Activity Data (AD) Monitoring in the frame of REDD+ MRV Preliminary comments REDD+ is sustainable low emissions, high carbon rural development Monitoring efforts should support this effort Challenges Diversity
Chapter 8. Using the GLM
 Chapter 8 Using the GLM This chapter presents the type of change products that can be derived from a GLM enhanced change detection procedure. One advantage to GLMs is that they model the probability of
BIOME SHIFTS IN SIBERIAN ARCTIC TUNDRA: EVIDENCE FROM FIVE DECADES OF SPACE-BASED EARTH OBSERVATION. Gerald V. Frost and Howard E.
 BIOME SHIFTS IN SIBERIAN ARCTIC TUNDRA: EVIDENCE FROM FIVE DECADES OF SPACE-BASED EARTH OBSERVATION Gerald V. Frost and Howard E. Epstein (advisor) Department of Environmental Sciences, University of Virginia,
Green/Blue Metrics Meeting June 20, 2017 Summary
 Short round table introductions of participants Paul Villenueve, Carleton, Co-lead Green/Blue, Matilda van den Bosch, UBC, Co-lead Green/Blue Dan Crouse, UNB Lorien Nesbitt, UBC Audrey Smargiassi, Uof
REMOTE SENSING OF RIVERINE WATER BODIES
 REMOTE SENSING OF RIVERINE WATER BODIES Bryony Livingston, Paul Frazier and John Louis Farrer Research Centre Charles Sturt University Wagga Wagga, NSW 2678 Ph 02 69332317, Fax 02 69332737 blivingston@csu.edu.au
Black Dot shows actual Point location
 207 Plate 1 Use of scanned archive aerial photographs, digital photogrammetry and GIS to plot river channel erosion along the Afon Trannon, Wales (part of the study by Mount et al 2000, 2003). Plate 2
MULTI-TEMPORAL IMAGE ANALYSIS OF THE COASTAL WATERSHED, NH INTRODUCTION
 MULTI-TEMPORAL IMAGE ANALYSIS OF THE COASTAL WATERSHED, NH Meghan Graham MacLean, PhD Student Alexis M. Rudko, MS Student Dr. Russell G. Congalton, Professor Department of Natural Resources and the Environment
Using Color-Infrared Imagery for Impervious Surface Analysis. Chris Behee City of Bellingham Planning & Community Development
 Using Color-Infrared Imagery for Impervious Surface Analysis. Chris Behee City of Bellingham Planning & Community Development NW GIS Users Group - March 18, 2005 Outline What is Color Infrared Imagery?
Assessment of Spatiotemporal Changes in Vegetation Cover using NDVI in The Dangs District, Gujarat
 Assessment of Spatiotemporal Changes in Vegetation Cover using NDVI in The Dangs District, Gujarat Using SAGA GIS and Quantum GIS Tutorial ID: IGET_CT_003 This tutorial has been developed by BVIEER as
Increased wetness confounds Landsat-derived NDVI trends in the central Alaska North Slope region,
 Increased wetness confounds Landsat-derived s in the central Alaska North Slope region, 1985 2011 Martha K Raynolds and Donald A Walker Institute of Arctic Biology, University of Alaska Fairbanks, P O
APCAS/10/21 April 2010 ASIA AND PACIFIC COMMISSION ON AGRICULTURAL STATISTICS TWENTY-THIRD SESSION. Siem Reap, Cambodia, April 2010
 APCAS/10/21 April 2010 Agenda Item 8 ASIA AND PACIFIC COMMISSION ON AGRICULTURAL STATISTICS TWENTY-THIRD SESSION Siem Reap, Cambodia, 26-30 April 2010 The Use of Remote Sensing for Area Estimation by Robert
Geo/SAT 2 TROPICAL WET REALMS OF CENTRAL AFRICA, PART II
 Geo/SAT 2 TROPICAL WET REALMS OF CENTRAL AFRICA, PART II Paul R. Baumann Professor of Geography (Emeritus) State University of New York College at Oneonta Oneonta, New York 13820 USA COPYRIGHT 2009 Paul
Image interpretation and analysis
 Image interpretation and analysis Grundlagen Fernerkundung, Geo 123.1, FS 2014 Lecture 7a Rogier de Jong Michael Schaepman Why are snow, foam, and clouds white? Why are snow, foam, and clouds white? Today
The availability of cloud free Landsat TM and ETM+ land observations and implications for global Landsat data production
 14475 The availability of cloud free Landsat TM and ETM+ land observations and implications for global Landsat data production *V. Kovalskyy, D. Roy (South Dakota State University) SUMMARY The NASA funded
Image interpretation I and II
 Image interpretation I and II Looking at satellite image, identifying different objects, according to scale and associated information and to communicate this information to others is what we call as IMAGE
Exploring the Earth with Remote Sensing: Tucson
 Exploring the Earth with Remote Sensing: Tucson Project ASTRO Chile March 2006 1. Introduction In this laboratory you will explore Tucson and its surroundings with remote sensing. Remote sensing is the
Center for Advanced Land Management Information Technologies (CALMIT), School of Natural Resources, University of Nebraska-Lincoln
, School of Natural Resources, University of Nebraska-Lincoln") Geoffrey M. Henebry, Andrés Viña, and Anatoly A. Gitelson Center for Advanced Land Management Information Technologies (CALMIT), School of Natural Resources, University of Nebraska-Lincoln Introduction
Geoffrey M. Henebry, Andrés Viña, and Anatoly A. Gitelson Center for Advanced Land Management Information Technologies (CALMIT), School of Natural Resources, University of Nebraska-Lincoln Introduction
Quantifying Change in. Quality Effects on a. Wetland Extent & Wetland. Western and Clark s Grebe Breeding Population
 Quantifying Change in Wetland Extent & Wetland Quality Effects on a Western and Clark s Grebe Breeding Population Eagle Lake, CA: 1998-2010 Renée E. Robison 1, Daniel W. Anderson 2,3, and Kristofer M.
Urban Classification of Metro Manila for Seismic Risk Assessment using Satellite Images
 Urban Classification of Metro Manila for Seismic Risk Assessment using Satellite Images Fumio YAMAZAKI/ yamazaki@edm.bosai.go.jp Hajime MITOMI/ mitomi@edm.bosai.go.jp Yalkun YUSUF/ yalkun@edm.bosai.go.jp
Introduction. Introduction. Introduction. Introduction. Introduction
 Identifying habitat change and conservation threats with satellite imagery Extinction crisis Volker Radeloff Department of Forest Ecology and Management Extinction crisis Extinction crisis Conservationists
Malaria Vector in Northeastern Venezuela. Sarah Anne Guagliardo MPH candidate, 2010 Yale University School of Epidemiology and Public Health
 Vegetation associated with the An. Aquasalis Malaria Vector in Northeastern Venezuela Sarah Anne Guagliardo g MPH candidate, 2010 Yale University School of Epidemiology and Public Health Outline Problem
A Project to Map and Monitor Baldcypress Forests in Coastal Louisiana, using Landsat, MODIS, and ASTER Satellite Data
 A Project to Map and Monitor Baldcypress Forests in Coastal Louisiana, using Landsat, MODIS, and ASTER Satellite Data Presented to the 2012 Louisiana RS/GIS Workshop by: Joseph Spruce, Computer Sciences
Irina SMIRNOVA, Alexandra RUSANOVA
 Irina SMIRNOVA, Alexandra RUSANOVA Monitoring of Landscape Changes Due to Petroleum Fields Exploitation, Construction of Oil Pipelines and Oil Terminal in the Northern Part of the Timan-Pechorian Petroleum
REMOTE SENSING INTERPRETATION
 REMOTE SENSING INTERPRETATION Jan Clevers Centre for Geo-Information - WU Remote Sensing --> RS Sensor at a distance EARTH OBSERVATION EM energy Earth RS is a tool; one of the sources of information! 1
The techniques with ERDAS IMAGINE include:
 The techniques with ERDAS IMAGINE include: 1. Data correction - radiometric and geometric correction 2. Radiometric enhancement - enhancing images based on the values of individual pixels 3. Spatial enhancement
Aerial Image Acquisition and Processing Services. Ron Coutts, M.Sc., P.Eng. RemTech, October 15, 2014
 Aerial Image Acquisition and Processing Services Ron Coutts, M.Sc., P.Eng. RemTech, October 15, 2014 Outline Applications & Benefits Image Sources Aircraft Platforms Image Products Sample Images & Comparisons
Introduction to Remote Sensing
 Introduction to Remote Sensing Spatial, spectral, temporal resolutions Image display alternatives Vegetation Indices Image classifications Image change detections Accuracy assessment Satellites & Air-Photos
Using NDVI dynamics as an indicator of native vegetation management in a heterogeneous and highly fragmented landscape
 20th International Congress on Modelling and Simulation, Adelaide, Australia, 1 6 December 2013 www.mssanz.org.au/modsim2013 Using NDVI dynamics as an indicator of native vegetation management in a heterogeneous
Geocoding DoubleCheck: A Unique Location Accuracy Assessment Tool for Parcel-level Geocoding
 Measuring, Modelling and Mapping our Dynamic Home Planet Geocoding DoubleCheck: A Unique Location Accuracy Assessment Tool for Parcel-level Geocoding Page 1 Geocoding is a process of converting an address
Mangrove Forest Distributions of the World
 Mangrove Forest Distributions of the World Chandra Giri - ARTS/EROS/USGS Ochieng, E. - United Nations Environment Programme Larry Tieszen USGS EROS Zhiliang Zhu - USGS Ashbindu Singh United Nations Environment
Contents Remote Sensing for Studying Earth Surface and Changes
 Contents Remote Sensing for Studying Earth Surface and Changes Anupma Prakash Day : Tuesday Date : September 26, 2008 Audience : AMIDST Participants What is remote sensing? How does remote sensing work?
Using Multi-spectral Imagery in MapInfo Pro Advanced
 Using Multi-spectral Imagery in MapInfo Pro Advanced MapInfo Pro Advanced Tom Probert, Global Product Manager MapInfo Pro Advanced: Intuitive interface for using multi-spectral / hyper-spectral imagery
DISTINGUISHING URBAN BUILT-UP AND BARE SOIL FEATURES FROM LANDSAT 8 OLI IMAGERY USING DIFFERENT DEVELOPED BAND INDICES
 DISTINGUISHING URBAN BUILT-UP AND BARE SOIL FEATURES FROM LANDSAT 8 OLI IMAGERY USING DIFFERENT DEVELOPED BAND INDICES Mark Daryl C. Janiola (1), Jigg L. Pelayo (1), John Louis J. Gacad (1) (1) Central
Remote Sensing Phenology. Bradley Reed Principal Scientist USGS National Center for Earth Resources Observation and Science Sioux Falls, SD
 Remote Sensing Phenology Bradley Reed Principal Scientist USGS National Center for Earth Resources Observation and Science Sioux Falls, SD Remote Sensing Phenology Potential to provide wall-to-wall phenology
Field size estimation, past and future opportunities
 Field size estimation, past and future opportunities Lin Yan & David Roy Geospatial Sciences Center of Excellence South Dakota State University February 13-15 th 2018 Advances in Emerging Technologies
EXPLORING THE POTENTIAL FOR A FUSED LANDSAT-MODIS SNOW COVERED AREA PRODUCT. David Selkowitz 1 ABSTRACT INTRODUCTION
 EXPLORING THE POTENTIAL FOR A FUSED LANDSAT-MODIS SNOW COVERED AREA PRODUCT David Selkowitz 1 ABSTRACT Results from nine 3 x 3 km study areas in the Rocky Mountains of Colorado, USA demonstrate there is
Important Missions. weather forecasting and monitoring communication navigation military earth resource observation LANDSAT SEASAT SPOT IRS
 Fundamentals of Remote Sensing Pranjit Kr. Sarma, Ph.D. Assistant Professor Department of Geography Mangaldai College Email: prangis@gmail.com Ph. No +91 94357 04398 Remote Sensing Remote sensing is defined
Image transformations
 Image transformations Digital Numbers may be composed of three elements: Atmospheric interference (e.g. haze) ATCOR Illumination (angle of reflection) - transforms Albedo (surface cover) Image transformations
A Study of the Mississippi River Delta Using Remote Sensing
 1 University of Puerto Rico Mayagüez Campus PO BOX 9000 Mayagüez PR 00681-9000 Tel: (787) 832-4040 A Study of the Mississippi River Delta Using Remote Sensing Meganlee Rivera 1, Imaryarie Rivera 1 Department
Global Land Survey 2005
 Global Land Survey 2005 Jeff Masek, Shannon Franks, Terry Arvidson NASA GSFC Rachel Headley, Steve Covington USGS EROS April, 2008 1 Global Land Survey (GLS 2005) Follow-on to the GeoCover orthorectified
Using Freely Available. Remote Sensing to Create a More Powerful GIS
 Using Freely Available Government Data and Remote Sensing to Create a More Powerful GIS All rights reserved. ENVI, E3De, IAS, and IDL are trademarks of Exelis, Inc. All other marks are the property of
Monitoring of mine tailings using satellite and lidar data
 Surveying Monitoring of mine tailings using satellite and lidar data by Prevlan Chetty, Southern Mapping Geospatial This study looks into the use of high resolution satellite imagery from RapidEye and
Environmental Remote Sensing GEOG 2021
 Environmental Remote Sensing GEOG 2021 Lecture 2 Image display and enhancement 2 Image Display and Enhancement Purpose visual enhancement to aid interpretation enhancement for improvement of information
In late April of 1986 a nuclear accident damaged a reactor at the Chernobyl nuclear
 CHERNOBYL NUCLEAR POWER PLANT ACCIDENT Long Term Effects on Land Use Patterns Project Introduction: In late April of 1986 a nuclear accident damaged a reactor at the Chernobyl nuclear power plant in Ukraine.
LAND USE MAP PRODUCTION BY FUSION OF MULTISPECTRAL CLASSIFICATION OF LANDSAT IMAGES AND TEXTURE ANALYSIS OF HIGH RESOLUTION IMAGES
 LAND USE MAP PRODUCTION BY FUSION OF MULTISPECTRAL CLASSIFICATION OF LANDSAT IMAGES AND TEXTURE ANALYSIS OF HIGH RESOLUTION IMAGES Xavier OTAZU, Roman ARBIOL Institut Cartogràfic de Catalunya, Spain xotazu@icc.es,
CLASSIFICATION OF HISTORIC LAKES AND WETLANDS
 CLASSIFICATION OF HISTORIC LAKES AND WETLANDS Golden Valley, Minnesota Image Analysis Heather Hegi & Kerry Ritterbusch 12/13/2010 Bassett Creek and Theodore Wirth Golf Course, 1947 FR 5262 Remote Sensing
RGB colours: Display onscreen = RGB
 RGB colours: http://www.colorspire.com/rgb-color-wheel/ Display onscreen = RGB DIGITAL DATA and DISPLAY Myth: Most satellite images are not photos Photographs are also 'images', but digital images are
Background Objectives Study area Methods. Conclusions and Future Work Acknowledgements
 A DIGITAL PROCESSING AND DATA COMPILATION APPROACH FOR USING REMOTELY SENSED IMAGERY TO IDENTIFY GEOLOGICAL LINEAMENTS IN HARD-ROCK ROCK TERRAINS: AN APPLICATION FOR GROUNDWATER EXPLORATION IN NICARAGUA
CanImage. (Landsat 7 Orthoimages at the 1: Scale) Standards and Specifications Edition 1.0
 Standards and Specifications Edition 1.0") CanImage (Landsat 7 Orthoimages at the 1:50 000 Scale) Standards and Specifications Edition 1.0 Centre for Topographic Information Customer Support Group 2144 King Street West, Suite 010 Sherbrooke, QC
CanImage (Landsat 7 Orthoimages at the 1:50 000 Scale) Standards and Specifications Edition 1.0 Centre for Topographic Information Customer Support Group 2144 King Street West, Suite 010 Sherbrooke, QC
An Introduction to Remote Sensing & GIS. Introduction
 An Introduction to Remote Sensing & GIS Introduction Remote sensing is the measurement of object properties on Earth s surface using data acquired from aircraft and satellites. It attempts to measure something
typical spectral signatures of photosynthetically active and non-photosynthetically active vegetation (Beeri et al., 2007)
") typical spectral signatures of photosynthetically active and non-photosynthetically active vegetation (Beeri et al., 2007) Xie, Y. et al. J Plant Ecol 2008 1:9-23; doi:10.1093/jpe/rtm005 Copyright restrictions
typical spectral signatures of photosynthetically active and non-photosynthetically active vegetation (Beeri et al., 2007) Xie, Y. et al. J Plant Ecol 2008 1:9-23; doi:10.1093/jpe/rtm005 Copyright restrictions
Satellite data processing and analysis: Examples and practical considerations
 Satellite data processing and analysis: Examples and practical considerations Dániel Kristóf Ottó Petrik, Róbert Pataki, András Kolesár International LCLUC Regional Science Meeting in Central Europe Sopron,
Comparing of Landsat 8 and Sentinel 2A using Water Extraction Indexes over Volta River
 Journal of Geography and Geology; Vol. 10, No. 1; 2018 ISSN 1916-9779 E-ISSN 1916-9787 Published by Canadian Center of Science and Education Comparing of Landsat 8 and Sentinel 2A using Water Extraction
Forest mapping and monitoring in Russia using EO data: R&D activity overview
 Russian Academy of Sciences Space Research Institute (IKI) Forest mapping and monitoring in Russia using EO data: R&D activity overview Sergey Bartalev 11.09 13.09.2017, 3rd User Workshop of the GlobBiomass
Introduction to Remote Sensing Fundamentals of Satellite Remote Sensing. Mads Olander Rasmussen
 Introduction to Remote Sensing Fundamentals of Satellite Remote Sensing Mads Olander Rasmussen (mora@dhi-gras.com) 01. Introduction to Remote Sensing DHI What is remote sensing? the art, science, and technology
What we can see from space; and how to link it to data and statistics
 What we can see from space; and how to link it to data and statistics Mohammed Said 1, Shem Kifugo 1, Madelene Ostwald 2, Gert Nyberg 3, and Lance Robinson 1 1 International Livestock Research Institute,
2016 Winter. / ASF News & Notes / 2016 Winter
 Home Get Data Datasets Data Tools About SAR News About ASF / ASF News & Notes / 2016 Winter Latest News 2016 Winter 2014 Fall 2014 Spring 2013 Summer 2013 Spring 2012 Winter 2012 Fall 2012 Summer 2012
Present and future of marine production in Boka Kotorska
 Present and future of marine production in Boka Kotorska First results from satellite remote sensing for the breeding areas of filter feeders in the Bay of Kotor INTRODUCTION Environmental monitoring is
Caatinga - Appendix. Collection 3. Version 1. General coordinator Washington J. S. Franca Rocha (UEFS)
") Caatinga - Appendix Collection 3 Version 1 General coordinator Washington J. S. Franca Rocha (UEFS) Team Diego Pereira Costa (UEFS/GEODATIN) Frans Pareyn (APNE) José Luiz Vieira (APNE) Rodrigo N. Vasconcelos
Caatinga - Appendix Collection 3 Version 1 General coordinator Washington J. S. Franca Rocha (UEFS) Team Diego Pereira Costa (UEFS/GEODATIN) Frans Pareyn (APNE) José Luiz Vieira (APNE) Rodrigo N. Vasconcelos
Dirty REMOTE SENSING Lecture 3: First Steps in classifying Stuart Green Earthobservation.wordpress.com
 Dirty REMOTE SENSING Lecture 3: First Steps in classifying Stuart Green Earthobservation.wordpress.com Stuart.Green@Teagasc.ie You have your image, but is it any good? Is it full of cloud? Is it the right
Digitization of Trail Network Using Remotely-Sensed Data in the CFB Suffield National Wildlife Area
 Digitization of Trail Network Using Remotely-Sensed Data in the CFB Suffield National Wildlife Area Brent Smith DLE 5-5 and Mike Tulis G3 GIS Technician Department of National Defence 27 March 2007 Introduction
LAND SURFACE TEMPERATURE MONITORING THROUGH GIS TECHNOLOGY USING SATELLITE LANDSAT IMAGES
 Abstract LAND SURFACE TEMPERATURE MONITORING THROUGH GIS TECHNOLOGY USING SATELLITE LANDSAT IMAGES Aurelian Stelian HILA, Zoltán FERENCZ, Sorin Mihai CIMPEANU University of Agronomic Sciences and Veterinary
VALIDATION OF CANADA-WIDE LAI/FPAR MAPS FROM SATELLITE IMAGERY*
 VALIDATION OF CANADA-WIDE LAI/FPAR MAPS FROM SATELLITE IMAGERY* J. M. Chen, L. Brown, J. Cihlar, S.G. Leblanc Environmental Monitoring Section Canada Centre for Remote Sensing, 588 Booth Street, 4th floor,
Lab 7 Julia Janicki. Introduction and methods
 Lab 7 Julia Janicki Introduction and methods The purpose of the lab is to map flood extent after a flooding event that occurred in Houston, Texas. Two Sentinel-1 images with C-band wavelength were used
Deputy Minister of Industry Tourism and Investment
 Deputy Minister of Industry Tourism and Investment 34th Annual Geoscience Forum (November 21, 2006) Key Messages/Speaking Points Introductory Comments It is a pleasure for me to be here at the 34th Annual
University of Texas at San Antonio EES 5053 Term Project CORRELATION BETWEEN NDVI AND SURFACE TEMPERATURES USING LANDSAT ETM + IMAGERY NEWFEL MAZARI
 University of Texas at San Antonio EES 5053 Term Project CORRELATION BETWEEN NDVI AND SURFACE TEMPERATURES USING LANDSAT ETM + IMAGERY NEWFEL MAZARI Introduction and Objectives The present study is a correlation
Application of Satellite Remote Sensing for Natural Disasters Observation
 Application of Satellite Remote Sensing for Natural Disasters Observation Prof. Krištof Oštir, Ph.D. University of Ljubljana Faculty of Civil and Geodetic Engineering Outline Earth observation current
to Geospatial Technologies
 What s in a Pixel? A Primer for Remote Sensing What s in a Pixel Development UNH Cooperative Extension Geospatial Technologies Training Center Shane Bradt UConn Cooperative Extension Geospatial Technology
Remote Sensing Part 3 Examples & Applications
 Remote Sensing Part 3 Examples & Applications Review: Spectral Signatures Review: Spectral Resolution Review: Computer Display of Remote Sensing Images Individual bands of satellite data are mapped to
Land cover change methods. Ned Horning
 Land cover change methods Ned Horning Version: 1.0 Creation Date: 2004-01-01 Revision Date: 2004-01-01 License: This document is licensed under a Creative Commons Attribution-Share Alike 3.0 Unported License.
IMPROVEMENT IN THE DETECTION OF LAND COVER CLASSES USING THE WORLDVIEW-2 IMAGERY
 IMPROVEMENT IN THE DETECTION OF LAND COVER CLASSES USING THE WORLDVIEW-2 IMAGERY Ahmed Elsharkawy 1,2, Mohamed Elhabiby 1,3 & Naser El-Sheimy 1,4 1 Dept. of Geomatics Engineering, University of Calgary
Earth Observation Products & Services in support of the Mining Industry
 Earth Observation Products & Services in support of the Mining Industry Stephen Coulson European Space Agency Directorate of Earth Observation Programmes ESA/ESRIN 27 April 2017, Lisbon 1 ESA Earth Observation
Monitoring the vegetation success of a rehabilitated mine site using multispectral UAV imagery. Tim Whiteside & Renée Bartolo, eriss
 Monitoring the vegetation success of a rehabilitated mine site using multispectral UAV imagery Tim Whiteside & Renée Bartolo, eriss About the Supervising Scientist Main roles Working to protect the environment
USGS Welcome. 38 th CEOS Working Group on Calibration and Validation Plenary (WGCV-38)
") Landsat 5 USGS Welcome Prepared for 38 th CEOS Working Group on Calibration and Validation Plenary (WGCV-38) Presenter Tom Cecere International Liaison USGS Land Remote Sensing Program Elephant Butte Reservoir
Landsat 5 USGS Welcome Prepared for 38 th CEOS Working Group on Calibration and Validation Plenary (WGCV-38) Presenter Tom Cecere International Liaison USGS Land Remote Sensing Program Elephant Butte Reservoir
AUTOMATIC DETECTION OF HEDGES AND ORCHARDS USING VERY HIGH SPATIAL RESOLUTION IMAGERY
 AUTOMATIC DETECTION OF HEDGES AND ORCHARDS USING VERY HIGH SPATIAL RESOLUTION IMAGERY Selim Aksoy Department of Computer Engineering, Bilkent University, Bilkent, 06800, Ankara, Turkey saksoy@cs.bilkent.edu.tr
Use of Satellite Remote Sensing in Monitoring Saltcedar Control along the Lower Pecos River, USA
 TR- 306 2007 Use of Satellite Remote Sensing in Monitoring Saltcedar Control along the Lower Pecos River, USA By Seiichi Nagihara Department of Geosciences, Texas Tech University, Lubbock, TX Charles R.
Remote Sensing. The following figure is grey scale display of SPOT Panchromatic without stretching.
 Remote Sensing Objectives This unit will briefly explain display of remote sensing image, geometric correction, spatial enhancement, spectral enhancement and classification of remote sensing image. At
Land Cover Type Changes Related to. Oil and Natural Gas Drill Sites in a. Selected Area of Williams County, ND
 Land Cover Type Changes Related to Oil and Natural Gas Drill Sites in a Selected Area of Williams County, ND FR 3262/5262 Lab Section 2 By: Andrew Kernan Tyler Kaebisch Introduction: In recent years, there
Image Band Transformations
 Image Band Transformations Content Band math Band ratios Vegetation Index Tasseled Cap Transform Principal Component Analysis (PCA) Decorrelation Stretch Image Band Transformation Purposes Image band transforms
Keywords: Agriculture, Olive Trees, Supervised Classification, Landsat TM, QuickBird, Remote Sensing.
 Classification of agricultural fields by using Landsat TM and QuickBird sensors. The case study of olive trees in Lesvos island. Christos Vasilakos, University of the Aegean, Department of Environmental
A SYNERGETIC USE OF REMOTE-SENSED DATA TO ASSESS THE EVOLUTION OF BURNT AREA BY WILDFIRES IN PORTUGAL
 A SYNERGETIC USE OF REMOTE-SENSED DATA TO ASSESS THE EVOLUTION OF BURNT AREA BY WILDFIRES IN PORTUGAL Teresa J. Calado and Carlos C. DaCamara CGUL, Faculty of Sciences, University of Lisbon, Campo Grande,
REMOTE SENSING FOR FLOOD HAZARD STUDIES.
 REMOTE SENSING FOR FLOOD HAZARD STUDIES. OPTICAL SENSORS. 1 DRS. NANETTE C. KINGMA 1 Optical Remote Sensing for flood hazard studies. 2 2 Floods & use of remote sensing. Floods often leaves its imprint
WGISS-42 USGS Agency Report
 WGISS-42 USGS Agency Report U.S. Department of the Interior U.S. Geological Survey Kristi Kline USGS EROS Center Major Activities Landsat Archive/Distribution Changes Land Change Monitoring, Assessment,
DIFFERENTIAL APPROACH FOR MAP REVISION FROM NEW MULTI-RESOLUTION SATELLITE IMAGERY AND EXISTING TOPOGRAPHIC DATA
 DIFFERENTIAL APPROACH FOR MAP REVISION FROM NEW MULTI-RESOLUTION SATELLITE IMAGERY AND EXISTING TOPOGRAPHIC DATA Costas ARMENAKIS Centre for Topographic Information - Geomatics Canada 615 Booth Str., Ottawa,
Satellite Remote Sensing: Earth System Observations
 Satellite Remote Sensing: Earth System Observations Land surface Water Atmosphere Climate Ecosystems 1 EOS (Earth Observing System) Develop an understanding of the total Earth system, and the effects of
CURRENT SCENARIO AND CHALLENGES IN THE ANALYSIS OF MULTITEMPORAL REMOTE SENSING IMAGES
 Remote Sensing Laboratory Dept. of Information Engineering and Computer Science University of Trento Via Sommarive, 14, I-38123 Povo, Trento, Italy CURRENT SCENARIO AND CHALLENGES IN THE ANALYSIS OF MULTITEMPORAL
Introduction of Satellite Remote Sensing
 Introduction of Satellite Remote Sensing Spatial Resolution (Pixel size) Spectral Resolution (Bands) Resolutions of Remote Sensing 1. Spatial (what area and how detailed) 2. Spectral (what colors bands)