Quantifying Change in. Quality Effects on a. Wetland Extent & Wetland. Western and Clark s Grebe Breeding Population
|
|
|
- Gwendoline Stone
- 5 years ago
- Views:
Transcription


1 Quantifying Change in Wetland Extent & Wetland Quality Effects on a Western and Clark s Grebe Breeding Population Eagle Lake, CA: Renée E. Robison 1, Daniel W. Anderson 2,3, and Kristofer M. Robison
2 Outline Background Focal Species Study Site Hypothesis Methods Results Discussion 2
 Western Grebe (Aechmophorus")
3 Focal Species Clark s Grebe (Aechmophorus clarkii) Western Grebe (Aechmophorus occidentalis) 3

4 Western and Clark s Grebe Ecology Colonial nesting species Inland lakes and reservoirs Highly wetland dependent Flooded wetland vegetation Nests placed in water >25cm deep Floating nest structures jeffrichphoto.com 4

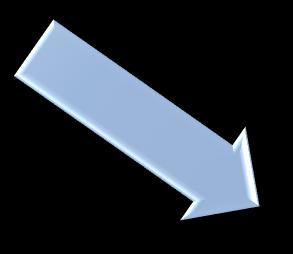
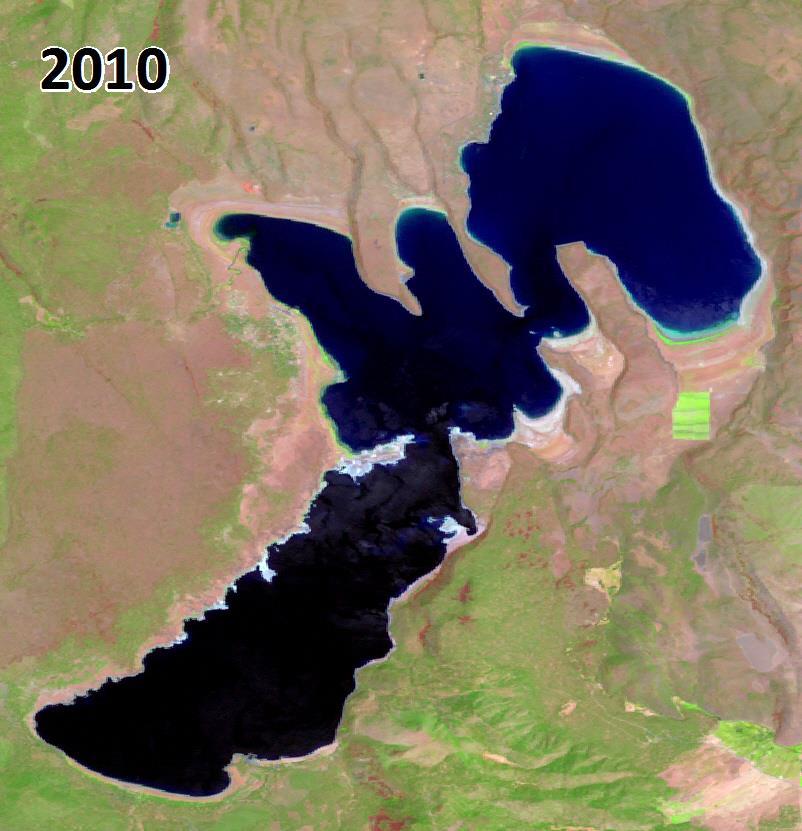
5 Study Site EAGLE LAKE, CALIFORNIA Lassen County 27km (17mi) N of Susanville Closed-drainage system Lake level highly variable Run-off Precipitation Evaporation Ground-flow 5

6 Study Site EAGLE LAKE, CALIFORNIA Intermountain west population Grebe nesting locations Spaulding Stone s Bay Grebe monitoring


7 Hypothesis Habitat Availability Lake Level Habitat Quality Populationlevel breeding success 7
8 Outline Background Methods Data Collection Remote Sensing Statistical Analysis Results Discussion 8

9 Methods - Data Collection FIELD SURVEY Pelagic-strip transects Out to 200m LAKE LEVEL DATA Provided courtesy of Lassen County Public Works 9

10 Methods - Remote Sensing IMAGERY ACQUISITION LandSat Thematic Mapper (TM) 4 5 USGS Earth Explorer website Annual peak nesting dates + 2 weeks Dependent on: Availability Cloud cover 10
 Display using natural color band")

11 Methods - Remote Sensing PRE-PROCESSING Generate composite rasters (TM bands 1 7) Display using natural color band combination (R: 5, G: 4, B:3) Digitize lake surface area polygons Clip rasters to surface area polygons using Raster Processing Clip tool 11
 NDVI estimates: Relative biomass Density")
12 Methods - Remote Sensing IMAGE ANALYSIS Classification Using ArcMap s Image Analysis tool Normalized Difference Vegetation Index (NDVI) NDVI estimates: Relative biomass Density Intensity 12
13 Methods - Remote Sensing POST-PROCESSING Using ArcMap s Spatial Analyst Reclassify tool Manual classification with 2 classes Non-wetland Wetland Raster Conversion Conversion Tool s Raster to Polygon tool Wetland polygons 13
 Column")
14 Methods - Remote Sensing HABITAT INDICES Habitat Availability Index % Wetland Entire lake surface Clip NDVI raster to wetland polygons Add Field in clipped NDVI attribute table Habitat Quality Index Mean of NDVI pixel values Entire wetland extent surface Field Calculator (Value*Count) Column statistics 14
15 Methods - Statistical Analysis INFORMATION-THEORETIC APPROACH N = a-priori candidate models Ranked via Akaike Information Criterion (AIC c ) Lowest AIC c Highest Akaike weight (w i ) Lowest Evidence Ratio VARIABLES Response Productivity (YY Ad -1 ) Predictors Lake Level (m AMSL) Habitat Availability Habitat Quality Year 15
16 Outline Background Methods Results Inter-annual changes Predictor variables Response variable Model Selection Discussion 16
17 Lake Level (m AMSL) Results - Lake Level (No Data) Year Data courtesy of Lassen County Public Works 17

18 Results Lake Level 18
19 Habitat Availability Index Results - Habitat Availability Year 19

20 Results - Habitat Availability 20
21 Habitat Availability Animation 21
22 Habitat Quality Index Results Habitat Quality Year 22
23 Productivity (YY Ad -1 ) Results - Productivity (No Data) Year 23
24 Results Model Selection Candidate Models AIC c (1) Habitat Availability (2) Habitat Quality (3) Year, Habitat Availability, Interaction 1.11 (4) Lake Level, Habitat Availability, Interaction 1.31 (5) Habitat Quality, Habitat Availability, Interaction 2.76 (6) Year 2.93 (7) Lake Level 3.72 (8) Year, Habitat Quality, Interaction 4.31 (9) Lake Level, Habitat Quality, Interaction 5.50 (10) Year, Lake Level, Interaction 9.57 (11) Year, Lake Level, Habitat Availability, Habitat Quality
25 Results Model Selection < 95% CREDIBILITY SET OF MODELS PREDICTING PRODUCTIVITY (YY AD -1 ) Model AIC c AIC c w i w i Ratio Evidence (1) Habitat Availability (2) Habitat Quality (3) Year, Habitat Availability, Interaction
26 Results - Habitat Availability Productivity = *Exp(-97.33*[% Wetland]) Reproductive rates increase exponentially with increasing wetland habitat availability. 26
27 Results Habitat Quality Productivity = *Habitat Quality Reproductive rates are positively correlated with more robust wetland vegetation. 27
28 Results HABITAT AVAILABILITY VS. PRODUCTIVITY LAKE LEVEL VS. HABITAT AVAILABILITY 28
29 Results HABITAT QUALITY VS. PRODUCTIVITY LAKE LEVEL VS. HABITAT QUALITY 29
30 Outline Background Methods Results Discussion Conclusions Drought Management Recommendations 30

31 Discussion Our study Habitat availability and quality Lake level Drought continues No nesting at Eagle Lake since 2011 No habitat available Consider over-water nesting species Allow optimal habitat availability Not strict stabilization 31


32 Acknowledgements Jeff Davis, Frank Gress, Khem So, John & Tracy Crowe, & John Eadie American Trader Trustee Council Kure/Stuyvesant Trustee Council Henry A. Jastro & Peter J. Shields Research Award 32

33 Questions? Renée E. Robison 33
Lesson 9: Multitemporal Analysis
 Lesson 9: Multitemporal Analysis Lesson Description Multitemporal change analyses require the identification of features and measurement of their change through time. In this lesson, we will examine vegetation
Land Cover Type Changes Related to. Oil and Natural Gas Drill Sites in a. Selected Area of Williams County, ND
 Land Cover Type Changes Related to Oil and Natural Gas Drill Sites in a Selected Area of Williams County, ND FR 3262/5262 Lab Section 2 By: Andrew Kernan Tyler Kaebisch Introduction: In recent years, there
Relationship Between Landsat 8 Spectral Reflectance and Chlorophyll-a in Grand Lake, Oklahoma
 Relationship Between Landsat 8 Spectral Reflectance and Chlorophyll-a in Grand Lake, Oklahoma Presented by: Abu Mansaray Research Team Dr. Andrew Dzialowski (PI), Oklahoma State University Dr. Scott Stoodley
Detecting artificial areas inside reference parcels. A technique to assist the evaluation of non-eligibility in agriculture
 1 Detecting artificial areas inside reference parcels. A technique to assist the evaluation of non-eligibility in agriculture R. de Kok, C.Wirnhardt EC Joint Research Centre, IES Motivation Wall-to-wall
LAND SURFACE TEMPERATURE MONITORING THROUGH GIS TECHNOLOGY USING SATELLITE LANDSAT IMAGES
 Abstract LAND SURFACE TEMPERATURE MONITORING THROUGH GIS TECHNOLOGY USING SATELLITE LANDSAT IMAGES Aurelian Stelian HILA, Zoltán FERENCZ, Sorin Mihai CIMPEANU University of Agronomic Sciences and Veterinary
Detecting and Mapping Invasive Phragmites australis in the Coastal Great Lakes with ALOS PALSAR Imagery
 Detecting and Mapping Invasive Phragmites australis in the Coastal Great Lakes with ALOS PALSAR Imagery Brian Huberty U.S Fish & Wildlife Service Region 3 Ecological Services Laura L. Bourgeau-Chavez,
HOW THE OTHER HALF LIVES: MONARCH POPULATION TRENDS WEST OF THE GREAT DIVIDE SHAWNA STEVENS AND DENNIS FREY. Biological Sciences Department
 HOW THE OTHER HALF LIVES: MONARCH POPULATION TRENDS WEST OF THE GREAT DIVIDE SHAWNA STEVENS AND DENNIS FREY Biological Sciences Department California Polytechnic State University San Luis Obispo, California
MULTI-TEMPORAL IMAGE ANALYSIS OF THE COASTAL WATERSHED, NH INTRODUCTION
 MULTI-TEMPORAL IMAGE ANALYSIS OF THE COASTAL WATERSHED, NH Meghan Graham MacLean, PhD Student Alexis M. Rudko, MS Student Dr. Russell G. Congalton, Professor Department of Natural Resources and the Environment
Remote Sensing in an
 Chapter 15: Spatial Enhancement of Landsat Imagery Remote Sensing in an ArcMap Environment Remote Sensing Analysis in an ArcMap Environment Tammy E. Parece Image source: landsat.usgs.gov Tammy Parece James
Introduction to Remote Sensing
 Introduction to Remote Sensing Spatial, spectral, temporal resolutions Image display alternatives Vegetation Indices Image classifications Image change detections Accuracy assessment Satellites & Air-Photos
Spatial Analyst is an extension in ArcGIS specially designed for working with raster data.
 Spatial Analyst is an extension in ArcGIS specially designed for working with raster data. 1 Do you remember the difference between vector and raster data in GIS? 2 In Lesson 2 you learned about the difference
Remote Sensing for Rangeland Applications
 Remote Sensing for Rangeland Applications Jay Angerer Ecological Training June 16, 2012 Remote Sensing The term "remote sensing," first used in the United States in the 1950s by Ms. Evelyn Pruitt of the
Application of GIS and RS in Studying Shorebird Ecology
 Jackie Claver NRS 509 12/14/17 Application of GIS and RS in Studying Shorebird Ecology Over half of the 75 shorebird species in the Western Hemisphere are in decline due to loss and degradation of coastal
NON-PHOTOGRAPHIC SYSTEMS: Multispectral Scanners Medium and coarse resolution sensor comparisons: Landsat, SPOT, AVHRR and MODIS
 NON-PHOTOGRAPHIC SYSTEMS: Multispectral Scanners Medium and coarse resolution sensor comparisons: Landsat, SPOT, AVHRR and MODIS CLASSIFICATION OF NONPHOTOGRAPHIC REMOTE SENSORS PASSIVE ACTIVE DIGITAL
RGB colours: Display onscreen = RGB
 RGB colours: http://www.colorspire.com/rgb-color-wheel/ Display onscreen = RGB DIGITAL DATA and DISPLAY Myth: Most satellite images are not photos Photographs are also 'images', but digital images are
Black-crowned Night-heron Minnesota Conservation Summary
 Credit Deborah Reynolds Black-crowned Night-heron Minnesota Conservation Summary Audubon Minnesota Spring 2014 The Blueprint for Minnesota Bird Conservation is a project of Audubon Minnesota written by
Report Date: March 25, Prepared by. David Arsenault Plumas Audubon Society 429 Main Street Quincy, CA Summary
 Audubon s Aechmophorus Grebe Conservation Project Comprehensive Monitoring Report: 2010-2014 Plumas and Lassen Counties, California Report Date: March 25, 2015 Prepared by David Arsenault Plumas Audubon
Chapter 8. Using the GLM
 Chapter 8 Using the GLM This chapter presents the type of change products that can be derived from a GLM enhanced change detection procedure. One advantage to GLMs is that they model the probability of
Detecting and Mapping Invasive Phragmites australis in the coastal Great Lakes with ALOS PALSAR imagery
 Detecting and Mapping Invasive Phragmites australis in the coastal Great Lakes with ALOS PALSAR imagery Laura L. Bourgeau-Chavez, Kirk Scarbrough, Liza Jenkins, Kevin Riordan, Richard Powell, Colin Brooks,
Digitization of Trail Network Using Remotely-Sensed Data in the CFB Suffield National Wildlife Area
 Digitization of Trail Network Using Remotely-Sensed Data in the CFB Suffield National Wildlife Area Brent Smith DLE 5-5 and Mike Tulis G3 GIS Technician Department of National Defence 27 March 2007 Introduction
In late April of 1986 a nuclear accident damaged a reactor at the Chernobyl nuclear
 CHERNOBYL NUCLEAR POWER PLANT ACCIDENT Long Term Effects on Land Use Patterns Project Introduction: In late April of 1986 a nuclear accident damaged a reactor at the Chernobyl nuclear power plant in Ukraine.
Documenting Land Cover and Vegetation Productivity Changes in the NWT using the Landsat Satellite Archive
 Documenting Land Cover and Vegetation Productivity Changes in the NWT using the Landsat Satellite Archive Fraser, R.H 1, Olthof, I. 1, Deschamps, A. 1, Pregitzer, M. 1, Kokelj, S. 2, Lantz, T. 3,Wolfe,
Raster is faster but vector is corrector
 Account not required Raster is faster but vector is corrector The old GIS adage raster is faster but vector is corrector comes from the two different fundamental GIS models: vector and raster. Each of
Land Remote Sensing Lab 4: Classication and Change Detection Assigned: October 15, 2017 Due: October 27, Classication
 Name: Land Remote Sensing Lab 4: Classication and Change Detection Assigned: October 15, 2017 Due: October 27, 2017 In this lab, you will generate several gures. Please sensibly name these images, save
Mapping Open Water Bodies with Optical Remote Sensing
 Mapping Open Water Bodies with Optical Remote Sensing M. O Donnell 1,2 and E. Podest 1 1.Jet Propulsion Laboratory, California Institute of Technology 2 Alliance Gertz-Ressler High School, Los Angeles,
May 25, 2005 Forum Meeting
 Photos by Peter LaTourrette and PRBO Effects of South San Francisco Bay Habitat Restoration on ing the Effects of Birds Restoration on South San Francisco Bay Bird Communities Nils Warnock, PhD; Diana
University of Texas at San Antonio EES 5053 Term Project CORRELATION BETWEEN NDVI AND SURFACE TEMPERATURES USING LANDSAT ETM + IMAGERY NEWFEL MAZARI
 University of Texas at San Antonio EES 5053 Term Project CORRELATION BETWEEN NDVI AND SURFACE TEMPERATURES USING LANDSAT ETM + IMAGERY NEWFEL MAZARI Introduction and Objectives The present study is a correlation
Successful Solutions to Global Biodiversity Data Digitization, Validation, Update, Integration, Access, and Application
 Successful Solutions to Global Biodiversity Data Digitization, Validation, Update, Integration, Access, and Application T. Hermann, G. Cotter, T. Lahr - USGS J. Hill and C. Wilson - WDCBE CODATA 2006;
Remote Sensing Part 3 Examples & Applications
 Remote Sensing Part 3 Examples & Applications Review: Spectral Signatures Review: Spectral Resolution Review: Computer Display of Remote Sensing Images Individual bands of satellite data are mapped to
A Study of the Mississippi River Delta Using Remote Sensing
 1 University of Puerto Rico Mayagüez Campus PO BOX 9000 Mayagüez PR 00681-9000 Tel: (787) 832-4040 A Study of the Mississippi River Delta Using Remote Sensing Meganlee Rivera 1, Imaryarie Rivera 1 Department
Remote Sensing Mapping of Turbidity in the Upper San Francisco Estuary. Francine Mejia, Geography 342
 Remote Sensing Mapping of Turbidity in the Upper San Francisco Estuary Francine Mejia, Geography 342 Introduction The sensitivity of reflectance to sediment, chlorophyll a, and colored DOM (CDOM) in the
CLASSIFICATION OF HISTORIC LAKES AND WETLANDS
 CLASSIFICATION OF HISTORIC LAKES AND WETLANDS Golden Valley, Minnesota Image Analysis Heather Hegi & Kerry Ritterbusch 12/13/2010 Bassett Creek and Theodore Wirth Golf Course, 1947 FR 5262 Remote Sensing
Visualizing a Pixel. Simulate a Sensor s View from Space. In this activity, you will:
 Simulate a Sensor s View from Space In this activity, you will: Measure and mark pixel boundaries Learn about spatial resolution, pixels, and satellite imagery Classify land cover types Gain exposure to
NRS 415 Remote Sensing of Environment
 NRS 415 Remote Sensing of Environment 1 High Oblique Perspective (Side) Low Oblique Perspective (Relief) 2 Aerial Perspective (See What s Hidden) An example of high spatial resolution true color remote
Remote Sensing in an
 Chapter 20: Accuracy Assessment Remote Sensing in an ArcMap Environment Remote Sensing Analysis in an ArcMap Environment Tammy E. Parece Image source: landsat.usgs.gov Tammy Parece James Campbell John
Aechmophorus Grebe Conservation Project Almanor, Eagle, Davis, and Antelope Lakes. March 1 October 15, Prepared by
 Aechmophorus Grebe Conservation Project March 1 October 15, 2015 Prepared by Plumas Audubon Society 429 Main Street Quincy, CA 95971 Prepared for Audubon California 765 University Avenue Sacramento, CA
Assessing the Importance of Wetlands on DoD Installations for the Persistence of Wetland-Dependent Birds in North America (Legacy )
") Assessing the Importance of Wetlands on DoD Installations for the Persistence of Wetland-Dependent Birds in North America (Legacy 12-610) Abstract Wetlands are among the most imperiled ecosystems in the
Assessing the Importance of Wetlands on DoD Installations for the Persistence of Wetland-Dependent Birds in North America (Legacy 12-610) Abstract Wetlands are among the most imperiled ecosystems in the
REMOTE SENSING OF RIVERINE WATER BODIES
 REMOTE SENSING OF RIVERINE WATER BODIES Bryony Livingston, Paul Frazier and John Louis Farrer Research Centre Charles Sturt University Wagga Wagga, NSW 2678 Ph 02 69332317, Fax 02 69332737 blivingston@csu.edu.au
Land Cover Change Analysis An Introduction to Land Cover Change Analysis using the Multispectral Image Data Analysis System (MultiSpec )
") Land Cover Change Analysis An Introduction to Land Cover Change Analysis using the Multispectral Image Data Analysis System (MultiSpec ) Level: Grades 9 to 12 Windows version With Teacher Notes Earth Observation
Land Cover Change Analysis An Introduction to Land Cover Change Analysis using the Multispectral Image Data Analysis System (MultiSpec ) Level: Grades 9 to 12 Windows version With Teacher Notes Earth Observation
Tiered Species Habitats (Terrestrial and Aquatic)
") Tiered Species Habitats (Terrestrial and Aquatic) Dataset Description Free-Bridge Area Map The Department of Game and Inland Fisheries (DGIF s) Tiered Species Habitat data shows the number of Tier 1, 2
Tiered Species Habitats (Terrestrial and Aquatic) Dataset Description Free-Bridge Area Map The Department of Game and Inland Fisheries (DGIF s) Tiered Species Habitat data shows the number of Tier 1, 2
Mud Slough Wetland Reserve BCS number: 47-19
 Mud Slough Wetland Reserve BCS number: 47-19 ***NOTE: We were unable to determine all necessary information for this site description. If you would like to contribute the needed information to this description,
Remote sensing in archaeology from optical to lidar. Krištof Oštir ModeLTER Scientific Research Centre of the Slovenian Academy of Sciences and Arts
 Remote sensing in archaeology from optical to lidar Krištof Oštir ModeLTER Scientific Research Centre of the Slovenian Academy of Sciences and Arts Introduction Optical remote sensing Systems Search for
Humboldt Bay NWR BCS number: 86-4
 Humboldt Bay NWR BCS number: 86-4 ***NOTE: We were unable to determine all necessary information for this site description. If you would like to contribute the needed information to this description, please
The effects of uncertainty in forest inventory plot locations. Ronald E. McRoberts, Geoffrey R. Holden, and Greg C. Liknes
 The effects of uncertainty in forest inventory plot locations Ronald E. McRoberts, Geoffrey R. Holden, and Greg C. Liknes North Central Research Station, USDA Forest Service, Saint Paul, Minnesota 55108
REMOTE SENSING. Topic 10 Fundamentals of Digital Multispectral Remote Sensing MULTISPECTRAL SCANNERS MULTISPECTRAL SCANNERS
 REMOTE SENSING Topic 10 Fundamentals of Digital Multispectral Remote Sensing Chapter 5: Lillesand and Keifer Chapter 6: Avery and Berlin MULTISPECTRAL SCANNERS Record EMR in a number of discrete portions
Land cover change methods. Ned Horning
 Land cover change methods Ned Horning Version: 1.0 Creation Date: 2004-01-01 Revision Date: 2004-01-01 License: This document is licensed under a Creative Commons Attribution-Share Alike 3.0 Unported License.
Managing and Monitoring Intertidal Oyster Reefs with Remote Sensing in Coastal South Carolina
 Managing and Monitoring Intertidal Oyster Reefs with Remote Sensing in Coastal South Carolina A cooperative effort between: Coastal Services Center South Carolina Department of Natural Resources City of
Urban Classification of Metro Manila for Seismic Risk Assessment using Satellite Images
 Urban Classification of Metro Manila for Seismic Risk Assessment using Satellite Images Fumio YAMAZAKI/ yamazaki@edm.bosai.go.jp Hajime MITOMI/ mitomi@edm.bosai.go.jp Yalkun YUSUF/ yalkun@edm.bosai.go.jp
Lecture 13: Remotely Sensed Geospatial Data
 Lecture 13: Remotely Sensed Geospatial Data A. The Electromagnetic Spectrum: The electromagnetic spectrum (Figure 1) indicates the different forms of radiation (or simply stated light) emitted by nature.
GE 113 REMOTE SENSING
 GE 113 REMOTE SENSING Topic 8. Image Classification and Accuracy Assessment Lecturer: Engr. Jojene R. Santillan jrsantillan@carsu.edu.ph Division of Geodetic Engineering College of Engineering and Information
Mapping of Eelgrass and Other SAV Using Remote Sensing and GIS Chris Mueller NRS 509 November 30, 2004
 Mapping of Eelgrass and Other SAV Using Remote Sensing and GIS Chris Mueller NRS 509 November 30, 2004 Of the 58 species of seagrass that grow worldwide, Zostera marina, commonly called eelgrass, is by
New Jersey Audubon Society s. Garden State Audubon Council A Non-Profit Organization
 New Jersey Audubon Society s Important Bird and Birding Areas Program: Mapping Priority Areas for Conservation in the Delaware Estuary Cristina Frank, Program Coordinator Beth Ciuzio, Stewardship Project
Remote Sensing in an
 Chapter 6: Displaying Data Remote Sensing in an ArcMap Environment Remote Sensing Analysis in an ArcMap Environment Tammy E. Parece Image source: landsat.usgs.gov Tammy Parece James Campbell John McGee
2007 Land-cover Classification and Accuracy Assessment of the Greater Puget Sound Region
 2007 Land-cover Classification and Accuracy Assessment of the Greater Puget Sound Region Urban Ecology Research Laboratory Department of Urban Design and Planning University of Washington May 2009 1 1.
Dirty REMOTE SENSING Lecture 3: First Steps in classifying Stuart Green Earthobservation.wordpress.com
 Dirty REMOTE SENSING Lecture 3: First Steps in classifying Stuart Green Earthobservation.wordpress.com Stuart.Green@Teagasc.ie You have your image, but is it any good? Is it full of cloud? Is it the right
Sommersemester Prof. Dr. Christoph Kleinn Institut für Waldinventur und Waldwachstum Arbeitsbereich Fernerkundung und Waldinventur.
 Basics of Remote Sensing Some literature references Franklin, SE 2001 Remote Sensing for Sustainable Forest Management Lewis Publishers 407p Lillesand, Kiefer 2000 Remote Sensing and Image Interpretation
Present and future of marine production in Boka Kotorska
 Present and future of marine production in Boka Kotorska First results from satellite remote sensing for the breeding areas of filter feeders in the Bay of Kotor INTRODUCTION Environmental monitoring is
Tualatin River NWR and Wapato Lake BCS number: 47-37
 Tualatin River NWR and Wapato Lake BCS number: 47-37 ***NOTE: We were unable to determine all necessary information for this site description. If you would like to contribute the needed information to
INTERNATIONAL JOURNAL OF ENVIRONMENTAL SCIENCES Volume 6, No 5, Copyright by the authors - Licensee IPA- Under Creative Commons license 3.
 INTERNATIONAL JOURNAL OF ENVIRONMENTAL SCIENCES Volume 6, No 5, 2016 Copyright by the authors - Licensee IPA- Under Creative Commons license 3.0 Research article ISSN 0976 4402 Normalised difference water
Assessment of Spatiotemporal Changes in Vegetation Cover using NDVI in The Dangs District, Gujarat
 Assessment of Spatiotemporal Changes in Vegetation Cover using NDVI in The Dangs District, Gujarat Using SAGA GIS and Quantum GIS Tutorial ID: IGET_CT_003 This tutorial has been developed by BVIEER as
Killin Wetland (Cedar Canyon Marsh) BCS number: 47-15
 BCS number: 47-15") Killin Wetland (Cedar Canyon Marsh) BCS number: 47-15 ***NOTE: We were unable to determine all necessary information for this site description. If you would like to contribute the needed information to
Killin Wetland (Cedar Canyon Marsh) BCS number: 47-15 ***NOTE: We were unable to determine all necessary information for this site description. If you would like to contribute the needed information to
Piping Plovers - An Endangered Beach Nesting Bird, and The Threat of Habitat Loss With. Predicted Sea Level Rise in Cape May County.
 Piping Plovers - An Endangered Beach Nesting Bird, and The Threat of Habitat Loss With Thomas Thorsen May 5 th, 2009 Predicted Sea Level Rise in Cape May County. Introduction and Background Piping Plovers
Module 3 Introduction to GIS. Lecture 8 GIS data acquisition
 Module 3 Introduction to GIS Lecture 8 GIS data acquisition GIS workflow Data acquisition (geospatial data input) GPS Remote sensing (satellites, UAV s) LiDAR Digitized maps Attribute Data Management Data
Remote Sensing And Gis Application in Image Classification And Identification Analysis.
 Quest Journals Journal of Research in Environmental and Earth Science Volume 3~ Issue 5 (2017) pp: 55-66 ISSN(Online) : 2348-2532 www.questjournals.org Research Paper Remote Sensing And Gis Application
Remote Sensing. The following figure is grey scale display of SPOT Panchromatic without stretching.
 Remote Sensing Objectives This unit will briefly explain display of remote sensing image, geometric correction, spatial enhancement, spectral enhancement and classification of remote sensing image. At
Satellite data processing and analysis: Examples and practical considerations
 Satellite data processing and analysis: Examples and practical considerations Dániel Kristóf Ottó Petrik, Róbert Pataki, András Kolesár International LCLUC Regional Science Meeting in Central Europe Sopron,
APCAS/10/21 April 2010 ASIA AND PACIFIC COMMISSION ON AGRICULTURAL STATISTICS TWENTY-THIRD SESSION. Siem Reap, Cambodia, April 2010
 APCAS/10/21 April 2010 Agenda Item 8 ASIA AND PACIFIC COMMISSION ON AGRICULTURAL STATISTICS TWENTY-THIRD SESSION Siem Reap, Cambodia, 26-30 April 2010 The Use of Remote Sensing for Area Estimation by Robert
Snail Kite capture locations for satellite tracking Doppler GPS. Doppler data: 10 kites 12,106 locations 32 months
 Snail Kite satellite telemetry reveals large scale movements and concentrated use of peripheral wetlands: Implications for habitat management and population monitoring. Ken Meyer, Gina Kent Avian Research
EXPLORING THE POTENTIAL FOR A FUSED LANDSAT-MODIS SNOW COVERED AREA PRODUCT. David Selkowitz 1 ABSTRACT INTRODUCTION
 EXPLORING THE POTENTIAL FOR A FUSED LANDSAT-MODIS SNOW COVERED AREA PRODUCT David Selkowitz 1 ABSTRACT Results from nine 3 x 3 km study areas in the Rocky Mountains of Colorado, USA demonstrate there is
ebird and Citizen Science:
 ebird and Citizen Science: How ebird is tapping into the crowd to revolutionize avian science. -- Jeff Gerbracht-- 8,676 contributors 239,856 checklists 3,175,430 observations Overview Citizen Science
Summary of Accomplishments April 2017 October 2017
 1 Conservation of Aechmophorus Grebe Colonies at Six Northern California Lakes Interim Report for Year Three Submitted to the National Fish and Wildlife Foundation October 31st, 2017 Photo: Gae Henry Submitted
Interpreting land surface features. SWAC module 3
 Interpreting land surface features SWAC module 3 Interpreting land surface features SWAC module 3 Different kinds of image Panchromatic image True-color image False-color image EMR : NASA Echo the bat
GIS Data Collection. Remote Sensing
 GIS Data Collection Remote Sensing Data Collection Remote sensing Introduction Concepts Spectral signatures Resolutions: spectral, spatial, temporal Digital image processing (classification) Other systems
The availability of cloud free Landsat TM and ETM+ land observations and implications for global Landsat data production
 14475 The availability of cloud free Landsat TM and ETM+ land observations and implications for global Landsat data production *V. Kovalskyy, D. Roy (South Dakota State University) SUMMARY The NASA funded
Introduction. Introduction Wetland Management -53% -60% Tennessee
 Waterbird and Food Resource Responses to Winter Drawdown in the east Tennessee River Valley John W. Laux M. S. Candidate University of Tennessee Knoxville Department of Forestry, Wildlife and Fisheries
White Paper. Medium Resolution Images and Clutter From Landsat 7 Sources. Pierre Missud
 White Paper Medium Resolution Images and Clutter From Landsat 7 Sources Pierre Missud Medium Resolution Images and Clutter From Landsat7 Sources Page 2 of 5 Introduction Space technologies have long been
American Bittern Minnesota Conservation Summary
 Credit Jim Williams American Bittern Minnesota Conservation Summary Audubon Minnesota Spring 2014 The Blueprint for Minnesota Bird Conservation is a project of Audubon Minnesota written by Lee A. Pfannmuller
Monitoring of mine tailings using satellite and lidar data
 Surveying Monitoring of mine tailings using satellite and lidar data by Prevlan Chetty, Southern Mapping Geospatial This study looks into the use of high resolution satellite imagery from RapidEye and
Smith River Mouth BCS number: 86-6
 Smith River Mouth BCS number: 86-6 ***NOTE: We were unable to determine all necessary information for this site description. If you would like to contribute the needed information to this description,
TEMPORAL ANALYSIS OF MULTI EPOCH LANDSAT GEOCOVER IMAGES IN ZONGULDAK TESTFIELD
 TEMPORAL ANALYSIS OF MULTI EPOCH LANDSAT GEOCOVER IMAGES IN ZONGULDAK TESTFIELD Şahin, H. a*, Oruç, M. a, Büyüksalih, G. a a Zonguldak Karaelmas University, Zonguldak, Turkey - (sahin@karaelmas.edu.tr,
MULTI-TEMPORAL SATELLITE IMAGES WITH BATHYMETRY CORRECTION FOR MAPPING AND ASSESSING SEAGRASS BED CHANGES IN DONGSHA ATOLL
 MULTI-TEMPORAL SATELLITE IMAGES WITH BATHYMETRY CORRECTION FOR MAPPING AND ASSESSING SEAGRASS BED CHANGES IN DONGSHA ATOLL Chih -Yuan Lin and Hsuan Ren Center for Space and Remote Sensing Research, National
Oregon Dunes National Recreation Area BCS Number: 47-5
 Oregon Dunes National Recreation Area BCS Number: 47-5 ***NOTE: We were unable to determine all necessary information for this site description. If you would like to contribute the needed information to
Catalog of Upper Mississippi River and Great Lakes Region Joint Venture GIS Data March 2009 Version 1
 Catalog of Upper Mississippi River and Great Lakes Region Joint Venture GIS Data March 2009 Version 1 Compiled by: Bradly Potter Introduction This catalog contains descriptions of GIS data available from
Quantifying Land Cover Changes in Maine
 Quantifying Land Cover Changes in Maine! STUDENT HANDOUT Introduction Change detection tools enable us to compare satellite data from different times to assess damage from natural disasters, characterize
What we can see from space; and how to link it to data and statistics
 What we can see from space; and how to link it to data and statistics Mohammed Said 1, Shem Kifugo 1, Madelene Ostwald 2, Gert Nyberg 3, and Lance Robinson 1 1 International Livestock Research Institute,
6th Beirut Water Week 27th February - 1st March 2017
 Assessment of chlorophyll-a concentration using Landsat Operational Land Imager in Lake Qaraoun, Lebanon Ali Fadel 6th Beirut Water Week 27th February - 1st March 2017 Introduction & problematic Worldwide
REVISED DRAFT - 8/21/00 BIOLOGICAL OPINION ON THE OPERATION OF THE MISSOURI RIVER MAIN STEM RESERVOIR SYSTEM,
 REVISED DRAFT - 8/21/00 BIOLOGICAL OPINION ON THE OPERATION OF THE MISSOURI RIVER MAIN STEM RESERVOIR SYSTEM, OPERATION AND MAINTENANCE OF THE MISSOURI RIVER BANK STABILIZATION AND NAVIGATION PROJECT,
White paper brief IdahoView Imagery Services: LISA 1 Technical Report no. 2 Setup and Use Tutorial
 White paper brief IdahoView Imagery Services: LISA 1 Technical Report no. 2 Setup and Use Tutorial Keith T. Weber, GISP, GIS Director, Idaho State University, 921 S. 8th Ave., stop 8104, Pocatello, ID
Distribution of Tree Squirrels in California: A Species Distribution Modeling Approach to Analyzing Data
 Distribution of Tree Squirrels in California: A Species Distribution Modeling Approach to Analyzing Data R. Garcia 1, A. Muchlinski 2, F. Shilling 3, H.L. Qiu 1, K. Tiedeman 3 1 Department of Geosciences
Unsupervised Classification
 Unsupervised Classification Using SAGA Tutorial ID: IGET_RS_007 This tutorial has been developed by BVIEER as part of the IGET web portal intended to provide easy access to geospatial education. This tutorial
Land Cover Analysis to Determine Areas of Clear-cut and Forest Cover in Olney, Montana. Geob 373 Remote Sensing. Dr Andreas Varhola, Kathry De Rego
 1 Land Cover Analysis to Determine Areas of Clear-cut and Forest Cover in Olney, Montana Geob 373 Remote Sensing Dr Andreas Varhola, Kathry De Rego Zhu an Lim (14292149) L2B 17 Apr 2016 2 Abstract Montana
Project Summary. Predicting waterbird nest distributions on the Yukon-Kuskokwim Delta of Alaska
 Project Summary 1. PROJECT INFORMATION Title Project ID Predicting waterbird nest distributions on the Yukon-Kuskokwim Delta of Alaska WA2012_22 Project Period July 1, 2012 to June 30, 2014 Report submission
Introduction. Introduction. Introduction. Introduction. Introduction
 Identifying habitat change and conservation threats with satellite imagery Extinction crisis Volker Radeloff Department of Forest Ecology and Management Extinction crisis Extinction crisis Conservationists
Varying levels of bird activity within a forest understory dominated by the invasive glossy buckthorn (Rhamnus frangula)
") 1 Varying levels of bird activity within a forest understory dominated by the invasive glossy buckthorn (Rhamnus frangula) Tamara M. Baker Biology Department, College of Letters and Sciences, University
1 Varying levels of bird activity within a forest understory dominated by the invasive glossy buckthorn (Rhamnus frangula) Tamara M. Baker Biology Department, College of Letters and Sciences, University
Upper Klamath National Wildlife Refuge Complex Upper Klamath Unit and Hank s Marsh Unit BCS Number: 48-29
 Oregon Coordinated Aquatic Bird Monitoring: Description of Important Aquatic Bird Site Upper Klamath National Wildlife Refuge Complex Upper Klamath Unit and Hank s Marsh Unit BCS Number: 48-29 Site description
Using ArcMap to Extract Shorelines from Landsat TM & ETM+ Data. Richard C. Daniels, GISP
 Using ArcMap to Extract Shorelines from Landsat TM & ETM+ Data Thirty-second ESRI International Users Conference Proceedings, San Diego, CA Richard C. Daniels, GISP Abstract Many site and region specific
Using NDVI dynamics as an indicator of native vegetation management in a heterogeneous and highly fragmented landscape
 20th International Congress on Modelling and Simulation, Adelaide, Australia, 1 6 December 2013 www.mssanz.org.au/modsim2013 Using NDVI dynamics as an indicator of native vegetation management in a heterogeneous
Improvements in Landsat Pathfinder Methods for Monitoring Tropical Deforestation and Their Extension to Extra-tropical Areas
 Improvements in Landsat Pathfinder Methods for Monitoring Tropical Deforestation and Their Extension to Extra-tropical Areas PI: John R. G. Townshend Department of Geography (and Institute for Advanced
Coral Reef Remote Sensing
 Coral Reef Remote Sensing Spectral, Spatial, Temporal Scaling Phillip Dustan Sensor Spatial Resolutio n Number of Bands Useful Bands coverage cycle Operation Landsat 80m 2 2 18 1972-97 Thematic 30m 7
Lab 3: Introduction to Image Analysis with ArcGIS 10
 Lab 3: Introduction to Image Analysis with ArcGIS 10 Peter E. Price TerraView 2010 Peter E. Price All rights reserved. Revised 03/2011. Revised for Geob 373 by BK Feb 7, 2017. V9 The information contained