Improvements in Landsat Pathfinder Methods for Monitoring Tropical Deforestation and Their Extension to Extra-tropical Areas
|
|
|
- Jayson Montgomery
- 6 years ago
- Views:
Transcription
1 Improvements in Landsat Pathfinder Methods for Monitoring Tropical Deforestation and Their Extension to Extra-tropical Areas PI: John R. G. Townshend Department of Geography (and Institute for Advanced Computing Studies) University of Maryland
2 Objectives Objectives To assess whether the overall approach successfully used in Landsat Pathfinder for the humid tropics can also be used in other regions to satisfy the needs of the Global Observations of Forest Cover To carry out large scale prototyping of several advanced processing procedures, including pre-processing to reduce atmospheric and MTF effects, multi-temporal unsupervised processing, application of decision-tree methodologies, mixture modeling and other advanced procedures developed under previous research.
3 Objectives Objectives To assess the improvements introduced by advanced processing procedures using data from areas in the Pan- Amazon and Central Africa that were part of the previous Landsat Pathfinder work. Investigate how the original Landsat Pathfinder methodology and the enhancements proposed operate in selected areas throughout the globe. Paraguay, southern Africa, central Asia, Eastern United States, selected sites in the boreal forest.
4 Science Implications Science Implications The Landsat Pathfinder project has demonstrated the feasibility of monitoring forest cover change over very large areas using Landsat data. To extend this approach to satisfy the needs of the Global Observations of Forest Cover will require an assessment that the overall approach successfully used in Landsat Pathfinder for the humid tropics can also be used in other regions and that more automated procedures are used.
5 NASA Landsat Pathfinder Humid Tropical Deforestation Project A collaborative effort between the University of Maryland at College Park s Geography Department, Michigan State University and NASA Goddard Space Flight Center s GIMMS Group. The goal of this work is to map global deforestation for the humid tropics. Heritage Data sets from both the TM and MSS of Landsat have been used for three time periods, the 1970s, 1980s, and 1990s. The project has focused on - the Amazon Basin, Central Africa, and Southeast Asia, which are the three regions where most of the tropical deforestation in the world has occurred. The Pathfinder project includes about 75% of the tropical rain forest areas. The University of Maryland has had responsibility for the non-brazilian Amazon Basin (also known as the Pan-Amazon) along with central Africa (Details can be found at and Michigan State University has responsibility for the Brazilian Amazon Basin and Southeast Asia.
6 Heritage Landsat Pathfinder Procedures for Classification Utilize existing automated methods Utilize the skills of the human interpreter to refine the classification Multispectral/ Multitemporal approach
7 Landsat Pathfinder Procedures for Classification Heritage Landsat Pathfinder produces simple but accurate maps of the humid tropical forest - nonforest boundary based on Thematic Mapper (TM) data from the Landsat satellites. This information can be used to detect changes in forest cover, for modeling global climate change or for other research purposes. Pathfinder uses isodata clustering image processing algorithms to produce thematic maps from Landsat imagery. Spectral data from two coregistered scenes are processed simultaneously so that areas of change can be readily identified. The example presented here uses a small portion of Landsat scenes of the northwest Democratic Republic of Congo from 1987 and km 0 5km February 1987 Path 179 Row 058 An 800 x 800 pixel subset of Landsat 5 TM bands 4,5,3 (R,G,B) December 1994 Path 179 Row 058 An 800 x 800 pixel subset of Landsat 5 TM bands 4,5,3 (R,G,B)
8 Landsat Pathfinder Procedures for Classification Heritage Masks of cloud, shadow, water and land cover are created from the data. Data under cloud, shadow or water masks are not processed further. An unsupervised classification process is applied to data under the land cover masks. Iterative isodata clustering produces large numbers of clusters or groups of pixels based on the spectral data from both images. Forest Nonforest Degraded forest Water Forest tononforest (Deforestation) Forest todegradedforest (Degradation) Nonforest todegradedforest (Regrowth) Degradedforest tononforest 0 5km CompositeMap Each cluster is assigned a color which represents a particular land cover type or land cover change between the two images, e.g., forest to nonforest (deforestation), nonforest to forest (regrowth), etc. A modeling program classifies each pixel based on the color assigned to its cluster. The result is a composite map of land cover which includes change between the two scenes.
9 Landsat Pathfinder Procedures for Classification Heritage The composite map may require editing to reclassify those pixels which are spectrally very similar but represent different cover types. In the example shown here, the plantation areas which appeared as forest are reclassified as nonforest according to the project definitions of cover type. Forest Nonforest Degraded Forest Water Forest tononforest (Deforestation) Forest todegradedforest (Degradation) Nonforest todegradedforest (Regrowth) Degradedforest tononforest 0 5km EditedChangeMap

10 Landsat Pathfinder Procedures for Classification Heritage The edited composite change map is split and filtered into thematic maps for each scene. The thematic maps are georegistered and mosaicked into a country wide product for a specific time period. Forest Nonforest Degraded Forest Water 0 5km ThematicMap1987 ThematicMap194
11 Landsat Pathfinder Procedures for Classification Heritage Spectral bands time 1 Composite map Thematic map time 1 Spectral bands time 2 Edited composite map Thematic map time 2
12 Heritage Landsat Pathfinder Procedures for Classification The current system is producing a very consistent and accurate product as is indicated by the fact that little, or no thematic corrections are ever necessary when adjacent classified scenes are joined together. Mechanisms are in place where, as further auxiliary information is made available, the classification can be improved.
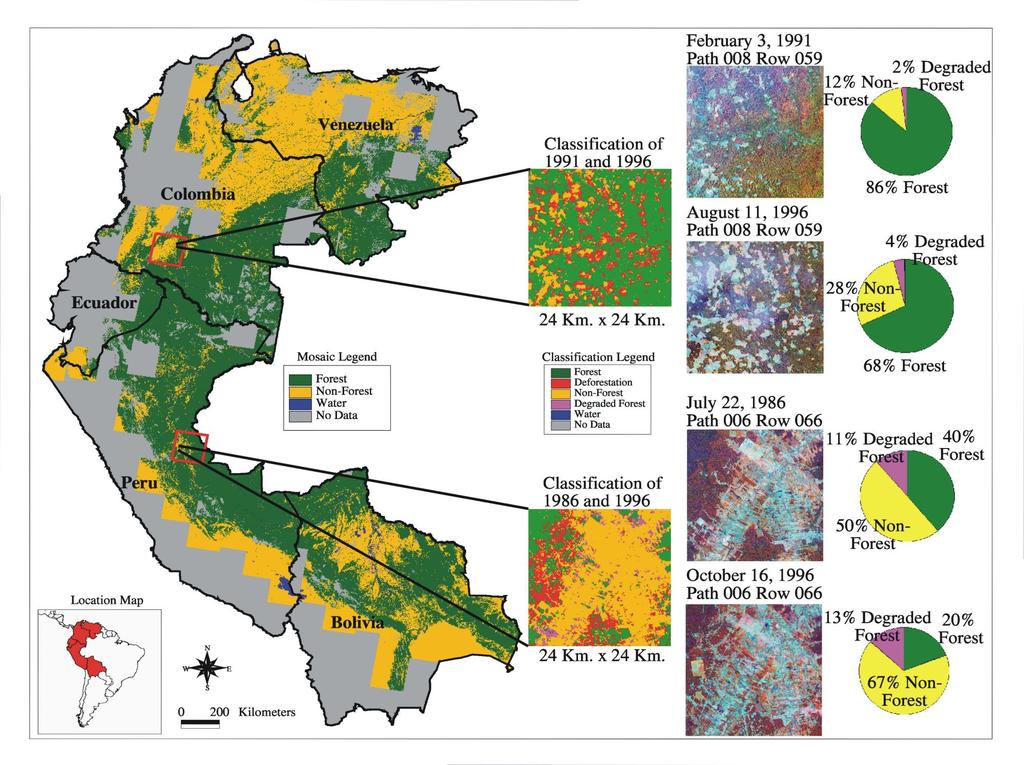
13 Heritage Results from Landsat Pathfinder Results from Landsat Pathfinder project have produced delimitations of tropical deforestation in the Pan-Amazon with unprecedented accuracy for most areas. Figure 1 shows in summary the distribution of the main hot spots in the Pan-Amazon, but this gives only a very superficial impression of the detailed data base that has been created.

14 Pan-Am Hotspots
15 Heritage Results from Landsat Pathfinder Large parts of the Pan-Amazon are being deforested. We have documented a spatially-concentrated "deforestation zone in Santa Cruz where >60% of the Bolivian deforestation is occurring at an accelerating rate in areas of tropical deciduous forest
16 Heritage Results from Landsat Pathfinder Results of large area classifications are significantly changing views of the rates of tropical deforestation. For example in Bolivia the total closed canopy forest cover extent, including tropical deciduous forest, totaled 472,000 km 2. The area deforested totaled 15,000 km 2 in the middle 1980s and 28,800 km 2 by the early 1990s. The rate of tropical deforestation in forest zone of Bolivia with >1,000 mm y -1 precipitation was 2,200 km 2 y -1 from to Our estimates of deforestation are significantly lower than those reported by the FAO, but are higher than in-country estimates since the mid-1980s (Steininger et al. 1999).
17 Table 1. Summary of deforestation estimated for Bolivian forests, based on digital analysis of Landsat Thematic Mapper (TM) and Multispectral Scanning System (MSS) images. All areas are in km2 and rates are in km2 y-1. Data from the 1980s are from 1984 to 1987, the 1990s are from All forest in the >1000 mm precipitation zone were mapped (Steininger et al. 1999). Department Potential Forest Forest Non- Forest Deforested by the 1980s* Deforested By the 1990s Deforestation 1980s 1990s Water Cloud Nodata Total Area Ben 92,277 87, , ,909 2,093 9,564 3,030 2, ,560 Cochabamba 26,390 20,322 27,834 1,520 2,774 1, ,346 2,964 57,732 La Paz 64,351 56,318 37,422 1,238 2,869 1, ,781 24, ,626 Pando 58,789 55,999 1, , ,264 2,103 63,405 Santa Cruz 218, , ,179 10,835 18,616 7,782 2,051 1,390 20, ,160 Chuquisaca 11,039 10,842 24, ,982 50,884 Sum 471, , ,615 15,073 28,801 13,724 13,791 15,961 67, ,367 *Areas deforested by the middle 1980s were only mapped below 1000 m elevation; 1,645 km2 of the total deforestation between the time periods were in areas over 1000 m above sea level.
18 Heritage Results from Landsat Pathfinder In Africa rates of deforestation are much less than the Amazon Few very large areas of clearance observed Land cover changes that occur are often associated with previously cleared degraded forests, which have regrown
19 Results from Landsat Pathfinder Heritage
20 Methods Methods Preprocessing of Landsat data Mixture Modeling Improved Landsat Pathfinder Procedures Supervised Approaches Application of Coarse Resolution Data Products
21 Methods Preprocessing of Landsat TM data Automated co-registration Previously tested algorithms (Fonseca and Manjunath 1996). Atmospheric correction. Dark target approach (Kaufman et al. 1988). Algorithm has been successfully implemented on our SP-2 high performance computer
22 Methods Preprocessing of Landsat TM data MTF Effects Assess the optimal pixel size Explore the development of a non-linear filter Assess the implications of enhancing noise due to this procedure Assess the extent to which these problems impact Thematic Mapper data
23 MTF table Table 2 Standard Errors of the Estimate (SEE) * of MODIS Simulated Data for 250m Pixels (at the 90% Confidence Limit) for the Reflective Bands, Namely Bands 1 to 5 and 7 (B1 B5 and B7) of the Thematic Mapper for Partially Forested Test Site in Central Maryland. The Final Column Shows the SEE for the Estimated Vs. The Actual Percentages of Land Cover. The Results Indicate the Major Impacts of the MTF of the Sensor and Reductions in Their Impacts by Pixel Enlargement and deconvolution (Townshend Et Al. 1999). Pixel size (m) and procedure for generating images m, derived by simple averaging m, MTF simulation m, aggregated from m, MTF deconvolved m, aggregated from 4 B1 (DN) B2 (DN) B3 (DN) B4 (DN) B5 (DN) B7 (DN) Land Cover % Error
24 Methods Mixture Modeling Intend to apply mixture modeling to assist in classifying areas of partial tree cover. Two approaches will be tested. Characterize each scene as a mixture of basic components to assist in the labeling of the clusters in the unsupervised classification Derive proportions of scene components and then derive differences in proportions between adjacent time periods
25 Methods Improved Landsat Pathfinder Procedures The most time-consuming part of the work for the human analyst is the assigning the hundreds of spectral clusters labels of the land cover classes. Instead we will implement a hybrid unsupervised and supervised classification.
26 Methods Improved Landsat Pathfinder Procedures This approach will rely on an unsupervised statistics based clustering algorithm to iteratively create several hundred cluster classes. Clusters will then be automatically assigned to output classes based on training bitmaps created by the human analyst.
27 Methods Improved Landsat Pathfinder Procedures Where a cluster is included in more than one of the land cover classes, bit maps will automatically be created over all pixels belonging to those classes throughout the scene Subsequent unsupervised classification will then be carried out until all clusters are only associated with a single land cover class. Analyst input will still be needed but this procedure has been shown to reduce their level of effort by a factor between approximately 2 and 3 dependent on the scene being analyzed.
28 Methods Improved Landsat Pathfinder Procedures Analyst first identifies polygon bitmaps on image which are assigned to a vegetation or change class. Forest Deforestation Non-Forest
29 Methods Improved Landsat Pathfinder Procedures Unsupervised clustering algorithm is run independently of the training sites. Clustering output Forest Non-Forest Deforestation We have developed a program to compare the training site bitmaps and the output clusters from the unsupervised classification.
30 Methods Improved Landsat Pathfinder Procedures Clustering output Thematic Map Automatic Modeling Those clusters belonging solely to a single land cover class will be automatically labeled and will not need to be examined further by the analyst. Where a cluster is derived which includes more than one of the land cover classes, then bit maps will automatically be created over all pixels belonging to those classes throughout the scene and subsequent unsupervised classification will then be carried out until all clusters are only associated with a single land cover class.
31
32 Methods Supervised Approaches Increasingly improvements in our understanding of spectral classes and ground conditions means that a more directed supervised approach becomes feasible in many areas. We will evaluate the following approaches. Neural nets Multi-layer perceptron (MLP) - Three layer network structure (input, hidden and output) Decision Tree Classifiers
33 Application of Coarse Resolution Data Products We will examine the extent to which we can use multi-temporal sequences of MODIS data, especially the NDVI and its improved vegetation indices to assist the characterization of forest types especially in relation to leaf type and duration.
34 Extension to Other Regions Sub-tropical forests in South America including the Chacoan Forests Woodlands and wooded grasslands of Eastern Africa including woodland types such as miombo and mopane woodlands Deciduous and mixed temperate forests in Maryland. Boreal forests from central Asia in Mongolia, Russia and Alaska.
35 Assessment of Procedures Assessment of Procedures Two main approaches will be adopted in assessing the performance of the various procedures Carefully characterized ground sites based on field work Previously well characterized complete scenes based on field work and previous Landsat Pathfinder classification
36 Ground sites based on field work by collaborators These sites will be used primarily to assess the accuracy of the procedures that are developed Southern Santa Cruz, Bolivia - Dr. Tim Killeen Noel Kempf National Park, Bolivia - Dr. Tim Killeen Venezuela - Dr. Otto Huber of the University Simon Bolivar, Caracas Manaus, Brazil - Dr. Marc Steininger Southern Africa Woodlands MODIS validation team Boreal Forests - Dr. Eric Kasischke of ERIM, Dr Clyde Goulden of the Institute of Mongolian Biodiversity & Ecological Studies 3 sites in Maryland MODIS Assessment of Procedures
37 Assessment of Procedures Previous Landsat Pathfinder Classifications Sites in the tropics will be used primarily to assess the extent to which Landsat Pathfinder results involving intensive human intervention can be reproduced with much less intervention. Sites include: near Santa Cruz in Venezuela in Brazil Central African image TBD


38 Path 006 Row 055 Nov Apr
39 Assessment of Procedures Extra-Tropical Test Sites We intend to develop similar thoroughly checked scenes in temperate forests in Paraguay and in boreal forests in Mongolia, Russia, and Alaska. The scenes and reference sites from outside of the tropics will be used to assess the extent to which Landsat Pathfinder methodology and the proposed enhancements to this approach can be extrapolated to other regions
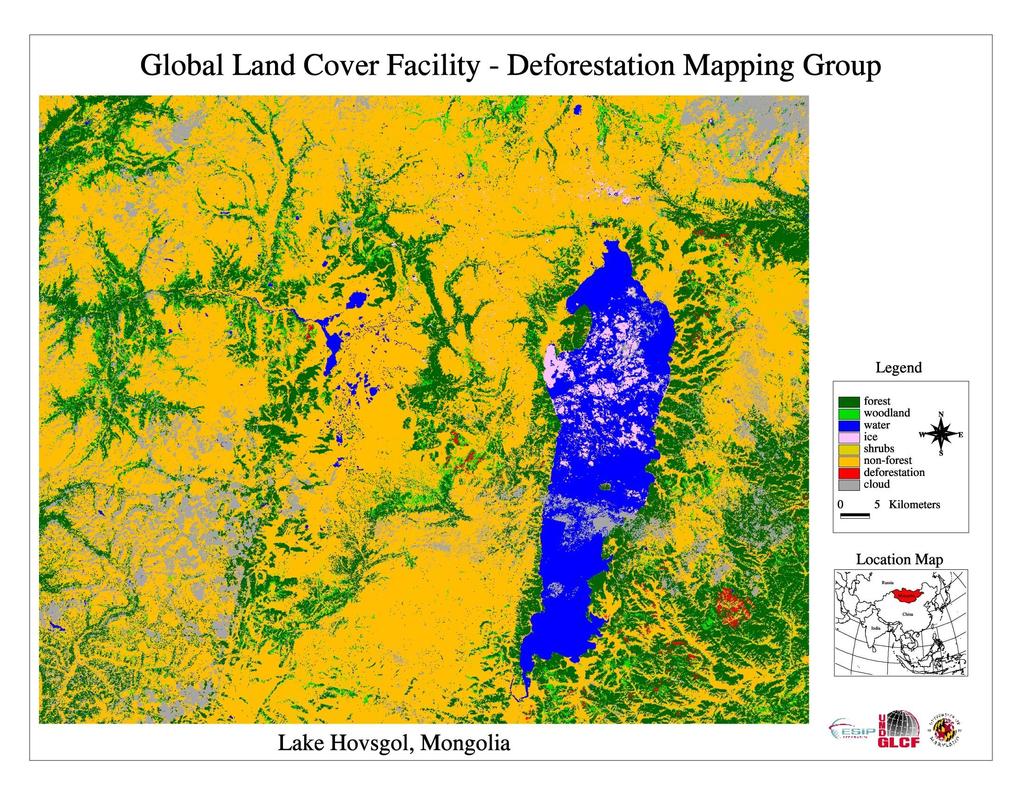
40 Hovsgol
41 Data Plan Data Plan New Methods Testing Landsat 4 & 5 TM images acquired through Landsat Pathfinder Project Extension to New Regions Landsat 7, EarthSat Geo-registered dataset, Landsat 4 & 5 Selected Ikonos scenes and other ultra-high resolution images
42 Data Plan Data Plan Landsat Images and classification products will be stored and distributed through the Global Land Cover Facility.
43 Work Schedule Work Schedule -Year 1 Landsat Pathfinder methods will be first tested in those extra-tropical areas most similar to the areas in tropical areas characterized by large scale clearance such as the clearance types in Paraguay discussed above. Test automated co-registration techniques and implement the most accurate and robust techniques based on our evaluation.
44 Work Schedule Work Schedule -Year 1 (cont d) Implement the pre-processing procedures associated with atmospheric correction and test the MTF effects for TM data to decide the pixel size to be used and whether deconvolution should be implemented. The improvements in unsupervised procedures will be tested and implemented.
45 Work Schedule Work Schedule -Year 2 Test the mixture modeling and supervised components of the approach to assess whether they bring substantial additional benefits. Assess Landsat Pathfinder methods including enhancements in test sites in the boreal zone.
46 Work Schedule Work Schedule -Year 3 The most spatially and temporally complex areas will be examined to assess whether processes provide sufficiently reliable performance. Investigate the contribution of coarser resolution data sets for improved characterization of forest types in terms of leaf type and duration. Participate with GOFC activities providing advice on how to improve the characterization and monitoring of forest cover.
47

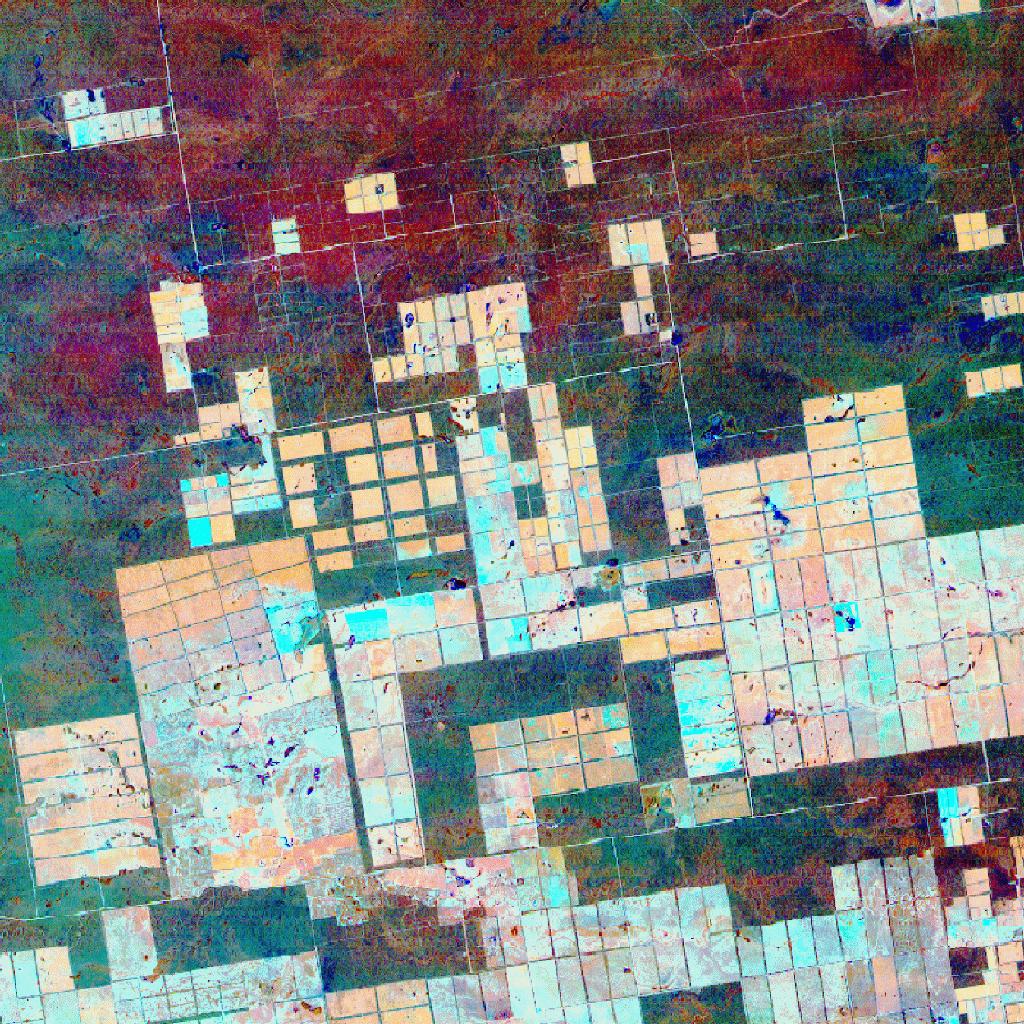
48 Paraguay example

49 Tierras Bajas, Bolivia
50 Cochabamba, Bolivia
51 References
Remote Sensing. The following figure is grey scale display of SPOT Panchromatic without stretching.
 Remote Sensing Objectives This unit will briefly explain display of remote sensing image, geometric correction, spatial enhancement, spectral enhancement and classification of remote sensing image. At
Operational Forest Mapping Systems Youngsinn Sohn University of Maryland Baltimore County
 Operational Forest Mapping Systems Youngsinn Sohn University of Maryland Baltimore County 19-21 Nov 2001 1 Collaborators Guoqing Sun, University of Maryland William Clerke, USDA Forest Service, Southern
NORMALIZING ASTER DATA USING MODIS PRODUCTS FOR LAND COVER CLASSIFICATION
 NORMALIZING ASTER DATA USING MODIS PRODUCTS FOR LAND COVER CLASSIFICATION F. Gao a, b, *, J. G. Masek a a Biospheric Sciences Branch, NASA Goddard Space Flight Center, Greenbelt, MD 20771, USA b Earth
Land Cover Analysis to Determine Areas of Clear-cut and Forest Cover in Olney, Montana. Geob 373 Remote Sensing. Dr Andreas Varhola, Kathry De Rego
 1 Land Cover Analysis to Determine Areas of Clear-cut and Forest Cover in Olney, Montana Geob 373 Remote Sensing Dr Andreas Varhola, Kathry De Rego Zhu an Lim (14292149) L2B 17 Apr 2016 2 Abstract Montana
GEOG432: Remote sensing Lab 3 Unsupervised classification
 GEOG432: Remote sensing Lab 3 Unsupervised classification Goal: This lab involves identifying land cover types by using agorithms to identify pixels with similar Digital Numbers (DN) and spectral signatures
Land cover change methods. Ned Horning
 Land cover change methods Ned Horning Version: 1.0 Creation Date: 2004-01-01 Revision Date: 2004-01-01 License: This document is licensed under a Creative Commons Attribution-Share Alike 3.0 Unported License.
GE 113 REMOTE SENSING
 GE 113 REMOTE SENSING Topic 8. Image Classification and Accuracy Assessment Lecturer: Engr. Jojene R. Santillan jrsantillan@carsu.edu.ph Division of Geodetic Engineering College of Engineering and Information
Remote sensing in archaeology from optical to lidar. Krištof Oštir ModeLTER Scientific Research Centre of the Slovenian Academy of Sciences and Arts
 Remote sensing in archaeology from optical to lidar Krištof Oštir ModeLTER Scientific Research Centre of the Slovenian Academy of Sciences and Arts Introduction Optical remote sensing Systems Search for
REMOTE SENSING. Topic 10 Fundamentals of Digital Multispectral Remote Sensing MULTISPECTRAL SCANNERS MULTISPECTRAL SCANNERS
 REMOTE SENSING Topic 10 Fundamentals of Digital Multispectral Remote Sensing Chapter 5: Lillesand and Keifer Chapter 6: Avery and Berlin MULTISPECTRAL SCANNERS Record EMR in a number of discrete portions
GEOG432: Remote sensing Lab 3 Unsupervised classification
 GEOG432: Remote sensing Lab 3 Unsupervised classification Goal: This lab involves identifying land cover types by using agorithms to identify pixels with similar Digital Numbers (DN) and spectral signatures
Remote Sensing for Rangeland Applications
 Remote Sensing for Rangeland Applications Jay Angerer Ecological Training June 16, 2012 Remote Sensing The term "remote sensing," first used in the United States in the 1950s by Ms. Evelyn Pruitt of the
Evaluation of FLAASH atmospheric correction. Note. Note no SAMBA/10/12. Authors. Øystein Rudjord and Øivind Due Trier
 Evaluation of FLAASH atmospheric correction Note Note no Authors SAMBA/10/12 Øystein Rudjord and Øivind Due Trier Date 16 February 2012 Norsk Regnesentral Norsk Regnesentral (Norwegian Computing Center,
Present and future of marine production in Boka Kotorska
 Present and future of marine production in Boka Kotorska First results from satellite remote sensing for the breeding areas of filter feeders in the Bay of Kotor INTRODUCTION Environmental monitoring is
Introduction. Introduction. Introduction. Introduction. Introduction
 Identifying habitat change and conservation threats with satellite imagery Extinction crisis Volker Radeloff Department of Forest Ecology and Management Extinction crisis Extinction crisis Conservationists
F2 - Fire 2 module: Remote Sensing Data Classification
 F2 - Fire 2 module: Remote Sensing Data Classification F2.1 Task_1: Supervised and Unsupervised classification examples of a Landsat 5 TM image from the Center of Portugal, year 2005 F2.1 Task_2: Burnt
Center for Advanced Land Management Information Technologies (CALMIT), School of Natural Resources, University of Nebraska-Lincoln
, School of Natural Resources, University of Nebraska-Lincoln") Geoffrey M. Henebry, Andrés Viña, and Anatoly A. Gitelson Center for Advanced Land Management Information Technologies (CALMIT), School of Natural Resources, University of Nebraska-Lincoln Introduction
Geoffrey M. Henebry, Andrés Viña, and Anatoly A. Gitelson Center for Advanced Land Management Information Technologies (CALMIT), School of Natural Resources, University of Nebraska-Lincoln Introduction
EVALUATION OF THE EXTENSION AND DEGRADATION OF MANGROVE AREAS IN SERGIPE STATE WITH REMOTE SENSING DATA
 EVALUATION OF THE EXTENSION AND DEGRADATION OF MANGROVE ABSTRACT AREAS IN SERGIPE STATE WITH REMOTE SENSING DATA Myrian M. Abdon Ernesto G.M.Vieira Carmem R.S. Espindola Alberto W. Setzer Instituto de
Introduction to Remote Sensing
 Introduction to Remote Sensing Spatial, spectral, temporal resolutions Image display alternatives Vegetation Indices Image classifications Image change detections Accuracy assessment Satellites & Air-Photos
AT-SATELLITE REFLECTANCE: A FIRST ORDER NORMALIZATION OF LANDSAT 7 ETM+ IMAGES
 AT-SATELLITE REFLECTANCE: A FIRST ORDER NORMALIZATION OF LANDSAT 7 ETM+ IMAGES Chengquan Huang*, Limin Yang, Collin Homer, Bruce Wylie, James Vogelman and Thomas DeFelice Raytheon ITSS, EROS Data Center
Data acquisition and access for the Congo Basin
 MRV Joint Workshop 22-24 June 2010, Guadalajara, Jalisco Mexico Data acquisition and access for the Congo Basin Landing Mané 1, Michael Brady 2, Chris Justice 3 and Alice Altstatt 3 1) Satellite Observatory
DEVELOPMENT OF A NEW SOUTH AFRICAN LAND-COVER DATASET USING AUTOMATED MAPPING TECHINQUES. Mark Thompson 1
 DEVELOPMENT OF A NEW SOUTH AFRICAN LAND-COVER DATASET USING AUTOMATED MAPPING TECHINQUES. Mark Thompson 1 1 GeoTerraImage Pty Ltd, Pretoria, South Africa Abstract This talk will discuss the development
Lecture 13: Remotely Sensed Geospatial Data
 Lecture 13: Remotely Sensed Geospatial Data A. The Electromagnetic Spectrum: The electromagnetic spectrum (Figure 1) indicates the different forms of radiation (or simply stated light) emitted by nature.
Land Remote Sensing Lab 4: Classication and Change Detection Assigned: October 15, 2017 Due: October 27, Classication
 Name: Land Remote Sensing Lab 4: Classication and Change Detection Assigned: October 15, 2017 Due: October 27, 2017 In this lab, you will generate several gures. Please sensibly name these images, save
NON-PHOTOGRAPHIC SYSTEMS: Multispectral Scanners Medium and coarse resolution sensor comparisons: Landsat, SPOT, AVHRR and MODIS
 NON-PHOTOGRAPHIC SYSTEMS: Multispectral Scanners Medium and coarse resolution sensor comparisons: Landsat, SPOT, AVHRR and MODIS CLASSIFICATION OF NONPHOTOGRAPHIC REMOTE SENSORS PASSIVE ACTIVE DIGITAL
APCAS/10/21 April 2010 ASIA AND PACIFIC COMMISSION ON AGRICULTURAL STATISTICS TWENTY-THIRD SESSION. Siem Reap, Cambodia, April 2010
 APCAS/10/21 April 2010 Agenda Item 8 ASIA AND PACIFIC COMMISSION ON AGRICULTURAL STATISTICS TWENTY-THIRD SESSION Siem Reap, Cambodia, 26-30 April 2010 The Use of Remote Sensing for Area Estimation by Robert
TEMPORAL ANALYSIS OF MULTI EPOCH LANDSAT GEOCOVER IMAGES IN ZONGULDAK TESTFIELD
 TEMPORAL ANALYSIS OF MULTI EPOCH LANDSAT GEOCOVER IMAGES IN ZONGULDAK TESTFIELD Şahin, H. a*, Oruç, M. a, Büyüksalih, G. a a Zonguldak Karaelmas University, Zonguldak, Turkey - (sahin@karaelmas.edu.tr,
Satellite data processing and analysis: Examples and practical considerations
 Satellite data processing and analysis: Examples and practical considerations Dániel Kristóf Ottó Petrik, Róbert Pataki, András Kolesár International LCLUC Regional Science Meeting in Central Europe Sopron,
Satellite image classification
 Satellite image classification EG2234 Earth Observation Image Classification Exercise 29 November & 6 December 2007 Introduction to the practical This practical, which runs over two weeks, is concerned
Image interpretation I and II
 Image interpretation I and II Looking at satellite image, identifying different objects, according to scale and associated information and to communicate this information to others is what we call as IMAGE
An Introduction to Remote Sensing & GIS. Introduction
 An Introduction to Remote Sensing & GIS Introduction Remote sensing is the measurement of object properties on Earth s surface using data acquired from aircraft and satellites. It attempts to measure something
FOREST MAPPING IN MONGOLIA USING OPTICAL AND SAR IMAGES
 FOREST MAPPING IN MONGOLIA USING OPTICAL AND SAR IMAGES D.Enkhjargal 1, D.Amarsaikhan 1, G.Bolor 1, N.Tsetsegjargal 1 and G.Tsogzol 1 1 Institute of Geography and Geoecology, Mongolian Academy of Sciences
VALIDATION OF THE CLOUD AND CLOUD SHADOW ASSESSMENT SYSTEM FOR LANDSAT IMAGERY (CASA-L VERSION 1.3)
") GDA Corp. VALIDATION OF THE CLOUD AND CLOUD SHADOW ASSESSMENT SYSTEM FOR LANDSAT IMAGERY (-L VERSION 1.3) GDA Corp. has developed an innovative system for Cloud And cloud Shadow Assessment () in Landsat
GDA Corp. VALIDATION OF THE CLOUD AND CLOUD SHADOW ASSESSMENT SYSTEM FOR LANDSAT IMAGERY (-L VERSION 1.3) GDA Corp. has developed an innovative system for Cloud And cloud Shadow Assessment () in Landsat
Lesson 9: Multitemporal Analysis
 Lesson 9: Multitemporal Analysis Lesson Description Multitemporal change analyses require the identification of features and measurement of their change through time. In this lesson, we will examine vegetation
Module 11 Digital image processing
 Introduction Geo-Information Science Practical Manual Module 11 Digital image processing 11. INTRODUCTION 11-1 START THE PROGRAM ERDAS IMAGINE 11-2 PART 1: DISPLAYING AN IMAGE DATA FILE 11-3 Display of
Chapter 8. Using the GLM
 Chapter 8 Using the GLM This chapter presents the type of change products that can be derived from a GLM enhanced change detection procedure. One advantage to GLMs is that they model the probability of
Mapping Open Water Bodies with Optical Remote Sensing
 Mapping Open Water Bodies with Optical Remote Sensing M. O Donnell 1,2 and E. Podest 1 1.Jet Propulsion Laboratory, California Institute of Technology 2 Alliance Gertz-Ressler High School, Los Angeles,
A Project to Map and Monitor Baldcypress Forests in Coastal Louisiana, using Landsat, MODIS, and ASTER Satellite Data
 A Project to Map and Monitor Baldcypress Forests in Coastal Louisiana, using Landsat, MODIS, and ASTER Satellite Data Presented to the 2012 Louisiana RS/GIS Workshop by: Joseph Spruce, Computer Sciences
Sommersemester Prof. Dr. Christoph Kleinn Institut für Waldinventur und Waldwachstum Arbeitsbereich Fernerkundung und Waldinventur.
 Basics of Remote Sensing Some literature references Franklin, SE 2001 Remote Sensing for Sustainable Forest Management Lewis Publishers 407p Lillesand, Kiefer 2000 Remote Sensing and Image Interpretation
Activity Data (AD) Monitoring in the frame of REDD+ MRV
 Monitoring in the frame of REDD+ MRV") Activity Data (AD) Monitoring in the frame of REDD+ MRV Preliminary comments REDD+ is sustainable low emissions, high carbon rural development Monitoring efforts should support this effort Challenges Diversity
Activity Data (AD) Monitoring in the frame of REDD+ MRV Preliminary comments REDD+ is sustainable low emissions, high carbon rural development Monitoring efforts should support this effort Challenges Diversity
EXPLORING THE POTENTIAL FOR A FUSED LANDSAT-MODIS SNOW COVERED AREA PRODUCT. David Selkowitz 1 ABSTRACT INTRODUCTION
 EXPLORING THE POTENTIAL FOR A FUSED LANDSAT-MODIS SNOW COVERED AREA PRODUCT David Selkowitz 1 ABSTRACT Results from nine 3 x 3 km study areas in the Rocky Mountains of Colorado, USA demonstrate there is
The availability of cloud free Landsat TM and ETM+ land observations and implications for global Landsat data production
 14475 The availability of cloud free Landsat TM and ETM+ land observations and implications for global Landsat data production *V. Kovalskyy, D. Roy (South Dakota State University) SUMMARY The NASA funded
Spectral Signatures. Vegetation. 40 Soil. Water WAVELENGTH (microns)
") Spectral Signatures % REFLECTANCE VISIBLE NEAR INFRARED Vegetation Soil Water.5. WAVELENGTH (microns). Spectral Reflectance of Urban Materials 5 Parking Lot 5 (5=5%) Reflectance 5 5 5 5 5 Wavelength (nm)
Spectral Signatures % REFLECTANCE VISIBLE NEAR INFRARED Vegetation Soil Water.5. WAVELENGTH (microns). Spectral Reflectance of Urban Materials 5 Parking Lot 5 (5=5%) Reflectance 5 5 5 5 5 Wavelength (nm)
EVALUATION OF MEDIUM-RESOLUTION SATELLITE IMAGES FOR LAND USE MONITORING USING SPECTRAL MIXTURE ANALYSIS
 EVALUATION OF MEDIUM-RESOLUTION SATELLITE IMAGES FOR LAND USE MONITORING USING SPECTRAL MIXTURE ANALYSIS Florian P. Kressler Austrian Research Centers, Seibersdorf, Austria florian.kressler@arcs.ac.at
In late April of 1986 a nuclear accident damaged a reactor at the Chernobyl nuclear
 CHERNOBYL NUCLEAR POWER PLANT ACCIDENT Long Term Effects on Land Use Patterns Project Introduction: In late April of 1986 a nuclear accident damaged a reactor at the Chernobyl nuclear power plant in Ukraine.
CHAPTER 7: Multispectral Remote Sensing
 CHAPTER 7: Multispectral Remote Sensing REFERENCE: Remote Sensing of the Environment John R. Jensen (2007) Second Edition Pearson Prentice Hall Overview of How Digital Remotely Sensed Data are Transformed
Remote Sensing Platforms
 Remote Sensing Platforms Remote Sensing Platforms - Introduction Allow observer and/or sensor to be above the target/phenomena of interest Two primary categories Aircraft Spacecraft Each type offers different
Remote Sensing Phenology. Bradley Reed Principal Scientist USGS National Center for Earth Resources Observation and Science Sioux Falls, SD
 Remote Sensing Phenology Bradley Reed Principal Scientist USGS National Center for Earth Resources Observation and Science Sioux Falls, SD Remote Sensing Phenology Potential to provide wall-to-wall phenology
Caatinga - Appendix. Collection 3. Version 1. General coordinator Washington J. S. Franca Rocha (UEFS)
") Caatinga - Appendix Collection 3 Version 1 General coordinator Washington J. S. Franca Rocha (UEFS) Team Diego Pereira Costa (UEFS/GEODATIN) Frans Pareyn (APNE) José Luiz Vieira (APNE) Rodrigo N. Vasconcelos
Caatinga - Appendix Collection 3 Version 1 General coordinator Washington J. S. Franca Rocha (UEFS) Team Diego Pereira Costa (UEFS/GEODATIN) Frans Pareyn (APNE) José Luiz Vieira (APNE) Rodrigo N. Vasconcelos
Field size estimation, past and future opportunities
 Field size estimation, past and future opportunities Lin Yan & David Roy Geospatial Sciences Center of Excellence South Dakota State University February 13-15 th 2018 Advances in Emerging Technologies
At-Satellite Reflectance: A First Order Normalization Of Landsat 7 ETM+ Images
 University of Nebraska - Lincoln DigitalCommons@University of Nebraska - Lincoln Publications of the US Geological Survey US Geological Survey 21 At-Satellite Reflectance: A First Order Normalization Of
large area By Juan Felipe Villegas E Scientific Colloquium Forest information technology
 A comparison of three different Land use classification methods based on high resolution satellite images to find an appropriate methodology to be applied on a large area By Juan Felipe Villegas E Scientific
Malaria Vector in Northeastern Venezuela. Sarah Anne Guagliardo MPH candidate, 2010 Yale University School of Epidemiology and Public Health
 Vegetation associated with the An. Aquasalis Malaria Vector in Northeastern Venezuela Sarah Anne Guagliardo g MPH candidate, 2010 Yale University School of Epidemiology and Public Health Outline Problem
Remote Sensing Part 3 Examples & Applications
 Remote Sensing Part 3 Examples & Applications Review: Spectral Signatures Review: Spectral Resolution Review: Computer Display of Remote Sensing Images Individual bands of satellite data are mapped to
Cellular automata applied in remote sensing to implement contextual pseudo-fuzzy classication - The Ninth International Conference on Cellular
 INDEX Introduction Spectral and Contextual Classification of Satellite Images Classical aplications of Cellular Automata in Remote Sensing Classification of Satellite Images with Cellular Automata (ACA)
Remote Sensing Platforms
 Types of Platforms Lighter-than-air Remote Sensing Platforms Free floating balloons Restricted by atmospheric conditions Used to acquire meteorological/atmospheric data Blimps/dirigibles Major role - news
[1]{Department of Geography, University of California, Santa Barbara, U.S.A.}
![[1]{Department of Geography, University of California, Santa Barbara, U.S.A.}](/thumbs/89/99956742.jpg "[1]{Department of Geography, University of California, Santa Barbara, U.S.A.}") Manuscript prepared for The Cryosphere Date: 6 January, 0 Supplementary Material Glacial areas, lake areas, and snow lines from 97 to 0: Status of the Cordillera Vilcanota, including the Quelccaya Ice
Manuscript prepared for The Cryosphere Date: 6 January, 0 Supplementary Material Glacial areas, lake areas, and snow lines from 97 to 0: Status of the Cordillera Vilcanota, including the Quelccaya Ice
Sources of Geographic Information
 Sources of Geographic Information Data properties: Spatial data, i.e. data that are associated with geographic locations Data format: digital (analog data for traditional paper maps) Data Inputs: sampled
A Thesis submitted in partial fulfillment of the requirements for the degree of Master of Science at George Mason University
 Change Detection and Remote Sensing Methodologies to Track Deforestation and Growth in Threatened Global Rainforests A Thesis submitted in partial fulfillment of the requirements for the degree of Master
RGB colours: Display onscreen = RGB
 RGB colours: http://www.colorspire.com/rgb-color-wheel/ Display onscreen = RGB DIGITAL DATA and DISPLAY Myth: Most satellite images are not photos Photographs are also 'images', but digital images are
Remote Sensing. Odyssey 7 Jun 2012 Benjamin Post
 Remote Sensing Odyssey 7 Jun 2012 Benjamin Post Definitions Applications Physics Image Processing Classifiers Ancillary Data Data Sources Related Concepts Outline Big Picture Definitions Remote Sensing
Image interpretation and analysis
 Image interpretation and analysis Grundlagen Fernerkundung, Geo 123.1, FS 2014 Lecture 7a Rogier de Jong Michael Schaepman Why are snow, foam, and clouds white? Why are snow, foam, and clouds white? Today
Keywords: Agriculture, Olive Trees, Supervised Classification, Landsat TM, QuickBird, Remote Sensing.
 Classification of agricultural fields by using Landsat TM and QuickBird sensors. The case study of olive trees in Lesvos island. Christos Vasilakos, University of the Aegean, Department of Environmental
GIS Data Collection. Remote Sensing
 GIS Data Collection Remote Sensing Data Collection Remote sensing Introduction Concepts Spectral signatures Resolutions: spectral, spatial, temporal Digital image processing (classification) Other systems
Image transformations
 Image transformations Digital Numbers may be composed of three elements: Atmospheric interference (e.g. haze) ATCOR Illumination (angle of reflection) - transforms Albedo (surface cover) Image transformations
APPLICATION OF REMOTE SENSING DATA FOR OIL SPILL MONITORING IN THE GUANABARA BAY, RIO DE JANEIRO, BRAZIL
 APPLICATION OF REMOTE SENSING DATA FOR OIL SPILL MONITORING IN THE GUANABARA BAY, RIO DE JANEIRO, BRAZIL CRISTINA MARIA BENTZ 1 FERNANDO PELLON DE MIRANDA 1 1 PETROBRAS/CEGEQ (Center of Excellence in Geochemistry
Monitoring of mine tailings using satellite and lidar data
 Surveying Monitoring of mine tailings using satellite and lidar data by Prevlan Chetty, Southern Mapping Geospatial This study looks into the use of high resolution satellite imagery from RapidEye and
Monitoring land cover in Acre State, western Brazilian Amazonia, using multitemporal remote sensing data
 Monitoring land cover in Acre State, western Brazilian Amazonia, using multitemporal remote sensing data Yosio E. Shimabukuro Valdete Duarte Egidio Arai Ramon M. Freitas Paulo R. Martini André Lima Instituto
ASSESSMENT OF THE IMAGE VALUE GRADIENT PROBLEM IN THE AMAZON LANDSAT TM DATA
 Pak. J. Bot., 37(4): 843-852, 2005. ASSESSMENT OF THE IMAGE VALUE GRADIENT PROBLEM IN THE AMAZON LANDSAT TM DATA RIFFAT NASEEM MALIK AND SYED ZAHOOR HUSAIN * Department of Biological Sciences, Quaid-e-Azam
Mangrove Forest Distributions of the World
 Mangrove Forest Distributions of the World Chandra Giri - ARTS/EROS/USGS Ochieng, E. - United Nations Environment Programme Larry Tieszen USGS EROS Zhiliang Zhu - USGS Ashbindu Singh United Nations Environment
DISTINGUISHING URBAN BUILT-UP AND BARE SOIL FEATURES FROM LANDSAT 8 OLI IMAGERY USING DIFFERENT DEVELOPED BAND INDICES
 DISTINGUISHING URBAN BUILT-UP AND BARE SOIL FEATURES FROM LANDSAT 8 OLI IMAGERY USING DIFFERENT DEVELOPED BAND INDICES Mark Daryl C. Janiola (1), Jigg L. Pelayo (1), John Louis J. Gacad (1) (1) Central
Removing Thick Clouds in Landsat Images
 Removing Thick Clouds in Landsat Images S. Brindha, S. Archana, V. Divya, S. Manoshruthy & R. Priya Dept. of Electronics and Communication Engineering, Avinashilingam Institute for Home Science and Higher
Lecture 6: Multispectral Earth Resource Satellites. The University at Albany Fall 2018 Geography and Planning
 Lecture 6: Multispectral Earth Resource Satellites The University at Albany Fall 2018 Geography and Planning Outline SPOT program and other moderate resolution systems High resolution satellite systems
CLASSIFICATION OF VEGETATION AREA FROM SATELLITE IMAGES USING IMAGE PROCESSING TECHNIQUES ABSTRACT
 CLASSIFICATION OF VEGETATION AREA FROM SATELLITE IMAGES USING IMAGE PROCESSING TECHNIQUES Arpita Pandya Research Scholar, Computer Science, Rai University, Ahmedabad Dr. Priya R. Swaminarayan Professor
2017 REMOTE SENSING EVENT TRAINING STRATEGIES 2016 SCIENCE OLYMPIAD COACHING ACADEMY CENTERVILLE, OH
 2017 REMOTE SENSING EVENT TRAINING STRATEGIES 2016 SCIENCE OLYMPIAD COACHING ACADEMY CENTERVILLE, OH This presentation was prepared using draft rules. There may be some changes in the final copy of the
Raster is faster but vector is corrector
 Account not required Raster is faster but vector is corrector The old GIS adage raster is faster but vector is corrector comes from the two different fundamental GIS models: vector and raster. Each of
Acquisition of Aerial Photographs and/or Satellite Imagery
 Acquisition of Aerial Photographs and/or Satellite Imagery Acquisition of Aerial Photographs and/or Imagery From time to time there is considerable interest in the purchase of special-purpose photography
Interpreting land surface features. SWAC module 3
 Interpreting land surface features SWAC module 3 Interpreting land surface features SWAC module 3 Different kinds of image Panchromatic image True-color image False-color image EMR : NASA Echo the bat
Remote Sensing And Gis Application in Image Classification And Identification Analysis.
 Quest Journals Journal of Research in Environmental and Earth Science Volume 3~ Issue 5 (2017) pp: 55-66 ISSN(Online) : 2348-2532 www.questjournals.org Research Paper Remote Sensing And Gis Application
Application of Linear Spectral unmixing to Enrique reef for classification
 Application of Linear Spectral unmixing to Enrique reef for classification Carmen C. Zayas-Santiago University of Puerto Rico Mayaguez Marine Sciences Department Stefani 224 Mayaguez, PR 00681 c_castula@hotmail.com
Forest mapping and monitoring in Russia using EO data: R&D activity overview
 Russian Academy of Sciences Space Research Institute (IKI) Forest mapping and monitoring in Russia using EO data: R&D activity overview Sergey Bartalev 11.09 13.09.2017, 3rd User Workshop of the GlobBiomass
REMOTE SENSING INTERPRETATION
 REMOTE SENSING INTERPRETATION Jan Clevers Centre for Geo-Information - WU Remote Sensing --> RS Sensor at a distance EARTH OBSERVATION EM energy Earth RS is a tool; one of the sources of information! 1
White Paper. Medium Resolution Images and Clutter From Landsat 7 Sources. Pierre Missud
 White Paper Medium Resolution Images and Clutter From Landsat 7 Sources Pierre Missud Medium Resolution Images and Clutter From Landsat7 Sources Page 2 of 5 Introduction Space technologies have long been
Basic Digital Image Processing. The Structure of Digital Images. An Overview of Image Processing. Image Restoration: Line Drop-outs
 Basic Digital Image Processing A Basic Introduction to Digital Image Processing ~~~~~~~~~~ Rev. Ronald J. Wasowski, C.S.C. Associate Professor of Environmental Science University of Portland Portland,
Green/Blue Metrics Meeting June 20, 2017 Summary
 Short round table introductions of participants Paul Villenueve, Carleton, Co-lead Green/Blue, Matilda van den Bosch, UBC, Co-lead Green/Blue Dan Crouse, UNB Lorien Nesbitt, UBC Audrey Smargiassi, Uof
RADIOMETRIC CALIBRATION
 1 RADIOMETRIC CALIBRATION Lecture 10 Digital Image Data 2 Digital data are matrices of digital numbers (DNs) There is one layer (or matrix) for each satellite band Each DN corresponds to one pixel 3 Digital
Satellite Remote Sensing: Earth System Observations
 Satellite Remote Sensing: Earth System Observations Land surface Water Atmosphere Climate Ecosystems 1 EOS (Earth Observing System) Develop an understanding of the total Earth system, and the effects of
Unsupervised Classification
 Unsupervised Classification Using SAGA Tutorial ID: IGET_RS_007 This tutorial has been developed by BVIEER as part of the IGET web portal intended to provide easy access to geospatial education. This tutorial
Application of GIS to Fast Track Planning and Monitoring of Development Agenda
 Application of GIS to Fast Track Planning and Monitoring of Development Agenda Radiometric, Atmospheric & Geometric Preprocessing of Optical Remote Sensing 13 17 June 2018 Outline 1. Why pre-process remotely
Geo/SAT 2 TROPICAL WET REALMS OF CENTRAL AFRICA, PART II
 Geo/SAT 2 TROPICAL WET REALMS OF CENTRAL AFRICA, PART II Paul R. Baumann Professor of Geography (Emeritus) State University of New York College at Oneonta Oneonta, New York 13820 USA COPYRIGHT 2009 Paul
LANDSAT-SPOT DIGITAL IMAGES INTEGRATION USING GEOSTATISTICAL COSIMULATION TECHNIQUES
 LANDSAT-SPOT DIGITAL IMAGES INTEGRATION USING GEOSTATISTICAL COSIMULATION TECHNIQUES J. Delgado a,*, A. Soares b, J. Carvalho b a Cartographical, Geodetical and Photogrammetric Engineering Dept., University
AUTOMATED STAND DELINEATION AND FIRE FUELS MAPPING
 AUTOMATED STAND DELINEATION AND FIRE FUELS MAPPING Jennifer Stefanacci, Director of Geospatial Services Parallel, Incorporated USGS Rocky Mountain Geographic Science Center Denver, CO 80225 jlstefanacci@usgs.gov
An Introduction to Geomatics. Prepared by: Dr. Maher A. El-Hallaq خاص بطلبة مساق مقدمة في علم. Associate Professor of Surveying IUG
 An Introduction to Geomatics خاص بطلبة مساق مقدمة في علم الجيوماتكس Prepared by: Dr. Maher A. El-Hallaq Associate Professor of Surveying IUG 1 Airborne Imagery Dr. Maher A. El-Hallaq Associate Professor
IceTrendr - Polygon. 1 contact: Peder Nelson Anne Nolin Polygon Attribution Instructions
 INTRODUCTION We want to describe the process that caused a change on the landscape (in the entire area of the polygon outlined in red in the KML on Google Earth), and we want to record as much as possible
29 th Annual Louisiana RS/GIS Workshop April 23, 2013 Cajundome Convention Center Lafayette, Louisiana
 Landsat Data Continuity Mission 29 th Annual Louisiana RS/GIS Workshop April 23, 2013 Cajundome Convention Center Lafayette, Louisiana http://landsat.usgs.gov/index.php# Landsat 5 Sets Guinness World Record
Blacksburg, VA July 24 th 30 th, 2010 Remote Sensing Page 1. A condensed overview. For our purposes
 A condensed overview George McLeod Prepared by: With support from: NSF DUE-0903270 in partnership with: Geospatial Technician Education Through Virginia s Community Colleges (GTEVCC) The art and science
The techniques with ERDAS IMAGINE include:
 The techniques with ERDAS IMAGINE include: 1. Data correction - radiometric and geometric correction 2. Radiometric enhancement - enhancing images based on the values of individual pixels 3. Spatial enhancement
typical spectral signatures of photosynthetically active and non-photosynthetically active vegetation (Beeri et al., 2007)
") typical spectral signatures of photosynthetically active and non-photosynthetically active vegetation (Beeri et al., 2007) Xie, Y. et al. J Plant Ecol 2008 1:9-23; doi:10.1093/jpe/rtm005 Copyright restrictions
typical spectral signatures of photosynthetically active and non-photosynthetically active vegetation (Beeri et al., 2007) Xie, Y. et al. J Plant Ecol 2008 1:9-23; doi:10.1093/jpe/rtm005 Copyright restrictions
University of Texas at San Antonio EES 5053 Term Project CORRELATION BETWEEN NDVI AND SURFACE TEMPERATURES USING LANDSAT ETM + IMAGERY NEWFEL MAZARI
 University of Texas at San Antonio EES 5053 Term Project CORRELATION BETWEEN NDVI AND SURFACE TEMPERATURES USING LANDSAT ETM + IMAGERY NEWFEL MAZARI Introduction and Objectives The present study is a correlation
Hyperspectral image processing and analysis
 Hyperspectral image processing and analysis Lecture 12 www.utsa.edu/lrsg/teaching/ees5083/l12-hyper.ppt Multi- vs. Hyper- Hyper-: Narrow bands ( 20 nm in resolution or FWHM) and continuous measurements.
Image interpretation. Aliens create Indian Head with an ipod? Badlands Guardian (CBC) This feature can be found 300 KMs SE of Calgary.
 This feature can be found 300 KMs SE of Calgary.") Image interpretation Aliens create Indian Head with an ipod? Badlands Guardian (CBC) This feature can be found 300 KMs SE of Calgary. 50 1 N 110 7 W Milestones in the History of Remote Sensing 19 th century
Image interpretation Aliens create Indian Head with an ipod? Badlands Guardian (CBC) This feature can be found 300 KMs SE of Calgary. 50 1 N 110 7 W Milestones in the History of Remote Sensing 19 th century