Activity Data (AD) Monitoring in the frame of REDD+ MRV
|
|
|
- Gyles Caldwell
- 5 years ago
- Views:
Transcription
1 Activity Data (AD) Monitoring in the frame of REDD+ MRV
2 Preliminary comments REDD+ is sustainable low emissions, high carbon rural development Monitoring efforts should support this effort Challenges Diversity Scale Contribute to other monitoring efforts Institutional arrangements Nature of changes (degradation) Uses International community Various levels of government Communities & other land owners

3 Technical Requirements for REDD+ MRV AD Extend of Surface: km 2 Frequency of LULCC: Annual Forest Patch size: 0,5 hectare Spatial resolution: MMU of hectare Quantitative change and Qualitative Change Multidirectional change over a 4 year reporting period Method: combined automatic and visual interpretation


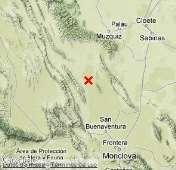
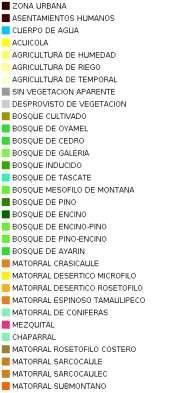
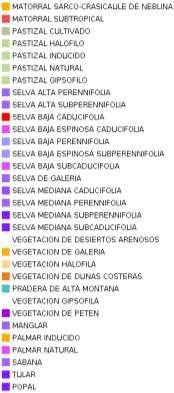
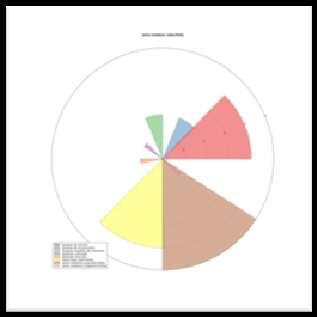
4 Approximate Extend of Forest Ecosystems in Mexico Canopy Density Based: Density >30% 10% 10 % Density
5 Details: Automated Product Generation Target: classes Model: NALCMS and SERENA as region wide known and accepted schemes Acceptable Accuracy: 80% Minimum Base Line: Landsat System, L5 and L7 Future Monitoring: Tests using SPOT5 and possibly 6 and 7, : RapidEye Work plan 2012, objectives until December 2012 Prototype in Conabio set up and running, DONE Testing on selected L5/L/ and RapidEye tiles, DONE Set-up of Satellite Images QA/QC system with CONAFOR and INEGI, DONE Implementation in Google Cloud, IN PROGRESS Adding Functionalities to EarthEngine (EE) and MapEngine (ME) tools w/ Google, IN PROGRESS Processing of minimum 1 Mosaic over México, PENDING: EE and ME implementation

6 Satellite Data Availability: Base Line Images needed for 1 full coverage: 135 Images available in USGS: : Landsat5 TM : Landsat7 ETM+ 2012/2013 processing schedule: 1990: : : : TB

7 Satellite Data Availability: Base Line, Landsat 5/7 Available Temporal Resolution, selected year: 2000 (< 10% cloud cover only)
8 Satellite Data Availability: Base Line, Landsat 5/7 Available Temporal Resolution, selected year: 1990(< 10% cloud cover only)
9 Data Availability: Monitoring , RapidEye 2 coverages / year, rainy and dry season Maximum 10 % cloud cover Co-registration accuracy: min. 2 pixels Geo-location accuracy: 25 m No. of tiles: 2011: : : TB
 Spatial resolution: 6,5m, ortho product: 5m")

10 Available Satellite Data: RapidEye Caracteristics Level 3A o Geo-rectified, ortho-rectified (2 pixels = 10 m) Spatial resolution: 6,5m, ortho product: 5m Spectral Resolution: 5 bands o RGB, NIR, RedEdge Acquired temporal coverage: o Dry season: January. April o Rainy season: May Oct. for 2011 / 2012 / 2013 Sonora, /07/


11 Available Satellite Data: RapidEye Landsat RapidEye Minimum Mapping Unit (0,125 ha *12,5m) 12

12 Work flow implemented in CONABIO


13 Data Different Conditions Blue skies Cirrus cloud Cumulonimbus atmosphere phenology March 1993 July 1993 Dec. 1993


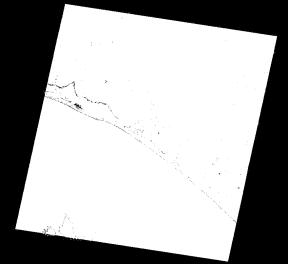
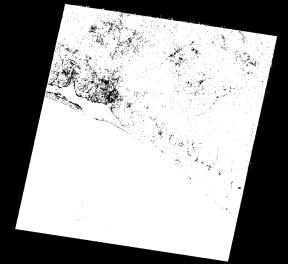
14 Data Cloud Masking

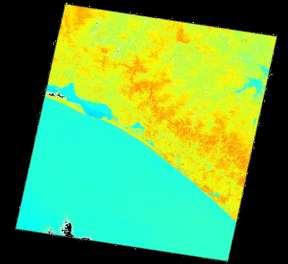
15 Vegetation Indices, here NDVI


16 Multi-temporal features, descriptive stats Minimum Maximum Range - NDVI - Tasseled Cap Average Standard deviation


17 Results: e.g.: more detailed 1:100,000 vs. 1:250,000 System generates a much more detailed product, especially on edges:

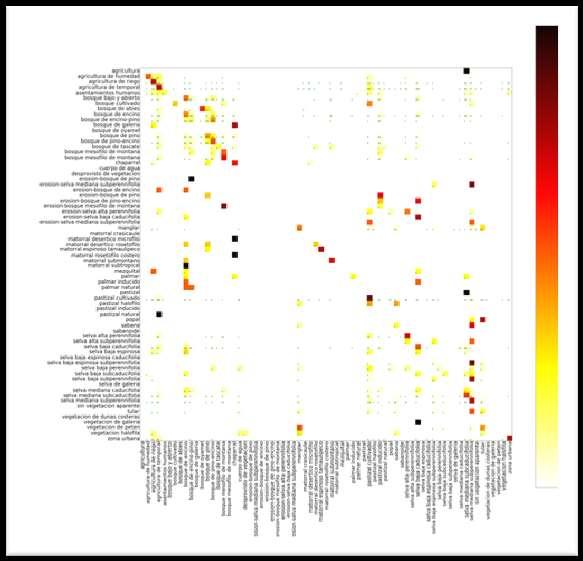
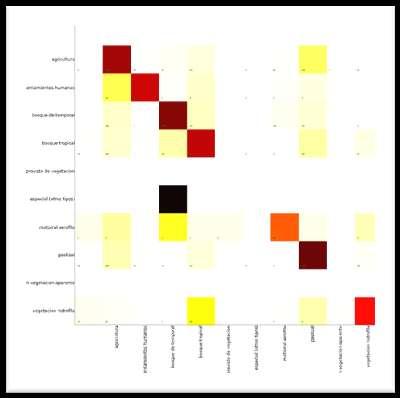
18 Results: processed data so far for testing Separability analysis to discuss land cover classification scheme:

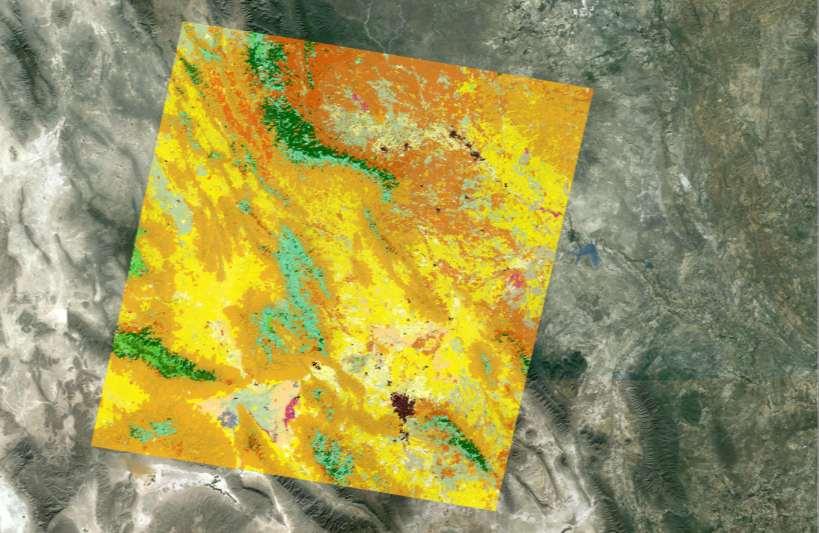
19 Results: samples
20 Validation and Calibration
21 Definition: Degradation LGCC Ley General de Cambio Climatico Reduction of carbon content in natural vegetation, ecosystems and soils induced by human activity LGEEPA Ley General de Equilibrio Ecologico y Protección ambiental The process of reductions in the capacity to offer ESS such as productivity

22 E.G.: Max. Tree Height
23 E.G.: Tree Density
24 Degradation in a national and a REDD + context Index of ecosystem integity = STRUTURAL DIVERSITY + FUNCTONAL DIVERSITY + RICHNESS The Index will need to address: Temporal component Spatial component Structural component Flora componets Fauna component Have a benchmark!!! Conabio, Michael Schmidt, 2012
25 Degradation and Monitoring of Env tl Safeguards (incl. Biodiversity) Estimated Sampling Size: Birds: 1554 Mammals: 1657 Plant Density: 4046
26 Next Steps and cooperation opportunities for further RS work for REDD Degradation Mapping Combine optical and SAR data to improve RL / Base Line support degradation monitoring 3 products relevant from SAR data: biomass (current and historic products, X, C, L-band data) change detection, hi-res X-band 3-1 m change in canopy density, hi-res, X-band Capacity Building in SAR Conabio/Conafor
Remote Sensing Phenology. Bradley Reed Principal Scientist USGS National Center for Earth Resources Observation and Science Sioux Falls, SD
 Remote Sensing Phenology Bradley Reed Principal Scientist USGS National Center for Earth Resources Observation and Science Sioux Falls, SD Remote Sensing Phenology Potential to provide wall-to-wall phenology
Inter-Calibration of the RapidEye Sensors with Landsat 8, Sentinel and SPOT
 Inter-Calibration of the RapidEye Sensors with Landsat 8, Sentinel and SPOT Dr. Andreas Brunn, Dr. Horst Weichelt, Dr. Rene Griesbach, Dr. Pablo Rosso Content About Planet Project Context (Purpose and
What is Remote Sensing? Contents. Image Fusion in Remote Sensing. 1. Optical imagery in remote sensing. Electromagnetic Spectrum
 Contents Image Fusion in Remote Sensing Optical imagery in remote sensing Image fusion in remote sensing New development on image fusion Linhai Jing Applications Feb. 17, 2011 2 1. Optical imagery in remote
Application and potentials of RADAR and LiDAR technologies for forest carbon assessment in Pacific Island Countries
 Application and potentials of RADAR and LiDAR technologies for forest carbon assessment in Pacific Island Countries June 19th, 2012 PNGFA-JICA Workshop Masamichi HARAGUCHI (Kokusai Kogyo Co., Ltd.) Consultant
SUGARCANE GROUND REFERENCE DATA OVER FOUR FIELDS IN SÃO PAULO STATE
 SUGARCANE GROUND REFERENCE DATA OVER FOUR FIELDS IN SÃO PAULO STATE Document created: 23/02/2016 by R.A. Molijn. INTRODUCTION This document is meant as a guide to the dataset and gives an insight into
Image Band Transformations
 Image Band Transformations Content Band math Band ratios Vegetation Index Tasseled Cap Transform Principal Component Analysis (PCA) Decorrelation Stretch Image Band Transformation Purposes Image band transforms
Spectral Signatures. Vegetation. 40 Soil. Water WAVELENGTH (microns)
") Spectral Signatures % REFLECTANCE VISIBLE NEAR INFRARED Vegetation Soil Water.5. WAVELENGTH (microns). Spectral Reflectance of Urban Materials 5 Parking Lot 5 (5=5%) Reflectance 5 5 5 5 5 Wavelength (nm)
Spectral Signatures % REFLECTANCE VISIBLE NEAR INFRARED Vegetation Soil Water.5. WAVELENGTH (microns). Spectral Reflectance of Urban Materials 5 Parking Lot 5 (5=5%) Reflectance 5 5 5 5 5 Wavelength (nm)
REMOTE SENSING. Topic 10 Fundamentals of Digital Multispectral Remote Sensing MULTISPECTRAL SCANNERS MULTISPECTRAL SCANNERS
 REMOTE SENSING Topic 10 Fundamentals of Digital Multispectral Remote Sensing Chapter 5: Lillesand and Keifer Chapter 6: Avery and Berlin MULTISPECTRAL SCANNERS Record EMR in a number of discrete portions
Dirty REMOTE SENSING Lecture 3: First Steps in classifying Stuart Green Earthobservation.wordpress.com
 Dirty REMOTE SENSING Lecture 3: First Steps in classifying Stuart Green Earthobservation.wordpress.com Stuart.Green@Teagasc.ie You have your image, but is it any good? Is it full of cloud? Is it the right
Center for Advanced Land Management Information Technologies (CALMIT), School of Natural Resources, University of Nebraska-Lincoln
, School of Natural Resources, University of Nebraska-Lincoln") Geoffrey M. Henebry, Andrés Viña, and Anatoly A. Gitelson Center for Advanced Land Management Information Technologies (CALMIT), School of Natural Resources, University of Nebraska-Lincoln Introduction
Geoffrey M. Henebry, Andrés Viña, and Anatoly A. Gitelson Center for Advanced Land Management Information Technologies (CALMIT), School of Natural Resources, University of Nebraska-Lincoln Introduction
Present and future of marine production in Boka Kotorska
 Present and future of marine production in Boka Kotorska First results from satellite remote sensing for the breeding areas of filter feeders in the Bay of Kotor INTRODUCTION Environmental monitoring is
Landsat 8 and Sentinel 2 higher order products: input to S2DUP. Chris Justice (UMD) Curtis Woodcock (BU), Martin Claverie (UMD/GSFC)
 Curtis Woodcock (BU), Martin Claverie (UMD/GSFC)") Landsat 8 and Sentinel 2 higher order products: input to S2DUP Chris Justice (UMD) Curtis Woodcock (BU), Martin Claverie (UMD/GSFC) MODIS Land Products Energy Balance Product Suite Surface Reflectance
Landsat 8 and Sentinel 2 higher order products: input to S2DUP Chris Justice (UMD) Curtis Woodcock (BU), Martin Claverie (UMD/GSFC) MODIS Land Products Energy Balance Product Suite Surface Reflectance
DEVELOPMENT OF A NEW SOUTH AFRICAN LAND-COVER DATASET USING AUTOMATED MAPPING TECHINQUES. Mark Thompson 1
 DEVELOPMENT OF A NEW SOUTH AFRICAN LAND-COVER DATASET USING AUTOMATED MAPPING TECHINQUES. Mark Thompson 1 1 GeoTerraImage Pty Ltd, Pretoria, South Africa Abstract This talk will discuss the development
Separation of crop and vegetation based on Digital Image Processing
 Separation of crop and vegetation based on Digital Image Processing Mayank Singh Sakla 1, Palak Jain 2 1 M.TECH GEOMATICS student, CEPT UNIVERSITY 2 M.TECH GEOMATICS student, CEPT UNIVERSITY Word Limit
NON-PHOTOGRAPHIC SYSTEMS: Multispectral Scanners Medium and coarse resolution sensor comparisons: Landsat, SPOT, AVHRR and MODIS
 NON-PHOTOGRAPHIC SYSTEMS: Multispectral Scanners Medium and coarse resolution sensor comparisons: Landsat, SPOT, AVHRR and MODIS CLASSIFICATION OF NONPHOTOGRAPHIC REMOTE SENSORS PASSIVE ACTIVE DIGITAL
Introduction to Remote Sensing
 Introduction to Remote Sensing Daniel McInerney Urban Institute Ireland, University College Dublin, Richview Campus, Clonskeagh Drive, Dublin 14. 16th June 2009 Presentation Outline 1 2 Spaceborne Sensors
The techniques with ERDAS IMAGINE include:
 The techniques with ERDAS IMAGINE include: 1. Data correction - radiometric and geometric correction 2. Radiometric enhancement - enhancing images based on the values of individual pixels 3. Spatial enhancement
Field size estimation, past and future opportunities
 Field size estimation, past and future opportunities Lin Yan & David Roy Geospatial Sciences Center of Excellence South Dakota State University February 13-15 th 2018 Advances in Emerging Technologies
University of Texas at San Antonio EES 5053 Term Project CORRELATION BETWEEN NDVI AND SURFACE TEMPERATURES USING LANDSAT ETM + IMAGERY NEWFEL MAZARI
 University of Texas at San Antonio EES 5053 Term Project CORRELATION BETWEEN NDVI AND SURFACE TEMPERATURES USING LANDSAT ETM + IMAGERY NEWFEL MAZARI Introduction and Objectives The present study is a correlation
Data acquisition and access for the Congo Basin
 MRV Joint Workshop 22-24 June 2010, Guadalajara, Jalisco Mexico Data acquisition and access for the Congo Basin Landing Mané 1, Michael Brady 2, Chris Justice 3 and Alice Altstatt 3 1) Satellite Observatory
Satellite Imagery and Remote Sensing. DeeDee Whitaker SW Guilford High EES & Chemistry
 Satellite Imagery and Remote Sensing DeeDee Whitaker SW Guilford High EES & Chemistry whitakd@gcsnc.com Outline What is remote sensing? How does remote sensing work? What role does the electromagnetic
In late April of 1986 a nuclear accident damaged a reactor at the Chernobyl nuclear
 CHERNOBYL NUCLEAR POWER PLANT ACCIDENT Long Term Effects on Land Use Patterns Project Introduction: In late April of 1986 a nuclear accident damaged a reactor at the Chernobyl nuclear power plant in Ukraine.
An Introduction to Remote Sensing & GIS. Introduction
 An Introduction to Remote Sensing & GIS Introduction Remote sensing is the measurement of object properties on Earth s surface using data acquired from aircraft and satellites. It attempts to measure something
PHENOLOGY OBSERVED BY SENTINEL-2 AND DIGITAL CAMERAS: OPTIONS AND CHALLENGES. Anton Vrieling
 PHENOLOGY OBSERVED BY SENTINEL-2 AND DIGITAL CAMERAS: OPTIONS AND CHALLENGES Anton Vrieling NDVI SERIES Phenology: need for frequent observations before, during, and after key phenological phases Phase
Introduction to Remote Sensing Fundamentals of Satellite Remote Sensing. Mads Olander Rasmussen
 Introduction to Remote Sensing Fundamentals of Satellite Remote Sensing Mads Olander Rasmussen (mora@dhi-gras.com) 01. Introduction to Remote Sensing DHI What is remote sensing? the art, science, and technology
Atmospheric Correction (including ATCOR)
") Technical Specifications Atmospheric Correction (including ATCOR) The data obtained by optical satellite sensors with high spatial resolution has become an invaluable tool for many groups interested in
Technical Specifications Atmospheric Correction (including ATCOR) The data obtained by optical satellite sensors with high spatial resolution has become an invaluable tool for many groups interested in
Image interpretation and analysis
 Image interpretation and analysis Grundlagen Fernerkundung, Geo 123.1, FS 2014 Lecture 7a Rogier de Jong Michael Schaepman Why are snow, foam, and clouds white? Why are snow, foam, and clouds white? Today
Remote Sensing for Rangeland Applications
 Remote Sensing for Rangeland Applications Jay Angerer Ecological Training June 16, 2012 Remote Sensing The term "remote sensing," first used in the United States in the 1950s by Ms. Evelyn Pruitt of the
Satellite Remote Sensing: Earth System Observations
 Satellite Remote Sensing: Earth System Observations Land surface Water Atmosphere Climate Ecosystems 1 EOS (Earth Observing System) Develop an understanding of the total Earth system, and the effects of
TimeSync V3 User Manual. January Introduction
 TimeSync V3 User Manual January 2017 Introduction TimeSync is an application that allows researchers and managers to characterize and quantify disturbance and landscape change by facilitating plot-level
Remote sensing in archaeology from optical to lidar. Krištof Oštir ModeLTER Scientific Research Centre of the Slovenian Academy of Sciences and Arts
 Remote sensing in archaeology from optical to lidar Krištof Oštir ModeLTER Scientific Research Centre of the Slovenian Academy of Sciences and Arts Introduction Optical remote sensing Systems Search for
NORMALIZING ASTER DATA USING MODIS PRODUCTS FOR LAND COVER CLASSIFICATION
 NORMALIZING ASTER DATA USING MODIS PRODUCTS FOR LAND COVER CLASSIFICATION F. Gao a, b, *, J. G. Masek a a Biospheric Sciences Branch, NASA Goddard Space Flight Center, Greenbelt, MD 20771, USA b Earth
Documenting Land Cover and Vegetation Productivity Changes in the NWT using the Landsat Satellite Archive
 Documenting Land Cover and Vegetation Productivity Changes in the NWT using the Landsat Satellite Archive Fraser, R.H 1, Olthof, I. 1, Deschamps, A. 1, Pregitzer, M. 1, Kokelj, S. 2, Lantz, T. 3,Wolfe,
Data Requirements Definition and Data Services Options for RAPP
 Data Requirements Definition and Data Services Options for RAPP Brian Killough CEOS Systems Engineering Office (SEO) 5 th GEOGLAM RAPP Workshop Frascati, Italy May 16-17, 2017 Requirements Update The observation
An NDVI image provides critical crop information that is not visible in an RGB or NIR image of the same scene. For example, plants may appear green
 Normalized Difference Vegetation Index (NDVI) Spectral Band calculation that uses the visible (RGB) and near-infrared (NIR) bands of the electromagnetic spectrum NDVI= + An NDVI image provides critical
Image transformations
 Image transformations Digital Numbers may be composed of three elements: Atmospheric interference (e.g. haze) ATCOR Illumination (angle of reflection) - transforms Albedo (surface cover) Image transformations
Assessment of Spatiotemporal Changes in Vegetation Cover using NDVI in The Dangs District, Gujarat
 Assessment of Spatiotemporal Changes in Vegetation Cover using NDVI in The Dangs District, Gujarat Using SAGA GIS and Quantum GIS Tutorial ID: IGET_CT_003 This tutorial has been developed by BVIEER as
REMOTE SENSING WITH DRONES. YNCenter Video Conference Chang Cao
 REMOTE SENSING WITH DRONES YNCenter Video Conference Chang Cao 08-28-2015 28 August 2015 2 Drone remote sensing It was first utilized in military context and has been given great attention in civil use
Introduction to TimeSync A Tool For Landsat Time Series Visualization. Warren B Cohen, USDA Forest Service Zhiqiang Yang, Oregon State University
 Introduction to TimeSync A Tool For Landsat Time Series Visualization Warren B Cohen, USDA Forest Service Zhiqiang Yang, Oregon State University TimeSync Introduction Landsat time series visualization
EnMAP Environmental Mapping and Analysis Program
 EnMAP Environmental Mapping and Analysis Program www.enmap.org Mathias Schneider Mission Objectives Regular provision of high-quality calibrated hyperspectral data Precise measurement of ecosystem parameters
Introduction to Remote Sensing
 Introduction to Remote Sensing Spatial, spectral, temporal resolutions Image display alternatives Vegetation Indices Image classifications Image change detections Accuracy assessment Satellites & Air-Photos
Green/Blue Metrics Meeting June 20, 2017 Summary
 Short round table introductions of participants Paul Villenueve, Carleton, Co-lead Green/Blue, Matilda van den Bosch, UBC, Co-lead Green/Blue Dan Crouse, UNB Lorien Nesbitt, UBC Audrey Smargiassi, Uof
APCAS/10/21 April 2010 ASIA AND PACIFIC COMMISSION ON AGRICULTURAL STATISTICS TWENTY-THIRD SESSION. Siem Reap, Cambodia, April 2010
 APCAS/10/21 April 2010 Agenda Item 8 ASIA AND PACIFIC COMMISSION ON AGRICULTURAL STATISTICS TWENTY-THIRD SESSION Siem Reap, Cambodia, 26-30 April 2010 The Use of Remote Sensing for Area Estimation by Robert
MULTIPURPOSE QUADCOPTER SOLUTION FOR AGRICULTURE
 MULTIPURPOSE QUADCOPTER SOLUTION FOR AGRICULTURE Powered by COVERS UP TO 30HA AT 70M FLIGHT ALTITUDE PER BATTERY PHOTO & VIDEO FULL HD 1080P - 14MP 3-AXIS STABILIZATION INCLUDES NDVI & ZONING MAPS SERVICE
MULTIRESOLUTION SPOT-5 DATA FOR BOREAL FOREST MONITORING
 MULTIRESOLUTION SPOT-5 DATA FOR BOREAL FOREST MONITORING M. G. Rosengren, E. Willén Metria Miljöanalys, P.O. Box 24154, SE-104 51 Stockholm, Sweden - (mats.rosengren, erik.willen)@lm.se KEY WORDS: Remote
Land cover change methods. Ned Horning
 Land cover change methods Ned Horning Version: 1.0 Creation Date: 2004-01-01 Revision Date: 2004-01-01 License: This document is licensed under a Creative Commons Attribution-Share Alike 3.0 Unported License.
The Landsat Legacy: Monitoring a Changing Earth. U.S. Department of the Interior U.S. Geological Survey
 The Landsat Legacy: Monitoring a Changing Earth U.S. Department of the Interior U.S. Geological Survey Tom Loveland March 17, 2001 Landsat Science Mission Change is occurring at rates unprecedented in
Rainer Ressl Director General de Geomática
 Rainer Ressl Director General de Geomática Latin America Geospatial Forum, Mexico D.F., 2015 SERVICES DEVELOPMENT ANALYSIS / MONITORING DR Receiving Station Geoportal 2.0 Geovisualization Ecosystem monitoring
9/12/2011. Training Course Remote Sensing Basic Theory & Image Processing Methods September 2011
 Training Course Remote Sensing Basic Theory & Image Processing Methods 19 23 September 2011 Popular Remote Sensing Sensors & their Selection Michiel Damen (September 2011) damen@itc.nl 1 Overview Low resolution
remote sensing? What are the remote sensing principles behind these Definition
 Introduction to remote sensing: Content (1/2) Definition: photogrammetry and remote sensing (PRS) Radiation sources: solar radiation (passive optical RS) earth emission (passive microwave or thermal infrared
SUGAR_GIS. From a user perspective. Provides spatial distribution of a wide range of sugarcane production data in an easy to use and sensitive way.
 SUGAR_GIS From a user perspective What is Sugar_GIS? A web-based, decision support tool. Provides spatial distribution of a wide range of sugarcane production data in an easy to use and sensitive way.
Keywords: Agriculture, Olive Trees, Supervised Classification, Landsat TM, QuickBird, Remote Sensing.
 Classification of agricultural fields by using Landsat TM and QuickBird sensors. The case study of olive trees in Lesvos island. Christos Vasilakos, University of the Aegean, Department of Environmental
Detecting artificial areas inside reference parcels. A technique to assist the evaluation of non-eligibility in agriculture
 1 Detecting artificial areas inside reference parcels. A technique to assist the evaluation of non-eligibility in agriculture R. de Kok, C.Wirnhardt EC Joint Research Centre, IES Motivation Wall-to-wall
Sources of Geographic Information
 Sources of Geographic Information Data properties: Spatial data, i.e. data that are associated with geographic locations Data format: digital (analog data for traditional paper maps) Data Inputs: sampled
Introduction of Satellite Remote Sensing
 Introduction of Satellite Remote Sensing Spatial Resolution (Pixel size) Spectral Resolution (Bands) Resolutions of Remote Sensing 1. Spatial (what area and how detailed) 2. Spectral (what colors bands)
Lecture 13: Remotely Sensed Geospatial Data
 Lecture 13: Remotely Sensed Geospatial Data A. The Electromagnetic Spectrum: The electromagnetic spectrum (Figure 1) indicates the different forms of radiation (or simply stated light) emitted by nature.
NASA Earth Exchange (NEX)
") NASA Earth Exchange (NEX) Ramakrishna Nemani Ames Research Center NASA Advanced Supercomputing (NAS) Division Moffett Field, CA LCLUC Meeting, Yangon, January 15, 2016 OVERVIEW + NEX is virtual collaborative
NASA Earth Exchange (NEX) Ramakrishna Nemani Ames Research Center NASA Advanced Supercomputing (NAS) Division Moffett Field, CA LCLUC Meeting, Yangon, January 15, 2016 OVERVIEW + NEX is virtual collaborative
AT-SATELLITE REFLECTANCE: A FIRST ORDER NORMALIZATION OF LANDSAT 7 ETM+ IMAGES
 AT-SATELLITE REFLECTANCE: A FIRST ORDER NORMALIZATION OF LANDSAT 7 ETM+ IMAGES Chengquan Huang*, Limin Yang, Collin Homer, Bruce Wylie, James Vogelman and Thomas DeFelice Raytheon ITSS, EROS Data Center
Improvements in Landsat Pathfinder Methods for Monitoring Tropical Deforestation and Their Extension to Extra-tropical Areas
 Improvements in Landsat Pathfinder Methods for Monitoring Tropical Deforestation and Their Extension to Extra-tropical Areas PI: John R. G. Townshend Department of Geography (and Institute for Advanced
GROßFLÄCHIGE UND HOCHFREQUENTE BEOBACHTUNG VON AGRARFLÄCHEN DURCH OPTISCHE SATELLITEN (RAPIDEYE, LANDSAT 8, SENTINEL-2)
") GROßFLÄCHIGE UND HOCHFREQUENTE BEOBACHTUNG VON AGRARFLÄCHEN DURCH OPTISCHE SATELLITEN (RAPIDEYE, LANDSAT 8, SENTINEL-2) Karsten Frotscher Produktmanager Landwirtschaft Slide 1 A Couple Of Words About The
GROßFLÄCHIGE UND HOCHFREQUENTE BEOBACHTUNG VON AGRARFLÄCHEN DURCH OPTISCHE SATELLITEN (RAPIDEYE, LANDSAT 8, SENTINEL-2) Karsten Frotscher Produktmanager Landwirtschaft Slide 1 A Couple Of Words About The
MULTI-TEMPORAL IMAGE ANALYSIS OF THE COASTAL WATERSHED, NH INTRODUCTION
 MULTI-TEMPORAL IMAGE ANALYSIS OF THE COASTAL WATERSHED, NH Meghan Graham MacLean, PhD Student Alexis M. Rudko, MS Student Dr. Russell G. Congalton, Professor Department of Natural Resources and the Environment
Fringe 2015 Workshop
 Fringe 2015 Workshop On the Estimation and Interpretation of Sentinel-1 TOPS InSAR Coherence Urs Wegmüller, Maurizio Santoro, Charles Werner and Oliver Cartus Gamma Remote Sensing AG - S1 IWS InSAR and
Using NDVI dynamics as an indicator of native vegetation management in a heterogeneous and highly fragmented landscape
 20th International Congress on Modelling and Simulation, Adelaide, Australia, 1 6 December 2013 www.mssanz.org.au/modsim2013 Using NDVI dynamics as an indicator of native vegetation management in a heterogeneous
REMOTE SENSING FOR FLOOD HAZARD STUDIES.
 REMOTE SENSING FOR FLOOD HAZARD STUDIES. OPTICAL SENSORS. 1 DRS. NANETTE C. KINGMA 1 Optical Remote Sensing for flood hazard studies. 2 2 Floods & use of remote sensing. Floods often leaves its imprint
Plant Health Monitoring System Using Raspberry Pi
 Volume 119 No. 15 2018, 955-959 ISSN: 1314-3395 (on-line version) url: http://www.acadpubl.eu/hub/ http://www.acadpubl.eu/hub/ 1 Plant Health Monitoring System Using Raspberry Pi Jyotirmayee Dashᵃ *, Shubhangi
PROGRESS REPORT MAPPING THE RIPARIAN VEGETATION USING MULTIPLE HYPERSPECTRAL AIRBORNE IMAGERY OVER THE REPUBLICAN RIVER, NEBRASKA
 PROGRESS REPORT MAPPING THE RIPARIAN VEGETATION USING MULTIPLE HYPERSPECTRAL AIRBORNE IMAGERY OVER THE REPUBLICAN RIVER, NEBRASKA PROJECT SUMMARY By Dr. Ayse Irmak and Dr. Sami Akasheh As the dependency
REMOTE SENSING INTERPRETATION
 REMOTE SENSING INTERPRETATION Jan Clevers Centre for Geo-Information - WU Remote Sensing --> RS Sensor at a distance EARTH OBSERVATION EM energy Earth RS is a tool; one of the sources of information! 1
Update on Landsat Program and Landsat Data Continuity Mission
 Update on Landsat Program and Landsat Data Continuity Mission Dr. Jeffrey Masek LDCM Deputy Project Scientist NASA GSFC, Code 923 November 21, 2002 Draft LDCM Implementation Phase RFP Overview Page 1 Celebrate!
Preparing for the exploitation of Sentinel-2 data for agriculture monitoring. JACQUES Damien, DEFOURNY Pierre UCL-Geomatics Lab 2 octobre 2013
 Preparing for the exploitation of Sentinel-2 data for agriculture monitoring JACQUES Damien, DEFOURNY Pierre UCL-Geomatics Lab 2 octobre 2013 Agriculture monitoring, why? - Growing speculation on food
to Geospatial Technologies
 What s in a Pixel? A Primer for Remote Sensing What s in a Pixel Development UNH Cooperative Extension Geospatial Technologies Training Center Shane Bradt UConn Cooperative Extension Geospatial Technology
RADAR (RAdio Detection And Ranging)
") RADAR (RAdio Detection And Ranging) CLASSIFICATION OF NONPHOTOGRAPHIC REMOTE SENSORS PASSIVE ACTIVE DIGITAL CAMERA THERMAL (e.g. TIMS) VIDEO CAMERA MULTI- SPECTRAL SCANNERS VISIBLE & NIR MICROWAVE Real
RADAR (RAdio Detection And Ranging) CLASSIFICATION OF NONPHOTOGRAPHIC REMOTE SENSORS PASSIVE ACTIVE DIGITAL CAMERA THERMAL (e.g. TIMS) VIDEO CAMERA MULTI- SPECTRAL SCANNERS VISIBLE & NIR MICROWAVE Real
Remote Sensing and Image Processing: 4
 Remote Sensing and Image Processing: 4 Dr. Mathias (Mat) Disney UCL Geography Office: 301, 3rd Floor, Chandler House Tel: 7670 4290 Email: mdisney@geog.ucl.ac.uk www.geog.ucl.ac.uk/~mdisney 1 Image display
Using Freely Available. Remote Sensing to Create a More Powerful GIS
 Using Freely Available Government Data and Remote Sensing to Create a More Powerful GIS All rights reserved. ENVI, E3De, IAS, and IDL are trademarks of Exelis, Inc. All other marks are the property of
Leica - 3 rd Generation Airborne Digital Sensors Features / Benefits for Remote Sensing & Environmental Applications
 Leica - 3 rd Generation Airborne Digital Sensors Features / Benefits for Remote Sensing & Environmental Applications Arthur Rohrbach, Sensor Sales Dir Europe, Middle-East and Africa (EMEA) Luzern, Switzerland,
NASA Missions and Products: Update. Garik Gutman, LCLUC Program Manager NASA Headquarters Washington, DC
 NASA Missions and Products: Update Garik Gutman, LCLUC Program Manager NASA Headquarters Washington, DC 1 JPSS-2 (NOAA) SLI-TBD Formulation in 2015 RBI OMPS-Limb [[TSIS-2]] [[TCTE]] Land Monitoring at
Precision Remote Sensing and Image Processing for Precision Agriculture (PA)
") Precision Remote Sensing and Image Processing for Precision Agriculture (PA) Dr. Jack F. Paris Presented to Colorado State University, Fort Collins, CO October 20, 2005 Speaker s Current Activities: Consultant
Precision Remote Sensing and Image Processing for Precision Agriculture (PA) Dr. Jack F. Paris Presented to Colorado State University, Fort Collins, CO October 20, 2005 Speaker s Current Activities: Consultant
Use of FORMOSAT images over the Gourma site (Mali)
") Use of FORMOSAT images over the Gourma site (Mali) E. Mougin, V. Demarez, P. Hiernaux, L. Kergoat, V. Le Dantec, M. Grippa, Y. Auda, F. Timouk Photo: Doug Parker Content The study site FORMOSAT data Field
Use of FORMOSAT images over the Gourma site (Mali) E. Mougin, V. Demarez, P. Hiernaux, L. Kergoat, V. Le Dantec, M. Grippa, Y. Auda, F. Timouk Photo: Doug Parker Content The study site FORMOSAT data Field
DISCO-PRO AG ALL-IN-ONE DRONE SOLUTION FOR PRECISION AGRICULTURE. 80ha COVERAGE PARROT SEQUOIA INCLUDES MULTI-PURPOSE TOOL SAFE ANALYZE & DECIDE
 DISCO-PRO AG ALL-IN-ONE DRONE SOLUTION FOR PRECISION AGRICULTURE Powered by 80ha COVERAGE AT 120M * FLIGHT ALTITUDE (200AC @ 400FT) MULTI-PURPOSE TOOL PHOTO 14MPX VIDEO 1080P FULL HD PARROT SEQUOIA RGB
Land Cover Analysis to Determine Areas of Clear-cut and Forest Cover in Olney, Montana. Geob 373 Remote Sensing. Dr Andreas Varhola, Kathry De Rego
 1 Land Cover Analysis to Determine Areas of Clear-cut and Forest Cover in Olney, Montana Geob 373 Remote Sensing Dr Andreas Varhola, Kathry De Rego Zhu an Lim (14292149) L2B 17 Apr 2016 2 Abstract Montana
Development of normalized vegetation, soil and water indices derived from satellite remote sensing data
 Development of normalized vegetation, soil and water indices derived from satellite remote sensing data Takeuchi, W. & Yasuoka, Y. IIS/UT, Japan E-mail: wataru@iis.u-tokyo.ac.jp Nov. 25th, 2004 ACRS2004
Detecting Greenery in Near Infrared Images of Ground-level Scenes
 Detecting Greenery in Near Infrared Images of Ground-level Scenes Piotr Łabędź Agnieszka Ozimek Institute of Computer Science Cracow University of Technology Digital Landscape Architecture, Dessau Bernburg
CURRENT SCENARIO AND CHALLENGES IN THE ANALYSIS OF MULTITEMPORAL REMOTE SENSING IMAGES
 Remote Sensing Laboratory Dept. of Information Engineering and Computer Science University of Trento Via Sommarive, 14, I-38123 Povo, Trento, Italy CURRENT SCENARIO AND CHALLENGES IN THE ANALYSIS OF MULTITEMPORAL
Global Land Survey Activities and Land Cover Analysis from Landsat
 Global Land Survey Activities and Land Cover Analysis from Landsat Shannon Franks, SGT/NASA Jeffrey G. Masek, NASA GSFC Garik Gutman, NASA HQ Rachel Headley, USGS CODATA, October 25, 2010 Background the
Caatinga - Appendix. Collection 3. Version 1. General coordinator Washington J. S. Franca Rocha (UEFS)
") Caatinga - Appendix Collection 3 Version 1 General coordinator Washington J. S. Franca Rocha (UEFS) Team Diego Pereira Costa (UEFS/GEODATIN) Frans Pareyn (APNE) José Luiz Vieira (APNE) Rodrigo N. Vasconcelos
Caatinga - Appendix Collection 3 Version 1 General coordinator Washington J. S. Franca Rocha (UEFS) Team Diego Pereira Costa (UEFS/GEODATIN) Frans Pareyn (APNE) José Luiz Vieira (APNE) Rodrigo N. Vasconcelos
Introduction to Remote Sensing
 Introduction to Remote Sensing Outline Remote Sensing Defined Resolution Electromagnetic Energy (EMR) Types Interpretation Applications Remote Sensing Defined Remote Sensing is: The art and science of
Evaluation of Sentinel-2 bands over the spectrum
 Evaluation of Sentinel-2 bands over the spectrum S.E. Hosseini Aria, M. Menenti, Geoscience and Remote sensing Department Delft University of Technology, Netherlands 1 outline ointroduction - Concept odata
- Regridding / Projection - Compositing for Sentinel-2 & Landsat 8 merged products
 - Regridding / Projection - Compositing for Sentinel-2 & Landsat 8 merged products Roy, D.P., Kovalskyy, V., Zhang, H.K., Yan, L., Kumar. S. Geospatial Science Center of Excellence South Dakota State University
USING LANDSAT MULTISPECTRAL IMAGES IN ANALYSING FOREST VEGETATION
 Technical Sciences 243 USING LANDSAT MULTISPECTRAL IMAGES IN ANALYSING FOREST VEGETATION Teodor TODERA teotoderas@yahoo.com Traian CR CEA traiancracea@yahoo.com Alina NEGOESCU alina.negoescu@yahoo.com
Summary. Introduction. Remote Sensing Basics. Selecting a Remote Sensing Product
 K. Dalsted, J.F. Paris, D.E. Clay, S.A. Clay, C.L. Reese, and J. Chang SSMG-40 Selecting the Appropriate Satellite Remote Sensing Product for Precision Farming Summary Given the large number of satellite
Detecting and Mapping Invasive Phragmites australis in the Coastal Great Lakes with ALOS PALSAR Imagery
 Detecting and Mapping Invasive Phragmites australis in the Coastal Great Lakes with ALOS PALSAR Imagery Brian Huberty U.S Fish & Wildlife Service Region 3 Ecological Services Laura L. Bourgeau-Chavez,
GIS Data Collection. Remote Sensing
 GIS Data Collection Remote Sensing Data Collection Remote sensing Introduction Concepts Spectral signatures Resolutions: spectral, spatial, temporal Digital image processing (classification) Other systems
Sommersemester Prof. Dr. Christoph Kleinn Institut für Waldinventur und Waldwachstum Arbeitsbereich Fernerkundung und Waldinventur.
 Basics of Remote Sensing Some literature references Franklin, SE 2001 Remote Sensing for Sustainable Forest Management Lewis Publishers 407p Lillesand, Kiefer 2000 Remote Sensing and Image Interpretation
Determining the green vegetation fraction from RapidEye data for use in regional climate simulations
 Research Unit 1695 Determining the green vegetation fraction from RapidEye data for use in regional climate simulations Kristina Imukova, Joachim Ingwersen and Thilo Streck Institute of Soil Science and
Monitoring the vegetation success of a rehabilitated mine site using multispectral UAV imagery. Tim Whiteside & Renée Bartolo, eriss
 Monitoring the vegetation success of a rehabilitated mine site using multispectral UAV imagery Tim Whiteside & Renée Bartolo, eriss About the Supervising Scientist Main roles Working to protect the environment
Environmental Remote Sensing GEOG 2021
 Environmental Remote Sensing GEOG 2021 Lecture 2 Image display and enhancement 2 Image Display and Enhancement Purpose visual enhancement to aid interpretation enhancement for improvement of information
PLANET IMAGERY PRODUCT SPECIFICATION: PLANETSCOPE & RAPIDEYE
 PLANET IMAGERY PRODUCT SPECIFICATION: PLANETSCOPE & RAPIDEYE LAST UPDATED OCTOBER 2016 SALES@PLANET.COM PLANET.COM Table of Contents LIST OF FIGURES 3 LIST OF TABLES 3 GLOSSARY 5 1. OVERVIEW OF DOCUMENT
Wetlands Investigation Utilizing GIS and Remote Sensing Technology for Lucas County, Ohio: a hybrid analysis.
 Wetlands Investigation Utilizing GIS and Remote Sensing Technology for Lucas County, Ohio: a hybrid analysis. Update on current wetlands research in GISAG Nathan Torbick Spring 2003 Component One Remote
1. Theory of remote sensing and spectrum
 1. Theory of remote sensing and spectrum 7 August 2014 ONUMA Takumi Outline of Presentation Electromagnetic wave and wavelength Sensor type Spectrum Spatial resolution Spectral resolution Mineral mapping
Satellite data processing and analysis: Examples and practical considerations
 Satellite data processing and analysis: Examples and practical considerations Dániel Kristóf Ottó Petrik, Róbert Pataki, András Kolesár International LCLUC Regional Science Meeting in Central Europe Sopron,
Introduction. Introduction. Introduction. Introduction. Introduction
 Identifying habitat change and conservation threats with satellite imagery Extinction crisis Volker Radeloff Department of Forest Ecology and Management Extinction crisis Extinction crisis Conservationists