AERATOR MIXING STATION
|
|
|
- Edith Hall
- 6 years ago
- Views:
Transcription
1 AERATOR MIXING STATION Steady State, Step Response Analysis, Sine and Relay Analysis, Root Locus Green Team: Marc Labrie Matt Baltimore Michael Newman Michael Sherrit University of Tennessee at Chattanooga March 29, 2011 ENGR 3280L
2 OVERVIEW System Overview SSOC Analysis Step Response Analysis FOPDT Modeling FOPDT Analysis Sine Analysis Relay Analysis Root Locus plot Conclusions

3 SYSTEM DIAGRAM

4 SCHEMATIC OF THE SYSTEM Speed Recording Controller Speed Transmitter Speed Controller


5 EXPERIMENTAL DATA ANALYSIS 75 rpm 6 rpm 75+/- 12 rpm

6 STEADY STATE OPERATING CURVE Operating Ranges 0-25% lower 25-50% lower mid 50-75% upper mid % upper
7


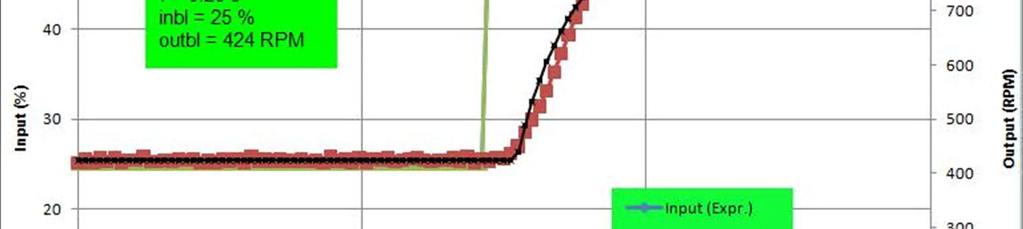
8 STEP RESPONSE EXPERIMENTAL DATA UP


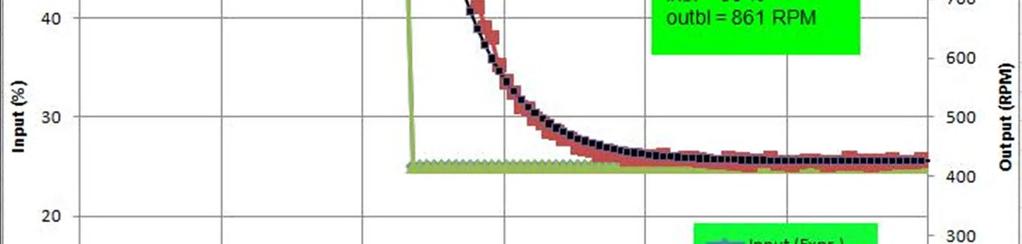
9 STEP RESPONSE DATA UP CONTINUED To=.1sec (Black Lines) Tau=.4s (Green Lines)
10 STEP RESPONSE DATA DOWN


11 STEP RESPONSE DATA UP CONTINUED To=.1s (Black Lines) Tau=.4s (Green Lines)
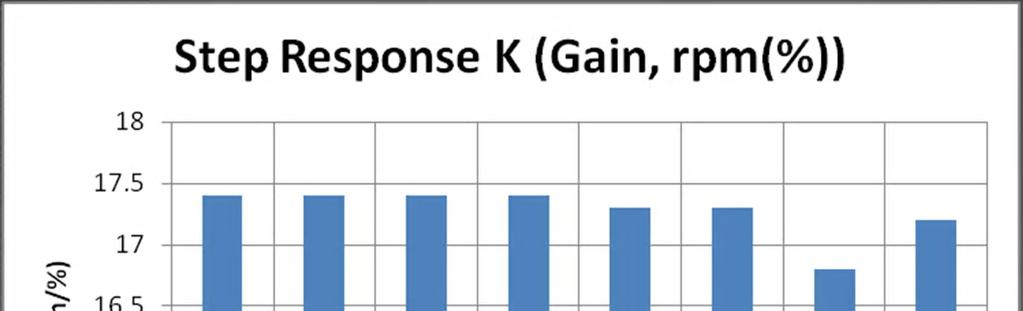

12 RESULTS
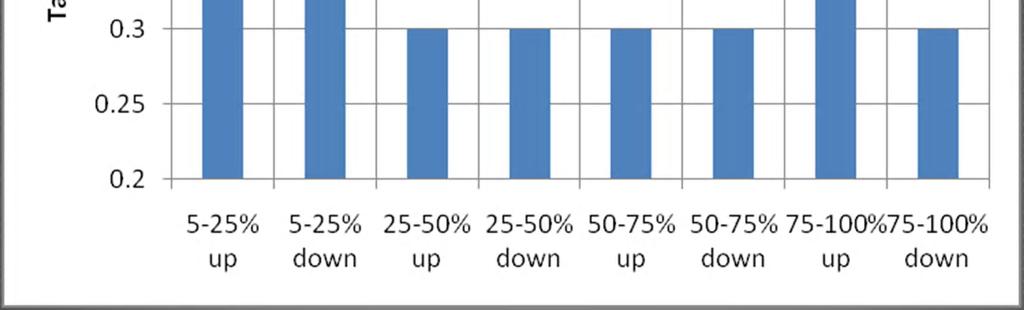
13 CONTINUED 0.12 Step Response Dead Time, t0 (Dead Time) Time (s) %-25% Up 0%-25% Down 25%-50% Up 25%-50% Down 50%-75% Up 50%-75%Down 75%-100% Up 75%-100% Down
14 CONTINUED
15 FOPDT THEORY FOPDT Transfer Function For step functions the Manipulated variable m(t) and the Output c(t) are:

16 Model Output

17 Model Output
18 FOPDT MODEL Model Equation System Output c(t) can be modeled by changing K,τ,to, and td. Parameters for 25-50% Step up td (s) A (%) K (RPM/%) to (s) τ(s) Inbl. (%) Outbl. (RPM) Parameters for 25-50% Step-down td (s) A (%) K (RPM/%) to (s) τ(s) Inbl. (%) Outbl. (RPM)
19 Gain, K (RPM/%) Up Experimental Up Model Down Experimental Down Model K (RPM/%) % 25-50% 50-75% %
20 Dead Time (sec) Up Experimental Up Model Down Experimental Down Model Time (sec) % 25-50% 50-75% %
21 Time Constant, τ(sec) Up Experimental Up Model Down Experimental Down Model Time (s) % 25-50% 50-75% %
22
23 SINE RESPONSE Input Speed (RPM)
24 Frequency Response (f=0.5) Output (RPM) Ar = ± 0.03 PA = -38 ± Time (s) Output(RPM) Input Value(%) MWN 3/01/ Input (%)
25 Amplitude Ratio (RPM/%) K = 17.6 RPM/% τ= 0.17 s t 0 = 0.3 s fu = 3.2 Hz Kcu= 0.4 RPM/% Order = 2 Amplitude Ratio (Ar) A Frequency (Hz) MWN 3/01/ Phase Angle (degrees) MWN 3/01/2011 Phase Angle (PA) Frequency (Hz)
26 Sine Response Theory
27 Amplitude Ratio Frequency (Hz) Experimental MWN Model 3/02/2011 K = 17.4 RPM/% τ= 0.2 s t 0 = 0.1 s 10 Amplitude Ratio(RPM/%) 1 Phase Angle Frequency (Hz) Experimental Model MWN 3/02/ Phase Angle (degrees)
28 Gain, K (RPM/%) Experimental Model K (RPM/%) % - 74% 75% - 99% Input (%)
29 Dead Time, t 0 (s) 0.35 Experimental Model t 0 (s) % - 74% 75% - 99% Input (%)
30 Time Constant, τ (s) Experimental Model Tau (s) % - 74% 75% - 99% Input (%)
31 Ultimate Frequency, fu (Hz) Experimental fu (Hz) % - 74% 75% - 99% Input (%)
32 Ultimate Controller Gain, K cu (%/RPM) Experimental K cu (%/RPM) % - 74% 75% - 99% Input (%)
33 50-100% Relay Response Trial Input (%) Output (RPM) Time (s)
34 20 K (RPM/%) Frequency Response Relay Response
35 0.5 τ (sec) Frequency Response Relay Response
36 0.12 to (sec) Frequency Response Relay Response
37


38 TRANSFER FUNCTION The transfer function for an FOPDT system is After substituting Pade s approximation and simplifying, the transfer function becomes


39 TRANSFER FUNCTION (CONT D) The transfer function for a proportional feedback controller is For an FOPDT system with proportional control, the OLTF is And the characteristic equation becomes 1 + OLTF = 0
40 ROOT LOCUS MODEL ROOT LOCUS PLOT IMAGINARY AXIS REAL AXIS -20
41 KCU COMPARISON Kcu MSS 3/27/11 Root locus Relay Frequency % 25-50% 50-75% %
42 FU COMPARISON Fu Root locus 6 5 MSS 3/27/11 Relay Frequency % 25-50% 50-75% %
43 USEFUL KCU RANGE GREEN TEAM ROOT LOCUS PLOT MWN 3/27/11 Kc 1/ K cu IMAGINARY AXIS Over-damped Region Kc 1/500 Kc 1/10 Kcd REAL AXIS Underdamped Region Kcu= 0.29 RPM/% Kc 1/4 = 0.19 RPM/% Kc 1/10 = 0.14 RPM/% Kc 1/500 = 0.06 RPM/% Kcd= 0.02 RPM/%
44
45 CONCLUSIONS The SSOC shows a linear correlation between input power and voltage The operating range of the system is 0-100% The gain (K) of the system calculated is equal to the slope of the SSOC and experimental vs. model results match closely. The to (dead time) was consistent throughout the experiments
46 CONCLUSIONS CONTINUED From the experimental Bode plot the order is 2. The sine response model shows the best estimate of the FOPDT parameters Best FOPDT Estimate K (RPM/%) 17.3 τ (sec) 0.2 t 0 (sec) 0.1
47 CONCLUSIONS CONTINUED The Kcu from the Root Locus model agreed with what was found from previous experiments. The Fu from the Root Locus model did not agree with what was found from previous experiments. The useful range of Kcu for the speed system varies between 0.06 RPM/% and 0.29 RPM/%.
AERATOR MIXING STATION
 AERATOR MIXING STATION Green Team: Marc Labrie Matt Baltimore Michael Newman Michael Sherrit University of Tennessee at Chattanooga April 13, 211 ENGR 328L OVERVIEW System Overview SSOC Analysis Step Response
University of Tennessee at Chattanooga. Step Response Modeling. Control Systems Laboratory
 University of Tennessee at Chattanooga Step Response Modeling Control Systems Laboratory By Stephen Rue Tan Team (Stephanie Raulston, Stefan Hanley) Course: ENGR 3280L Section: 000 Date: 03/06/2013 Instructor:
Proportional-Integral Controller Performance
 Proportional-Integral Controller Performance Silver Team Jonathan Briere ENGR 329 Dr. Henry 4/1/21 Silver Team Members: Jordan Buecker Jonathan Briere John Colvin 1. Introduction Modeling for the response
Using Root Locus Modeling for Proportional Controller Design for Spray Booth Pressure System
 1 University of Tennessee at Chattanooga Engineering 3280L Using Root Locus Modeling for Proportional Controller Design for Spray Booth Pressure System By: 2 Introduction: The objectives for these experiments
Lab Report 4: Root Locus and Proportional Controller
 Lab Report 4: Root Locus and Proportional Controller University of Tennessee at Chattanooga Engineering 32 Blue Team Kevin Schrumpf Justin Anchanattu Justin Rehagen April 1, 212 Introduction The first
Aerator Mixer Speed Control System Step Response Modeling
 UTC Engineering 3280L Matthew Addison Green Team (Michael Hansen) 9/4/12 Aerator Mixer Speed Control System Step Response Modeling Introduction In this experiment a program that models the aerator mixing
UTC. Engineering 329. Frequency Response for the Flow System. Gold Team. By: Blake Nida. Partners: Roger Lemond and Stuart Rymer
 UTC Engineering 329 Frequency Response for the Flow System Gold Team By: Blake Nida Partners: Roger Lemond and Stuart Rymer March 9, 2007 Introduction: The purpose of the frequency response experiments
Frequency Response for Flow System
 Frequency Response for Flow System Report By: Ben Gordon Red Squad: Ben Klinger, Dianah Dugan UTC, Engineering 329 October 7, 2007 Introduction The objective of this experiment is to observe the output
Course: ENGR 329 Section: 001 Date: 02/26/2010 Instructor: Dr. Jim M. Henry
 1 University of Tennessee at Chattanooga Filter Wash Stations, Both Valves Closed Steady State Operating Curve Engineering 329 By Timmy Collins Lilac Team Tim Garner, Walt Mandrel and You Gao Course: ENGR
University of Tennessee at. Chattanooga
 University of Tennessee at Chattanooga Step Response Engineering 329 By Gold Team: Jason Price Jered Swartz Simon Ionashku 2-3- 2 INTRODUCTION: The purpose of the experiments was to investigate and understand
University of Tennessee at Chattanooga. Steady State and Step Response. By: Alex Bedley. Engineering 3280L. Buff. (Alexander Hudson, Ashley Poe)
") University of Tennessee at Chattanooga Steady State and Step Response By: Alex Bedley Engineering 328L Buff (Alexander Hudson, Ashley Poe) February 1, 13 Introduction In the past two experiments, we were
University of Tennessee at Chattanooga Steady State and Step Response By: Alex Bedley Engineering 328L Buff (Alexander Hudson, Ashley Poe) February 1, 13 Introduction In the past two experiments, we were
Steady-State and Step Response for the Flow System
 Steady-State and Step Response for the Flow System Report By: Dianah Dugan Red Squad: Ben Klinger, Ben Gordon UTC, Engineering 329 September 19, 2007 Introduction: The objectives of this experiment are
Steady State Operating Curve
 Steady State Operating Curve By Lanze Berry University of Tennessee at Chattanooga Engineering 3280L Blue Team (Khanh Nguyen, Justin Cartwright) Course: ENGR 3280L Section: 001 Date: September 4, 2012
Steady-State and Step Response for the Flow System
 Steady-State and Step Response for the Flow System Report By: Dianah Dugan Red Squad: Ben Klinger, Ben Gordon UTC, Engineering 329 September 19, 2007 Introduction: The objectives of this experiment are
Steady State Operating Curve
 1 Steady State Operating Curve University of Tennessee at Chattanooga Engineering 3280L Instructor: Dr. Jim Henry By: Fuchsia Team: Jonathan Brewster, Jonathan Wooten Date: February 1, 2013 2 Introduction
Steady State Operating Curve Voltage Control System
 UTC Engineering 39 Steady State Operating Curve Voltage Control System Michael Edge Partners: Michael Woolery Nathan Holland September 5, 7 Introduction A steady state operating curve was created to show
PERSONALIZED EXPERIMENTATION IN CLASSICAL CONTROLS WITH MATLAB REAL TIME WINDOWS TARGET AND PORTABLE AEROPENDULUM KIT
 Eniko T. Enikov, University of Arizona Estelle Eke, California State University Sacramento PERSONALIZED EXPERIMENTATION IN CLASSICAL CONTROLS WITH MATLAB REAL TIME WINDOWS TARGET AND PORTABLE AEROPENDULUM
Lab 11. Speed Control of a D.C. motor. Motor Characterization
 Lab 11. Speed Control of a D.C. motor Motor Characterization Motor Speed Control Project 1. Generate PWM waveform 2. Amplify the waveform to drive the motor 3. Measure motor speed 4. Estimate motor parameters
CDS 101/110: Lecture 8.2 PID Control
 CDS 11/11: Lecture 8.2 PID Control November 16, 216 Goals: Nyquist Example Introduce and review PID control. Show how to use loop shaping using PID to achieve a performance specification Discuss the use
MTE 360 Automatic Control Systems University of Waterloo, Department of Mechanical & Mechatronics Engineering
 MTE 36 Automatic Control Systems University of Waterloo, Department of Mechanical & Mechatronics Engineering Laboratory #1: Introduction to Control Engineering In this laboratory, you will become familiar
LECTURE FOUR Time Domain Analysis Transient and Steady-State Response Analysis
 LECTURE FOUR Time Domain Analysis Transient and Steady-State Response Analysis 4.1 Transient Response and Steady-State Response The time response of a control system consists of two parts: the transient
MAE106 Laboratory Exercises Lab # 5 - PD Control of DC motor position
 MAE106 Laboratory Exercises Lab # 5 - PD Control of DC motor position University of California, Irvine Department of Mechanical and Aerospace Engineering Goals Understand how to implement and tune a PD
EMPIRICAL MODEL IDENTIFICATION AND PID CONTROLLER TUNING FOR A FLOW PROCESS
 Volume 118 No. 20 2018, 2015-2021 ISSN: 1311-8080 (printed version); ISSN: 1314-3395 (on-line version) url: http://www.ijpam.eu ijpam.eu EMPIRICAL MODEL IDENTIFICATION AND PID CONTROLLER TUNING FOR A FLOW
, answer the next six questions.
 Frequency Response Problems Conceptual Questions 1) T/F Given f(t) = A cos (ωt + θ): The amplitude of the output in sinusoidal steady-state increases as K increases and decreases as ω increases. 2) T/F
Teaching Mechanical Students to Build and Analyze Motor Controllers
 Teaching Mechanical Students to Build and Analyze Motor Controllers Hugh Jack, Associate Professor Padnos School of Engineering Grand Valley State University Grand Rapids, MI email: jackh@gvsu.edu Session
Hands-on Lab. PID Closed-Loop Control
 Hands-on Lab PID Closed-Loop Control Adding feedback improves performance. Unity feedback was examined to serve as a motivating example. Lectures derived the power of adding proportional, integral and
University of Tennessee at Chattanooga. Stead State Operating Curve Report. Engr 3280L/Week 3. William Disterdick. Brown Team
 1 University of Tennessee at Chattanooga Stead State Operating Curve Report Engr 3280L/Week 3 By Brown Team (Trent, William, William) 09/05/2012 2 Introduction: In this laboratory, a percentage of power
Introduction to Signals and Systems Lecture #9 - Frequency Response. Guillaume Drion Academic year
 Introduction to Signals and Systems Lecture #9 - Frequency Response Guillaume Drion Academic year 2017-2018 1 Transmission of complex exponentials through LTI systems Continuous case: LTI system where
Comparative Study of PID Controller tuning methods using ASPEN HYSYS
 Comparative Study of PID Controller tuning methods using ASPEN HYSYS Bhavatharini S #1, Abirami S #2, Arun Prem Anand N #3 # Department of Chemical Engineering, Sri Venkateswara College of Engineering
BME 3512 Bioelectronics Laboratory Two - Passive Filters
 BME 35 Bioelectronics Laboratory Two - Passive Filters Learning Objectives: Understand the basic principles of passive filters. Laboratory Equipment: Agilent Oscilloscope Model 546A Agilent Function Generator
CHBE320 LECTURE XI CONTROLLER DESIGN AND PID CONTOLLER TUNING. Professor Dae Ryook Yang
 CHBE320 LECTURE XI CONTROLLER DESIGN AND PID CONTOLLER TUNING Professor Dae Ryook Yang Spring 2018 Dept. of Chemical and Biological Engineering 11-1 Road Map of the Lecture XI Controller Design and PID
Chapter 6 Controller Design Using Design Tools
 Chapter 6 Controller Design Using Design Tools Defining Good Process Test Data The process should be at steady state before data collection starts The test dynamics should clearly dominate the process
Root Locus Design. by Martin Hagan revised by Trevor Eckert 1 OBJECTIVE
 TAKE HOME LABS OKLAHOMA STATE UNIVERSITY Root Locus Design by Martin Hagan revised by Trevor Eckert 1 OBJECTIVE The objective of this experiment is to design a feedback control system for a motor positioning
Motor Modeling and Position Control Lab 3 MAE 334
 Motor ing and Position Control Lab 3 MAE 334 Evan Coleman April, 23 Spring 23 Section L9 Executive Summary The purpose of this experiment was to observe and analyze the open loop response of a DC servo
Diodes. Sections
 iodes Sections 3.3.1 3.3.8 1 Modeling iode Characteristics Exponential model nonlinearity makes circuit analysis difficult. Two common approaches are graphical analysis and iterative analysis For simple
JNTUWORLD. 6 The unity feedback system whose open loop transfer function is given by G(s)=K/s(s 2 +6s+10) Determine: (i) Angles of asymptotes *****
=K/s(s 2 +6s+10) Determine: (i) Angles of asymptotes *****") Code: 9A050 III B. Tech I Semester (R09) Regular Eaminations, November 0 Time: hours Ma Marks: 70 (a) What is a mathematical model of a physical system? Eplain briefly. (b) Write the differential equations
Code: 9A050 III B. Tech I Semester (R09) Regular Eaminations, November 0 Time: hours Ma Marks: 70 (a) What is a mathematical model of a physical system? Eplain briefly. (b) Write the differential equations
CHAPTER 6 INTRODUCTION TO SYSTEM IDENTIFICATION
 CHAPTER 6 INTRODUCTION TO SYSTEM IDENTIFICATION Broadly speaking, system identification is the art and science of using measurements obtained from a system to characterize the system. The characterization
Electronics and Instrumentation Name ENGR-4220 Fall 1999 Section Modeling the Cantilever Beam Supplemental Info for Project 1.
 Name ENGR-40 Fall 1999 Section Modeling the Cantilever Beam Supplemental Info for Project 1 The cantilever beam has a simple equation of motion. If we assume that the mass is located at the end of the
TEMPERATURE PROCESS CONTROL MANUAL. Penn State Chemical Engineering
 TEMPERATURE PROCESS CONTROL MANUAL Penn State Chemical Engineering Revised Summer 2015 Contents LEARNING OBJECTIVES... 3 EXPERIMENTAL OBJECTIVES AND OVERVIEW... 3 Pre-lab study:... 3 Experiments in the
Homework Assignment 07
 Homework Assignment 07 Question 1 (Short Takes). 2 points each unless otherwise noted. 1. A single-pole op-amp has an open-loop low-frequency gain of A = 10 5 and an open loop, 3-dB frequency of 4 Hz.
Engineering Discovery
 Modeling, Computing, & Measurement: Measurement Systems # 4 Dr. Kevin Craig Professor of Mechanical Engineering Rensselaer Polytechnic Institute 1 Frequency Response and Filters When you hear music and
Various Controller Design and Tuning Methods for a First Order Plus Dead Time Process
 International Journal of Computer Science & Communication Vol. 1, No. 2, July-December 2010, pp. 161-165 Various Controller Design and Tuning Methods for a First Order Plus Dead Time Process Pradeep Kumar
EEL2216 Control Theory CT2: Frequency Response Analysis
 EEL2216 Control Theory CT2: Frequency Response Analysis 1. Objectives (i) To analyse the frequency response of a system using Bode plot. (ii) To design a suitable controller to meet frequency domain and
PHY203: General Physics III Lab page 1 of 5 PCC-Cascade. Lab: AC Circuits
 PHY203: General Physics III Lab page 1 of 5 Lab: AC Circuits OBJECTIVES: EQUIPMENT: Universal Breadboard (Archer 276-169) 2 Simpson Digital Multimeters (464) Function Generator (Global Specialties 2001)*
Mechatronics. Analog and Digital Electronics: Studio Exercises 1 & 2
 Mechatronics Analog and Digital Electronics: Studio Exercises 1 & 2 There is an electronics revolution taking place in the industrialized world. Electronics pervades all activities. Perhaps the most important
ENGR-4300 Electronic Instrumentation Quiz 2 Fall 2011 Name Section
 ENGR-43 Quiz 2 Fall 211 ENGR-43 Electronic Instrumentation Quiz 2 Fall 211 Name Section Question I (2 points) Question II (2 points) Question III (2 points) Question I (2 points) Question (2 points) Total
STUDY OF RC AND RL CIRCUITS Venue: Microelectronics Laboratory in E2 L2
 EXPERIMENT #1 STUDY OF RC AND RL CIRCUITS Venue: Microelectronics Laboratory in E2 L2 I. INTRODUCTION This laboratory is about verifying the transient behavior of RC and RL circuits. You need to revise
Dr Ian R. Manchester
 Week Content Notes 1 Introduction 2 Frequency Domain Modelling 3 Transient Performance and the s-plane 4 Block Diagrams 5 Feedback System Characteristics Assign 1 Due 6 Root Locus 7 Root Locus 2 Assign
Research Article 12 Control of the Fractionator Top Pressure for a Delayed Coking Unit in Khartoum Refinery
 Research Article 12 Control of the Fractionator Top Pressure for a Delayed Coking Unit in Khartoum Refinery Salah Eldeen F..Hegazi 1, Gurashi Abdallah Gasmelseed 2, Mohammed M.Bukhari 3 1 Department of
Laboratory PID Tuning Based On Frequency Response Analysis. 2. be able to evaluate system performance for empirical tuning method;
 Laboratory PID Tuning Based On Frequency Response Analysis Objectives: At the end, student should 1. appreciate a systematic way of tuning PID loop by the use of process frequency response analysis; 2.
The Discussion of this exercise covers the following points: Angular position control block diagram and fundamentals. Power amplifier 0.
 Exercise 6 Motor Shaft Angular Position Control EXERCISE OBJECTIVE When you have completed this exercise, you will be able to associate the pulses generated by a position sensing incremental encoder with
Transmit filter designs for ADSL modems
 EE 233 Laboratory-4 1. Objectives Transmit filter designs for ADSL modems Design a filter from a given topology and specifications. Analyze the characteristics of the designed filter. Use SPICE to verify
BASIC ELECTRONICS PROF. T.S. NATARAJAN DEPT OF PHYSICS IIT MADRAS
 BASIC ELECTRONICS PROF. T.S. NATARAJAN DEPT OF PHYSICS IIT MADRAS LECTURE-13 Basic Characteristic of an Amplifier Simple Transistor Model, Common Emitter Amplifier Hello everybody! Today in our series
EE 560 Electric Machines and Drives. Autumn 2014 Final Project. Contents
 EE 560 Electric Machines and Drives. Autumn 2014 Final Project Page 1 of 53 Prof. N. Nagel December 8, 2014 Brian Howard Contents Introduction 2 Induction Motor Simulation 3 Current Regulated Induction
MEM01: DC-Motor Servomechanism
 MEM01: DC-Motor Servomechanism Interdisciplinary Automatic Controls Laboratory - ME/ECE/CHE 389 February 5, 2016 Contents 1 Introduction and Goals 1 2 Description 2 3 Modeling 2 4 Lab Objective 5 5 Model
Class 5. Competency Exam Round 1. The Process Designer s Process. Process Control Preliminaries. On/Off Control The Simplest Controller
 Class 5 Competency Exam Round 1 Proportional Control Starts Friday, September 17 Ends Friday, October 1 Process Control Preliminaries The final control element, process and sensor/transmitter all have
Lab E2: B-field of a Solenoid. In the case that the B-field is uniform and perpendicular to the area, (1) reduces to
 reduces to") E2.1 Lab E2: B-field of a Solenoid In this lab, we will explore the magnetic field created by a solenoid. First, we must review some basic electromagnetic theory. The magnetic flux over some area A is
E2.1 Lab E2: B-field of a Solenoid In this lab, we will explore the magnetic field created by a solenoid. First, we must review some basic electromagnetic theory. The magnetic flux over some area A is
PROCEEDINGS OF THE SECOND INTERNATIONAL CONFERENCE ON SCIENCE AND ENGINEERING
 POCEEDINGS OF THE SECOND INTENATIONAL CONFEENCE ON SCIENCE AND ENGINEEING Organized by Ministry of Science and Technology DECEMBE -, SEDONA HOTEL, YANGON, MYANMA Design and Analysis of PID Controller for
Exam Signal Detection and Noise
 Exam Signal Detection and Noise Tuesday 27 January 2015 from 14:00 until 17:00 Lecturer: Sense Jan van der Molen Important: It is not allowed to use a calculator. Complete each question on a separate piece
LAMBDA TUNING TECHNIQUE BASED CONTROLLER DESIGN FOR AN INDUSTRIAL BLENDING PROCESS
 ISSN : 0973-7391 Vol. 3, No. 1, January-June 2012, pp. 143-146 LAMBDA TUNING TECHNIQUE BASED CONTROLLER DESIGN FOR AN INDUSTRIAL BLENDING PROCESS Manik 1, P. K. Juneja 2, A K Ray 3 and Sandeep Sunori 4
The diodes keep the output waveform from getting too large.
 Wien Bridge Oscillat CIRCUIT: The Wien bridge oscillat, see Fig., consists of two voltage dividers. It oscillates (approximately) sinusoidally at the frequency that produces the same voltage out of both
Lesson 4.6 Best Fit Line
 Lesson 4.6 Best Fit Line Concept: Using & Interpreting Best Fit Lines EQs: -How do we determine a line of best fit from a scatter plot? (S.ID.6 a,c) -What does the slope and intercept tell me about the
Motomatic Servo Control
 Exercise 2 Motomatic Servo Control This exercise will take two weeks. You will work in teams of two. 2.0 Prelab Read through this exercise in the lab manual. Using Appendix B as a reference, create a block
Lecture 7:Examples using compensators
 Lecture :Examples using compensators Venkata Sonti Department of Mechanical Engineering Indian Institute of Science Bangalore, India, This draft: March, 8 Example :Spring Mass Damper with step input Consider
Addendum Handout for the ECE3510 Project. The magnetic levitation system that is provided for this lab is a non-linear system.
 Addendum Handout for the ECE3510 Project The magnetic levitation system that is provided for this lab is a non-linear system. Because of this fact, it should be noted that the associated ideal linear responses
The Series RLC Circuit and Resonance
 Purpose Theory The Series RLC Circuit and Resonance a. To study the behavior of a series RLC circuit in an AC current. b. To measure the values of the L and C using the impedance method. c. To study the
Course Outline. Time vs. Freq. Domain Analysis. Frequency Response. Amme 3500 : System Dynamics & Control. Design via Frequency Response
 Course Outline Amme 35 : System Dynamics & Control Design via Frequency Response Week Date Content Assignment Notes Mar Introduction 2 8 Mar Frequency Domain Modelling 3 5 Mar Transient Performance and
Electrical Engineering. Control Systems. Comprehensive Theory with Solved Examples and Practice Questions. Publications
 Electrical Engineering Control Systems Comprehensive Theory with Solved Examples and Practice Questions Publications Publications MADE EASY Publications Corporate Office: 44-A/4, Kalu Sarai (Near Hauz
ECE4902 Lab 5 Simulation. Simulation. Export data for use in other software tools (e.g. MATLAB or excel) to compare measured data with simulation
 to compare measured data with simulation") ECE4902 Lab 5 Simulation Simulation Export data for use in other software tools (e.g. MATLAB or excel) to compare measured data with simulation Be sure to have your lab data available from Lab 5, Common
ECE4902 Lab 5 Simulation Simulation Export data for use in other software tools (e.g. MATLAB or excel) to compare measured data with simulation Be sure to have your lab data available from Lab 5, Common
-binary sensors and actuators (such as an on/off controller) are generally more reliable and less expensive
 are generally more reliable and less expensive") Process controls are necessary for designing safe and productive plants. A variety of process controls are used to manipulate processes, however the most simple and often most effective is the PID controller.
Process controls are necessary for designing safe and productive plants. A variety of process controls are used to manipulate processes, however the most simple and often most effective is the PID controller.
E. Slope-Intercept Form and Direct Variation (pp )
") and Direct Variation (pp. 32 35) For any two points, there is one and only one line that contains both points. This fact can help you graph a linear equation. Many times, it will be convenient to use the
and Direct Variation (pp. 32 35) For any two points, there is one and only one line that contains both points. This fact can help you graph a linear equation. Many times, it will be convenient to use the
POLYTECHNIC UNIVERSITY Electrical Engineering Department. EE SOPHOMORE LABORATORY Experiment 3 The Oscilloscope
 POLYTECHNIC UNIVERSITY Electrical Engineering Department EE SOPHOMORE LABORATORY Experiment 3 The Oscilloscope Modified for Physics 18, Brooklyn College I. Overview of the Experiment The main objective
ME 375 System Modeling and Analysis
 ME 375 System Modeling and Analysis G(s) H(s) Section 9 Block Diagrams and Feedback Control Spring 2009 School of Mechanical Engineering Douglas E. Adams Associate Professor 9.1 Key Points to Remember
Comparison of Signal Attenuation of Multiple Frequencies Between Passive and Active High-Pass Filters
 Comparison of Signal Attenuation of Multiple Frequencies Between Passive and Active High-Pass Filters Aaron Batker Pritzker Harvey Mudd College 23 November 203 Abstract Differences in behavior at different
Trigonometric Equations
 Chapter Three Trigonometric Equations Solving Simple Trigonometric Equations Algebraically Solving Complicated Trigonometric Equations Algebraically Graphs of Sine and Cosine Functions Solving Trigonometric
Frequency Response Analysis and Design Tutorial
 1 of 13 1/11/2011 5:43 PM Frequency Response Analysis and Design Tutorial I. Bode plots [ Gain and phase margin Bandwidth frequency Closed loop response ] II. The Nyquist diagram [ Closed loop stability
Design of Model Based PID Controller Tuning for Pressure Process
 ISSN (Print) : 3 3765 Design of Model Based PID Controller Tuning for Pressure Process A.Kanchana 1, G.Lavanya, R.Nivethidha 3, S.Subasree 4, P.Aravind 5 UG student, Dept. of ICE, Saranathan College Engineering,
Intermediate and Advanced Labs PHY3802L/PHY4822L
 Intermediate and Advanced Labs PHY3802L/PHY4822L Torsional Oscillator and Torque Magnetometry Lab manual and related literature The torsional oscillator and torque magnetometry 1. Purpose Study the torsional
Lab 5 Second Order Transient Response of Circuits
 Lab 5 Second Order Transient Response of Circuits Lab Performed on November 5, 2008 by Nicole Kato, Ryan Carmichael, and Ti Wu Report by Ryan Carmichael and Nicole Kato E11 Laboratory Report Submitted
Homework Assignment 06
 Question 1 (2 points each unless noted otherwise) Homework Assignment 06 1. True or false: when transforming a circuit s diagram to a diagram of its small-signal model, we replace dc constant current sources
Lab #2: Electrical Measurements II AC Circuits and Capacitors, Inductors, Oscillators and Filters
 Lab #2: Electrical Measurements II AC Circuits and Capacitors, Inductors, Oscillators and Filters Goal: In circuits with a time-varying voltage, the relationship between current and voltage is more complicated
ANNA UNIVERSITY :: CHENNAI MODEL QUESTION PAPER(V-SEMESTER) B.E. ELECTRONICS AND COMMUNICATION ENGINEERING EC334 - CONTROL SYSTEMS
 B.E. ELECTRONICS AND COMMUNICATION ENGINEERING EC334 - CONTROL SYSTEMS") ANNA UNIVERSITY :: CHENNAI - 600 025 MODEL QUESTION PAPER(V-SEMESTER) B.E. ELECTRONICS AND COMMUNICATION ENGINEERING EC334 - CONTROL SYSTEMS Time: 3hrs Max Marks: 100 Answer all Questions PART - A (10
ANNA UNIVERSITY :: CHENNAI - 600 025 MODEL QUESTION PAPER(V-SEMESTER) B.E. ELECTRONICS AND COMMUNICATION ENGINEERING EC334 - CONTROL SYSTEMS Time: 3hrs Max Marks: 100 Answer all Questions PART - A (10
Running Laboratory Experiments via the World Wide Web
 3513 Running Laboratory Experiments via the World Wide Web Jim Henry The University of Tennessee at Chattanooga Abstract The chemical engineering laboratories at the University of Tennessee at Chattanooga
Välkomna till TSRT15 Reglerteknik Föreläsning 5. Summary of lecture 4 Frequency response Bode plot
 Välkomna till TSRT15 Reglerteknik Föreläsning 5 Summary of lecture 4 Frequency response Bode plot Summary of last lecture 2 Given a pole polynomial with a varying parameter P(s)+KQ(s)=0 We draw the location
Experiment 3 Topic: Dynamic System Response Week A Procedure
 Experiment 3 Topic: Dynamic System Response Week A Procedure Laboratory Assistant: Email: Office Hours: LEX-3 Website: Brock Hedlund bhedlund@nd.edu 11/05 11/08 5 pm to 6 pm in B14 http://www.nd.edu/~jott/measurements/measurements_lab/e3
EE Experiment 8 Bode Plots of Frequency Response
 EE16:Exp8-1 EE 16 - Experiment 8 Bode Plots of Frequency Response Objectives: To illustrate the relationship between a system frequency response and the frequency response break frequencies, factor powers,
Magnetic Levitation System
 Magnetic Levitation System Electromagnet Infrared LED Phototransistor Levitated Ball Magnetic Levitation System K. Craig 1 Magnetic Levitation System Electromagnet Emitter Infrared LED i Detector Phototransistor
Experiment 2: Transients and Oscillations in RLC Circuits
 Experiment 2: Transients and Oscillations in RLC Circuits Will Chemelewski Partner: Brian Enders TA: Nielsen See laboratory book #1 pages 5-7, data taken September 1, 2009 September 7, 2009 Abstract Transient
Comparative Analysis of Controller Tuning Techniques for Dead Time Processes
 Comparative Analysis of Controller Tuning Techniques for Dead Time Processes Parvesh Saini *, Charu Sharma Department of Electrical Engineering Graphic Era Deemed to be University, Dehradun, Uttarakhand,
Modeling and Analysis of Systems Lecture #9 - Frequency Response. Guillaume Drion Academic year
 Modeling and Analysis of Systems Lecture #9 - Frequency Response Guillaume Drion Academic year 2015-2016 1 Outline Frequency response of LTI systems Bode plots Bandwidth and time-constant 1st order and
AC Theory and Electronics
 AC Theory and Electronics An Alternating Current (AC) or Voltage is one whose amplitude is not constant, but varies with time about some mean position (value). Some examples of AC variation are shown below:
Tutorial #2: Simulating Transformers in Multisim. In this tutorial, we will discuss how to simulate two common types of transformers in Multisim.
 SCHOOL OF ENGINEERING AND APPLIED SCIENCE DEPARTMENT OF ELECTRICAL AND COMPUTER ENGINEERING ECE 2115: ENGINEERING ELECTRONICS LABORATORY Tutorial #2: Simulating Transformers in Multisim INTRODUCTION In
Science Binder and Science Notebook. Discussions
 Lane Tech H. Physics (Joseph/Machaj 2016-2017) A. Science Binder Science Binder and Science Notebook Name: Period: Unit 1: Scientific Methods - Reference Materials The binder is the storage device for
Lecture 9. Lab 16 System Identification (2 nd or 2 sessions) Lab 17 Proportional Control
 Lab 17 Proportional Control") 246 Lecture 9 Coming week labs: Lab 16 System Identification (2 nd or 2 sessions) Lab 17 Proportional Control Today: Systems topics System identification (ala ME4232) Time domain Frequency domain Proportional
246 Lecture 9 Coming week labs: Lab 16 System Identification (2 nd or 2 sessions) Lab 17 Proportional Control Today: Systems topics System identification (ala ME4232) Time domain Frequency domain Proportional
Poles and Zeros of H(s), Analog Computers and Active Filters
, Analog Computers and Active Filters") Poles and Zeros of H(s), Analog Computers and Active Filters Physics116A, Draft10/28/09 D. Pellett LRC Filter Poles and Zeros Pole structure same for all three functions (two poles) HR has two poles and
Poles and Zeros of H(s), Analog Computers and Active Filters Physics116A, Draft10/28/09 D. Pellett LRC Filter Poles and Zeros Pole structure same for all three functions (two poles) HR has two poles and
Experimental drawing of Nyquist and Bode diagrams
 Experimental drawing of Nyquist and Bode diagrams 1 Theoretical aspects Frequency response i.e. can be plotted in several ways; two of them are (1) as a polar plot, where the phasor length is the magnitude
PID Tuner (ver. 1.0)
") PID Tuner (ver. 1.0) Product Help Czech Technical University in Prague Faculty of Mechanical Engineering Department of Instrumentation and Control Engineering This product was developed within the subject
PID Tuner (ver. 1.0) Product Help Czech Technical University in Prague Faculty of Mechanical Engineering Department of Instrumentation and Control Engineering This product was developed within the subject
BME/ISE 3512 Bioelectronics Laboratory Two - Passive Filters
 BME/ISE 35 Bioelectronics Laboratory Two - Passive Filters Learning Objectives: Understand the basic principles of passive filters. Supplies and Components: Breadboard 4.7 K Resistor 0.047 F Capacitor
5 Lab 5: Position Control Systems - Week 2
 5 Lab 5: Position Control Systems - Week 2 5.7 Introduction In this lab, you will convert the DC motor to an electromechanical positioning actuator by properly designing and implementing a proportional
PCM BIT SYNCHRONIZATION TO AN Eb/No THRESHOLD OF -20 db
 PCM BIT SYNCHRONIZATION TO AN Eb/No THRESHOLD OF -20 db Item Type text; Proceedings Authors Schroeder, Gene F. Publisher International Foundation for Telemetering Journal International Telemetering Conference