Modeling and Analysis of Systems Lecture #9 - Frequency Response. Guillaume Drion Academic year
|
|
|
- Louise Shelton
- 6 years ago
- Views:
Transcription
1 Modeling and Analysis of Systems Lecture #9 - Frequency Response Guillaume Drion Academic year
2 Outline Frequency response of LTI systems Bode plots Bandwidth and time-constant 1st order and 2nd order systems (continuous) Rational transfer functions 2

3 Transmission of complex exponentials through LTI systems Continuous case: LTI system where is the transfer function of the LTI system. 3

4 Transmission of complex exponentials through LTI systems Discrete case: LTI system where is the transfer function of the LTI system. 4

5 How do we characterize the response of a LTI systems to Continuous case: an oscillatory signal at a specific frequency? Using the polar representation, we have 5
6 How do we characterize the response of a LTI systems to an oscillatory signal at a specific frequency? Using the polar representation, we have Change in amplitude Change in phase When an oscillatory signal goes through a LTI systems, his amplitude (amplification/attenuation) and phase (advance, delay) are affected. Not his frequency! 6
7 Frequency response of LTI systems The frequency response of a LTI system can be fully characterize by, and in particular: : GAIN (change in amplitude) : PHASE (change in phase) A change in phase in the frequency domain corresponds to a time delay in the time domain: which gives The slope of the phase curve corresponds to a delay in the time domain. 7
8 Outline Frequency response of LTI systems Bode plots Bandwidth and time-constant 1st order and 2nd order systems (continuous) Rational transfer functions 8
9 Frequency response of LTI systems The frequency response of a LTI system can be fully characterize by, and in particular: : GAIN (change in amplitude) : PHASE (change in phase) A plot of and for all frequencies gives all the informations about the frequency response of a LTI system: the BODE plots. In practice, we use a logarithmic scale for such that becomes 9
10 The Bode plots The Bode plots graphically represent the frequency response of a LTI system. They are composed of two plots: The amplitude plot (in db):. The phase plot:. For discrete time systems, we use a linear scale for the frequencies, ranging from to. 10
11 The Bode plots Examples of Bode plots of continuous (left) and discrete (right) LTI systems. 11
12 Outline Frequency response of LTI systems Bode plots Bandwidth and time-constant 1st order and 2nd order systems (continuous) Rational transfer functions 12
13 Bandwidth The bandwidth of a system is the range of frequencies that transmits faithfully through the system. We can define the bandwidth of a system the same way we defined its timeconstant: 13
14 Bandwidth We define the bandwidth of a system the same way we defined its time-constant: There is a tradeoff between the bandwidth of a system and its time-constant. Indeed, let s consider, which gives If we now consider and, we have 14
15 Outline Frequency response of LTI systems Bode plots Bandwidth and time-constant 1st order and 2nd order systems (continuous) Rational transfer functions 15
16 Time and frequency responses of 1st order systems We consider the general 1st order system of the form The transfer function of the system is given by The frequency response ( ), impulse response ( ) and step response ( ) writes H(j!) = 1 j! +1, h(t) = 1 e t/ I(t), s(t) =(1 e t/ )I(t) 16
17 Time and frequency responses of 1st order systems 17
18 Bode plots of 1st order systems: amplitude Amplitude plot: If : If : Low frequencies: constant frequency response ( ) High frequencies: frequency response linear decays by -20dB/dec. Cutoff frequency:. 18
. 19")
19 Bode plots of 1st order systems: amplitude Amplitude plot: first order systems are low-pass filters! (but the slope at HF might be too low to achieve good filtering properties...). 19
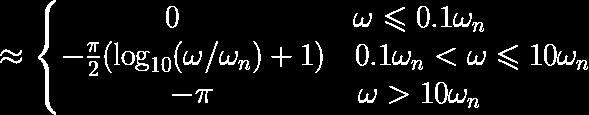
20 Bode plots of 1st order systems: phase Phase plot: Low frequencies: no phase shift. Mid frequencies: phase response decays linearly (slope = time-delay = ). High frequencies: phase-delay of. 20


21 Bode plots of 1st order systems: amplitude and phase 21
22 Time and frequency responses of 2nd order systems We consider the general 2nd order system of the form = natural frequency = damping factor The transfer function of the system is given by The frequency response writes 22
23 Time and frequency responses of 2nd order systems The transfer function of a 2nd order system is given by The transfer function has two poles: Case 1 ( ) : two real poles cascade of two first order systems. Case 2 ( ) : two complex conjugates poles. New behaviors (oscillations, overshoot, etc.) 23
24 Time and frequency responses of 2nd order systems 24


25 Bode plots of 2nd order systems Amplitude plot: Phase plot: 25
. 26")
26 Bode plots of 2nd order systems Amplitude plot: second order systems are low-pass filters! (higher slope, possible resonant frequency with overshoot in the frequency response). 26
27 Bode plots of 2nd order systems: resonant frequency If, there is an overshoot in the frequency response at a resonant frequency. The amplitude of the peak is given by For, there is no peak in the frequency response. 27
28 Time and frequency responses of 2nd order systems 28
29 Outline Frequency response of LTI systems Bode plots Bandwidth and time-constant 1st order and 2nd order systems (continuous) Rational transfer functions 29
30 Frequency response of LTI systems Bode plots of first and second order systems are building blocks for the construction of Bode plots of any LTI systems. Indeed, the transfer function of LTI systems is rational, and the denominator terms can all be expressed as or In other terms, the Bode plots of LTI systems can be sketched from the poles and zeros of the transfer function! 30
31 Frequency response of LTI systems: poles and zeros The Bode plots of LTI systems can be sketched from the poles and zeros of the transfer function! Each real pole induce a first order system response where. Each pair of complex conjugate poles system response where induce a second order Zeros induce the opposite behavior. 31
32 Frequency response of LTI systems: poles and zeros 32
33 Amplitude: Frequency response of LTI systems: Bode plots any real pole induces a decrease in the slope of -20dB/dec. any real zero induces an increase in the slope of 20dB/dec. any pair of complex conjugate poles induces a decrease in the slope of -40dB/dec. Phase: any real pole induces a decrease in the phase of. any real zero induces an increase in the phase of. any pair of complex conjugate poles induces a decrease in the phase of. 33
34 Frequency response of LTI systems: Bode plots Example: DC gain of -20dB, zero in 10 K Hz and pole in 100 K Hz. 34
35 Frequency response of LTI systems: Bode plots Example: DC gain of -20dB, zero in 10 K Hz and pole in 100 K Hz. 35
36 Frequency response of LTI systems: poles and zeros 36
Introduction to Signals and Systems Lecture #9 - Frequency Response. Guillaume Drion Academic year
 Introduction to Signals and Systems Lecture #9 - Frequency Response Guillaume Drion Academic year 2017-2018 1 Transmission of complex exponentials through LTI systems Continuous case: LTI system where
SECTION 7: FREQUENCY DOMAIN ANALYSIS. MAE 3401 Modeling and Simulation
 SECTION 7: FREQUENCY DOMAIN ANALYSIS MAE 3401 Modeling and Simulation 2 Response to Sinusoidal Inputs Frequency Domain Analysis Introduction 3 We ve looked at system impulse and step responses Also interested
PHYS225 Lecture 15. Electronic Circuits
 PHYS225 Lecture 15 Electronic Circuits Last lecture Difference amplifier Differential input; single output Good CMRR, accurate gain, moderate input impedance Instrumentation amplifier Differential input;
Bode and Log Magnitude Plots
 Bode and Log Magnitude Plots Bode Magnitude and Phase Plots System Gain and Phase Margins & Bandwidths Polar Plot and Bode Diagrams Transfer Function from Bode Plots Bode Plots of Open Loop and Closed
Lecture 16 Date: Frequency Response (Contd.)
") Lecture 16 Date: 03.10.2017 Frequency Response (Contd.) Bode Plot (contd.) Bode Plot (contd.) Bode Plot (contd.) not every transfer function has all seven factors. To sketch the Bode plots for a generic
Lecture 16 Date: 03.10.2017 Frequency Response (Contd.) Bode Plot (contd.) Bode Plot (contd.) Bode Plot (contd.) not every transfer function has all seven factors. To sketch the Bode plots for a generic
University Tunku Abdul Rahman LABORATORY REPORT 1
 University Tunku Abdul Rahman FACULTY OF ENGINEERING AND GREEN TECHNOLOGY UGEA2523 COMMUNICATION SYSTEMS LABORATORY REPORT 1 Signal Transmission & Distortion Student Name Student ID 1. Low Hui Tyen 14AGB06230
Linear Control Systems Lectures #5 - PID Controller. Guillaume Drion Academic year
 Linear Control Systems Lectures #5 - PID Controller Guillaume Drion Academic year 2018-2019 1 Outline PID controller: general form Effects of the proportional, integral and derivative actions PID tuning
NH 67, Karur Trichy Highways, Puliyur C.F, Karur District DEPARTMENT OF INFORMATION TECHNOLOGY DIGITAL SIGNAL PROCESSING UNIT 3
 NH 67, Karur Trichy Highways, Puliyur C.F, 639 114 Karur District DEPARTMENT OF INFORMATION TECHNOLOGY DIGITAL SIGNAL PROCESSING UNIT 3 IIR FILTER DESIGN Structure of IIR System design of Discrete time
(1) Identify individual entries in a Control Loop Diagram. (2) Sketch Bode Plots by hand (when we could have used a computer
 Identify individual entries in a Control Loop Diagram. (2) Sketch Bode Plots by hand (when we could have used a computer") Last day: (1) Identify individual entries in a Control Loop Diagram (2) Sketch Bode Plots by hand (when we could have used a computer program to generate sketches). How might this be useful? Can more clearly
Last day: (1) Identify individual entries in a Control Loop Diagram (2) Sketch Bode Plots by hand (when we could have used a computer program to generate sketches). How might this be useful? Can more clearly
Bode Plots. Hamid Roozbahani
 Bode Plots Hamid Roozbahani A Bode plot is a graph of the transfer function of a linear, time-invariant system versus frequency, plotted with a logfrequency axis, to show the system's frequency response.
LECTURE FOUR Time Domain Analysis Transient and Steady-State Response Analysis
 LECTURE FOUR Time Domain Analysis Transient and Steady-State Response Analysis 4.1 Transient Response and Steady-State Response The time response of a control system consists of two parts: the transient
Poles and Zeros of H(s), Analog Computers and Active Filters
, Analog Computers and Active Filters") Poles and Zeros of H(s), Analog Computers and Active Filters Physics116A, Draft10/28/09 D. Pellett LRC Filter Poles and Zeros Pole structure same for all three functions (two poles) HR has two poles and
Poles and Zeros of H(s), Analog Computers and Active Filters Physics116A, Draft10/28/09 D. Pellett LRC Filter Poles and Zeros Pole structure same for all three functions (two poles) HR has two poles and
Continuous-Time Signal Analysis FOURIER Transform - Applications DR. SIGIT PW JAROT ECE 2221
 Continuous-Time Signal Analysis FOURIER Transform - Applications DR. SIGIT PW JAROT ECE 2221 Inspiring Message from Imam Shafii You will not acquire knowledge unless you have 6 (SIX) THINGS Intelligence
CHAPTER 6 Frequency Response, Bode. Plots, and Resonance
 CHAPTER 6 Frequency Response, Bode Plots, and Resonance CHAPTER 6 Frequency Response, Bode Plots, and Resonance 1. State the fundamental concepts of Fourier analysis. 2. Determine the output of a filter
EE Experiment 8 Bode Plots of Frequency Response
 EE16:Exp8-1 EE 16 - Experiment 8 Bode Plots of Frequency Response Objectives: To illustrate the relationship between a system frequency response and the frequency response break frequencies, factor powers,
Välkomna till TSRT15 Reglerteknik Föreläsning 5. Summary of lecture 4 Frequency response Bode plot
 Välkomna till TSRT15 Reglerteknik Föreläsning 5 Summary of lecture 4 Frequency response Bode plot Summary of last lecture 2 Given a pole polynomial with a varying parameter P(s)+KQ(s)=0 We draw the location
Electronics basics for MEMS and Microsensors course
 Electronics basics for course, a.a. 2017/2018, M.Sc. in Electronics Engineering Transfer function 2 X(s) T(s) Y(s) T S = Y s X(s) The transfer function of a linear time-invariant (LTI) system is the function
3.2 Measuring Frequency Response Of Low-Pass Filter :
 2.5 Filter Band-Width : In ideal Band-Pass Filters, the band-width is the frequency range in Hz where the magnitude response is at is maximum (or the attenuation is at its minimum) and constant and equal
Andrea Zanchettin Automatic Control 1 AUTOMATIC CONTROL. Andrea M. Zanchettin, PhD Winter Semester, Linear control systems design Part 1
 Andrea Zanchettin Automatic Control 1 AUTOMATIC CONTROL Andrea M. Zanchettin, PhD Winter Semester, 2018 Linear control systems design Part 1 Andrea Zanchettin Automatic Control 2 Step responses Assume
EE 422G - Signals and Systems Laboratory
 EE 422G - Signals and Systems Laboratory Lab 3 FIR Filters Written by Kevin D. Donohue Department of Electrical and Computer Engineering University of Kentucky Lexington, KY 40506 September 19, 2015 Objectives:
Electric Circuit Theory
 Electric Circuit Theory Nam Ki Min nkmin@korea.ac.kr 010-9419-2320 Chapter 15 Active Filter Circuits Nam Ki Min nkmin@korea.ac.kr 010-9419-2320 Contents and Objectives 3 Chapter Contents 15.1 First-Order
Lecture 2 Review of Signals and Systems: Part 1. EE4900/EE6720 Digital Communications
 EE4900/EE6420: Digital Communications 1 Lecture 2 Review of Signals and Systems: Part 1 Block Diagrams of Communication System Digital Communication System 2 Informatio n (sound, video, text, data, ) Transducer
Active Filter. Low pass filter High pass filter Band pass filter Band stop filter
 Active Filter Low pass filter High pass filter Band pass filter Band stop filter Active Low-Pass Filters Basic Low-Pass filter circuit At critical frequency, esistance capacitance X c ω c πf c So, critical
Pole, zero and Bode plot
 Pole, zero and Bode plot EC04 305 Lecture notes YESAREKEY December 12, 2007 Authored by: Ramesh.K Pole, zero and Bode plot EC04 305 Lecture notes A rational transfer function H (S) can be expressed as
Signals and Systems Lecture 6: Fourier Applications
 Signals and Systems Lecture 6: Fourier Applications Farzaneh Abdollahi Department of Electrical Engineering Amirkabir University of Technology Winter 2012 arzaneh Abdollahi Signal and Systems Lecture 6
Lecture 2 Analog circuits. IR detection
 Seeing the light.. Lecture Analog circuits I t IR light V 9V V Q OP805 RL IR detection Noise sources: Electrical (60Hz, 0Hz, 80Hz.) Other electrical IR from lights IR from cameras (autofocus) Visible light
Frequency Response Analysis
 Frequency Response Analysis Continuous Time * M. J. Roberts - All Rights Reserved 2 Frequency Response * M. J. Roberts - All Rights Reserved 3 Lowpass Filter H( s) = ω c s + ω c H( jω ) = ω c jω + ω c
[ á{tå TÄàt. Chapter Four. Time Domain Analysis of control system
 Chapter Four Time Domain Analysis of control system The time response of a control system consists of two parts: the transient response and the steady-state response. By transient response, we mean that
Lecture 3 Complex Exponential Signals
 Lecture 3 Complex Exponential Signals Fundamentals of Digital Signal Processing Spring, 2012 Wei-Ta Chu 2012/3/1 1 Review of Complex Numbers Using Euler s famous formula for the complex exponential The
CHAPTER 6 INTRODUCTION TO SYSTEM IDENTIFICATION
 CHAPTER 6 INTRODUCTION TO SYSTEM IDENTIFICATION Broadly speaking, system identification is the art and science of using measurements obtained from a system to characterize the system. The characterization
Bode plot, named after Hendrik Wade Bode, is usually a combination of a Bode magnitude plot and Bode phase plot:
 Bode plot From Wikipedia, the free encyclopedia A The Bode plot for a first-order (one-pole) lowpass filter Bode plot, named after Hendrik Wade Bode, is usually a combination of a Bode magnitude plot and
Department of Electronic Engineering NED University of Engineering & Technology. LABORATORY WORKBOOK For the Course SIGNALS & SYSTEMS (TC-202)
") Department of Electronic Engineering NED University of Engineering & Technology LABORATORY WORKBOOK For the Course SIGNALS & SYSTEMS (TC-202) Instructor Name: Student Name: Roll Number: Semester: Batch:
Department of Electronic Engineering NED University of Engineering & Technology LABORATORY WORKBOOK For the Course SIGNALS & SYSTEMS (TC-202) Instructor Name: Student Name: Roll Number: Semester: Batch:
Today s topic: frequency response. Chapter 4
 Today s topic: frequency response Chapter 4 1 Small-signal analysis applies when transistors can be adequately characterized by their operating points and small linear changes about the points. The use
Comparison of Signal Attenuation of Multiple Frequencies Between Passive and Active High-Pass Filters
 Comparison of Signal Attenuation of Multiple Frequencies Between Passive and Active High-Pass Filters Aaron Batker Pritzker Harvey Mudd College 23 November 203 Abstract Differences in behavior at different
Brief Introduction to Signals & Systems. Phani Chavali
 Brief Introduction to Signals & Systems Phani Chavali Outline Signals & Systems Continuous and discrete time signals Properties of Systems Input- Output relation : Convolution Frequency domain representation
University of Michigan EECS 311: Electronic Circuits Fall 2008 LAB 2 ACTIVE FILTERS
 University of Michigan EECS 311: Electronic Circuits Fall 2008 LAB 2 ACTIVE FILTERS Issued 9/22/2008 Pre Lab Completed 9/29/2008 Lab Due in Lecture 10/6/2008 Introduction In this lab you will design a
ECE 203 LAB 2 PRACTICAL FILTER DESIGN & IMPLEMENTATION
 Version 1. 1 of 7 ECE 03 LAB PRACTICAL FILTER DESIGN & IMPLEMENTATION BEFORE YOU BEGIN PREREQUISITE LABS ECE 01 Labs ECE 0 Advanced MATLAB ECE 03 MATLAB Signals & Systems EXPECTED KNOWLEDGE Understanding
BSNL TTA Question Paper Control Systems Specialization 2007
 BSNL TTA Question Paper Control Systems Specialization 2007 1. An open loop control system has its (a) control action independent of the output or desired quantity (b) controlling action, depending upon
Lecture 2 Analog circuits. Seeing the light..
 Lecture 2 Analog circuits Seeing the light.. I t IR light V1 9V +V IR detection Noise sources: Electrical (60Hz, 120Hz, 180Hz.) Other electrical IR from lights IR from cameras (autofocus) Visible light
Lecture 18 Stability of Feedback Control Systems
 16.002 Lecture 18 Stability of Feedback Control Systems May 9, 2008 Today s Topics Stabilizing an unstable system Stability evaluation using frequency responses Take Away Feedback systems stability can
Filter Notes. You may have memorized a formula for the voltage divider - if not, it is easily derived using Ohm's law, Vo Vi
 Filter Notes You may have memorized a formula for the voltage divider - if not, it is easily derived using Ohm's law, Vo Vi R2 R+ R2 If you recall the formula for capacitive reactance, the divider formula
Lecture 2 Analog circuits...or How to detect the Alarm beacon
 Lecture 2 Analog circuits..or How to detect the Alarm beacon I t IR light generates collector current V1 9V +V I c Q1 OP805 IR detection Vout Noise sources: Electrical (60Hz, 120Hz, 180Hz.) Other electrical
Cleveland State University MCE441: Intr. Linear Control Systems. Lecture 12: Frequency Response Concepts Bode Diagrams. Prof.
 Cleveland State University MCE441: Intr. Linear Control Systems Lecture 12: Concepts Bode Diagrams Prof. Richter 1 / 2 Control systems are affected by signals which are often unpredictable: noise, disturbances,
Bode Plot for Controller Design
 Bode Plot for Controller Design Dr. Bishakh Bhattacharya Professor, Department of Mechanical Engineering IIT Kanpur Joint Initiative of IITs and IISc - Funded by This Lecture Contains Bode Plot for Controller
AUDL Final exam page 1/7 Please answer all of the following questions.
 AUDL 11 28 Final exam page 1/7 Please answer all of the following questions. 1) Consider 8 harmonics of a sawtooth wave which has a fundamental period of 1 ms and a fundamental component with a level of
Lecture 17 z-transforms 2
 Lecture 17 z-transforms 2 Fundamentals of Digital Signal Processing Spring, 2012 Wei-Ta Chu 2012/5/3 1 Factoring z-polynomials We can also factor z-transform polynomials to break down a large system into
Lecture 2 Analog circuits. Seeing the light..
 Lecture 2 Analog circuits Seeing the light.. I t IR light V1 9V +V IR detection Noise sources: Electrical (60Hz, 120Hz, 180Hz.) Other electrical IR from lights IR from cameras (autofocus) Visible light
LINEAR MODELING OF A SELF-OSCILLATING PWM CONTROL LOOP
 Carl Sawtell June 2012 LINEAR MODELING OF A SELF-OSCILLATING PWM CONTROL LOOP There are well established methods of creating linearized versions of PWM control loops to analyze stability and to create
Lecture 2 Analog circuits. Seeing the light..
 Lecture 2 Analog circuits Seeing the light.. I t IR light V1 9V +V Q1 OP805 RL IR detection Vout Noise sources: Electrical (60Hz, 120Hz, 180Hz.) Other electrical IR from lights IR from cameras (autofocus)
Boise State University Department of Electrical and Computer Engineering ECE 212L Circuit Analysis and Design Lab
 Objectives Boise State University Department of Electrical and Computer Engineering ECE L Circuit Analysis and Design Lab Experiment #0: Frequency esponse Measurements The objectives of this laboratory
Signals, systems, acoustics and the ear. Week 3. Frequency characterisations of systems & signals
 Signals, systems, acoustics and the ear Week 3 Frequency characterisations of systems & signals The big idea As long as we know what the system does to sinusoids...... we can predict any output to any
JUNE 2014 Solved Question Paper
 JUNE 2014 Solved Question Paper 1 a: Explain with examples open loop and closed loop control systems. List merits and demerits of both. Jun. 2014, 10 Marks Open & Closed Loop System - Advantages & Disadvantages
Transfer Function (TRF)
") (TRF) Module of the KLIPPEL R&D SYSTEM S7 FEATURES Combines linear and nonlinear measurements Provides impulse response and energy-time curve (ETC) Measures linear transfer function and harmonic distortions
(TRF) Module of the KLIPPEL R&D SYSTEM S7 FEATURES Combines linear and nonlinear measurements Provides impulse response and energy-time curve (ETC) Measures linear transfer function and harmonic distortions
Acoustics, signals & systems for audiology. Week 3. Frequency characterisations of systems & signals
 Acoustics, signals & systems for audiology Week 3 Frequency characterisations of systems & signals The BIG idea: Illustrated 2 Representing systems in terms of what they do to sinusoids: Frequency responses
Laboratory 4. Bandwidth, Filters, and Diodes
 Laboratory 4 Bandwidth, Filters, and Diodes Required Components: k resistor 0. F capacitor N94 small-signal diode LED 4. Objectives In the previous laboratory exercise you examined the effects of input
SHF Communication Technologies AG
 SHF Communication Technologies AG Wilhelm-von-Siemens-Str. 23 Aufgang D 2277 Berlin Marienfelde Germany Phone ++49 30 / 772 05 0 Fax ++49 30 / 753 0 78 E-Mail: sales@shf.biz Web: http://www.shf.biz Tutorial
RTTY: an FSK decoder program for Linux. Jesús Arias (EB1DIX)
") RTTY: an FSK decoder program for Linux. Jesús Arias (EB1DIX) June 15, 2001 Contents 1 rtty-2.0 Program Description. 2 1.1 What is RTTY........................................... 2 1.1.1 The RTTY transmissions.................................
RTTY: an FSK decoder program for Linux. Jesús Arias (EB1DIX) June 15, 2001 Contents 1 rtty-2.0 Program Description. 2 1.1 What is RTTY........................................... 2 1.1.1 The RTTY transmissions.................................
Experiment 1: Amplifier Characterization Spring 2019
 Experiment 1: Amplifier Characterization Spring 2019 Objective: The objective of this experiment is to develop methods for characterizing key properties of operational amplifiers Note: We will be using
Use of the LTI Viewer and MUX Block in Simulink
 Use of the LTI Viewer and MUX Block in Simulink INTRODUCTION The Input-Output ports in Simulink can be used in a model to access the LTI Viewer. This enables the user to display information about the magnitude
PHYSICS 330 LAB Operational Amplifier Frequency Response
 PHYSICS 330 LAB Operational Amplifier Frequency Response Objectives: To measure and plot the frequency response of an operational amplifier circuit. History: Operational amplifiers are among the most widely
Positive Feedback and Oscillators
 Physics 3330 Experiment #5 Fall 2011 Positive Feedback and Oscillators Purpose In this experiment we will study how spontaneous oscillations may be caused by positive feedback. You will construct an active
Worksheet for Exploration 31.1: Amplitude, Frequency and Phase Shift
 Worksheet for Exploration 31.1: Amplitude, Frequency and Phase Shift We characterize the voltage (or current) in AC circuits in terms of the amplitude, frequency (period) and phase. The sinusoidal voltage
Andrea Zanchettin Automatic Control 1 AUTOMATIC CONTROL. Andrea M. Zanchettin, PhD Spring Semester, Linear control systems design
 Andrea Zanchettin Automatic Control 1 AUTOMATIC CONTROL Andrea M. Zanchettin, PhD Spring Semester, 2018 Linear control systems design Andrea Zanchettin Automatic Control 2 The control problem Let s introduce
EE 42/100 Lecture 18: RLC Circuits. Rev A 3/17/2010 (3:48 PM) Prof. Ali M. Niknejad
 Prof. Ali M. Niknejad") A. M. Niknejad University of California, Berkeley EE 100 / 42 Lecture 18 p. 1/19 EE 42/100 Lecture 18: RLC Circuits ELECTRONICS Rev A 3/17/2010 (3:48 PM) Prof. Ali M. Niknejad University of California,
A. M. Niknejad University of California, Berkeley EE 100 / 42 Lecture 18 p. 1/19 EE 42/100 Lecture 18: RLC Circuits ELECTRONICS Rev A 3/17/2010 (3:48 PM) Prof. Ali M. Niknejad University of California,
EE 442 Homework #3 Solutions (Spring 2016 Due February 13, 2017 ) Print out homework and do work on the printed pages.
 Print out homework and do work on the printed pages.") NAME Solutions EE 44 Homework #3 Solutions (Spring 06 Due February 3, 07 ) Print out homework and do work on the printed pages. Textbook: B. P. Lathi & Zhi Ding, Modern Digital and Analog Communication
NAME Solutions EE 44 Homework #3 Solutions (Spring 06 Due February 3, 07 ) Print out homework and do work on the printed pages. Textbook: B. P. Lathi & Zhi Ding, Modern Digital and Analog Communication
Signals and Systems Lecture 6: Fourier Applications
 Signals and Systems Lecture 6: Fourier Applications Farzaneh Abdollahi Department of Electrical Engineering Amirkabir University of Technology Winter 2012 arzaneh Abdollahi Signal and Systems Lecture 6
2.1 BASIC CONCEPTS Basic Operations on Signals Time Shifting. Figure 2.2 Time shifting of a signal. Time Reversal.
 1 2.1 BASIC CONCEPTS 2.1.1 Basic Operations on Signals Time Shifting. Figure 2.2 Time shifting of a signal. Time Reversal. 2 Time Scaling. Figure 2.4 Time scaling of a signal. 2.1.2 Classification of Signals
EECS 216 Winter 2008 Lab 2: FM Detector Part I: Intro & Pre-lab Assignment
 EECS 216 Winter 2008 Lab 2: Part I: Intro & Pre-lab Assignment c Kim Winick 2008 1 Introduction In the first few weeks of EECS 216, you learned how to determine the response of an LTI system by convolving
Active Filters - Revisited
 Active Filters - Revisited Sources: Electronic Devices by Thomas L. Floyd. & Electronic Devices and Circuit Theory by Robert L. Boylestad, Louis Nashelsky Ideal and Practical Filters Ideal and Practical
CHAPTER 14. Introduction to Frequency Selective Circuits
 CHAPTER 14 Introduction to Frequency Selective Circuits Frequency-selective circuits Varying source frequency on circuit voltages and currents. The result of this analysis is the frequency response of
Microelectronic Circuits II. Ch 9 : Feedback
 Microelectronic Circuits II Ch 9 : Feedback 9.9 Determining the Loop Gain 9.0 The Stability problem 9. Effect on Feedback on the Amplifier Poles 9.2 Stability study using Bode plots 9.3 Frequency Compensation
FX Basics. Filtering STOMPBOX DESIGN WORKSHOP. Esteban Maestre. CCRMA - Stanford University August 2013
 FX Basics STOMPBOX DESIGN WORKSHOP Esteban Maestre CCRMA - Stanford University August 2013 effects modify the frequency content of the audio signal, achieving boosting or weakening specific frequency bands
ECE3204 D2015 Lab 1. See suggested breadboard configuration on following page!
 ECE3204 D2015 Lab 1 The Operational Amplifier: Inverting and Non-inverting Gain Configurations Gain-Bandwidth Product Relationship Frequency Response Limitation Transfer Function Measurement DC Errors
FREQUENCY RESPONSE AND PASSIVE FILTERS LABORATORY
 FREQUENCY RESPONSE AND PASSIVE FILTERS LABORATORY In this experiment we will analytically determine and measure the frequency response of networks containing resistors, AC source/sources, and energy storage
Outline. Digital Control. Lecture 3
 Outline Outline Outline 1 ler Design 2 What have we talked about in MM2? Sampling rate selection Equivalents between continuous & digital Systems Outline ler Design Emulation Method for 1 ler Design
JNTUWORLD. 6 The unity feedback system whose open loop transfer function is given by G(s)=K/s(s 2 +6s+10) Determine: (i) Angles of asymptotes *****
=K/s(s 2 +6s+10) Determine: (i) Angles of asymptotes *****") Code: 9A050 III B. Tech I Semester (R09) Regular Eaminations, November 0 Time: hours Ma Marks: 70 (a) What is a mathematical model of a physical system? Eplain briefly. (b) Write the differential equations
Code: 9A050 III B. Tech I Semester (R09) Regular Eaminations, November 0 Time: hours Ma Marks: 70 (a) What is a mathematical model of a physical system? Eplain briefly. (b) Write the differential equations
ANNA UNIVERSITY :: CHENNAI MODEL QUESTION PAPER(V-SEMESTER) B.E. ELECTRONICS AND COMMUNICATION ENGINEERING EC334 - CONTROL SYSTEMS
 B.E. ELECTRONICS AND COMMUNICATION ENGINEERING EC334 - CONTROL SYSTEMS") ANNA UNIVERSITY :: CHENNAI - 600 025 MODEL QUESTION PAPER(V-SEMESTER) B.E. ELECTRONICS AND COMMUNICATION ENGINEERING EC334 - CONTROL SYSTEMS Time: 3hrs Max Marks: 100 Answer all Questions PART - A (10
ANNA UNIVERSITY :: CHENNAI - 600 025 MODEL QUESTION PAPER(V-SEMESTER) B.E. ELECTRONICS AND COMMUNICATION ENGINEERING EC334 - CONTROL SYSTEMS Time: 3hrs Max Marks: 100 Answer all Questions PART - A (10
PURPOSE: NOTE: Be sure to record ALL results in your laboratory notebook.
 EE4902 Lab 9 CMOS OP-AMP PURPOSE: The purpose of this lab is to measure the closed-loop performance of an op-amp designed from individual MOSFETs. This op-amp, shown in Fig. 9-1, combines all of the major
Exam Signal Detection and Noise
 Exam Signal Detection and Noise Tuesday 27 January 2015 from 14:00 until 17:00 Lecturer: Sense Jan van der Molen Important: It is not allowed to use a calculator. Complete each question on a separate piece
Copyright S. K. Mitra
 1 In many applications, a discrete-time signal x[n] is split into a number of subband signals by means of an analysis filter bank The subband signals are then processed Finally, the processed subband signals
Analytic Geometry/ Trigonometry
 Analytic Geometry/ Trigonometry Course Numbers 1206330, 1211300 Lake County School Curriculum Map Released 2010-2011 Page 1 of 33 PREFACE Teams of Lake County teachers created the curriculum maps in order
ABB Automation World 2012, V. Knazkins, 6 June 2012 Countermeasure of PSS4B for Low Frequency Oscillations PSS4B. ABB Group June 4, 2012 Slide 1
 ABB Automation World 2012, V. Knazkins, 6 June 2012 Countermeasure of PSS4B for Low Frequency Oscillations PSS4B June 4, 2012 Slide 1 Agenda Introduction Basic definitions: power system stability : The
AS BIT RATES increase, timing accuracy becomes more
 IEEE TRANSACTIONS ON CIRCUITS AND SYSTEMS II: EXPRESS BRIEFS, VOL. 51, NO. 9, SEPTEMBER 2004 453 Predicting Data-Dependent Jitter James Buckwalter, Student Member, IEEE, Behnam Analui, Student Member,
Advanced Measurements
 Albaha University Faculty of Engineering Mechanical Engineering Department Lecture 9: Wheatstone Bridge and Filters Ossama Abouelatta o_abouelatta@yahoo.com Mechanical Engineering Department Faculty of
EECS40 RLC Lab guide
 EECS40 RLC Lab guide Introduction Second-Order Circuits Second order circuits have both inductor and capacitor components, which produce one or more resonant frequencies, ω0. In general, a differential
EE 42/100: Lecture 8. 1 st -Order RC Transient Example, Introduction to 2 nd -Order Transients. EE 42/100 Summer 2012, UC Berkeley T.
 EE 42/100: Lecture 8 1 st -Order RC Transient Example, Introduction to 2 nd -Order Transients Circuits with non-dc Sources Recall that the solution to our ODEs is Particular solution is constant for DC
Lab S-5: DLTI GUI and Nulling Filters. Please read through the information below prior to attending your lab.
 DSP First, 2e Signal Processing First Lab S-5: DLTI GUI and Nulling Filters Pre-Lab: Read the Pre-Lab and do all the exercises in the Pre-Lab section prior to attending lab. Verification: The Exercise
PROBLEM SET 6. Note: This version is preliminary in that it does not yet have instructions for uploading the MATLAB problems.
 PROBLEM SET 6 Issued: 2/32/19 Due: 3/1/19 Reading: During the past week we discussed change of discrete-time sampling rate, introducing the techniques of decimation and interpolation, which is covered
ECE 556 BASICS OF DIGITAL SPEECH PROCESSING. Assıst.Prof.Dr. Selma ÖZAYDIN Spring Term-2017 Lecture 2
 ECE 556 BASICS OF DIGITAL SPEECH PROCESSING Assıst.Prof.Dr. Selma ÖZAYDIN Spring Term-2017 Lecture 2 Analog Sound to Digital Sound Characteristics of Sound Amplitude Wavelength (w) Frequency ( ) Timbre
1 Mathematical Methods Units 1 and 2
 Mathematical Methods Units and Further trigonometric graphs In this section, we will discuss graphs of the form = a sin ( + c) + d and = a cos ( + c) + d. Consider the graph of = sin ( ). The following
Filters And Waveform Shaping
 Physics 3330 Experiment #3 Fall 2001 Purpose Filters And Waveform Shaping The aim of this experiment is to study the frequency filtering properties of passive (R, C, and L) circuits for sine waves, and
UNIVERSITY OF NORTH CAROLINA AT CHARLOTTE Department of Electrical and Computer Engineering
 UNIVERSITY OF NORTH CAROLINA AT CHARLOTTE Department of Electrical and Computer Engineering EXPERIMENT 8 FILTER NETWORKS OBJECTIVES In this lab session the student will investigate passive low-pass and
Resonator Factoring. Julius Smith and Nelson Lee
 Resonator Factoring Julius Smith and Nelson Lee RealSimple Project Center for Computer Research in Music and Acoustics (CCRMA) Department of Music, Stanford University Stanford, California 9435 March 13,
LM311 comparator open collector output. LM311 comparator open collector output. LM311 comparator open collector output
 00k 40% LM3 comparator open collector output LM3 comparator open collector output ON OFF LM3 comparator open collector output Example: QRD4 reflectance sensor V V V6 V 330 R4 47K V V V QRD4 R3 V5 V LM3
BAKISS HIYANA BT ABU BAKAR JKE,POLISAS
 BAKISS HIYANA BT ABU BAKAR JKE,POLISAS 1 1. Explain AC circuit concept and their analysis using AC circuit law. 2. Apply the knowledge of AC circuit in solving problem related to AC electrical circuit.
FFT 1 /n octave analysis wavelet
 06/16 For most acoustic examinations, a simple sound level analysis is insufficient, as not only the overall sound pressure level, but also the frequency-dependent distribution of the level has a significant
Physics 116A Notes Fall 2004
 Physics 116A Notes Fall 2004 David E. Pellett Draft v.0.9 beta Notes Copyright 2004 David E. Pellett unless stated otherwise. References: Text for course: Fundamentals of Electrical Engineering, second
Linear Time-Invariant Systems
 Linear Time-Invariant Systems Modules: Wideband True RMS Meter, Audio Oscillator, Utilities, Digital Utilities, Twin Pulse Generator, Tuneable LPF, 100-kHz Channel Filters, Phase Shifter, Quadrature Phase
A102 Signals and Systems for Hearing and Speech: Final exam answers
 A12 Signals and Systems for Hearing and Speech: Final exam answers 1) Take two sinusoids of 4 khz, both with a phase of. One has a peak level of.8 Pa while the other has a peak level of. Pa. Draw the spectrum
Proportional-Integral Controller Performance
 Proportional-Integral Controller Performance Silver Team Jonathan Briere ENGR 329 Dr. Henry 4/1/21 Silver Team Members: Jordan Buecker Jonathan Briere John Colvin 1. Introduction Modeling for the response