Introduction to Signals and Systems Lecture #9 - Frequency Response. Guillaume Drion Academic year
|
|
|
- Allison Simon
- 6 years ago
- Views:
Transcription
1 Introduction to Signals and Systems Lecture #9 - Frequency Response Guillaume Drion Academic year

2 Transmission of complex exponentials through LTI systems Continuous case: LTI system where is the transfer function of the LTI system. 2

3 Transmission of complex exponentials through LTI systems Discrete case: LTI system where is the transfer function of the LTI system. 3
4 Transfer function of LTI systems The transfer function of LTI systems has a specific form: it is rational. The roots of The roots of are called the zeros of the transfer function. are called the poles of the transfer function. 4
5 Response of LTI systems: non-zero-state Can we evaluate the response of a LTI system by simply looking at its transfer function? Example: consider the continuous-time LTI system described by the ODE The transfer function writes We want to compute the response of this system in non-zero-state to a step of amplitude a that starts at t=0 (step response). 5
6 Response of LTI systems: non-zero-state The problem writes and the response can be derived using the unilateral Laplace transform: which gives 6
7 Response of LTI systems: non-zero-state The problem writes and the response can be derived using the unilateral Laplace transform: which gives zero-input response zero-state response 7
8 Response of LTI systems: modes zero-input response zero-state response The zero-input (i.e. autonomous) response of a LTI system is composed of (complex) exponentials determined by the poles of the transfer function. The poles of the transfer function define the modes of the systems response (i.e. natural response). If the transfer function possesses a positive real pole, the modes contain a growing exponential! Stability of the system? 8
9 Bounded input bounded output (BIBO) stability A system is BIBO stable of all input-output pairs where is often referred as the gain of the system. satisfy In practice, it means that in a stable system, a bounded input will always give a bounded output. Stability is critical in engineering! 9
10 How do we characterize BIBO stability? A LTI system is stable if the poles of the transfer function all have negative real parts, i.e. the imaginary axis is included in its ROC. 10
11 How do we characterize BIBO stability? In general, stability is ensured if continuous:. discrete:. In other words: continuous: the imaginary axis is included in the ROC of the transfer function. discrete: the unit circle is included in the ROC of the transfer function. Note that stability conditions imply that the Fourier transform exists! 11
12 Outline Frequency response of LTI systems Bode plots Bandwidth and time-constant 1st order and 2nd order systems (continuous) Rational transfer functions 12

13 How do we characterize the response of a LTI systems to Continuous case: an oscillatory signal at a specific frequency? Using the polar representation, we have 13
14 How do we characterize the response of a LTI systems to an oscillatory signal at a specific frequency? Using the polar representation, we have Change in amplitude Change in phase When an oscillatory signal goes through a LTI systems, his amplitude (amplification/attenuation) and phase (advance, delay) are affected. Not his frequency! 14
15 Frequency response of LTI systems The frequency response of a LTI system can be fully characterize by, and in particular: : GAIN (change in amplitude) : PHASE (change in phase) A change in phase in the frequency domain corresponds to a time delay in the time domain: which gives The slope of the phase curve corresponds to a delay in the time domain. 15
16 Outline Frequency response of LTI systems Bode plots Bandwidth and time-constant 1st order and 2nd order systems (continuous) Rational transfer functions 16
17 Frequency response of LTI systems The frequency response of a LTI system can be fully characterize by, and in particular: : GAIN (change in amplitude) : PHASE (change in phase) A plot of and for all frequencies gives all the informations about the frequency response of a LTI system: the BODE plots. In practice, we use a logarithmic scale for such that becomes 17
18 The Bode plots The Bode plots graphically represent the frequency response of a LTI system. They are composed of two plots: The amplitude plot (in db):. The phase plot:. For discrete time systems, we use a linear scale for the frequencies, ranging from to. 18
19 The Bode plots Examples of Bode plots of continuous (left) and discrete (right) LTI systems. 19
20 Outline Frequency response of LTI systems Bode plots Bandwidth and time-constant 1st order and 2nd order systems (continuous) Rational transfer functions 20
21 Bandwidth The bandwidth of a system is the range of frequencies that transmits faithfully through the system. We can define the bandwidth of a system the same way we defined its timeconstant: 21
22 Bandwidth We define the bandwidth of a system the same way we defined its time-constant: There is a tradeoff between the bandwidth of a system and its time-constant. Indeed, let s consider, which gives If we now consider and, we have 22
23 Outline Frequency response of LTI systems Bode plots Bandwidth and time-constant 1st order and 2nd order systems (continuous) Rational transfer functions 23
24 Time and frequency responses of 1st order systems We consider the general 1st order system of the form The transfer function of the system is given by The frequency response ( ), impulse response ( ) and step response ( ) writes H(j!) = 1 j! +1, h(t) = 1 e t/ I(t), s(t) =(1 e t/ )I(t) 24
25 Time and frequency responses of 1st order systems 25
26 Bode plots of 1st order systems: amplitude Amplitude plot: If : If : Low frequencies: constant frequency response ( ) High frequencies: frequency response linear decays by -20dB/dec. Cutoff frequency:. 26
. 27")
27 Bode plots of 1st order systems: amplitude Amplitude plot: first order systems are low-pass filters! (but the slope at HF might be too low to achieve good filtering properties...). 27
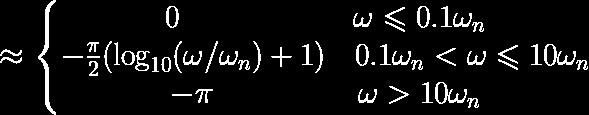
28 Bode plots of 1st order systems: phase Phase plot: Low frequencies: no phase shift. Mid frequencies: phase response decays linearly (slope = time-delay = ). High frequencies: phase-delay of. 28


29 Bode plots of 1st order systems: amplitude and phase 29
30 Time and frequency responses of 2nd order systems We consider the general 2nd order system of the form = natural frequency = damping factor The transfer function of the system is given by The frequency response writes 30
31 Time and frequency responses of 2nd order systems The transfer function of a 2nd order system is given by The transfer function has two poles: Case 1 ( ) : two real poles cascade of two first order systems. Case 2 ( ) : two complex conjugates poles. New behaviors (oscillations, overshoot, etc.) 31
32 Time and frequency responses of 2nd order systems 32


33 Bode plots of 2nd order systems Amplitude plot: Phase plot: 33
. 34")
34 Bode plots of 2nd order systems Amplitude plot: second order systems are low-pass filters! (higher slope, possible resonant frequency with overshoot in the frequency response). 34
35 Bode plots of 2nd order systems: resonant frequency If, there is an overshoot in the frequency response at a resonant frequency. The amplitude of the peak is given by For, there is no peak in the frequency response. 35
36 Time and frequency responses of 2nd order systems 36
37 Outline Frequency response of LTI systems Bode plots Bandwidth and time-constant 1st order and 2nd order systems (continuous) Rational transfer functions 37
38 Frequency response of LTI systems Bode plots of first and second order systems are building blocks for the construction of Bode plots of any LTI systems. Indeed, the transfer function of LTI systems is rational, and the denominator terms can all be expressed as or In other terms, the Bode plots of LTI systems can be sketched from the poles and zeros of the transfer function! 38
39 Frequency response of LTI systems: poles and zeros The Bode plots of LTI systems can be sketched from the poles and zeros of the transfer function! Each real pole induce a first order system response where. Each pair of complex conjugate poles system response where induce a second order Zeros induce the opposite behavior. 39
40 Frequency response of LTI systems: poles and zeros 40
41 Amplitude: Frequency response of LTI systems: Bode plots any real pole induces a decrease in the slope of -20dB/dec. any real zero induces an increase in the slope of 20dB/dec. any pair of complex conjugate poles induces a decrease in the slope of -40dB/dec. Phase: any real pole induces a decrease in the phase of. any real zero induces an increase in the phase of. any pair of complex conjugate poles induces a decrease in the phase of. 41
42 Frequency response of LTI systems: Bode plots Example: DC gain of -20dB, zero in 10 K Hz and pole in 100 K Hz. 42
43 Frequency response of LTI systems: Bode plots Example: DC gain of -20dB, zero in 10 K Hz and pole in 100 K Hz. 43
44 Frequency response of LTI systems: poles and zeros 44
Modeling and Analysis of Systems Lecture #9 - Frequency Response. Guillaume Drion Academic year
 Modeling and Analysis of Systems Lecture #9 - Frequency Response Guillaume Drion Academic year 2015-2016 1 Outline Frequency response of LTI systems Bode plots Bandwidth and time-constant 1st order and
SECTION 7: FREQUENCY DOMAIN ANALYSIS. MAE 3401 Modeling and Simulation
 SECTION 7: FREQUENCY DOMAIN ANALYSIS MAE 3401 Modeling and Simulation 2 Response to Sinusoidal Inputs Frequency Domain Analysis Introduction 3 We ve looked at system impulse and step responses Also interested
NH 67, Karur Trichy Highways, Puliyur C.F, Karur District DEPARTMENT OF INFORMATION TECHNOLOGY DIGITAL SIGNAL PROCESSING UNIT 3
 NH 67, Karur Trichy Highways, Puliyur C.F, 639 114 Karur District DEPARTMENT OF INFORMATION TECHNOLOGY DIGITAL SIGNAL PROCESSING UNIT 3 IIR FILTER DESIGN Structure of IIR System design of Discrete time
PHYS225 Lecture 15. Electronic Circuits
 PHYS225 Lecture 15 Electronic Circuits Last lecture Difference amplifier Differential input; single output Good CMRR, accurate gain, moderate input impedance Instrumentation amplifier Differential input;
LECTURE FOUR Time Domain Analysis Transient and Steady-State Response Analysis
 LECTURE FOUR Time Domain Analysis Transient and Steady-State Response Analysis 4.1 Transient Response and Steady-State Response The time response of a control system consists of two parts: the transient
Bode and Log Magnitude Plots
 Bode and Log Magnitude Plots Bode Magnitude and Phase Plots System Gain and Phase Margins & Bandwidths Polar Plot and Bode Diagrams Transfer Function from Bode Plots Bode Plots of Open Loop and Closed
Bode Plots. Hamid Roozbahani
 Bode Plots Hamid Roozbahani A Bode plot is a graph of the transfer function of a linear, time-invariant system versus frequency, plotted with a logfrequency axis, to show the system's frequency response.
Continuous-Time Signal Analysis FOURIER Transform - Applications DR. SIGIT PW JAROT ECE 2221
 Continuous-Time Signal Analysis FOURIER Transform - Applications DR. SIGIT PW JAROT ECE 2221 Inspiring Message from Imam Shafii You will not acquire knowledge unless you have 6 (SIX) THINGS Intelligence
Välkomna till TSRT15 Reglerteknik Föreläsning 5. Summary of lecture 4 Frequency response Bode plot
 Välkomna till TSRT15 Reglerteknik Föreläsning 5 Summary of lecture 4 Frequency response Bode plot Summary of last lecture 2 Given a pole polynomial with a varying parameter P(s)+KQ(s)=0 We draw the location
[ á{tå TÄàt. Chapter Four. Time Domain Analysis of control system
 Chapter Four Time Domain Analysis of control system The time response of a control system consists of two parts: the transient response and the steady-state response. By transient response, we mean that
BSNL TTA Question Paper Control Systems Specialization 2007
 BSNL TTA Question Paper Control Systems Specialization 2007 1. An open loop control system has its (a) control action independent of the output or desired quantity (b) controlling action, depending upon
Poles and Zeros of H(s), Analog Computers and Active Filters
, Analog Computers and Active Filters") Poles and Zeros of H(s), Analog Computers and Active Filters Physics116A, Draft10/28/09 D. Pellett LRC Filter Poles and Zeros Pole structure same for all three functions (two poles) HR has two poles and
Poles and Zeros of H(s), Analog Computers and Active Filters Physics116A, Draft10/28/09 D. Pellett LRC Filter Poles and Zeros Pole structure same for all three functions (two poles) HR has two poles and
(1) Identify individual entries in a Control Loop Diagram. (2) Sketch Bode Plots by hand (when we could have used a computer
 Identify individual entries in a Control Loop Diagram. (2) Sketch Bode Plots by hand (when we could have used a computer") Last day: (1) Identify individual entries in a Control Loop Diagram (2) Sketch Bode Plots by hand (when we could have used a computer program to generate sketches). How might this be useful? Can more clearly
Last day: (1) Identify individual entries in a Control Loop Diagram (2) Sketch Bode Plots by hand (when we could have used a computer program to generate sketches). How might this be useful? Can more clearly
ELEC-C5230 Digitaalisen signaalinkäsittelyn perusteet
 ELEC-C5230 Digitaalisen signaalinkäsittelyn perusteet Lecture 10: Summary Taneli Riihonen 16.05.2016 Lecture 10 in Course Book Sanjit K. Mitra, Digital Signal Processing: A Computer-Based Approach, 4th
Andrea Zanchettin Automatic Control 1 AUTOMATIC CONTROL. Andrea M. Zanchettin, PhD Winter Semester, Linear control systems design Part 1
 Andrea Zanchettin Automatic Control 1 AUTOMATIC CONTROL Andrea M. Zanchettin, PhD Winter Semester, 2018 Linear control systems design Part 1 Andrea Zanchettin Automatic Control 2 Step responses Assume
FUNDAMENTALS OF SIGNALS AND SYSTEMS
 FUNDAMENTALS OF SIGNALS AND SYSTEMS LIMITED WARRANTY AND DISCLAIMER OF LIABILITY THE CD-ROM THAT ACCOMPANIES THE BOOK MAY BE USED ON A SINGLE PC ONLY. THE LICENSE DOES NOT PERMIT THE USE ON A NETWORK (OF
Lecture 3 Complex Exponential Signals
 Lecture 3 Complex Exponential Signals Fundamentals of Digital Signal Processing Spring, 2012 Wei-Ta Chu 2012/3/1 1 Review of Complex Numbers Using Euler s famous formula for the complex exponential The
The University of Texas at Austin Dept. of Electrical and Computer Engineering Midterm #2
 The University of Texas at Austin Dept. of Electrical and Computer Engineering Midterm #2 Date: November 18, 2010 Course: EE 313 Evans Name: Last, First The exam is scheduled to last 75 minutes. Open books
Lecture 16 Date: Frequency Response (Contd.)
") Lecture 16 Date: 03.10.2017 Frequency Response (Contd.) Bode Plot (contd.) Bode Plot (contd.) Bode Plot (contd.) not every transfer function has all seven factors. To sketch the Bode plots for a generic
Lecture 16 Date: 03.10.2017 Frequency Response (Contd.) Bode Plot (contd.) Bode Plot (contd.) Bode Plot (contd.) not every transfer function has all seven factors. To sketch the Bode plots for a generic
CHAPTER 6 Frequency Response, Bode. Plots, and Resonance
 CHAPTER 6 Frequency Response, Bode Plots, and Resonance CHAPTER 6 Frequency Response, Bode Plots, and Resonance 1. State the fundamental concepts of Fourier analysis. 2. Determine the output of a filter
Lecture 18 Stability of Feedback Control Systems
 16.002 Lecture 18 Stability of Feedback Control Systems May 9, 2008 Today s Topics Stabilizing an unstable system Stability evaluation using frequency responses Take Away Feedback systems stability can
EE 422G - Signals and Systems Laboratory
 EE 422G - Signals and Systems Laboratory Lab 3 FIR Filters Written by Kevin D. Donohue Department of Electrical and Computer Engineering University of Kentucky Lexington, KY 40506 September 19, 2015 Objectives:
Pole, zero and Bode plot
 Pole, zero and Bode plot EC04 305 Lecture notes YESAREKEY December 12, 2007 Authored by: Ramesh.K Pole, zero and Bode plot EC04 305 Lecture notes A rational transfer function H (S) can be expressed as
Lecture 17 z-transforms 2
 Lecture 17 z-transforms 2 Fundamentals of Digital Signal Processing Spring, 2012 Wei-Ta Chu 2012/5/3 1 Factoring z-polynomials We can also factor z-transform polynomials to break down a large system into
Department of Electronic Engineering NED University of Engineering & Technology. LABORATORY WORKBOOK For the Course SIGNALS & SYSTEMS (TC-202)
") Department of Electronic Engineering NED University of Engineering & Technology LABORATORY WORKBOOK For the Course SIGNALS & SYSTEMS (TC-202) Instructor Name: Student Name: Roll Number: Semester: Batch:
Department of Electronic Engineering NED University of Engineering & Technology LABORATORY WORKBOOK For the Course SIGNALS & SYSTEMS (TC-202) Instructor Name: Student Name: Roll Number: Semester: Batch:
Bode plot, named after Hendrik Wade Bode, is usually a combination of a Bode magnitude plot and Bode phase plot:
 Bode plot From Wikipedia, the free encyclopedia A The Bode plot for a first-order (one-pole) lowpass filter Bode plot, named after Hendrik Wade Bode, is usually a combination of a Bode magnitude plot and
Filter Notes. You may have memorized a formula for the voltage divider - if not, it is easily derived using Ohm's law, Vo Vi
 Filter Notes You may have memorized a formula for the voltage divider - if not, it is easily derived using Ohm's law, Vo Vi R2 R+ R2 If you recall the formula for capacitive reactance, the divider formula
EC CONTROL SYSTEMS ENGINEERING
 1 YEAR / SEM: II / IV EC 1256. CONTROL SYSTEMS ENGINEERING UNIT I CONTROL SYSTEM MODELING PART-A 1. Define open loop and closed loop systems. 2. Define signal flow graph. 3. List the force-voltage analogous
ECE 203 LAB 2 PRACTICAL FILTER DESIGN & IMPLEMENTATION
 Version 1. 1 of 7 ECE 03 LAB PRACTICAL FILTER DESIGN & IMPLEMENTATION BEFORE YOU BEGIN PREREQUISITE LABS ECE 01 Labs ECE 0 Advanced MATLAB ECE 03 MATLAB Signals & Systems EXPECTED KNOWLEDGE Understanding
Andrea Zanchettin Automatic Control 1 AUTOMATIC CONTROL. Andrea M. Zanchettin, PhD Spring Semester, Linear control systems design
 Andrea Zanchettin Automatic Control 1 AUTOMATIC CONTROL Andrea M. Zanchettin, PhD Spring Semester, 2018 Linear control systems design Andrea Zanchettin Automatic Control 2 The control problem Let s introduce
Positive Feedback and Oscillators
 Physics 3330 Experiment #5 Fall 2011 Positive Feedback and Oscillators Purpose In this experiment we will study how spontaneous oscillations may be caused by positive feedback. You will construct an active
EE Experiment 8 Bode Plots of Frequency Response
 EE16:Exp8-1 EE 16 - Experiment 8 Bode Plots of Frequency Response Objectives: To illustrate the relationship between a system frequency response and the frequency response break frequencies, factor powers,
Outline. Discrete time signals. Impulse sampling z-transform Frequency response Stability INF4420. Jørgen Andreas Michaelsen Spring / 37 2 / 37
 INF4420 Discrete time signals Jørgen Andreas Michaelsen Spring 2013 1 / 37 Outline Impulse sampling z-transform Frequency response Stability Spring 2013 Discrete time signals 2 2 / 37 Introduction More
JUNE 2014 Solved Question Paper
 JUNE 2014 Solved Question Paper 1 a: Explain with examples open loop and closed loop control systems. List merits and demerits of both. Jun. 2014, 10 Marks Open & Closed Loop System - Advantages & Disadvantages
Lecture 2 Review of Signals and Systems: Part 1. EE4900/EE6720 Digital Communications
 EE4900/EE6420: Digital Communications 1 Lecture 2 Review of Signals and Systems: Part 1 Block Diagrams of Communication System Digital Communication System 2 Informatio n (sound, video, text, data, ) Transducer
Signals and Systems Using MATLAB
 Signals and Systems Using MATLAB Second Edition Luis F. Chaparro Department of Electrical and Computer Engineering University of Pittsburgh Pittsburgh, PA, USA AMSTERDAM BOSTON HEIDELBERG LONDON NEW YORK
Brief Introduction to Signals & Systems. Phani Chavali
 Brief Introduction to Signals & Systems Phani Chavali Outline Signals & Systems Continuous and discrete time signals Properties of Systems Input- Output relation : Convolution Frequency domain representation
University Tunku Abdul Rahman LABORATORY REPORT 1
 University Tunku Abdul Rahman FACULTY OF ENGINEERING AND GREEN TECHNOLOGY UGEA2523 COMMUNICATION SYSTEMS LABORATORY REPORT 1 Signal Transmission & Distortion Student Name Student ID 1. Low Hui Tyen 14AGB06230
Electric Circuit Theory
 Electric Circuit Theory Nam Ki Min nkmin@korea.ac.kr 010-9419-2320 Chapter 15 Active Filter Circuits Nam Ki Min nkmin@korea.ac.kr 010-9419-2320 Contents and Objectives 3 Chapter Contents 15.1 First-Order
2.1 BASIC CONCEPTS Basic Operations on Signals Time Shifting. Figure 2.2 Time shifting of a signal. Time Reversal.
 1 2.1 BASIC CONCEPTS 2.1.1 Basic Operations on Signals Time Shifting. Figure 2.2 Time shifting of a signal. Time Reversal. 2 Time Scaling. Figure 2.4 Time scaling of a signal. 2.1.2 Classification of Signals
JNTUWORLD. 6 The unity feedback system whose open loop transfer function is given by G(s)=K/s(s 2 +6s+10) Determine: (i) Angles of asymptotes *****
=K/s(s 2 +6s+10) Determine: (i) Angles of asymptotes *****") Code: 9A050 III B. Tech I Semester (R09) Regular Eaminations, November 0 Time: hours Ma Marks: 70 (a) What is a mathematical model of a physical system? Eplain briefly. (b) Write the differential equations
Code: 9A050 III B. Tech I Semester (R09) Regular Eaminations, November 0 Time: hours Ma Marks: 70 (a) What is a mathematical model of a physical system? Eplain briefly. (b) Write the differential equations
3.2 Measuring Frequency Response Of Low-Pass Filter :
 2.5 Filter Band-Width : In ideal Band-Pass Filters, the band-width is the frequency range in Hz where the magnitude response is at is maximum (or the attenuation is at its minimum) and constant and equal
CHAPTER 6 INTRODUCTION TO SYSTEM IDENTIFICATION
 CHAPTER 6 INTRODUCTION TO SYSTEM IDENTIFICATION Broadly speaking, system identification is the art and science of using measurements obtained from a system to characterize the system. The characterization
Chapter 5 Frequency-domain design
 Chapter 5 Frequency-domain design Control Automático 3º Curso. Ing. Industrial Escuela Técnica Superior de Ingenieros Universidad de Sevilla Outline of the presentation Introduction. Time response analysis
Linear Control Systems Lectures #5 - PID Controller. Guillaume Drion Academic year
 Linear Control Systems Lectures #5 - PID Controller Guillaume Drion Academic year 2018-2019 1 Outline PID controller: general form Effects of the proportional, integral and derivative actions PID tuning
ANNA UNIVERSITY :: CHENNAI MODEL QUESTION PAPER(V-SEMESTER) B.E. ELECTRONICS AND COMMUNICATION ENGINEERING EC334 - CONTROL SYSTEMS
 B.E. ELECTRONICS AND COMMUNICATION ENGINEERING EC334 - CONTROL SYSTEMS") ANNA UNIVERSITY :: CHENNAI - 600 025 MODEL QUESTION PAPER(V-SEMESTER) B.E. ELECTRONICS AND COMMUNICATION ENGINEERING EC334 - CONTROL SYSTEMS Time: 3hrs Max Marks: 100 Answer all Questions PART - A (10
ANNA UNIVERSITY :: CHENNAI - 600 025 MODEL QUESTION PAPER(V-SEMESTER) B.E. ELECTRONICS AND COMMUNICATION ENGINEERING EC334 - CONTROL SYSTEMS Time: 3hrs Max Marks: 100 Answer all Questions PART - A (10
Exam Signal Detection and Noise
 Exam Signal Detection and Noise Tuesday 27 January 2015 from 14:00 until 17:00 Lecturer: Sense Jan van der Molen Important: It is not allowed to use a calculator. Complete each question on a separate piece
Signals and Systems Lecture 6: Fourier Applications
 Signals and Systems Lecture 6: Fourier Applications Farzaneh Abdollahi Department of Electrical Engineering Amirkabir University of Technology Winter 2012 arzaneh Abdollahi Signal and Systems Lecture 6
1.What is frequency response? A frequency responses the steady state response of a system when the input to the system is a sinusoidal signal.
 Control Systems (EC 334) 1.What is frequency response? A frequency responses the steady state response of a system when the input to the system is a sinusoidal signal. 2.List out the different frequency
CDS 101/110a: Lecture 8-1 Frequency Domain Design
 CDS 11/11a: Lecture 8-1 Frequency Domain Design Richard M. Murray 17 November 28 Goals: Describe canonical control design problem and standard performance measures Show how to use loop shaping to achieve
Microelectronic Circuits II. Ch 9 : Feedback
 Microelectronic Circuits II Ch 9 : Feedback 9.9 Determining the Loop Gain 9.0 The Stability problem 9. Effect on Feedback on the Amplifier Poles 9.2 Stability study using Bode plots 9.3 Frequency Compensation
Concordia University. Discrete-Time Signal Processing. Lab Manual (ELEC442) Dr. Wei-Ping Zhu
 Dr. Wei-Ping Zhu") Concordia University Discrete-Time Signal Processing Lab Manual (ELEC442) Course Instructor: Dr. Wei-Ping Zhu Fall 2012 Lab 1: Linear Constant Coefficient Difference Equations (LCCDE) Objective In this
Concordia University Discrete-Time Signal Processing Lab Manual (ELEC442) Course Instructor: Dr. Wei-Ping Zhu Fall 2012 Lab 1: Linear Constant Coefficient Difference Equations (LCCDE) Objective In this
Frequency Response Analysis
 Frequency Response Analysis Continuous Time * M. J. Roberts - All Rights Reserved 2 Frequency Response * M. J. Roberts - All Rights Reserved 3 Lowpass Filter H( s) = ω c s + ω c H( jω ) = ω c jω + ω c
DIGITAL FILTERS. !! Finite Impulse Response (FIR) !! Infinite Impulse Response (IIR) !! Background. !! Matlab functions AGC DSP AGC DSP
 !! Infinite Impulse Response (IIR) !! Background. !! Matlab functions AGC DSP AGC DSP") DIGITAL FILTERS!! Finite Impulse Response (FIR)!! Infinite Impulse Response (IIR)!! Background!! Matlab functions 1!! Only the magnitude approximation problem!! Four basic types of ideal filters with magnitude
DIGITAL FILTERS!! Finite Impulse Response (FIR)!! Infinite Impulse Response (IIR)!! Background!! Matlab functions 1!! Only the magnitude approximation problem!! Four basic types of ideal filters with magnitude
Cleveland State University MCE441: Intr. Linear Control Systems. Lecture 12: Frequency Response Concepts Bode Diagrams. Prof.
 Cleveland State University MCE441: Intr. Linear Control Systems Lecture 12: Concepts Bode Diagrams Prof. Richter 1 / 2 Control systems are affected by signals which are often unpredictable: noise, disturbances,
The University of Texas at Austin Dept. of Electrical and Computer Engineering Final Exam
 The University of Texas at Austin Dept. of Electrical and Computer Engineering Final Exam Date: December 18, 2017 Course: EE 313 Evans Name: Last, First The exam is scheduled to last three hours. Open
Today s topic: frequency response. Chapter 4
 Today s topic: frequency response Chapter 4 1 Small-signal analysis applies when transistors can be adequately characterized by their operating points and small linear changes about the points. The use
Communication Engineering Prof. Surendra Prasad Department of Electrical Engineering Indian Institute of Technology, Delhi
 Communication Engineering Prof. Surendra Prasad Department of Electrical Engineering Indian Institute of Technology, Delhi Lecture - 23 The Phase Locked Loop (Contd.) We will now continue our discussion
This manuscript was the basis for the article A Refresher Course in Control Theory printed in Machine Design, September 9, 1999.
 This manuscript was the basis for the article A Refresher Course in Control Theory printed in Machine Design, September 9, 1999. Use Control Theory to Improve Servo Performance George Ellis Introduction
Boise State University Department of Electrical and Computer Engineering ECE 212L Circuit Analysis and Design Lab
 Objectives Boise State University Department of Electrical and Computer Engineering ECE L Circuit Analysis and Design Lab Experiment #0: Frequency esponse Measurements The objectives of this laboratory
CDS 101/110: Lecture 9.1 Frequency DomainLoop Shaping
 CDS /: Lecture 9. Frequency DomainLoop Shaping November 3, 6 Goals: Review Basic Loop Shaping Concepts Work through example(s) Reading: Åström and Murray, Feedback Systems -e, Section.,.-.4,.6 I.e., we
Spring 2018 EE 445S Real-Time Digital Signal Processing Laboratory Prof. Evans. Homework #1 Sinusoids, Transforms and Transfer Functions
 Spring 2018 EE 445S Real-Time Digital Signal Processing Laboratory Prof. Homework #1 Sinusoids, Transforms and Transfer Functions Assigned on Friday, February 2, 2018 Due on Friday, February 9, 2018, by
Platypus (/platypus/)
") Viewing as s4251143 Platypus (/ Page 1 assignments/ studentlist/ markers/ / Problem Set 2 Problem Set 2 Question 10 Question: Q1. Graphical Convolution Consider an LTI system with impulse response h(t
Viewing as s4251143 Platypus (/ Page 1 assignments/ studentlist/ markers/ / Problem Set 2 Problem Set 2 Question 10 Question: Q1. Graphical Convolution Consider an LTI system with impulse response h(t
Copyright S. K. Mitra
 1 In many applications, a discrete-time signal x[n] is split into a number of subband signals by means of an analysis filter bank The subband signals are then processed Finally, the processed subband signals
Comparison of Signal Attenuation of Multiple Frequencies Between Passive and Active High-Pass Filters
 Comparison of Signal Attenuation of Multiple Frequencies Between Passive and Active High-Pass Filters Aaron Batker Pritzker Harvey Mudd College 23 November 203 Abstract Differences in behavior at different
IIR Filter Design Chapter Intended Learning Outcomes: (i) Ability to design analog Butterworth filters
 Ability to design analog Butterworth filters") IIR Filter Design Chapter Intended Learning Outcomes: (i) Ability to design analog Butterworth filters (ii) Ability to design lowpass IIR filters according to predefined specifications based on analog
IIR Filter Design Chapter Intended Learning Outcomes: (i) Ability to design analog Butterworth filters (ii) Ability to design lowpass IIR filters according to predefined specifications based on analog
16.30 Learning Objectives and Practice Problems - - Lectures 16 through 20
 16.30 Learning Objectives and Practice Problems - - Lectures 16 through 20 IV. Lectures 16-20 IVA : Sampling, Aliasing, and Reconstruction JVV 9.5, Lecture Notes on Shannon - Understand the mathematical
DEGREE: Biomedical Engineering YEAR: TERM: 1
 COURSE: Control Engineering DEGREE: Biomedical Engineering YEAR: TERM: 1 La asignatura tiene 14 sesiones que se distribuyen a lo largo de 7 semanas. Los dos laboratorios puede situarse en cualquiera de
Outline. Digital Control. Lecture 3
 Outline Outline Outline 1 ler Design 2 What have we talked about in MM2? Sampling rate selection Equivalents between continuous & digital Systems Outline ler Design Emulation Method for 1 ler Design
4. Design of Discrete-Time Filters
 4. Design of Discrete-Time Filters 4.1. Introduction (7.0) 4.2. Frame of Design of IIR Filters (7.1) 4.3. Design of IIR Filters by Impulse Invariance (7.1) 4.4. Design of IIR Filters by Bilinear Transformation
ECE503: Digital Filter Design Lecture 9
 ECE503: Digital Filter Design Lecture 9 D. Richard Brown III WPI 26-March-2012 WPI D. Richard Brown III 26-March-2012 1 / 33 Lecture 9 Topics Within the broad topic of digital filter design, we are going
ECE317 : Feedback and Control
 ECE317 : Feedback and Control Lecture : Frequency domain specifications Frequency response shaping (Loop shaping) Dr. Richard Tymerski Dept. of Electrical and Computer Engineering Portland State University
Electronics basics for MEMS and Microsensors course
 Electronics basics for course, a.a. 2017/2018, M.Sc. in Electronics Engineering Transfer function 2 X(s) T(s) Y(s) T S = Y s X(s) The transfer function of a linear time-invariant (LTI) system is the function
PROBLEM SET 5. Reminder: Quiz 1will be on March 6, during the regular class hour. Details to follow. z = e jω h[n] H(e jω ) H(z) DTFT.
![PROBLEM SET 5. Reminder: Quiz 1will be on March 6, during the regular class hour. Details to follow. z = e jω h[n] H(e jω ) H(z) DTFT.](/thumbs/96/129052141.jpg "PROBLEM SET 5. Reminder: Quiz 1will be on March 6, during the regular class hour. Details to follow. z = e jω h[n] H(e jω ) H(z) DTFT.") PROBLEM SET 5 Issued: 2/4/9 Due: 2/22/9 Reading: During the past week we continued our discussion of the impact of pole/zero locations on frequency response, focusing on allpass systems, minimum and maximum-phase
PROBLEM SET 5 Issued: 2/4/9 Due: 2/22/9 Reading: During the past week we continued our discussion of the impact of pole/zero locations on frequency response, focusing on allpass systems, minimum and maximum-phase
Lecture 2 Analog circuits. Seeing the light..
 Lecture 2 Analog circuits Seeing the light.. I t IR light V1 9V +V IR detection Noise sources: Electrical (60Hz, 120Hz, 180Hz.) Other electrical IR from lights IR from cameras (autofocus) Visible light
Part B. Simple Digital Filters. 1. Simple FIR Digital Filters
 Simple Digital Filters Chapter 7B Part B Simple FIR Digital Filters LTI Discrete-Time Systems in the Transform-Domain Simple Digital Filters Simple IIR Digital Filters Comb Filters 3. Simple FIR Digital
Lecture 2 Analog circuits. IR detection
 Seeing the light.. Lecture Analog circuits I t IR light V 9V V Q OP805 RL IR detection Noise sources: Electrical (60Hz, 0Hz, 80Hz.) Other electrical IR from lights IR from cameras (autofocus) Visible light
Signals, systems, acoustics and the ear. Week 3. Frequency characterisations of systems & signals
 Signals, systems, acoustics and the ear Week 3 Frequency characterisations of systems & signals The big idea As long as we know what the system does to sinusoids...... we can predict any output to any
EE 470 Signals and Systems
 EE 470 Signals and Systems 9. Introduction to the Design of Discrete Filters Prof. Yasser Mostafa Kadah Textbook Luis Chapparo, Signals and Systems Using Matlab, 2 nd ed., Academic Press, 2015. Filters
RTTY: an FSK decoder program for Linux. Jesús Arias (EB1DIX)
") RTTY: an FSK decoder program for Linux. Jesús Arias (EB1DIX) June 15, 2001 Contents 1 rtty-2.0 Program Description. 2 1.1 What is RTTY........................................... 2 1.1.1 The RTTY transmissions.................................
RTTY: an FSK decoder program for Linux. Jesús Arias (EB1DIX) June 15, 2001 Contents 1 rtty-2.0 Program Description. 2 1.1 What is RTTY........................................... 2 1.1.1 The RTTY transmissions.................................
Acoustics, signals & systems for audiology. Week 3. Frequency characterisations of systems & signals
 Acoustics, signals & systems for audiology Week 3 Frequency characterisations of systems & signals The BIG idea: Illustrated 2 Representing systems in terms of what they do to sinusoids: Frequency responses
1 PeZ: Introduction. 1.1 Controls for PeZ using pezdemo. Lab 15b: FIR Filter Design and PeZ: The z, n, and O! Domains
 DSP First, 2e Signal Processing First Lab 5b: FIR Filter Design and PeZ: The z, n, and O! Domains The lab report/verification will be done by filling in the last page of this handout which addresses a
Biomedical Control Systems. Lecture#01
 1 Biomedical Control Systems Lecture#01 2 Text Books Modern Control Engineering, 5 th Edition; Ogata. Feedback & Control Systems, 2 nd edition; Schaum s outline, Joseph J, Allen R. Control Systems Engineering,
Lecture 9. Lab 16 System Identification (2 nd or 2 sessions) Lab 17 Proportional Control
 Lab 17 Proportional Control") 246 Lecture 9 Coming week labs: Lab 16 System Identification (2 nd or 2 sessions) Lab 17 Proportional Control Today: Systems topics System identification (ala ME4232) Time domain Frequency domain Proportional
246 Lecture 9 Coming week labs: Lab 16 System Identification (2 nd or 2 sessions) Lab 17 Proportional Control Today: Systems topics System identification (ala ME4232) Time domain Frequency domain Proportional
Lecture 2 Analog circuits. Seeing the light..
 Lecture 2 Analog circuits Seeing the light.. I t IR light V1 9V +V IR detection Noise sources: Electrical (60Hz, 120Hz, 180Hz.) Other electrical IR from lights IR from cameras (autofocus) Visible light
ECE 205 Dynamical Systems Spring
 ECE 205 Dynamical Systems Spring 2010-11 C. A. Berry ECE 205 Dynamical Systems Spring 2011-2012 Instructor: Carlotta Berry (berry123) Moench Hall, D-211 (812) 877-8657 Course Information Description: 3R-3L-4C
SHF Communication Technologies AG
 SHF Communication Technologies AG Wilhelm-von-Siemens-Str. 23 Aufgang D 2277 Berlin Marienfelde Germany Phone ++49 30 / 772 05 0 Fax ++49 30 / 753 0 78 E-Mail: sales@shf.biz Web: http://www.shf.biz Tutorial
ECE438 - Laboratory 7a: Digital Filter Design (Week 1) By Prof. Charles Bouman and Prof. Mireille Boutin Fall 2015
 By Prof. Charles Bouman and Prof. Mireille Boutin Fall 2015") Purdue University: ECE438 - Digital Signal Processing with Applications 1 ECE438 - Laboratory 7a: Digital Filter Design (Week 1) By Prof. Charles Bouman and Prof. Mireille Boutin Fall 2015 1 Introduction
Purdue University: ECE438 - Digital Signal Processing with Applications 1 ECE438 - Laboratory 7a: Digital Filter Design (Week 1) By Prof. Charles Bouman and Prof. Mireille Boutin Fall 2015 1 Introduction
LINEAR MODELING OF A SELF-OSCILLATING PWM CONTROL LOOP
 Carl Sawtell June 2012 LINEAR MODELING OF A SELF-OSCILLATING PWM CONTROL LOOP There are well established methods of creating linearized versions of PWM control loops to analyze stability and to create
Advanced Digital Signal Processing Part 5: Digital Filters
 Advanced Digital Signal Processing Part 5: Digital Filters Gerhard Schmidt Christian-Albrechts-Universität zu Kiel Faculty of Engineering Institute of Electrical and Information Engineering Digital Signal
Signals. Continuous valued or discrete valued Can the signal take any value or only discrete values?
 Signals Continuous time or discrete time Is the signal continuous or sampled in time? Continuous valued or discrete valued Can the signal take any value or only discrete values? Deterministic versus random
Experiment 2: Transients and Oscillations in RLC Circuits
 Experiment 2: Transients and Oscillations in RLC Circuits Will Chemelewski Partner: Brian Enders TA: Nielsen See laboratory book #1 pages 5-7, data taken September 1, 2009 September 7, 2009 Abstract Transient
b) discrete-time iv) aperiodic (finite energy)
 discrete-time iv) aperiodic (finite energy)") EE 464 Frequency Analysis of Signals and Systems Fall 2018 Read Text, Chapter. Study suggestion: Use Matlab to plot several of the signals and their DTFT in the examples to follow. Some types of signal
EE 464 Frequency Analysis of Signals and Systems Fall 2018 Read Text, Chapter. Study suggestion: Use Matlab to plot several of the signals and their DTFT in the examples to follow. Some types of signal
UNIT 1 CIRCUIT ANALYSIS 1 What is a graph of a network? When all the elements in a network is replaced by lines with circles or dots at both ends.
 UNIT 1 CIRCUIT ANALYSIS 1 What is a graph of a network? When all the elements in a network is replaced by lines with circles or dots at both ends. 2 What is tree of a network? It is an interconnected open
EE422G Solution to Homework #8
 EE4G Solution to Homework #8. MATLAB >> H = tf([ 4],[ 6 6]); >> H = tf([ ],[ - 5 5 4]); >> step(h).7 Step Response.6.5 Amplitude.4... 4 5 6 >> step(h) Time (sec).5 Step Response.5 Amplitude.5.5.5..5..5..5.4.45
Lecture 2 Analog circuits. Seeing the light..
 Lecture 2 Analog circuits Seeing the light.. I t IR light V1 9V +V Q1 OP805 RL IR detection Vout Noise sources: Electrical (60Hz, 120Hz, 180Hz.) Other electrical IR from lights IR from cameras (autofocus)
AERATOR MIXING STATION
 AERATOR MIXING STATION Green Team: Marc Labrie Matt Baltimore Michael Newman Michael Sherrit University of Tennessee at Chattanooga April 13, 211 ENGR 328L OVERVIEW System Overview SSOC Analysis Step Response
Transfer Function (TRF)
") (TRF) Module of the KLIPPEL R&D SYSTEM S7 FEATURES Combines linear and nonlinear measurements Provides impulse response and energy-time curve (ETC) Measures linear transfer function and harmonic distortions
(TRF) Module of the KLIPPEL R&D SYSTEM S7 FEATURES Combines linear and nonlinear measurements Provides impulse response and energy-time curve (ETC) Measures linear transfer function and harmonic distortions
PYKC 13 Feb 2017 EA2.3 Electronics 2 Lecture 8-1
 In this lecture, I will cover amplitude and phase responses of a system in some details. What I will attempt to do is to explain how would one be able to obtain the frequency response from the transfer
System analysis and signal processing
 System analysis and signal processing with emphasis on the use of MATLAB PHILIP DENBIGH University of Sussex ADDISON-WESLEY Harlow, England Reading, Massachusetts Menlow Park, California New York Don Mills,