University of Tennessee at Chattanooga. Step Response Modeling. Control Systems Laboratory
|
|
|
- Benjamin Hart
- 5 years ago
- Views:
Transcription
1 University of Tennessee at Chattanooga Step Response Modeling Control Systems Laboratory By Stephen Rue Tan Team (Stephanie Raulston, Stefan Hanley) Course: ENGR 3280L Section: 000 Date: 03/06/2013 Instructor: Dr. Jim M. Henry
2 1 Introduction: This report will cover the seven different lab experiments conducted so far this semester. The first two experiments were conducted to obtain steady state operating curves and step response curves with respect to certain motor input percentages. Beginning the experiments for the steady state operating curve (SSOC), trial and error was required to approximate the input percentage, in order to have the proper output for each particular range (low, middle, and high). Once the desired input and output were determined, graphs were generated to show the SSOC; this curve will help to approximate an output value given at any specific input value within the desired range. For the next two experiments, we learned how to model dynamic systems with Excel and how to obtain modeling results in graphical form by modeling first-order-plus-deadtime (FOPDT) with Excel. The object of these experiments was to observe the dynamic response of the approximate linear FOPDT model for a system, the impact of parameter values on the dynamic response, and to adjust the linear FOPDT model parameters to get the model results to agree with the experimental results. The next experiment that was preformed was the frequency and relay feedback experiment. In the frequency experiment we observed experimentally the time response of the output function of the system to a sine function input at a variety of different frequencies, the system's amplitude ratio, and the system's phase lag. This was performed over several experimental trials. One member of the team performed the alternate relay feedback experiment. We observed experimentally the time response of the output function of the system to a relay feedback control at different parameters of the relay feedback. The last experiment was the root locus plotting experiment. In this experiment we used the three parameters from the experimental data found in the FOPDT experiment: Gain, K, dead time, t o and first-order response time, t. Using these parameters we were able to find the K cu, the K c that gives about
3 2 1/4, 1/10 and 1/500 decay response and the K c that gives critical damped response for our system. Following this introduction, the background and theory is introduced in order to provide a better understanding of the lab setup for the experiments that have already been conducted. After the background and theory, the procedure will tell what was done in the lab; including the variables and constraints for the experiments. Succeeding the procedure is the results, which will show the data collected in the lab after which the discussion will explain the results and their significance. A summarization of the entire paper will be in the conclusions and recommendations section. The Appendix will be the last section and will include all remaining data and references. Background and Theory: The duct cooling station temperature system is operated via the Internet. The system is accessed by a link to weblab.utc.edu that can be found on the ENGR3280L homepage. The system allows for different input percentages to be applied. The user can vary the system inputs and outputs during the experiment. Figure 1. A block diagram representing the system variables

4 3 The block diagram in figure one above begins by an input placed into the paint spray booth system, the input is the percentage of motor power, and this percentage is manipulated in order to find the specific output. Once the experiment is running there is a heater in the duct and a blower that blows ambient temperature air over the heater cools the duct. In the step response experiment, the input percentage is set at a lower or higher value than used for the particular range in the SSOC experiment; this allows for a step percentage to be inputted for the system. Figure 2. Schematic diagram of the Dunlap Plant Spray-Paint Booth Figure 2 above is the schematic for the Dunlap Plant Spray-Paint Booth, the system begins when the weblab sight sends information via the internet to the temperature transmitter (TT 201), from there a signal is sent to the temperature rate recording controller (TRC 201) and then on to the temperature control actuator (TCZ 201). The temperature rate actuator sends a signal to the blower (B-205), the valves D1 and D2 are controlled by the weblab site for specific time intervals specified.
5 4 Procedure: All experiments begin with a screen that will control the input percentage, total time for the experiment, and the time for the valves to be closed or open. Our system requires outputs in the range of with both dampers closed for the duration of the experiment. To initiate the steady state operating experiment, a basic value needs to be guessed to receive an output for the system. Trial and error is needed to pin point the input for our particular output this takes several iterations. Once the output is reached for several values throughout the desired range, the input and output can be used to predict a steady state operation curve. The curve predicts output given an input multiplied by an operation constant. The step response experiment has a place to input the beginning input percentage and an added step value on the screen. For the step response experiment, the step values can be either positive or negative, in order to get a step up or step down output vs. time. The step response uses the final input that falls between the individual ranges; the input used in the SSOC experiment will become the final value after the step is performed. A lower or higher value is placed in the initial input on the left side of the screen, with both valves closed and a step value must be inputted into the right side of the screen to allow for calculations to be produced after the experiments. The step value must be positive for a step down function and negative for a step up. Also inputted on the main screen of the step response is the time for the step to occur and total time for the experiment; the experiment worked well when the total experiment time was around 15 minutes with a step at 7 minutes, this time frame allowed the system to reach steady state before and after the step. At the bottom of the screen, both valves need to be closed for the entire experiment. Once the experiment has run the entire time set, the values from the sensor can be exported to Excel.
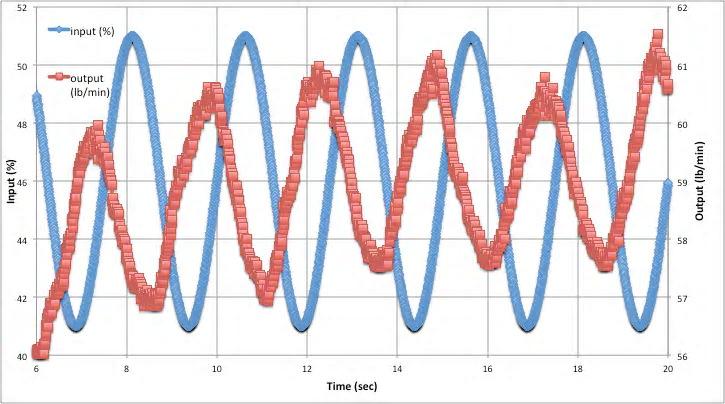
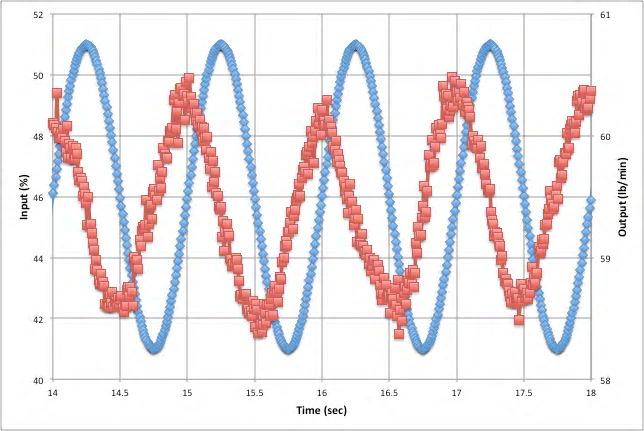
6 5 The next experiment that was preformed was the Modeling Experiment. In this experiment the team learned to model first order plus dead time (FOPDT) with excel. An excel file was generated per the instructions for modeling that used the data collected from the step up experiments. We adjusted the parameters so that the model curves fit the data curves as nearly as possible. The suggested order for doing this, using the experimental directions was: Set input baseline and output baseline so the baseline parts of the model curves agree with the experimental data. Set td and A so that the model input curve agrees entirely with the experimental input curve Set K, to and t so that the model output curve agrees with the experimental output curve as close as possible. Suggested values of these come from your previous analysis. Now, adjust K, to and t so that the model output curve agrees with the experimental output curve as best as possible. Once this was completed for the 3 up and 3 down steps the results were posted to blackboard. The next two experiments performed by the team were the frequency and relay feedback experiments. The frequency experiments were conducted to observe, experimentally, the time response of the output function of the system to a sine function input at a variety of different frequencies. First, we chose a value for the sine amplitude height of the "input" variable. Next, we chose a value for the "input" variable, M(t), that would be the base line value. Then, we chose the frequency of the sine wave. Finally, we chose how long the experiment would run. Then click run. One member of the team did the alternate experiment for the relay modeling experiment. In this experiment the team observed the time response of the output function of the system to a relay feedback control at different parameters of the relay feedback and
7 6 approximated the Kcu factor. The results for both of these experiments are listed below in results and the graphs for each experiment are listed in the appendix section. For the relay feedback experiment the entire linear operating range was used to conduct experiments, since very little output response can be seen in a smaller operating window. Results: report. The results are listed in the same sequence as they are presented in the procedure of the Output (Degrees C) % Input Time (min) Figure 3: This figure is a test ran with a power input of 50% The figure above is an example of the data gathered from one of the SSOC experiments. The experiment was ran for 7 minutes and begins with an input of 50%, the output flow rate of the machine is shown by the red boxes on the graph. The temperature rate begins to increase before receding to the steady state. The average output is taken from this region, along with the standard deviation used in calculating the uncertainty.

 Input % vs.")
8 7 Input (%) Output (lb/min) Uncertainty Table 1: This table organizes the input, output, and uncertainties for the SSOC The table above has the inputs for the system from 9 experiments ran within our range. The uncertainty is found by multiplying the standard deviation by two, the uncertainty is shown in the SSOC in figure 4 below. Output Temperature (Degrees C) Input % vs. Output Temperature Output = -0.7*Input INPUT (%) Figure 4: The steady state operating curve for the paint spray booth station
9 8 The figure above shows the SSOC for the system within our range of Figure 4 and the formula help to estimate the specific output, given a certain input power percentage. The SSOC for our system is shown on the graph above. Figure 5: This figure shows the change in input power percentage m, the output change c, dead time (t 0 ), and the time constant (τ). The figure above is a graph of the step up response, the c and m shown above are used to calculate the gain for the system by using the equation Gain= c/ m. The graph also shows the area considered dead time (t 0 ), the dead time for this particular system was about 0.7 seconds. The time constant (τ) calculation for this particular system is shown at the top of the graph beside the y-axis. The example values above that were gathered from the step up and step down for our particular range are shown in the table 2 below. Regions Gain up Gain down τ up τ down t 0 up t 0 down High Medium Low

 shaped bars centered on the top of each colored bar. 1.2 1.0 0.8 0.6 K Variation K (deg/%) 0.4 0.2 0.0-0.2-0.4-0.")
10 9 Uncertainty Gain up Gain down τ up τ down t 0 up t 0 down High Medium Low Table 2: Values gathered for gain, time constant, and dead time. This table is a list of averages for each team member for the gain, time constant and dead time. The uncertainties for each of the characteristics of the step response are located in the lower set of tables. These uncertainties are used in the following figures as (I) shaped bars centered on the top of each colored bar K Variation K (deg/%) Lower Up Lower Down Mid Up Mid Down Higher Up Higher Down Figure 6: Gain for the system from one of the team member s results including the uncertainty.


11 10 t0 Variation t0 (min) Lower Up Lower Down Mid Up Mid Down Hgher Up Higher Down Figure 7: Dead time for the system using the values from table 2 including the uncertainty τvariation τ(min) Lower Up Lower Down Mid Up Mid Down Higher Up Higher Down Figure 8: Time constant for the system using the values from table 2 including the uncertainty.
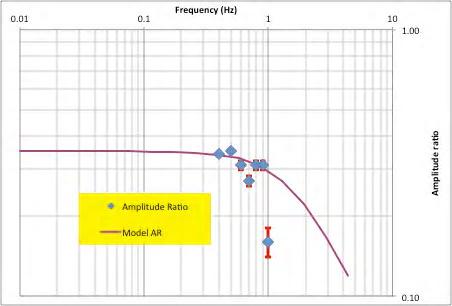
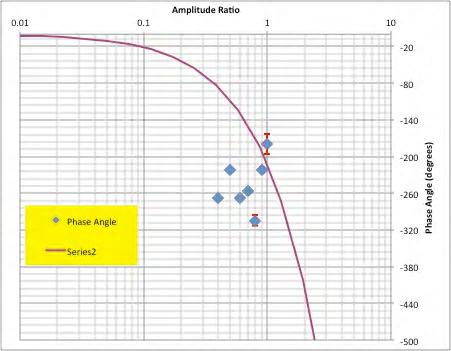
12 11 The results of the frequency experiment are listed in tables 3 and 4 below. For each range, a table was constructed containing values of frequency, amplitude ratio, and phase angle found from the sinusoidal response experiments. These tables include uncertainty that was found using a Student s T distribution with a 95% confidence level. This is outlined more in the appendix. Frequency Amplitude Ratio AR Uncertainty Phase Angle PA Uncertainty Table 3: Results from week 6 lab K 0.35 tau 0.1 t0 0.5 fu 0.9 Table 4: Tabulated Results from week 6 lab Values for the ultimate gain, K cu, were determined experimentally by using relay feedback. In relay feedback, the input pump % oscillates between two set values, the ceiling and floor, which causes the output to oscillate with the changing input. The results are tabulated in table 6 below.
13 12 Discussion: In the step response experiment, the results throughout the output range of 44-56, the gains, time constant, and dead time for the system are pretty consistent from low range to the high range with the uncertainty bars for each set of data almost falling within the range of the other values for the system characteristic. The average gain for the system was 0.60 which is very similar to the constant value of 0.58 obtained in the steady state operating curve. The dead time and time constant for the system averaged around 0.4 seconds and 0.52 seconds respectively. The results for the modeling lab are depicted in the appendix. For the modeling experiment the models followed the step up and down results closely. For the frequency experiments the results are listed in the tables 3-5 above and throughout this experiment, the values for K, τ, and t o, ultimate controller gain, ultimate frequency, and order of the system were found. Conclusion: The objective of the experiment was to create a step response control system with outputs of lbm/min with both dampers closed for the entire experiment, and to study three system characteristics for a step response. The inputs for the system were manipulated in order to control what the output for the system. The time constant and dead times throughout the system were similar within the high, medium, and low sections of our output range. The experiments ran well, the system took a few experiments to warm up and give consistent data; overall the system provided usable data. Through this experiment, the values for K, τ, and t o, ultimate controller gain, ultimate frequency, and order of the system were found. This experiment demonstrated that through sinusoidal response analysis, previously mentioned parameters for a system can be
14 13 determined through Bode plot analysis and formulation. The experimental results give us the definite values of the system, while the modeling only gives an estimate of what one might expect to see. I would recommend for future experimentation, the results from the Bode plot should be used as the base parameters when talking about the flow system with both valves closed.

15 14 Appendices: Figure 9: 44% input SSOC Figure 10: 45% SSOC

16 15 Figure 11: 46% INPUT SSOC Figure 12: 47% input ssoc

17 Figure 13: 48% input ssoc 16
18 17 Figure 14: Results of 44% - 48% inputs ssoc Figure 15: 48% ssoc

19 18 Figure 16: 49% input ssoc Figure 17: 50% input ssoc Figure 18: 52% input ssoc

20 Figure 19: 55% input ssoc 19
 50 45 65 60 55 50 Input % 45 40 4 5 6 7 8 9 10 11 12 Time (min)")
21 20 Figure 20: results 48% - 55% input Figure 21: step responce 55 53% to 73% Input Output (Degrees C) Input % Time (min) 40
22 21
23 22
24 t 0 Low Range (sec) t0 up t0 down
25 Modeling FOPDT 24
26 25
27 26
28 27
29 28
University of Tennessee at Chattanooga. Steady State and Step Response. By: Alex Bedley. Engineering 3280L. Buff. (Alexander Hudson, Ashley Poe)
") University of Tennessee at Chattanooga Steady State and Step Response By: Alex Bedley Engineering 328L Buff (Alexander Hudson, Ashley Poe) February 1, 13 Introduction In the past two experiments, we were
University of Tennessee at Chattanooga Steady State and Step Response By: Alex Bedley Engineering 328L Buff (Alexander Hudson, Ashley Poe) February 1, 13 Introduction In the past two experiments, we were
Using Root Locus Modeling for Proportional Controller Design for Spray Booth Pressure System
 1 University of Tennessee at Chattanooga Engineering 3280L Using Root Locus Modeling for Proportional Controller Design for Spray Booth Pressure System By: 2 Introduction: The objectives for these experiments
Course: ENGR 329 Section: 001 Date: 02/26/2010 Instructor: Dr. Jim M. Henry
 1 University of Tennessee at Chattanooga Filter Wash Stations, Both Valves Closed Steady State Operating Curve Engineering 329 By Timmy Collins Lilac Team Tim Garner, Walt Mandrel and You Gao Course: ENGR
AERATOR MIXING STATION
 AERATOR MIXING STATION Steady State, Step Response Analysis, Sine and Relay Analysis, Root Locus Green Team: Marc Labrie Matt Baltimore Michael Newman Michael Sherrit University of Tennessee at Chattanooga
AERATOR MIXING STATION
 AERATOR MIXING STATION Green Team: Marc Labrie Matt Baltimore Michael Newman Michael Sherrit University of Tennessee at Chattanooga April 13, 211 ENGR 328L OVERVIEW System Overview SSOC Analysis Step Response
UTC. Engineering 329. Frequency Response for the Flow System. Gold Team. By: Blake Nida. Partners: Roger Lemond and Stuart Rymer
 UTC Engineering 329 Frequency Response for the Flow System Gold Team By: Blake Nida Partners: Roger Lemond and Stuart Rymer March 9, 2007 Introduction: The purpose of the frequency response experiments
Proportional-Integral Controller Performance
 Proportional-Integral Controller Performance Silver Team Jonathan Briere ENGR 329 Dr. Henry 4/1/21 Silver Team Members: Jordan Buecker Jonathan Briere John Colvin 1. Introduction Modeling for the response
University of Tennessee at. Chattanooga
 University of Tennessee at Chattanooga Step Response Engineering 329 By Gold Team: Jason Price Jered Swartz Simon Ionashku 2-3- 2 INTRODUCTION: The purpose of the experiments was to investigate and understand
Lab Report 4: Root Locus and Proportional Controller
 Lab Report 4: Root Locus and Proportional Controller University of Tennessee at Chattanooga Engineering 32 Blue Team Kevin Schrumpf Justin Anchanattu Justin Rehagen April 1, 212 Introduction The first
Frequency Response for Flow System
 Frequency Response for Flow System Report By: Ben Gordon Red Squad: Ben Klinger, Dianah Dugan UTC, Engineering 329 October 7, 2007 Introduction The objective of this experiment is to observe the output
Steady State Operating Curve
 Steady State Operating Curve By Lanze Berry University of Tennessee at Chattanooga Engineering 3280L Blue Team (Khanh Nguyen, Justin Cartwright) Course: ENGR 3280L Section: 001 Date: September 4, 2012
Steady-State and Step Response for the Flow System
 Steady-State and Step Response for the Flow System Report By: Dianah Dugan Red Squad: Ben Klinger, Ben Gordon UTC, Engineering 329 September 19, 2007 Introduction: The objectives of this experiment are
Steady-State and Step Response for the Flow System
 Steady-State and Step Response for the Flow System Report By: Dianah Dugan Red Squad: Ben Klinger, Ben Gordon UTC, Engineering 329 September 19, 2007 Introduction: The objectives of this experiment are
Aerator Mixer Speed Control System Step Response Modeling
 UTC Engineering 3280L Matthew Addison Green Team (Michael Hansen) 9/4/12 Aerator Mixer Speed Control System Step Response Modeling Introduction In this experiment a program that models the aerator mixing
University of Tennessee at Chattanooga. Stead State Operating Curve Report. Engr 3280L/Week 3. William Disterdick. Brown Team
 1 University of Tennessee at Chattanooga Stead State Operating Curve Report Engr 3280L/Week 3 By Brown Team (Trent, William, William) 09/05/2012 2 Introduction: In this laboratory, a percentage of power
Steady State Operating Curve
 1 Steady State Operating Curve University of Tennessee at Chattanooga Engineering 3280L Instructor: Dr. Jim Henry By: Fuchsia Team: Jonathan Brewster, Jonathan Wooten Date: February 1, 2013 2 Introduction
Steady State Operating Curve Voltage Control System
 UTC Engineering 39 Steady State Operating Curve Voltage Control System Michael Edge Partners: Michael Woolery Nathan Holland September 5, 7 Introduction A steady state operating curve was created to show
Running Laboratory Experiments via the World Wide Web
 3513 Running Laboratory Experiments via the World Wide Web Jim Henry The University of Tennessee at Chattanooga Abstract The chemical engineering laboratories at the University of Tennessee at Chattanooga
MTE 360 Automatic Control Systems University of Waterloo, Department of Mechanical & Mechatronics Engineering
 MTE 36 Automatic Control Systems University of Waterloo, Department of Mechanical & Mechatronics Engineering Laboratory #1: Introduction to Control Engineering In this laboratory, you will become familiar
Teaching Mechanical Students to Build and Analyze Motor Controllers
 Teaching Mechanical Students to Build and Analyze Motor Controllers Hugh Jack, Associate Professor Padnos School of Engineering Grand Valley State University Grand Rapids, MI email: jackh@gvsu.edu Session
Feedback Systems in HVAC ASHRAE Distinguished Lecture Series Jim Coogan Siemens Building Technologies
 Feedback Systems in HVAC ASHRAE Distinguished Lecture Series Jim Coogan Siemens Building Technologies ASHRAE, Madison Chapter October, 2014 Agenda Definitions: feedback and closed-loop control Types of
Lab 3: RC Circuits. Construct circuit 2 in EveryCircuit. Set values for the capacitor and resistor to match those in figure 2 and set the frequency to
 Lab 3: RC Circuits Prelab Deriving equations for the output voltage of the voltage dividers you constructed in lab 2 was fairly simple. Now we want to derive an equation for the output voltage of a circuit
Experiment 8: An AC Circuit
 Experiment 8: An AC Circuit PART ONE: AC Voltages. Set up this circuit. Use R = 500 Ω, L = 5.0 mh and C =.01 μf. A signal generator built into the interface provides the emf to run the circuit from Output
Experiment 2: Transients and Oscillations in RLC Circuits
 Experiment 2: Transients and Oscillations in RLC Circuits Will Chemelewski Partner: Brian Enders TA: Nielsen See laboratory book #1 pages 5-7, data taken September 1, 2009 September 7, 2009 Abstract Transient
Different Controller Terms
 Loop Tuning Lab Challenges Not all PID controllers are the same. They don t all use the same units for P-I-and D. There are different types of processes. There are different final element types. There
PERSONALIZED EXPERIMENTATION IN CLASSICAL CONTROLS WITH MATLAB REAL TIME WINDOWS TARGET AND PORTABLE AEROPENDULUM KIT
 Eniko T. Enikov, University of Arizona Estelle Eke, California State University Sacramento PERSONALIZED EXPERIMENTATION IN CLASSICAL CONTROLS WITH MATLAB REAL TIME WINDOWS TARGET AND PORTABLE AEROPENDULUM
4 Experiment 4: DC Motor Voltage to Speed Transfer Function Estimation by Step Response and Frequency Response (Part 2)
") 4 Experiment 4: DC Motor Voltage to Speed Transfer Function Estimation by Step Response and Frequency Response (Part 2) 4.1 Introduction This lab introduces new methods for estimating the transfer function
4 Experiment 4: DC Motor Voltage to Speed Transfer Function Estimation by Step Response and Frequency Response (Part 2) 4.1 Introduction This lab introduces new methods for estimating the transfer function
GE420 Laboratory Assignment 8 Positioning Control of a Motor Using PD, PID, and Hybrid Control
 GE420 Laboratory Assignment 8 Positioning Control of a Motor Using PD, PID, and Hybrid Control Goals for this Lab Assignment: 1. Design a PD discrete control algorithm to allow the closed-loop combination
Modified ultimate cycle method relay auto-tuning
 Adaptive Control - Autotuning Structure of presentation: Relay feedback autotuning outline Relay feedback autotuning details How close is the estimate of the ultimate gain and period to the actual ultimate
Appendix III Graphs in the Introductory Physics Laboratory
 Appendix III Graphs in the Introductory Physics Laboratory 1. Introduction One of the purposes of the introductory physics laboratory is to train the student in the presentation and analysis of experimental
Servo Closed Loop Speed Control Transient Characteristics and Disturbances
 Exercise 5 Servo Closed Loop Speed Control Transient Characteristics and Disturbances EXERCISE OBJECTIVE When you have completed this exercise, you will be familiar with the transient behavior of a servo
Figure 1: Unity Feedback System. The transfer function of the PID controller looks like the following:
 Islamic University of Gaza Faculty of Engineering Electrical Engineering department Control Systems Design Lab Eng. Mohammed S. Jouda Eng. Ola M. Skeik Experiment 3 PID Controller Overview This experiment
Appendix C: Graphing. How do I plot data and uncertainties? Another technique that makes data analysis easier is to record all your data in a table.
 Appendix C: Graphing One of the most powerful tools used for data presentation and analysis is the graph. Used properly, graphs are an important guide to understanding the results of an experiment. They
The Series RLC Circuit and Resonance
 Purpose Theory The Series RLC Circuit and Resonance a. To study the behavior of a series RLC circuit in an AC current. b. To measure the values of the L and C using the impedance method. c. To study the
Physics 1021 Experiment 3. Sound and Resonance
 1 Physics 1021 Sound and Resonance 2 Sound and Resonance Introduction In today's experiment, you will examine beat frequency using tuning forks, a microphone and LoggerPro. You will also produce resonance
Relay Based Auto Tuner for Calibration of SCR Pump Controller Parameters in Diesel after Treatment Systems
 Abstract Available online at www.academicpaper.org Academic @ Paper ISSN 2146-9067 International Journal of Automotive Engineering and Technologies Special Issue 1, pp. 26 33, 2017 Original Research Article
Device Characterization Project #1
 6.012 Microelectronic Devices and Circuits Prof. C.G. Sodini Device Characterization Project #1 PN DIODE CHARACTERIZATION Please write your recitation time on your project report. Introduction The goal
Laboratory PID Tuning Based On Frequency Response Analysis. 2. be able to evaluate system performance for empirical tuning method;
 Laboratory PID Tuning Based On Frequency Response Analysis Objectives: At the end, student should 1. appreciate a systematic way of tuning PID loop by the use of process frequency response analysis; 2.
Determining the Dynamic Characteristics of a Process
 Exercise 1-1 Determining the Dynamic Characteristics of a Process EXERCISE OBJECTIVE Familiarize yourself with three methods to determine the dynamic characteristics of a process. DISCUSSION OUTLINE The
Each individual is to report on the design, simulations, construction, and testing according to the reporting guidelines attached.
 EE 352 Design Project Spring 2015 FM Receiver Revision 0, 03-02-15 Interim report due: Friday April 3, 2015, 5:00PM Project Demonstrations: April 28, 29, 30 during normal lab section times Final report
Chapter 6 Controller Design Using Design Tools
 Chapter 6 Controller Design Using Design Tools Defining Good Process Test Data The process should be at steady state before data collection starts The test dynamics should clearly dominate the process
Design of Model Based PID Controller Tuning for Pressure Process
 ISSN (Print) : 3 3765 Design of Model Based PID Controller Tuning for Pressure Process A.Kanchana 1, G.Lavanya, R.Nivethidha 3, S.Subasree 4, P.Aravind 5 UG student, Dept. of ICE, Saranathan College Engineering,
Optimal Control System Design
 Chapter 6 Optimal Control System Design 6.1 INTRODUCTION The active AFO consists of sensor unit, control system and an actuator. While designing the control system for an AFO, a trade-off between the transient
Process Control Laboratory Using Honeywell PlantScape
 Process Control Laboratory Using Honeywell PlantScape Christi Patton Luks, Laura P. Ford University of Tulsa Abstract The University of Tulsa has recently revised its process controls class from one 3-hour
Experiment 3 Topic: Dynamic System Response Week A Procedure
 Experiment 3 Topic: Dynamic System Response Week A Procedure Laboratory Assistant: Email: Office Hours: LEX-3 Website: Brock Hedlund bhedlund@nd.edu 11/05 11/08 5 pm to 6 pm in B14 http://www.nd.edu/~jott/measurements/measurements_lab/e3
Theory: The idea of this oscillator comes from the idea of positive feedback, which is described by Figure 6.1. Figure 6.1: Positive Feedback
 Name1 Name2 12/2/10 ESE 319 Lab 6: Colpitts Oscillator Introduction: This lab introduced the concept of feedback in combination with bipolar junction transistors. The goal of this lab was to first create
Week 15. Mechanical Waves
 Chapter 15 Week 15. Mechanical Waves 15.1 Lecture - Mechanical Waves In this lesson, we will study mechanical waves in the form of a standing wave on a vibrating string. Because it is the last week of
WARM UP. 1. Expand the expression (x 2 + 3) Factor the expression x 2 2x Find the roots of 4x 2 x + 1 by graphing.
 Factor the expression x 2 2x Find the roots of 4x 2 x + 1 by graphing.") WARM UP Monday, December 8, 2014 1. Expand the expression (x 2 + 3) 2 2. Factor the expression x 2 2x 8 3. Find the roots of 4x 2 x + 1 by graphing. 1 2 3 4 5 6 7 8 9 10 Objectives Distinguish between
WARM UP Monday, December 8, 2014 1. Expand the expression (x 2 + 3) 2 2. Factor the expression x 2 2x 8 3. Find the roots of 4x 2 x + 1 by graphing. 1 2 3 4 5 6 7 8 9 10 Objectives Distinguish between
Lab M6: The Doppler Effect
 M6.1 Lab M6: The Doppler Effect Introduction The purpose in this lab is to teach the basic properties of waves (amplitude, frequency, wavelength, and speed) using the Doppler effect. This effect causes
Experiment 1 LRC Transients
 Physics 263 Experiment 1 LRC Transients 1 Introduction In this experiment we will study the damped oscillations and other transient waveforms produced in a circuit containing an inductor, a capacitor,
Lab 11. Vibrating Strings
 Lab 11. Vibrating Strings Goals To experimentally determine relationships between fundamental resonant of a vibrating string and its length, its mass per unit length, and tension in string. To introduce
ECE ECE285. Electric Circuit Analysis I. Spring Nathalia Peixoto. Rev.2.0: Rev Electric Circuits I
 ECE285 Electric Circuit Analysis I Spring 2014 Nathalia Peixoto Rev.2.0: 140124. Rev 2.1. 140813 1 Lab reports Background: these 9 experiments are designed as simple building blocks (like Legos) and students
Determining the Dynamic Characteristics of a Process
 Exercise 5-1 Determining the Dynamic Characteristics of a Process EXERCISE OBJECTIVE In this exercise, you will determine the dynamic characteristics of a process. DISCUSSION OUTLINE The Discussion of
Experiments #6. Convolution and Linear Time Invariant Systems
 Experiments #6 Convolution and Linear Time Invariant Systems 1) Introduction: In this lab we will explain how to use computer programs to perform a convolution operation on continuous time systems and
EMPIRICAL MODEL IDENTIFICATION AND PID CONTROLLER TUNING FOR A FLOW PROCESS
 Volume 118 No. 20 2018, 2015-2021 ISSN: 1311-8080 (printed version); ISSN: 1314-3395 (on-line version) url: http://www.ijpam.eu ijpam.eu EMPIRICAL MODEL IDENTIFICATION AND PID CONTROLLER TUNING FOR A FLOW
Math 2321 Review for Test 2 Fall 11
 Math 2321 Review for Test 2 Fall 11 The test will cover chapter 15 and sections 16.1-16.5 of chapter 16. These review sheets consist of problems similar to ones that could appear on the test. Some problems
LAB Week 7: Data Acquisition
 LAB Week 7: Data Acquisition Wright State University: Mechanical Engineering ME 3600L Section 01 Report and experiment by: Nicholas Smith Experiment performed on February 23, 2015 Due: March 16, 2015 Instructor:
Procidia Control Solutions Dead Time Compensation
 APPLICATION DATA Procidia Control Solutions Dead Time Compensation AD353-127 Rev 2 April 2012 This application data sheet describes dead time compensation methods. A configuration can be developed within
EE 370/L Feedback and Control Systems Lab Section Post-Lab Report. EE 370L Feedback and Control Systems Lab
 EE 370/L Feedback and Control Systems Lab Post-Lab Report EE 370L Feedback and Control Systems Lab LABORATORY 10: LEAD-LAG COMPENSATOR DEPARTMENT OF ELECTRICAL AND COMPUTER ENGINEERING UNIVERSITY OF NEVADA,
CONTROL IMPROVEMENT OF UNDER-DAMPED SYSTEMS AND STRUCTURES BY INPUT SHAPING
 CONTROL IMPROVEMENT OF UNDER-DAMPED SYSTEMS AND STRUCTURES BY INPUT SHAPING Igor Arolovich a, Grigory Agranovich b Ariel University of Samaria a igor.arolovich@outlook.com, b agr@ariel.ac.il Abstract -
SAMPLE: EXPERIMENT 2 Series RLC Circuit / Bode Plot
 SAMPLE: EXPERIMENT 2 Series RLC Circuit / Bode Plot ---------------------------------------------------------------------------------------------------- This experiment is an excerpt from: Electric Experiments
sin(wt) y(t) Exciter Vibrating armature ENME599 1
 y(t) Exciter Vibrating armature ENME599 1") ENME599 1 LAB #3: Kinematic Excitation (Forced Vibration) of a SDOF system Students must read the laboratory instruction manual prior to the lab session. The lab report must be submitted in the beginning
ENME599 1 LAB #3: Kinematic Excitation (Forced Vibration) of a SDOF system Students must read the laboratory instruction manual prior to the lab session. The lab report must be submitted in the beginning
ET 304A Laboratory Tutorial-Circuitmaker For Transient and Frequency Analysis
 ET 304A Laboratory Tutorial-Circuitmaker For Transient and Frequency Analysis All circuit simulation packages that use the Pspice engine allow users to do complex analysis that were once impossible to
CHBE320 LECTURE XI CONTROLLER DESIGN AND PID CONTOLLER TUNING. Professor Dae Ryook Yang
 CHBE320 LECTURE XI CONTROLLER DESIGN AND PID CONTOLLER TUNING Professor Dae Ryook Yang Spring 2018 Dept. of Chemical and Biological Engineering 11-1 Road Map of the Lecture XI Controller Design and PID
MATHEMATICAL MODEL VALIDATION
 CHAPTER 5: VALIDATION OF MATHEMATICAL MODEL 5-1 MATHEMATICAL MODEL VALIDATION 5.1 Preamble 5-2 5.2 Basic strut model validation 5-2 5.2.1 Passive characteristics 5-3 5.2.2 Workspace tests 5-3 5.3 SDOF
Chapter 2: PRESENTING DATA GRAPHICALLY
 2. Presenting Data Graphically 13 Chapter 2: PRESENTING DATA GRAPHICALLY A crowd in a little room -- Miss Woodhouse, you have the art of giving pictures in a few words. -- Emma 2.1 INTRODUCTION Draw a
5.1 Graphing Sine and Cosine Functions.notebook. Chapter 5: Trigonometric Functions and Graphs
 Chapter 5: Trigonometric Functions and Graphs 1 Chapter 5 5.1 Graphing Sine and Cosine Functions Pages 222 237 Complete the following table using your calculator. Round answers to the nearest tenth. 2
Dynamic Vibration Absorber
 Part 1B Experimental Engineering Integrated Coursework Location: DPO Experiment A1 (Short) Dynamic Vibration Absorber Please bring your mechanics data book and your results from first year experiment 7
Lab 12. Vibrating Strings
 Lab 12. Vibrating Strings Goals To experimentally determine relationships between fundamental resonant of a vibrating string and its length, its mass per unit length, and tension in string. To introduce
MAE106 Laboratory Exercises Lab # 5 - PD Control of DC motor position
 MAE106 Laboratory Exercises Lab # 5 - PD Control of DC motor position University of California, Irvine Department of Mechanical and Aerospace Engineering Goals Understand how to implement and tune a PD
Intermediate and Advanced Labs PHY3802L/PHY4822L
 Intermediate and Advanced Labs PHY3802L/PHY4822L Torsional Oscillator and Torque Magnetometry Lab manual and related literature The torsional oscillator and torque magnetometry 1. Purpose Study the torsional
-binary sensors and actuators (such as an on/off controller) are generally more reliable and less expensive
 are generally more reliable and less expensive") Process controls are necessary for designing safe and productive plants. A variety of process controls are used to manipulate processes, however the most simple and often most effective is the PID controller.
Process controls are necessary for designing safe and productive plants. A variety of process controls are used to manipulate processes, however the most simple and often most effective is the PID controller.
An Improved Analytical Model for Efficiency Estimation in Design Optimization Studies of a Refrigerator Compressor
 Purdue University Purdue e-pubs International Compressor Engineering Conference School of Mechanical Engineering 2014 An Improved Analytical Model for Efficiency Estimation in Design Optimization Studies
Root Locus Design. by Martin Hagan revised by Trevor Eckert 1 OBJECTIVE
 TAKE HOME LABS OKLAHOMA STATE UNIVERSITY Root Locus Design by Martin Hagan revised by Trevor Eckert 1 OBJECTIVE The objective of this experiment is to design a feedback control system for a motor positioning
5.3-The Graphs of the Sine and Cosine Functions
 5.3-The Graphs of the Sine and Cosine Functions Objectives: 1. Graph the sine and cosine functions. 2. Determine the amplitude, period and phase shift of the sine and cosine functions. 3. Find equations
Compensation of a position servo
 UPPSALA UNIVERSITY SYSTEMS AND CONTROL GROUP CFL & BC 9610, 9711 HN & PSA 9807, AR 0412, AR 0510, HN 2006-08 Automatic Control Compensation of a position servo Abstract The angular position of the shaft
Uncovering a Hidden RCL Series Circuit
 Purpose Uncovering a Hidden RCL Series Circuit a. To use the equipment and techniques developed in the previous experiment to uncover a hidden series RCL circuit in a box and b. To measure the values of
Remote Laboratory Operation: Web Technology Successes
 Remote Laboratory Operation: Web Technology Successes Masoud Naghedolfeizi 1, Jim Henry 2, Sanjeev Arora 3 Abstract National Aeronautics and Space Administration (NASA) has awarded Fort Valley State University
CHAPTER 6 INTRODUCTION TO SYSTEM IDENTIFICATION
 CHAPTER 6 INTRODUCTION TO SYSTEM IDENTIFICATION Broadly speaking, system identification is the art and science of using measurements obtained from a system to characterize the system. The characterization
Physics 4C Chabot College Scott Hildreth
 Physics 4C Chabot College Scott Hildreth The Inverse Square Law for Light Intensity vs. Distance Using Microwaves Experiment Goals: Experimentally test the inverse square law for light using Microwaves.
PHASELOCK TECHNIQUES INTERSCIENCE. Third Edition. FLOYD M. GARDNER Consulting Engineer Palo Alto, California A JOHN WILEY & SONS, INC.
 PHASELOCK TECHNIQUES Third Edition FLOYD M. GARDNER Consulting Engineer Palo Alto, California INTERSCIENCE A JOHN WILEY & SONS, INC., PUBLICATION CONTENTS PREFACE NOTATION xvii xix 1 INTRODUCTION 1 1.1
Comparative Study of PID Controller tuning methods using ASPEN HYSYS
 Comparative Study of PID Controller tuning methods using ASPEN HYSYS Bhavatharini S #1, Abirami S #2, Arun Prem Anand N #3 # Department of Chemical Engineering, Sri Venkateswara College of Engineering
BME 3512 Bioelectronics Laboratory Two - Passive Filters
 BME 35 Bioelectronics Laboratory Two - Passive Filters Learning Objectives: Understand the basic principles of passive filters. Laboratory Equipment: Agilent Oscilloscope Model 546A Agilent Function Generator
ECE 2006 University of Minnesota Duluth Lab 11. AC Circuits
 1. Objective AC Circuits In this lab, the student will study sinusoidal voltages and currents in order to understand frequency, period, effective value, instantaneous power and average power. Also, the
Experiment 3 Topic: Dynamic System Response Week A Procedure
 Experiment 3 Topic: Dynamic System Response Week A Procedure Laboratory Assistant: Email: Office Hours: LEX-3 Website: Caitlyn Clark and Brock Hedlund cclark20@nd.edu, bhedlund@nd.edu 04/03 04/06 from
Copyright 2009 Pearson Education, Inc. Slide Section 8.2 and 8.3-1
 8.3-1 Transformation of sine and cosine functions Sections 8.2 and 8.3 Revisit: Page 142; chapter 4 Section 8.2 and 8.3 Graphs of Transformed Sine and Cosine Functions Graph transformations of y = sin
Rotary Motion Servo Plant: SRV02. Rotary Experiment #03: Speed Control. SRV02 Speed Control using QuaRC. Student Manual
 Rotary Motion Servo Plant: SRV02 Rotary Experiment #03: Speed Control SRV02 Speed Control using QuaRC Student Manual Table of Contents 1. INTRODUCTION...1 2. PREREQUISITES...1 3. OVERVIEW OF FILES...2
TESTING EQUIPMENT SHEAR STRENGTH PARAMETERS SOIL. established in 1972
 SOIL www.alfatestusa.com established in 1972 SOIL Used to perform large range of Triaxial tests on soil samples to determine the strength parameters and the mechanical properties. Capable of performing:
The Discussion of this exercise covers the following points: Angular position control block diagram and fundamentals. Power amplifier 0.
 Exercise 6 Motor Shaft Angular Position Control EXERCISE OBJECTIVE When you have completed this exercise, you will be able to associate the pulses generated by a position sensing incremental encoder with
System Inputs, Physical Modeling, and Time & Frequency Domains
 System Inputs, Physical Modeling, and Time & Frequency Domains There are three topics that require more discussion at this point of our study. They are: Classification of System Inputs, Physical Modeling,
Control and Optimization
 Control and Optimization Example Design Goals Prevent overheating Meet deadlines Save energy Design Goals Prevent overheating Meet deadlines Save energy Question: what the safety, mission, and performance
BIOE 123 Module 3. Electronics 2: Time Varying Circuits. Lecture (30 min) Date. Learning Goals
 Date. Learning Goals") BIOE 123 Module 3 Electronics 2: Time Varying Circuits Lecture (30 min) Date Learning Goals Learn about the behavior of capacitors and inductors Learn how to analyze time-varying circuits to quantify parameters
BIOE 123 Module 3 Electronics 2: Time Varying Circuits Lecture (30 min) Date Learning Goals Learn about the behavior of capacitors and inductors Learn how to analyze time-varying circuits to quantify parameters
P Shrikant Rao and Indraneel Sen
 A QFT Based Robust SVC Controller For Improving The Dynamic Stability Of Power Systems.. P Shrikant Rao and Indraneel Sen ' Abstract A novel design technique for an SVC based Power System Damping Controller
AC Theory and Electronics
 AC Theory and Electronics An Alternating Current (AC) or Voltage is one whose amplitude is not constant, but varies with time about some mean position (value). Some examples of AC variation are shown below:
Class 5. Competency Exam Round 1. The Process Designer s Process. Process Control Preliminaries. On/Off Control The Simplest Controller
 Class 5 Competency Exam Round 1 Proportional Control Starts Friday, September 17 Ends Friday, October 1 Process Control Preliminaries The final control element, process and sensor/transmitter all have
GE 320: Introduction to Control Systems
 GE 320: Introduction to Control Systems Laboratory Section Manual 1 Welcome to GE 320.. 1 www.softbankrobotics.com 1 1 Introduction This section summarizes the course content and outlines the general procedure
COMPARISON OF TUNING METHODS OF PID CONTROLLER USING VARIOUS TUNING TECHNIQUES WITH GENETIC ALGORITHM
 JOURNAL OF ELECTRICAL ENGINEERING & TECHNOLOGY Journal of Electrical Engineering & Technology (JEET) (JEET) ISSN 2347-422X (Print), ISSN JEET I A E M E ISSN 2347-422X (Print) ISSN 2347-4238 (Online) Volume
5.3 Trigonometric Graphs. Copyright Cengage Learning. All rights reserved.
 5.3 Trigonometric Graphs Copyright Cengage Learning. All rights reserved. Objectives Graphs of Sine and Cosine Graphs of Transformations of Sine and Cosine Using Graphing Devices to Graph Trigonometric
JNTUWORLD. 6 The unity feedback system whose open loop transfer function is given by G(s)=K/s(s 2 +6s+10) Determine: (i) Angles of asymptotes *****
=K/s(s 2 +6s+10) Determine: (i) Angles of asymptotes *****") Code: 9A050 III B. Tech I Semester (R09) Regular Eaminations, November 0 Time: hours Ma Marks: 70 (a) What is a mathematical model of a physical system? Eplain briefly. (b) Write the differential equations
Code: 9A050 III B. Tech I Semester (R09) Regular Eaminations, November 0 Time: hours Ma Marks: 70 (a) What is a mathematical model of a physical system? Eplain briefly. (b) Write the differential equations
EK307 Passive Filters and Steady State Frequency Response
 EK307 Passive Filters and Steady State Frequency Response Laboratory Goal: To explore the properties of passive signal-processing filters Learning Objectives: Passive filters, Frequency domain, Bode plots