Introduction to Digital Image Processing of Remote Sensed Data
|
|
|
- Byron George
- 5 years ago
- Views:
Transcription


1 Introduction to Digital Image Processing of Remote Sensed Data August 22, 2010
2 Jensen, 2007


3 Dichotomy in Remote Sensing physical landscape image acquisition image inference image of landscape Fundamental Question in Remote Sensing: How to infer information about the landscape from a set of measurements that constitute an image?
4

5 There are spatial and temporal resolution considerations that must be made for certain remote sensing applications.
 using a digital camera.")
6 Spatial Resolution Imagery of residential housing in Mechanicsville, New York, obtained on June 1, 1998, at a nominal spatial resolution of 0.3 x 0.3 m (approximately 1 x 1 ft.) using a digital camera. Jensen, 2007

7 Question of the day (1) What is a good spatial resolution? What is a good scale?
8 Resolution tradeoff High spatial resolution is associated with low spectral resolution High spectral resolution is associated with low spatial resolution So Emphasize most important resolution - directly related to the application - and accept other resolutions as given or; Don t emphasize any particular resolution and accept medium, spectral, spatial, temporal resolution.
9 Types of images (with respect to spatial resolution) H resolution image: where pixels are smaller than the objects in the image L resolution image: where pixels are greater than the objects in the image Strahler, 1980


10 H image L image 1 meter spatial resolution 500 meter spatial resolution
11 Why digital image processing? The use of computer algorithms to perform signal processing on digital images To extract information To evaluate a sensor To evaluate images statistically To assess/improve quality To make base data sets (e.g. for GIS) To make art
12 Digital image processing operations Geometric transformation Color correction Image editing Image registration Image projection Compositing Image differencing Image segmentation Pattern recognition
13 What is an image? (What s in an image?) An image is a two-dimensional picture that has the same appearance to a subject (a person) A digital image is a discreet representation of an image using ones and zeros (binary) as used in computing A raster image is same as a digital image made up of a finite number of pixels A pixel is the smallest individual element in a digital image holding quantized values of brightness A pixel has both a position and a value consisting of a quantile (sample)
 data format")
14 Remote Sensing raster (matrix) data format Jensen, 2004
15 Statistical description of images image histogram individual pixel values univariate descriptive statistics statistics derived from a single variable multivariate statistics statistics derived from multiple variables


16 Image histogram The frequency of occurrence of individual or binned brightness values in an image
17 Why do we care about histograms? Histograms provide a lot of information on images even without looking at the images themselves such as presence or absence of features, distribution etc. Histograms help evaluate images statistically e.g. normal, skewed, bimodal distribution Histograms are used in individual image enhancements Histograms are used in image classification Histograms are used in image segmentation Histograms help matching of images across time or space

18


19 normal skewed


20 narrow bimodal
21 Univariate descriptive statistics mode median min, max range mean variance standard deviation skewness kurtosis
22 Multivariate descriptive statistics covariance correlation regression basics coefficient of determination
23 A note on pixel position In addition to the values of pixels that make up an image, the spatial location and orientation of these pixels are also important For example, a stream of binary data has to be assembled into a two-dimensional array (matrix) in correct order for an image to display correctly. This is especially important for remotely sensed data as pixels are inherently spatial (geographic) However, the location of the pixels does not influence image statistics (unless they are spatial statistics)


24
25 Image enhancements Enhancement is the process of manipulating an image so that the result is more suitable than the original for a specific application The word specific is highlighted here because it establishes at the outset that enhancement techniques are problem specific For example, an enhancement method applied to X- Ray images may not be suitable for enhancing satellite images There is no specific theory of image enhancement The end user is the ultimate judge of how well a particular method works
26 Fundamentals The purpose of image enhancements: visually appealing images information extraction noise removal smoothing/sharpening Enhancements are generally in the form: B = f(a) All of the image processing techniques we will discuss today are in the spatial domain (i.e. in the image plain itself) as opposed to the transformed domain
27 Fundamentals Two major types of enhancements in the spatial domain: intensity transformation operates on a single point (pixel) spatial filtering operates on a group of points (pixels) Both are transformations (T) of the original input data into a new output data set i.e. g(x,y) = T[f(x,y)]
28 An intensity transformation example s = T(r) s0 = T(r0) output dark light T(r) dark k r0 input light r the effect of applying T would produce a higher contrast than the original by darkening the intensity levels below k and brightening the levels above k

29 Some basic intensity transformation functions log transformation - the general form of the log transformation is s = log(1 + r) and is used for expanding values of dark pixels while compressing the higher values. The opposite would be the inverse log transformation


30 contrast stretching example
31 Histogram processing histograms are the basis for numerous intensity domain processing techniques. in addition to providing useful image statistics, histogram manipulation can be used for image enhancement as well as image compression and segmentation histogram processing involves transformation of image values through transformation (manipulation) of the image histogram

32 basic stretch based on histogram shape e.g. Histogram processing enhancing a low contrast image to have higher contrast matching image histogram to a pre-defined shape, statistical distribution, or to another histogram e.g. histogram equalization, normal distribution, gamma distribution using histogram statistics e.g. min/max, 2% saturation, 1 sigma


33 dark light low contrast high contrast
34 basic stretch based on histogram shape e.g. Histogram processing enhancing a low contrast image to have higher contrast matching image histogram to a pre-defined shape, statistical distribution, or to another histogram e.g. histogram equalization, normal distribution, gamma distribution using histogram statistics e.g. min/max, 2% saturation, 1 sigma

35 linear gaussian equalization square root
36 Spatial enhancement (filtering) method of selectively emphasizing or suppressing information across different spatial scales is the subject of spatial enhancement enhancement of this type uses filters (or kernels) - a matrix of numbers - that are applied to the image over small spatial regions at a time so, the techniques operate selectively on the image data which contain different information at different spatial scales


37 Landsat TM Band 4
38 Spatial enhancement (filtering) noise removal/addition representation of spatial variability of a feature by region extract particular spatial scale component from an image smoothing edge detection frequency domain
39 What is a filter? by analogy with the procedure used in chemistry to separate components of a suspension, a digital filter is used to extract a particular feature (spatial-scale) component from a digital image 1/9 1/9 1/9 1/9 1/9 1/9 1/9 1/9 1/9 average laplacian laplacian horizontal vertical diagonal
40 What is a filter? low-pass (smoothes data) moving-average median mode adaptive filters high-pass (sharpening) image subtraction method derivate method (laplacian) edge detection

41 median filter with noise example original image 3x3 filter 7x7 filter 9x9 filter

42 laplacian enhancement
43 Image Geometric Correction
44 What is geometric correction? RS images are not maps Information extracted from RS data is often integrated with GIS for further analysis or to present to end-users Transformation of RS image data so that it has appropriate spatial scale and appropriate projection is called geometric correction Registration is the process of fitting the coordinate system of one image to another image of the same area
45 Why geometric correction? to transform an image to match a map projection to locate points of interest on a map or image to bring adjacent (or overlapping) images into a common registration to overlay temporal sequences of images of the same area (different times, different sensors) to overlay images and information products with other maps and GIS Mather, 1999
46 Sources of geometric distortions in digital satellite data instrument error distortion in the optical system panoramic distortion sensor field of view Earth rotation Earth rotation velocity changes with latitude platform instability variation in platform altitude and attitude Mather, 1999
47 Two forms of geometric correction 1. To match a distorted image to a map reference - Ground position is important, the correction information can come from a map, ground collected points, or another image with geographic coordinates 2. To match a distorted image to a correct image - Ground position is not important (unless you want it to be) but image-to-image match is the key
48 Common questions in image registration How many points? Depends on how difficult/easy the image pair is? is often sufficient How should they be distributed? evenly across the entire image Moving target problem! be careful with lakes, reservoirs, agricultural fields What is the desired accuracy? minimum 0.5 pixel or better (you ll never get 100%)

49 resampling
, and then again in the other direction (Y) Cubic Convolution - the brightness value of a pixel in a corrected image is interpolated from the brightness values of the 16 nearest pixels")
50 Resampling Nearest Neighbor - select the nearest neighbor of the target pixel whose location is computed from transformation Bilinear Interpolation - do two linear interpolations, first in one direction (X), and then again in the other direction (Y) Cubic Convolution - the brightness value of a pixel in a corrected image is interpolated from the brightness values of the 16 nearest pixels around the location of the corrected pixel
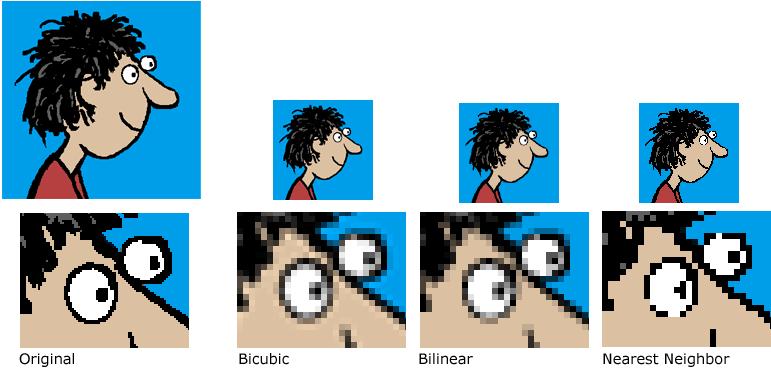
51 resampling
52 which resampling method? For analysis of remotely sensed data, prefer using Nearest Neighbor resampling to preserve original reflectance values Never perform interpolation-based resampling on categorical values You may be be able to use interpolation-based algorithms to smooth the data in places where this is needed Interpolation-based algorithms (especially Cubic Convolution) is slow!
53 What order? During registration and resampling, you will be asked to choose the order of the polynomial equation that will be used for the transformation Often, 1st order polynomials (linear equations) are sufficient for satellite data because satellite platforms are inherently stable and only rotational distortion occurs For image acquired with other devices (e.g. from aircrafts), use 2nd or 3rd order polynomials because of multiple distortions in the image
54 platform stability
55 Image Radiometric Correction
56 What is radiometric correction? The radiance value recorded by an imaging sensor is not a true record of ground-leaving radiance (or reflectance) because the original signal is distorted by atmospheric absorption, scattering, as well as instrument errors The purpose of radiometric correction is to remove these effects so that an image of true surface properties can be obtained or compared The need for this correction and the chosen method depends on the remote sensing problem, available atmospheric information, satellite data, and detail and expertise available
57 Sources of radiometric errors Internal errors are introduced by the remote sensing system. They are generally systematic (predictable) and may be identified and then corrected based on prelaunch or in-flight calibration measurements. For example, in many instances, radiometric correction can adjust for detector mis-calibration External errors are introduced by phenomena that vary in nature through space and time. They include the atmosphere, terrain, slope, and aspect. Some external errors may be corrected by relating empirical ground observations (i.e., radiometric and geometric ground control points) to sensor measurements
58 Internal radiometric errors Ideally, the radiance recorded by a remote sensing system in various bands is an accurate representation of the radiance actually leaving the feature of interest (e.g., soil, vegetation, water, or urban land cover) on the Earth s surface. Unfortunately, noise (error) can enter the datacollection system at several points. Several of the more common remote sensing system induced radiometric errors are: random bad pixels (shot noise), line-start/stop problems, line or column drop-outs, partial line or column drop-outs, and line or column striping

59 Random bad pixels (shot noise) a) Landsat Thematic Mapper band 7 ( µm) image of the Santee Delta in South Carolina. One of the 16 detectors exhibits serious striping and the absence of brightness values at pixel locations along a scan line. b) An enlarged view of the bad pixels with the brightness values of the eight surrounding pixels annotated. c) The brightness values of the bad pixels after shot noise removal. This image was not destriped. Jensen, 2004


60 N-line striping Jensen, 2004

61 N-line striping a) Original band 10 radiance (W m-2 sr-1) data from a GER DAIS 3715 hyperspectral dataset of the Mixed Waste Management Facility on the Savannah River Site near Aiken, SC. The subset is focused on a clay-capped hazardous waste site covered with Bahia grass and Centipede grass. The 35-band dataset was obtained at 2 2 m spatial resolution. The radiance values along the horizontal (X) and vertical (Y) profiles are summarized in the next figure. b) Enlargement of band 10 data. c) Band 10 data after destriping. d) An enlargement of the destriped data Jensen, 2004

62 Jensen, 2004
63 External radiometric errors Even if the remote sensor is functioning properly, external radiometric errors can be introduced by phenomena that vary in nature through space and time. They are external to the remote sensing process but heavily influence the resulting image data. External errors are often non-systematic and include the atmosphere, terrain, slope, and aspect. Some external errors may be corrected by relating empirical ground observations (i.e., radiometric and geometric ground control points) to sensor measurements. Correcting for these external effects is often called atmospheric correction even though the correction may apply to both atmosphere and the terrain
64 Atmospheric Correction Relative Correction (Radiometric normalization) Correction is performed relative to other (reference) images so that the corrected image is normalized as if it was acquired under same atmospheric, sensor, topographic conditions. Absolute Correction Requires (hard-to-obtain) information on atmospheric conditions at the time of image acquisition. The results are in absolute surface reflectance units. Image-based Methods RT-based methods
65 Unnecessary atmospheric correction Sometimes, it is possible to ignore atmospheric and terrain effects in remotely sensed data completely. For example, atmospheric correction is not necessary for certain types of classification and change detection. Research shows that only when training data from one place and one time must be extended through space and time is atmospheric correction necessary. For example, atmospheric correction is not necessary on a single date image data that will be classified, as long as the learning (training) data comes from the same image/date Jensen, 2004
66 Unnecessary atmospheric correction The general principle is that atmospheric correction is not necessary as long as the training data are extracted from the image (or image composite) under investigation and are not imported from another image acquired at another time or place Jensen, 2004
67 Atmospheric Correction Relative Correction (Radiometric normalization) Correction is performed relative to other (reference) images so that the corrected image is normalized as if it was acquired under same atmospheric, sensor, topographic conditions. Absolute Correction Requires (hard-to-obtain) information on atmospheric conditions at the time of image acquisition. The results are in absolute surface reflectance units. Image-based Methods RT-based methods
68 Relative Radiometric correction methods (three among many others) single image normalization using histogram adjustment multi-date image normalization using regression the ridge method

69 Atmospheric interaction with EMR
70 Atmospheric scattering in spectral regions


71 Atmospheric scattering in spectral regions TM blue band TM MIR band
72 Single image normalization using histogram adjustment The simplest method of relative atmospheric correction is based primarily based on the fact that infrared data (> 0.7 microns or 700 nm) are largely free of atmospheric scattering effects, whereas the visible range ( microns) is strongly influenced by atmospheric scattering The method involves evaluating the histogram of various bands of remotely sensed data Normally, the data collected in visible region has a higher minimum value because of increased atmospheric scattering
73 Radiometric normalization single image normalization using histogram adjustment Jensen, 2004
74 Single image normalization using histogram adjustment But in the NIR region, the atmospheric scattering is nearly zero, so the histogram minimums are close to zero (i.e. have true reflectance of zero) Of course this only applies to situations where a dark object exists with respect to NIR radiation (such as water) If the the visible band histograms are shifted to the left so that the values near zero appear in the data, the effects of atmospheric scattering will be somewhat minimized
75 single image normalization using histogram adjustment NOTE Does not account for atmospheric absorption!!
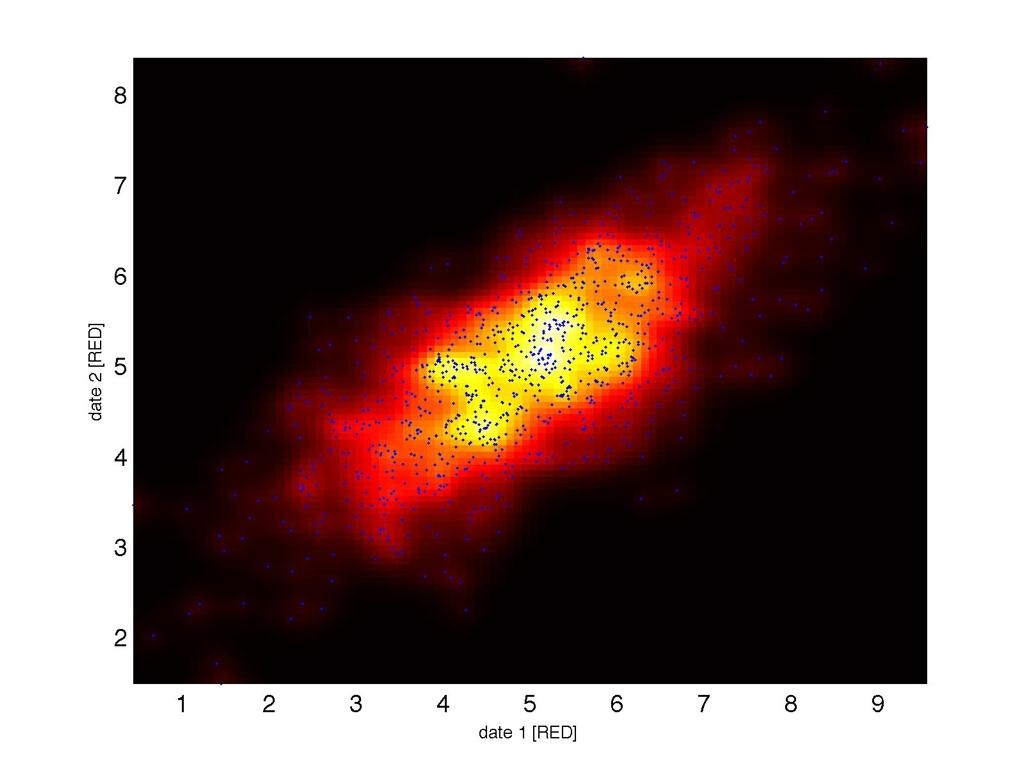
76 Radiometric correction using regression involves selecting a base (reference) image and then transforming the spectral characteristics of all other (subject) images obtained at different dates to have the approximately the same radiometric scale as this base (reference) image need to select pseudo-invariant features (PIFs) or radiometric ground control points obtain a regression equation using values from the PIFs and then apply it to the subject images
77 Characteristics of PIFs the PIFs should change very little across time, although some change is inevitable - deep non-turbid reservoirs (not coastal areas), bare soil, large rooftops, and other homogeneous areas are good candidates the PIFs should be obtained from the same elevation as other objects in the scene (image) the PIFs should contain minimal amounts of vegetation - vegetation spectral response changes over time - extremely stable homogeneous canopies are acceptable
 date 2")
78 Radiometric correction using regression date 1 (red) date 2 (red)
 date 1")
79 Radiometric correction using regression date 2 (red) date 1 (red)
80 date 1 (red) date 2 (red)-corrected
81 The ridge method
82
83 Atmospheric Correction Relative Correction (Radiometric normalization) Correction is performed relative to other (reference) images so that the corrected image is normalized as if it was acquired under same atmospheric, sensor, topographic conditions. Absolute Correction Requires (hard-to-obtain) information on atmospheric conditions at the time of image acquisition. The results are in absolute surface reflectance units. Image-based Methods RT-based methods
84 Atmospheric correction Absolute atmospheric correction requires information on atmospheric properties and a method to remove those interactions using either simple (image based) or a complex radiometric transfer code. The choice of method depends on availability of data, resources, tools, and expertise The desired end result is application dependent More involved methods require detailed sensor spectral profile and information on atmospheric properties at the time of image acquisition but this information is rarely available
85 Absolute Atmospheric Correction Image based methods Use the information available in the image itself to extract atmospheric parameters and then use this information to correct the image Radiative transfer based methods Use the information about the atmosphere within a radiative transfer model which simulates solar radiation interaction with atmospheric particles Hybrid approaches Use the combination of two approaches
86 Absolute atmospheric correction Image-based correction Hybrid methods Empirical line calibration DOS (Dark Object Subtraction) DDV (Dark Dense Vegetation) Radiative Transfer Model based correction 6S (Second Simulation of the Satellite Signal in the Solar Spectrum) Lowtran (LOW resolution atmospheric TRANsmittence) MODTRAN (MODerate resolution atmospheric TRANsmittence) Streamer (UW-Madison!)
87 Image-based methods easy to implement - image (and some external data) is all you need the idea is that some or all of the atmospheric parameters can be obtained from the image itself simplified assumption about atmospheric absorption and transmittance of radiation often based on dark targets for haze correction - only scattering is corrected in a bulk approach successfully applied to many environments
88 Empirical line calibration It is a simple method based on regression (i.e. the empirical line) which forces to image data to match in situ or other atmospherically corrected image based spectral reflectance measurements the analyst selects two or more areas in the image with different albedos (bright sand, dark water) then, in-situ (or other image data) spectral reflectance measurements are made over the same targets and a regression line is computed from the two datasets If in-situ spectra is not available, it is possible to use established libraries of reflectance properties of different objects but these materials must exist in the image


89 Field crew taking a spectroradiometer measurement from a calibrated reflectance standard on the tripod. b) 8 x 8 m black and white calibration targets at the Savannah River Site Jensen, 2004
90 DOS - Dark Object Subtraction It is perhaps the simplest yet most widely used image-based absolute atmospheric correction approach (Chavez, 1989). Based on the assumption that some pixels in the scene (image) are in complete shadow and their radiances received at the satellite are due to atmospheric scattering Also assumes that very few pixels (targets) are completely dark so 1% [0.01] reflectance is assumed instead of 0% [completely dark].
91 Radiative Transfer Models Models that calculate radiative transfer of electromagnetic radiation through the Earth s atmosphere and radiation interaction with atmospheric particles They are often used in numerical weather prediction and climate models They require information about atmospheric particles at the time of image acquisition and in absence of this information, they use standard profiles In remote sensing, they are used to estimate the contribution of atmospheric radiance to the radiance observed by the sensors using inversion and subtract this amount from the satellite signal
92 Hybrid methods DDV - Dark Dense Vegetation postulates a linear relationship between shortwave IR (2.2 microns) surface reflectance (unaffected by the atmosphere) and surface reflectance in the blue (0.4 microns) and red (0.6 microns) bands using this relation, surface reflectance for the visible bands are calculated and then compared to TOA reflectance to estimate Aerosol Optical Depth (AOD) using a radiative transfer code assumes dark vegetation exists in the scene and is identified by NDVI > 0.1 and SWIR(ref) < 0.05
93 DDV - Dark Dense Vegetation

94 MDDV - Dark Dense Vegetation (LEDAPS)
95 Image Classification
96 What is classification? thematic information extraction pattern recognition grouping of like-value measurements (pixels) image categorization
97 What is classification? The intent of the classification process is to categorize all pixels in a digital image into one of several land cover classes, or "themes". In remote sensing, multispectral (or multi-anything) data are used to perform the classification and it is this multivariate pattern present within the data for each pixel is used as the numerical basis for categorization The objective of image classification is to identify and portray, as a unique gray level (or color), the features occurring in an image in terms of the object or type of land cover these features actually represent on the ground.

98 What is classification?
99 local scale Iowa, 2006
100 regional scale
101 regional scale Peruvian Amazon

102 global scale MODIS land-cover map (2001)
103 Spatial scales and inputs Across these spatial scales, the methods are similar, exploiting the most useful information in an image (or a series of images) What is different however is the type of inputs that go into the classification algorithm At local scales, it is the spatial information that matters the most (and we have less spectral/ temporal information) At global scales, it is the temporal information most useful for accurate land-cover classifications
104 Categorization of classification methods Classification may be performed using the following methods: algorithms based on supervised or unsupervised classification logic; algorithms based on parametric or non-parametric statistics and non-metric methods; the use of hard or soft (fuzzy) set classification logic to create hard or soft labels; the use of per-pixel or object-oriented classification logic, and hybrid approaches
105 unsupervised vs. supervised In a supervised classification, the identity and location of the land-cover types (e.g., urban, agriculture, or wetland) are known a priori and the analyst attempts to locate specific sites in the remotely sensed data that represent homogeneous examples of these known land-cover types known as training sites because they are used to train the classification algorithm for eventual land-cover mapping of the remainder of the image. In an unsupervised classification, the identities of land-cover types to be specified as classes within a scene are not generally known a priori and the computer is required to group pixels with similar spectral characteristics into unique clusters according to some statistically determined criteria. The analyst then re-labels and combines the spectral clusters into information classes.
106 parametric vs. non-parametric Parametric methods assume certain distributional properties in remote sensor data and knowledge about the forms of the underlying class density functions Non-parametric methods may be applied to remote sensor data with any histogram distribution without the assumption that the forms of the underlying densities are known. Non-metric methods such as rule-based decision tree classifiers can operate on both real-valued data (e.g., reflectance values from 0 to 100%) and nominal scaled data (e.g., class 1 = forest; class 2 = agriculture).
107 hard vs. soft (fuzzy) Supervised and unsupervised classification algorithms typically use hard classification logic to produce a classified map that consists of hard, discrete categories (e.g., forest, agriculture,water). Conversely, it is also possible to use fuzzy set classification logic, which takes into account the heterogeneous and imprecise nature of the real world. Here, the classes are more imprecise and can have a gradient of labels (e.g., 60% forest, 40% ag)
108 per-pixel vs. object oriented In the past, most digital image classification was based on processing the entire scene pixel by pixel. This is commonly referred to as per-pixel classification. Object-oriented classification techniques allow the analyst to decompose the scene into many relatively homogenous image objects (referred to as patches or segments) that are bigger than individual pixels using an image segmentation process. The various statistical characteristics of these homogeneous image objects in the scene are then subjected to traditional statistical or fuzzy logic classification. Object-oriented classification based on image segmentation is often used for the analysis of high-spatialresolution imagery.
109 Image classification process define the problem select class labels acquire data process data to extract thematic information perform accuracy assessment distribute results
110 defining the problem What is thematic information you wish to extract? What are the categories you need? What is the desired extent and temporal frequency? What is the desired accuracy? What are your resources?
111 selecting class labels What are the categories you need? How detailed should they be? Do you have the information in satellite data to extract your desired labels? What scheme to use? What are your resources?
112 Classification schemes (i.e. class labels) All class labels of interest must be selected and defined carefully to classify remotely sensed data successfully into land-cover information. This requires the use of a classification scheme containing taxonomically correct definitions of classes of information that are organized according to logical criteria. If a hard classification is to be performed, then the classes in the classification system should normally be: mutually exclusive exhaustive, and hierarchical. Jensen, 2005
113 Existing classification schemes Certain hard classification schemes can readily incorporate land-use and/or land-cover data obtained by interpreting remotely sensed data, including the: American Planning Association Land-Based Classification System which is oriented toward detailed land-use classification; United States Geological Survey Land-Use/Land-Cover Classification System for Use with Remote Sensor Data and its adaptation for the U.S. National Land Cover Dataset and the NOAA Coastal Change Analysis Program (C-CAP); U.S. Department of the Interior Fish & Wildlife Service Classification of Wetlands and Deepwater Habitats of the United States; U.S. National Vegetation and Classification System; International Geosphere-Biosphere Program IGBP Land Cover Classification System modified for the creation of MODIS land-cover products LCCS - Land Cover Classification System - UN FAO European effort
114 acquire data Is the data available? i.e. is it collected? Who collected it? Where is it? How do data sets relate to your problem - e.g. do you have the spatial/spectral/temporal/angular data requirements to extract the labels you require? What are the spatial/spectral/temporal/angular characteristics? How much does it cost? Do you have the tools to read/view/edit this data?
115 process data to extract thematic information Which methods to use? How much do you know about your study site - a lot (supervised) - not so much (unsupervised - or exploratory analysis) If supervised, where does your training data come from? You generate it. You get it from somewhere. If unsupervised, how many spectral classes? How much variability in the landscape? Any ancillary information?
116 accuracy assessment Which methods to use? Where will the truth data come from? From you on the ground, from an ancillary data, from other people, from another map? What is the expected accuracy? What is the desired accuracy? What are your resources?
117 distribute results Map vs. area estimates? (are they the same?) Who is the audience? Technical person - include most information; End-user - provide the most important information What format (data type, data size?) Is the map registered to Earth coordinates to be used within a GIS? What is the accuracy of the map (or the product) you are delivering? If your audience don t ask, you do!
118 unsupervised vs. supervised In a supervised classification, the identity and location of the land-cover types (e.g., urban, agriculture, or wetland) are known a priori and the analyst attempts to locate specific sites in the remotely sensed data that represent homogeneous examples of these known land-cover types known as training sites because they are used to train the classification algorithm for eventual land-cover mapping of the remainder of the image. In an unsupervised classification, the identities of land-cover types to be specified as classes within a scene are not generally known a priori and the computer is required to group pixels with similar spectral characteristics into unique clusters according to some statistically determined criteria. The analyst then re-labels and combines the spectral clusters into information classes.
119 Unsupervised classification Unsupervised classification (commonly referred to as clustering) is an effective method of partitioning remote sensor image data in multispectral feature space and extracting land-cover information. Compared to supervised classification, unsupervised classification normally requires only a minimal amount of initial input from the analyst. This is because clustering does not normally require training data. Jensen, 2005
120 Common questions How many spectral classes should I use? The rule of thumb is to have 10 spectral classes per land-cover class of interest. This often captures enough variability in any given image Which method should I use? Tests show that many of the clustering algorithms function more or less the same way and the results are more dependent on available information in the image to separate land cover classes than the choice of the algorithm. What would I do if spectral classes don t capture my land-cover classes? Isolate those that worked, masked them out, then recluster, this time paying attention to more difficult classes. Can I merge supervised classification results with unsupervised approaches? Of course you can through masks
121 unsupervised vs. supervised In a supervised classification, the identity and location of the land-cover types (e.g., urban, agriculture, or wetland) are known a priori and the analyst attempts to locate specific sites in the remotely sensed data that represent homogeneous examples of these known land-cover types known as training sites because they are used to train the classification algorithm for eventual land-cover mapping of the remainder of the image. In an unsupervised classification, the identities of land-cover types to be specified as classes within a scene are not generally known a priori and the computer is required to group pixels with similar spectral characteristics into unique clusters according to some statistically determined criteria. The analyst then re-labels and combines the spectral clusters into information classes.
122 Training site selection There are a number of ways to collect the training site data, including: collection of in situ information such as tree type, height, percent canopy closure, and diameter-at-breast-height (dbh) measurements, on-screen selection of polygonal training data, and/or on-screen seeding of training data. Jensen, 2004
123 Characteristics of training data All training data must be mutually exclusive i.e. must represent separate classes although a number of training sites may represent a single class. It is better to define more classes of interest than the required number of land-cover classes for the final map as merging of classes is much easier than disaggregating Often, homogeneous locations (easy examples) are chosen to define training sites but there is value in randomization as well The goal is to capture as much variability of a class within a training data set without overburdening the the classification algorithm Jensen, 2004
124 loose ends
125 Classification and spatial scale There is a relationship between the level of detail in a classification scheme and the spatial resolution of remote sensor systems used to provide information. This suggests that the level of detail in the desired classification system dictates the spatial resolution of the remote sensor data that should be used. Of course, the spectral resolution of the remote sensing system is also an important consideration
126 Resolution effects on image classification In H type images, classification accuracy would be low due to within class variability In L type images, classification accuracy would be low due to between class variability There is always an optimum resolution for the map of interest But, you may not have data at that optimum resolution
127 Classification and categorical scale In contrast, there is an inverse relationship between the level of categorical detail and accuracy of the classification higher categorical detail (i.e. large number of classes) often leads to less accuracy to extract increased number of classes (categories) while lower categorical detail (i.e. fewer number of classes) e.g. a map with only deciduous vs. evergreen forest labels is generally more accurate (and is easier to make) than a map that attempts to distinguish evergreen tree species
. Note the dramatic increase in spatial resolution required to map Level II classes.")
128 Nominal spatial resolution requirements as a function of the mapping requirements for Levels I to IV land-cover classes in the United States (based on Anderson et al., 1976). Note the dramatic increase in spatial resolution required to map Level II classes. Jensen, 2005
129 land-cover vs. land-use Land cover refers to the type of material present on the landscape (e.g., water, sand, crops, forest, wetland, human-made materials such as asphalt). Remote sensing image classification always produces a landcover Land use refers to what people do on the land surface (e.g., agriculture, commerce, settlement). It is the use of land-cover and must be interpreted from landcover made from remote sensing
130 Accuracy Assessment
131 Accuracy assessment Why? - We want to assess the accuracy and test our hypothesis - Create an objective means of map comparison - Correct area estimates How? - Extract known samples and test against predictions using a confusion a matrix
132 Accuracy assessment When a map is made from remotely sensed data using a classification algorithm, that map is considered to be only a hypothesis As with other hypothesis-based problems, the hypothesis has to be tested with data Testing is done by extracting samples from your map, compare these samples to a known reference and simply keep track of how many are correct Then accuracy can be reported using a variety of metrics based on a degree of confidence can be attached to classification results
133 How do you collect reference data? Back-classification of training data Cross-validation Independent non-random samples Independent random samples Independent stratified random samples Which sampling design?
134 Common questions in accuracy assessment What is the sample? Which method to use to assess accuracy? What is my metric to measure accuracy? What is spatial autocorrelation? What is a good accuracy?
135 What is a sample? A sample is a subset of a population In general, the population is very large, making a census of all the values in the population impractical or impossible The sample represents a subset of manageable size. Samples are collected and statistics are calculated from the samples so that one can make inferences or extrapolations from the sample to the population This process of collecting information from a sample is referred to as sampling Wikipedia
136 systematic cluster simple random stratified random Sampling Design
137 Systematic Sample Systematic sampling is a statistical method involving the selection of elements from an ordered sampling frame. The most common form of systematic sampling is an equal-probability method, in which every kth element in the frame is selected
138 Cluster Sampling Cluster sampling is a sampling technique used when "natural" groupings are evident in population. The total population is divided into these groups and a sample of the groups is selected. The method works best when most of the variation in the population is within the groups, not between them
139 Simple Random Sampling Each sample is chosen randomly and entirely by chance, such that each individual in the sample has the same probability of being chosen at any stage during the sampling process.
 independently.")

140 Stratified Random Sampling When sub-populations vary considerably, it is advantageous to sample each subpopulation (stratum) independently. Stratification is the process of grouping members of the population into relatively homogeneous subgroups before sampling. Then random or systematic sampling is applied within each stratum.
141 Sample Size Sample size ultimately depends on a number of factors including: Expected accuracy Desired accuracy Desired level of confidence interval ultimately resources available
142 Proportional Allocation Proportional Allocation: the sample size of each stratum is proportionate to the population size of the stratum. Strata sample sizes are determined by the following equation: ns = (Ns/Np)*np ns is stratum sample size Ns is stratum population size Np is total population size np = total sample population size
143 Sample Size a good rule of thumb: 50 samples per class if number of classes is high (>12), samples per class homogeneous classes - fewer samples
144 Confusion Matrix (Error matrix) Once a sample is selected from the population, and checked against a reference data set, the percentage of pixels from each class in the image labeled correctly by the classifier can be estimated Along with these percentages, the proportions of pixels from each class erroneously labeled into every other class can also be estimated The tool that expresses these results in a tabular form is called the confusion or error matrix
145 Accuracy assessment calculating an error matrix: truth data classified map
146 Accuracy assessment truth data Add diagonals classified map 235 correct 235/284 = 0.82 overall map accuracy
147 Which is better? high user s or option #1 high producer s accuracy? need to spray depends on your ultimate use example: only decidous trees cannot damage coniferous! higher user s accuracy is good aerial tree if it says deciduous on the map, it is likely deciduous spraying program
148 Which is better? high user s or option #2 high producer s accuracy? depends on your ultimate use example: aerial tree spraying program need to spray deciduous trees and must get all of them no problem if other trees are sprayed as well a higher producer s accuracy is good we must correctly classify a lot of deciduous trees
149 Digital Change Detection
150 What is change detection? Extraction of temporal change information from remotely sensed imagery Remote sensing only provides the changes in measurements (reflectances) over time The purpose of digital change detection is to relate these changes in measurements to changes the nature and character of biophysical - environmental variables The main challange of digital change detection is then to separate changes of interest from changes of noninterest What are the examples of change detection?
151 What is change detection? The purpose of this list is to illustrate the kinds of changes (think variety) and then determine: which instrument (data) to use? which method to use? which scale of analysis? coarse scale (1km and up) medium scale ( meters) high resolution scale (10 m or less)
152 Ways to attack change detection problems spatial scales (spatial resolution): H - high (1-10 m) M - Medium ( m) C - Coarse (250 m and up) time periods over which change is monitored: e - event driven (days to months) a - one to several years d - on the order of decades frequency of observations required: d - daily to weekly s - seasonal e - end points
153 geographic extent of area to be monitored: l - local r - regional c - continental g - global nature of desired information on environmental change: space matters (map needed)? [yes] [no] area estimates of change required? [yes] [no] magnitude of change is important? [yes] [no] categorical vs. continuous outcome? [yes] [no] eventual use of data: l - local resource management/planning n - national scale planning g - monitoring global change w - early warning
154 Examples Forest clearing I: studying forest change at local to regional scales (e.g. N. Wisconsin). map and area extent are both important Forest clearing II: studying global tropical deforestation for global change questions. No interest in map and location of change. Areal extent of changes are important although the areal estimates may be through map making
155 The Challenge in change detection is separating: - the effects of changes unrelated to the surface - from the effects of changes related to surface unrelated (undesired) changes across time due to sun angle clouds/shadows snow cover phenology inter-annual variability (climate) atmospheric effects sensor calibration sensor view angle differences the problem of agriculture!
156 Remote Sensing system considerations Successful remote sensing change detection requires careful attention to: remote sensor system considerations, and environmental characteristics. Failure to understand the impact of the various parameters on the change detection process can lead to inaccurate results. Ideally, the remotely sensed data used to perform change detection is acquired by a remote sensor system that holds the following resolutions constant: temporal, spatial (and look angle), spectral, and radiometric.
157 Temporal resolution Two temporal resolutions should be held constant during change detection: First, use a sensor system that acquires data at approximately the same time of day. This eliminates diurnal Sun angle effects that can cause anomalous differences in the reflectance properties of the remote sensor data. Second, acquire remote sensor data on anniversary dates, e.g., Feb 1, 2004, and Feb 1, Anniversary date imagery minimizes the influence of seasonal Sun-angle and plant phenological differences that can negatively impact a change detection project.
158 Spatial resolution Accurate spatial registration of at least two images is essential for digital change detection. Ideally, the remotely sensed data are acquired by a sensor system that collects data with the same instantaneous field of view on each date. For example, Landsat TM data collected at 30 x 30 m spatial resolution on two dates are relatively easy to register to one another.
159 Spatial resolution Geometric rectification algorithms are used to register the images to a standard map projection Rectification should result in the two images having a root mean square error (RMSE) of < 0.5 pixel Mis-registration of the two images may result in the identification of spurious areas of change between the datasets. For example, just one pixel mis-registration may cause a stable road on the two dates to show up as a new road in the change image.
160 Spectral resolution Ideally, the same sensor system is used to acquire imagery on multiple dates. When this is not possible, the analyst should select bands that approximate one another. For example, Landsat MSS bands 4 (green), 5 (red), and 7 (near-infrared) and SPOT bands 1 (green), 2 (red), and 3 (near-infrared), can be used successfully with Landsat ETM+ bands 2 (green), 3 (red), and 4 (near-infrared). Many change detection algorithms do not function well when the bands in one image do not match those of the other image
161 Soil moisture Ideally, soil moisture conditions should be identical for the N dates of imagery used in a change detection project. Extremely wet or dry conditions on one of the dates can cause change detection problems. When soil moisture differences between dates are significant for only certain parts of the study area (perhaps due to a local thunderstorm), it may be necessary to stratify (cut out) those affected areas and perform a separate change detection analysis, which can be added back in the final stages of the project.
162 Phenological cycle of vegetation Natural ecosystems go through repeatable, predictable cycles of development. Humans also modify the landscape in predictable stages. Analysts use this information to identify when remotely sensed data should be collected. Therefore, analysts must be familiar with the biophysical characteristics of the vegetation, soils, and water constituents of ecosystems and their phenological cycles. Likewise, they must understand human-made development phenological cycles such as those associated with residential expansion at the urban/rural fringe.
163 Phenological cycle of vegetation Vegetation grows according to relatively predictable diurnal, seasonal, and annual phenological cycles. Obtaining near-anniversary images greatly minimizes the effects of seasonal phenological differences that may cause spurious change to be detected in the imagery. When attempting to identify change in agricultural crops, the analyst must be aware of when the crops were planted. A month lag in planting date between fields of the same crop can cause serious change detection error.
164 Steps required in digital change detection Define the problem Sensor and environmental considerations Perform digital change analysis Perform accuracy assessment Distribute results
165 Selection of change detection algorithm The selection of an appropriate change detection algorithm is very important. First, it will have a direct impact on the type of image classification to be performed (if any). Second, it will dictate whether important from to change information can be extracted from the imagery. Many change detection projects require that from to information be readily available in the form of maps and tabular summaries.
166 Change Detection Process RAW MULTIDATE IMAGERY RADIOMETRIC PREPROCESSING scene matching DOS RT TRANSFORMATION METHOD image differencing NDVI diff multidate ratio multidate regression multidate K-T change vector GS PCA METHOD OF RELATING IMAGE CHANGE TO CHANGE OF INTEREST density slicing classification regression mixture analysis neural networks regression trees decision trees RESULTS Map cat. cont. Area estimates DOS: Dark Object Subtraction; RT: Radiative Transfer; K-T: Kauth-Thomas transform; GS: Gramm-Schmidth; PCA: Principal Components Analysis; SMA: Spectral Mixture Analysis.
Application of GIS to Fast Track Planning and Monitoring of Development Agenda
 Application of GIS to Fast Track Planning and Monitoring of Development Agenda Radiometric, Atmospheric & Geometric Preprocessing of Optical Remote Sensing 13 17 June 2018 Outline 1. Why pre-process remotely
Remote Sensing. The following figure is grey scale display of SPOT Panchromatic without stretching.
 Remote Sensing Objectives This unit will briefly explain display of remote sensing image, geometric correction, spatial enhancement, spectral enhancement and classification of remote sensing image. At
Remote Sensing. Odyssey 7 Jun 2012 Benjamin Post
 Remote Sensing Odyssey 7 Jun 2012 Benjamin Post Definitions Applications Physics Image Processing Classifiers Ancillary Data Data Sources Related Concepts Outline Big Picture Definitions Remote Sensing
Basic Digital Image Processing. The Structure of Digital Images. An Overview of Image Processing. Image Restoration: Line Drop-outs
 Basic Digital Image Processing A Basic Introduction to Digital Image Processing ~~~~~~~~~~ Rev. Ronald J. Wasowski, C.S.C. Associate Professor of Environmental Science University of Portland Portland,
Mod. 2 p. 1. Prof. Dr. Christoph Kleinn Institut für Waldinventur und Waldwachstum Arbeitsbereich Fernerkundung und Waldinventur
 Histograms of gray values for TM bands 1-7 for the example image - Band 4 and 5 show more differentiation than the others (contrast=the ratio of brightest to darkest areas of a landscape). - Judging from
Preparing Remote Sensing Data for Natural Resources Mapping (image enhancement, rectifications )
") Preparing Remote Sensing Data for Natural Resources Mapping (image enhancement, rectifications ) Why is this important What are the major approaches Examples of digital image enhancement Follow up exercises
Preparing Remote Sensing Data for Natural Resources Mapping (image enhancement, rectifications ) Why is this important What are the major approaches Examples of digital image enhancement Follow up exercises
APCAS/10/21 April 2010 ASIA AND PACIFIC COMMISSION ON AGRICULTURAL STATISTICS TWENTY-THIRD SESSION. Siem Reap, Cambodia, April 2010
 APCAS/10/21 April 2010 Agenda Item 8 ASIA AND PACIFIC COMMISSION ON AGRICULTURAL STATISTICS TWENTY-THIRD SESSION Siem Reap, Cambodia, 26-30 April 2010 The Use of Remote Sensing for Area Estimation by Robert
An Introduction to Remote Sensing & GIS. Introduction
 An Introduction to Remote Sensing & GIS Introduction Remote sensing is the measurement of object properties on Earth s surface using data acquired from aircraft and satellites. It attempts to measure something
An Introduction to Geomatics. Prepared by: Dr. Maher A. El-Hallaq خاص بطلبة مساق مقدمة في علم. Associate Professor of Surveying IUG
 An Introduction to Geomatics خاص بطلبة مساق مقدمة في علم الجيوماتكس Prepared by: Dr. Maher A. El-Hallaq Associate Professor of Surveying IUG 1 Airborne Imagery Dr. Maher A. El-Hallaq Associate Professor
Spatial Analyst is an extension in ArcGIS specially designed for working with raster data.
 Spatial Analyst is an extension in ArcGIS specially designed for working with raster data. 1 Do you remember the difference between vector and raster data in GIS? 2 In Lesson 2 you learned about the difference
Image interpretation and analysis
 Image interpretation and analysis Grundlagen Fernerkundung, Geo 123.1, FS 2014 Lecture 7a Rogier de Jong Michael Schaepman Why are snow, foam, and clouds white? Why are snow, foam, and clouds white? Today
Image Band Transformations
 Image Band Transformations Content Band math Band ratios Vegetation Index Tasseled Cap Transform Principal Component Analysis (PCA) Decorrelation Stretch Image Band Transformation Purposes Image band transforms
Lecture 13: Remotely Sensed Geospatial Data
 Lecture 13: Remotely Sensed Geospatial Data A. The Electromagnetic Spectrum: The electromagnetic spectrum (Figure 1) indicates the different forms of radiation (or simply stated light) emitted by nature.
The techniques with ERDAS IMAGINE include:
 The techniques with ERDAS IMAGINE include: 1. Data correction - radiometric and geometric correction 2. Radiometric enhancement - enhancing images based on the values of individual pixels 3. Spatial enhancement
Introduction to Remote Sensing Part 1
 Introduction to Remote Sensing Part 1 A Primer on Electromagnetic Radiation Digital, Multi-Spectral Imagery The 4 Resolutions Displaying Images Corrections and Enhancements Passive vs. Active Sensors Radar
Land Cover Analysis to Determine Areas of Clear-cut and Forest Cover in Olney, Montana. Geob 373 Remote Sensing. Dr Andreas Varhola, Kathry De Rego
 1 Land Cover Analysis to Determine Areas of Clear-cut and Forest Cover in Olney, Montana Geob 373 Remote Sensing Dr Andreas Varhola, Kathry De Rego Zhu an Lim (14292149) L2B 17 Apr 2016 2 Abstract Montana
GE 113 REMOTE SENSING
 GE 113 REMOTE SENSING Topic 8. Image Classification and Accuracy Assessment Lecturer: Engr. Jojene R. Santillan jrsantillan@carsu.edu.ph Division of Geodetic Engineering College of Engineering and Information
Enhancement of Multispectral Images and Vegetation Indices
 Enhancement of Multispectral Images and Vegetation Indices ERDAS Imagine 2016 Description: We will use ERDAS Imagine with multispectral images to learn how an image can be enhanced for better interpretation.
NORMALIZING ASTER DATA USING MODIS PRODUCTS FOR LAND COVER CLASSIFICATION
 NORMALIZING ASTER DATA USING MODIS PRODUCTS FOR LAND COVER CLASSIFICATION F. Gao a, b, *, J. G. Masek a a Biospheric Sciences Branch, NASA Goddard Space Flight Center, Greenbelt, MD 20771, USA b Earth
NRS 415 Remote Sensing of Environment
 NRS 415 Remote Sensing of Environment 1 High Oblique Perspective (Side) Low Oblique Perspective (Relief) 2 Aerial Perspective (See What s Hidden) An example of high spatial resolution true color remote
Present and future of marine production in Boka Kotorska
 Present and future of marine production in Boka Kotorska First results from satellite remote sensing for the breeding areas of filter feeders in the Bay of Kotor INTRODUCTION Environmental monitoring is
Interpreting land surface features. SWAC module 3
 Interpreting land surface features SWAC module 3 Interpreting land surface features SWAC module 3 Different kinds of image Panchromatic image True-color image False-color image EMR : NASA Echo the bat
Sommersemester Prof. Dr. Christoph Kleinn Institut für Waldinventur und Waldwachstum Arbeitsbereich Fernerkundung und Waldinventur.
 Basics of Remote Sensing Some literature references Franklin, SE 2001 Remote Sensing for Sustainable Forest Management Lewis Publishers 407p Lillesand, Kiefer 2000 Remote Sensing and Image Interpretation
Int n r t o r d o u d c u ti t on o n to t o Remote Sensing
 Introduction to Remote Sensing Definition of Remote Sensing Remote sensing refers to the activities of recording/observing/perceiving(sensing)objects or events at far away (remote) places. In remote sensing,
Satellite data processing and analysis: Examples and practical considerations
 Satellite data processing and analysis: Examples and practical considerations Dániel Kristóf Ottó Petrik, Róbert Pataki, András Kolesár International LCLUC Regional Science Meeting in Central Europe Sopron,
GIS Data Collection. Remote Sensing
 GIS Data Collection Remote Sensing Data Collection Remote sensing Introduction Concepts Spectral signatures Resolutions: spectral, spatial, temporal Digital image processing (classification) Other systems
typical spectral signatures of photosynthetically active and non-photosynthetically active vegetation (Beeri et al., 2007)
") typical spectral signatures of photosynthetically active and non-photosynthetically active vegetation (Beeri et al., 2007) Xie, Y. et al. J Plant Ecol 2008 1:9-23; doi:10.1093/jpe/rtm005 Copyright restrictions
typical spectral signatures of photosynthetically active and non-photosynthetically active vegetation (Beeri et al., 2007) Xie, Y. et al. J Plant Ecol 2008 1:9-23; doi:10.1093/jpe/rtm005 Copyright restrictions
Remote sensing in archaeology from optical to lidar. Krištof Oštir ModeLTER Scientific Research Centre of the Slovenian Academy of Sciences and Arts
 Remote sensing in archaeology from optical to lidar Krištof Oštir ModeLTER Scientific Research Centre of the Slovenian Academy of Sciences and Arts Introduction Optical remote sensing Systems Search for
Remote sensing image correction
 Remote sensing image correction Introductory readings remote sensing http://www.microimages.com/documentation/tutorials/introrse.pdf 1 Preprocessing Digital Image Processing of satellite images can be
Introduction to Remote Sensing
 Introduction to Remote Sensing Spatial, spectral, temporal resolutions Image display alternatives Vegetation Indices Image classifications Image change detections Accuracy assessment Satellites & Air-Photos
Ground Truth for Calibrating Optical Imagery to Reflectance
 Visual Information Solutions Ground Truth for Calibrating Optical Imagery to Reflectance The by: Thomas Harris Whitepaper Introduction: Atmospheric Effects on Optical Imagery Remote sensing of the Earth
Land cover change methods. Ned Horning
 Land cover change methods Ned Horning Version: 1.0 Creation Date: 2004-01-01 Revision Date: 2004-01-01 License: This document is licensed under a Creative Commons Attribution-Share Alike 3.0 Unported License.
GEOG432: Remote sensing Lab 3 Unsupervised classification
 GEOG432: Remote sensing Lab 3 Unsupervised classification Goal: This lab involves identifying land cover types by using agorithms to identify pixels with similar Digital Numbers (DN) and spectral signatures
Image transformations
 Image transformations Digital Numbers may be composed of three elements: Atmospheric interference (e.g. haze) ATCOR Illumination (angle of reflection) - transforms Albedo (surface cover) Image transformations
REMOTE SENSING. Topic 10 Fundamentals of Digital Multispectral Remote Sensing MULTISPECTRAL SCANNERS MULTISPECTRAL SCANNERS
 REMOTE SENSING Topic 10 Fundamentals of Digital Multispectral Remote Sensing Chapter 5: Lillesand and Keifer Chapter 6: Avery and Berlin MULTISPECTRAL SCANNERS Record EMR in a number of discrete portions
Chapter 5. Preprocessing in remote sensing
 Chapter 5. Preprocessing in remote sensing 5.1 Introduction Remote sensing images from spaceborne sensors with resolutions from 1 km to < 1 m become more and more available at reasonable costs. For some
REMOTE SENSING INTERPRETATION
 REMOTE SENSING INTERPRETATION Jan Clevers Centre for Geo-Information - WU Remote Sensing --> RS Sensor at a distance EARTH OBSERVATION EM energy Earth RS is a tool; one of the sources of information! 1
Evaluating the Effects of Shadow Detection on QuickBird Image Classification and Spectroradiometric Restoration
 Remote Sens. 2013, 5, 4450-4469; doi:10.3390/rs5094450 Article OPEN ACCESS Remote Sensing ISSN 2072-4292 www.mdpi.com/journal/remotesensing Evaluating the Effects of Shadow Detection on QuickBird Image
Digital Image Processing
 Digital Image Processing 1 Patrick Olomoshola, 2 Taiwo Samuel Afolayan 1,2 Surveying & Geoinformatic Department, Faculty of Environmental Sciences, Rufus Giwa Polytechnic, Owo. Nigeria Abstract: This paper
CanImage. (Landsat 7 Orthoimages at the 1: Scale) Standards and Specifications Edition 1.0
 Standards and Specifications Edition 1.0") CanImage (Landsat 7 Orthoimages at the 1:50 000 Scale) Standards and Specifications Edition 1.0 Centre for Topographic Information Customer Support Group 2144 King Street West, Suite 010 Sherbrooke, QC
CanImage (Landsat 7 Orthoimages at the 1:50 000 Scale) Standards and Specifications Edition 1.0 Centre for Topographic Information Customer Support Group 2144 King Street West, Suite 010 Sherbrooke, QC
NON-PHOTOGRAPHIC SYSTEMS: Multispectral Scanners Medium and coarse resolution sensor comparisons: Landsat, SPOT, AVHRR and MODIS
 NON-PHOTOGRAPHIC SYSTEMS: Multispectral Scanners Medium and coarse resolution sensor comparisons: Landsat, SPOT, AVHRR and MODIS CLASSIFICATION OF NONPHOTOGRAPHIC REMOTE SENSORS PASSIVE ACTIVE DIGITAL
ECC419 IMAGE PROCESSING
 ECC419 IMAGE PROCESSING INTRODUCTION Image Processing Image processing is a subclass of signal processing concerned specifically with pictures. Digital Image Processing, process digital images by means
CoE4TN4 Image Processing. Chapter 3: Intensity Transformation and Spatial Filtering
 CoE4TN4 Image Processing Chapter 3: Intensity Transformation and Spatial Filtering Image Enhancement Enhancement techniques: to process an image so that the result is more suitable than the original image
Remote Sensing in Daily Life. What Is Remote Sensing?
 Remote Sensing in Daily Life What Is Remote Sensing? First time term Remote Sensing was used by Ms Evelyn L Pruitt, a geographer of US in mid 1950s. Minimal definition (not very useful): remote sensing
Remote Sensing for Rangeland Applications
 Remote Sensing for Rangeland Applications Jay Angerer Ecological Training June 16, 2012 Remote Sensing The term "remote sensing," first used in the United States in the 1950s by Ms. Evelyn Pruitt of the
Module 11 Digital image processing
 Introduction Geo-Information Science Practical Manual Module 11 Digital image processing 11. INTRODUCTION 11-1 START THE PROGRAM ERDAS IMAGINE 11-2 PART 1: DISPLAYING AN IMAGE DATA FILE 11-3 Display of
Course overview; Remote sensing introduction; Basics of image processing & Color theory
 GEOL 1460 /2461 Ramsey Introduction to Remote Sensing Fall, 2018 Course overview; Remote sensing introduction; Basics of image processing & Color theory Week #1: 29 August 2018 I. Syllabus Review we will
University of Texas at San Antonio EES 5053 Term Project CORRELATION BETWEEN NDVI AND SURFACE TEMPERATURES USING LANDSAT ETM + IMAGERY NEWFEL MAZARI
 University of Texas at San Antonio EES 5053 Term Project CORRELATION BETWEEN NDVI AND SURFACE TEMPERATURES USING LANDSAT ETM + IMAGERY NEWFEL MAZARI Introduction and Objectives The present study is a correlation
Remote Sensing Exam 2 Study Guide
 Remote Sensing Exam 2 Study Guide Resolution Analog to digital Instantaneous field of view (IFOV) f ( cone angle of optical system ) Everything in that area contributes to spectral response mixels Sampling
Outline for today. Geography 411/611 Remote sensing: Principles and Applications. Remote sensing: RS for biogeochemical cycles
 Geography 411/611 Remote sensing: Principles and Applications Thomas Albright, Associate Professor Laboratory for Conservation Biogeography, Department of Geography & Program in Ecology, Evolution, & Conservation
GEOG432: Remote sensing Lab 3 Unsupervised classification
 GEOG432: Remote sensing Lab 3 Unsupervised classification Goal: This lab involves identifying land cover types by using agorithms to identify pixels with similar Digital Numbers (DN) and spectral signatures
VALIDATION OF THE CLOUD AND CLOUD SHADOW ASSESSMENT SYSTEM FOR LANDSAT IMAGERY (CASA-L VERSION 1.3)
") GDA Corp. VALIDATION OF THE CLOUD AND CLOUD SHADOW ASSESSMENT SYSTEM FOR LANDSAT IMAGERY (-L VERSION 1.3) GDA Corp. has developed an innovative system for Cloud And cloud Shadow Assessment () in Landsat
GDA Corp. VALIDATION OF THE CLOUD AND CLOUD SHADOW ASSESSMENT SYSTEM FOR LANDSAT IMAGERY (-L VERSION 1.3) GDA Corp. has developed an innovative system for Cloud And cloud Shadow Assessment () in Landsat
TEMPORAL ANALYSIS OF MULTI EPOCH LANDSAT GEOCOVER IMAGES IN ZONGULDAK TESTFIELD
 TEMPORAL ANALYSIS OF MULTI EPOCH LANDSAT GEOCOVER IMAGES IN ZONGULDAK TESTFIELD Şahin, H. a*, Oruç, M. a, Büyüksalih, G. a a Zonguldak Karaelmas University, Zonguldak, Turkey - (sahin@karaelmas.edu.tr,
Remote Sensing And Gis Application in Image Classification And Identification Analysis.
 Quest Journals Journal of Research in Environmental and Earth Science Volume 3~ Issue 5 (2017) pp: 55-66 ISSN(Online) : 2348-2532 www.questjournals.org Research Paper Remote Sensing And Gis Application
746A27 Remote Sensing and GIS. Multi spectral, thermal and hyper spectral sensing and usage
 746A27 Remote Sensing and GIS Lecture 3 Multi spectral, thermal and hyper spectral sensing and usage Chandan Roy Guest Lecturer Department of Computer and Information Science Linköping University Multi
SECTION I - CHAPTER 2 DIGITAL IMAGING PROCESSING CONCEPTS
 RADT 3463 - COMPUTERIZED IMAGING Section I: Chapter 2 RADT 3463 Computerized Imaging 1 SECTION I - CHAPTER 2 DIGITAL IMAGING PROCESSING CONCEPTS RADT 3463 COMPUTERIZED IMAGING Section I: Chapter 2 RADT
Introduction to Remote Sensing
 Introduction to Remote Sensing Outline Remote Sensing Defined Resolution Electromagnetic Energy (EMR) Types Interpretation Applications Remote Sensing Defined Remote Sensing is: The art and science of
2007 Land-cover Classification and Accuracy Assessment of the Greater Puget Sound Region
 2007 Land-cover Classification and Accuracy Assessment of the Greater Puget Sound Region Urban Ecology Research Laboratory Department of Urban Design and Planning University of Washington May 2009 1 1.
A map says to you, 'Read me carefully, follow me closely, doubt me not.' It says, 'I am the Earth in the palm of your hand. Without me, you are alone
 A map says to you, 'Read me carefully, follow me closely, doubt me not.' It says, 'I am the Earth in the palm of your hand. Without me, you are alone and lost. Beryl Markham (West With the Night, 1946
Remote Sensing Platforms
 Types of Platforms Lighter-than-air Remote Sensing Platforms Free floating balloons Restricted by atmospheric conditions Used to acquire meteorological/atmospheric data Blimps/dirigibles Major role - news
What is Remote Sensing? Contents. Image Fusion in Remote Sensing. 1. Optical imagery in remote sensing. Electromagnetic Spectrum
 Contents Image Fusion in Remote Sensing Optical imagery in remote sensing Image fusion in remote sensing New development on image fusion Linhai Jing Applications Feb. 17, 2011 2 1. Optical imagery in remote
Spectral Signatures. Vegetation. 40 Soil. Water WAVELENGTH (microns)
") Spectral Signatures % REFLECTANCE VISIBLE NEAR INFRARED Vegetation Soil Water.5. WAVELENGTH (microns). Spectral Reflectance of Urban Materials 5 Parking Lot 5 (5=5%) Reflectance 5 5 5 5 5 Wavelength (nm)
Spectral Signatures % REFLECTANCE VISIBLE NEAR INFRARED Vegetation Soil Water.5. WAVELENGTH (microns). Spectral Reflectance of Urban Materials 5 Parking Lot 5 (5=5%) Reflectance 5 5 5 5 5 Wavelength (nm)
Lecture 2. Electromagnetic radiation principles. Units, image resolutions.
 NRMT 2270, Photogrammetry/Remote Sensing Lecture 2 Electromagnetic radiation principles. Units, image resolutions. Tomislav Sapic GIS Technologist Faculty of Natural Resources Management Lakehead University
Removing Thick Clouds in Landsat Images
 Removing Thick Clouds in Landsat Images S. Brindha, S. Archana, V. Divya, S. Manoshruthy & R. Priya Dept. of Electronics and Communication Engineering, Avinashilingam Institute for Home Science and Higher
Evaluation of FLAASH atmospheric correction. Note. Note no SAMBA/10/12. Authors. Øystein Rudjord and Øivind Due Trier
 Evaluation of FLAASH atmospheric correction Note Note no Authors SAMBA/10/12 Øystein Rudjord and Øivind Due Trier Date 16 February 2012 Norsk Regnesentral Norsk Regnesentral (Norwegian Computing Center,
Image Fusion. Pan Sharpening. Pan Sharpening. Pan Sharpening: ENVI. Multi-spectral and PAN. Magsud Mehdiyev Geoinfomatics Center, AIT
 1 Image Fusion Sensor Merging Magsud Mehdiyev Geoinfomatics Center, AIT Image Fusion is a combination of two or more different images to form a new image by using certain algorithms. ( Pohl et al 1998)
Blacksburg, VA July 24 th 30 th, 2010 Remote Sensing Page 1. A condensed overview. For our purposes
 A condensed overview George McLeod Prepared by: With support from: NSF DUE-0903270 in partnership with: Geospatial Technician Education Through Virginia s Community Colleges (GTEVCC) The art and science
* Tokai University Research and Information Center
 Effects of tial Resolution to Accuracies for t HRV and Classification ta Haruhisa SH Kiyonari i KASA+, uji, and Toshibumi * Tokai University Research and nformation Center 2-28-4 Tomigaya, Shi, T 151,
Hyperspectral image processing and analysis
 Hyperspectral image processing and analysis Lecture 12 www.utsa.edu/lrsg/teaching/ees5083/l12-hyper.ppt Multi- vs. Hyper- Hyper-: Narrow bands ( 20 nm in resolution or FWHM) and continuous measurements.
University of Technology Building & Construction Department / Remote Sensing & GIS lecture
 8. Image Enhancement 8.1 Image Reduction and Magnification. 8.2 Transects (Spatial Profile) 8.3 Spectral Profile 8.4 Contrast Enhancement 8.4.1 Linear Contrast Enhancement 8.4.2 Non-Linear Contrast Enhancement
Background Adaptive Band Selection in a Fixed Filter System
 Background Adaptive Band Selection in a Fixed Filter System Frank J. Crosby, Harold Suiter Naval Surface Warfare Center, Coastal Systems Station, Panama City, FL 32407 ABSTRACT An automated band selection
MULTISPECTRAL IMAGE PROCESSING I
 TM1 TM2 337 TM3 TM4 TM5 TM6 Dr. Robert A. Schowengerdt TM7 Landsat Thematic Mapper (TM) multispectral images of desert and agriculture near Yuma, Arizona MULTISPECTRAL IMAGE PROCESSING I SENSORS Multispectral
CHAPTER 7: Multispectral Remote Sensing
 CHAPTER 7: Multispectral Remote Sensing REFERENCE: Remote Sensing of the Environment John R. Jensen (2007) Second Edition Pearson Prentice Hall Overview of How Digital Remotely Sensed Data are Transformed
RGB colours: Display onscreen = RGB
 RGB colours: http://www.colorspire.com/rgb-color-wheel/ Display onscreen = RGB DIGITAL DATA and DISPLAY Myth: Most satellite images are not photos Photographs are also 'images', but digital images are
LANDSAT-SPOT DIGITAL IMAGES INTEGRATION USING GEOSTATISTICAL COSIMULATION TECHNIQUES
 LANDSAT-SPOT DIGITAL IMAGES INTEGRATION USING GEOSTATISTICAL COSIMULATION TECHNIQUES J. Delgado a,*, A. Soares b, J. Carvalho b a Cartographical, Geodetical and Photogrammetric Engineering Dept., University
Urban Classification of Metro Manila for Seismic Risk Assessment using Satellite Images
 Urban Classification of Metro Manila for Seismic Risk Assessment using Satellite Images Fumio YAMAZAKI/ yamazaki@edm.bosai.go.jp Hajime MITOMI/ mitomi@edm.bosai.go.jp Yalkun YUSUF/ yalkun@edm.bosai.go.jp
Some Basic Concepts of Remote Sensing. Lecture 2 August 31, 2005
 Some Basic Concepts of Remote Sensing Lecture 2 August 31, 2005 What is remote sensing Remote Sensing: remote sensing is science of acquiring, processing, and interpreting images and related data that
Abstract Quickbird Vs Aerial photos in identifying man-made objects
 Abstract Quickbird Vs Aerial s in identifying man-made objects Abdullah Mah abdullah.mah@aramco.com Remote Sensing Group, emap Division Integrated Solutions Services Department (ISSD) Saudi Aramco, Dhahran
On the use of synthetic images for change detection accuracy assessment
 On the use of synthetic images for change detection accuracy assessment Hélio Radke Bittencourt 1, Daniel Capella Zanotta 2 and Thiago Bazzan 3 1 Departamento de Estatística, Pontifícia Universidade Católica
[GEOMETRIC CORRECTION, ORTHORECTIFICATION AND MOSAICKING]
![[GEOMETRIC CORRECTION, ORTHORECTIFICATION AND MOSAICKING]](/thumbs/78/78211997.jpg "[GEOMETRIC CORRECTION, ORTHORECTIFICATION AND MOSAICKING]") 2013 Ogis-geoInfo Inc. IBEABUCHI NKEMAKOLAM.J [GEOMETRIC CORRECTION, ORTHORECTIFICATION AND MOSAICKING] [Type the abstract of the document here. The abstract is typically a short summary of the contents
2013 Ogis-geoInfo Inc. IBEABUCHI NKEMAKOLAM.J [GEOMETRIC CORRECTION, ORTHORECTIFICATION AND MOSAICKING] [Type the abstract of the document here. The abstract is typically a short summary of the contents
Govt. Engineering College Jhalawar Model Question Paper Subject- Remote Sensing & GIS
 Govt. Engineering College Jhalawar Model Question Paper Subject- Remote Sensing & GIS Time: Max. Marks: Q1. What is remote Sensing? Explain the basic components of a Remote Sensing system. Q2. What is
CLASSIFICATION OF VEGETATION AREA FROM SATELLITE IMAGES USING IMAGE PROCESSING TECHNIQUES ABSTRACT
 CLASSIFICATION OF VEGETATION AREA FROM SATELLITE IMAGES USING IMAGE PROCESSING TECHNIQUES Arpita Pandya Research Scholar, Computer Science, Rai University, Ahmedabad Dr. Priya R. Swaminarayan Professor
Introduction of Satellite Remote Sensing
 Introduction of Satellite Remote Sensing Spatial Resolution (Pixel size) Spectral Resolution (Bands) Resolutions of Remote Sensing 1. Spatial (what area and how detailed) 2. Spectral (what colors bands)
GE 113 REMOTE SENSING. Topic 7. Image Enhancement
 GE 113 REMOTE SENSING Topic 7. Image Enhancement Lecturer: Engr. Jojene R. Santillan jrsantillan@carsu.edu.ph Division of Geodetic Engineering College of Engineering and Information Technology Caraga State
F2 - Fire 2 module: Remote Sensing Data Classification
 F2 - Fire 2 module: Remote Sensing Data Classification F2.1 Task_1: Supervised and Unsupervised classification examples of a Landsat 5 TM image from the Center of Portugal, year 2005 F2.1 Task_2: Burnt
A MULTISTAGE APPROACH FOR DETECTING AND CORRECTING SHADOWS IN QUICKBIRD IMAGERY
 A MULTISTAGE APPROACH FOR DETECTING AND CORRECTING SHADOWS IN QUICKBIRD IMAGERY Jindong Wu, Assistant Professor Department of Geography California State University, Fullerton 800 North State College Boulevard
Comparing of Landsat 8 and Sentinel 2A using Water Extraction Indexes over Volta River
 Journal of Geography and Geology; Vol. 10, No. 1; 2018 ISSN 1916-9779 E-ISSN 1916-9787 Published by Canadian Center of Science and Education Comparing of Landsat 8 and Sentinel 2A using Water Extraction
PLANET SURFACE REFLECTANCE PRODUCT
 PLANET SURFACE REFLECTANCE PRODUCT FEBRUARY 2018 SUPPORT@PLANET.COM PLANET.COM VERSION 1.0 TABLE OF CONTENTS 3 Product Description 3 Atmospheric Correction Methodology 5 Product Limitations 6 Product Assessment
RADIOMETRIC CALIBRATION
 1 RADIOMETRIC CALIBRATION Lecture 10 Digital Image Data 2 Digital data are matrices of digital numbers (DNs) There is one layer (or matrix) for each satellite band Each DN corresponds to one pixel 3 Digital
Digital Image Processing
 Digital Image Processing Lecture # 5 Image Enhancement in Spatial Domain- I ALI JAVED Lecturer SOFTWARE ENGINEERING DEPARTMENT U.E.T TAXILA Email:: ali.javed@uettaxila.edu.pk Office Room #:: 7 Presentation
Satellite image classification
 Satellite image classification EG2234 Earth Observation Image Classification Exercise 29 November & 6 December 2007 Introduction to the practical This practical, which runs over two weeks, is concerned
Chapter 1 Overview of imaging GIS
 Chapter 1 Overview of imaging GIS Imaging GIS, a term used in the medical imaging community (Wang 2012), is adopted here to describe a geographic information system (GIS) that displays, enhances, and facilitates
Section 2 Image quality, radiometric analysis, preprocessing
 Section 2 Image quality, radiometric analysis, preprocessing Emmanuel Baltsavias Radiometric Quality (refers mostly to Ikonos) Preprocessing by Space Imaging (similar by other firms too): Modulation Transfer
MULTISPECTRAL CHANGE DETECTION AND INTERPRETATION USING SELECTIVE PRINCIPAL COMPONENTS AND THE TASSELED CAP TRANSFORMATION
 MULTSPECTRAL CHANGE DETECTON AND NTERPRETATON USNG SELECTVE PRNCPAL COMPONENTS AND THE TASSELED CAP TRANSFORMATON Abstract Temporal change is typically observed in all six reflective LANDSAT bands. The
Camera Requirements For Precision Agriculture
 Camera Requirements For Precision Agriculture Radiometric analysis such as NDVI requires careful acquisition and handling of the imagery to provide reliable values. In this guide, we explain how Pix4Dmapper
IMPROVEMENT IN THE DETECTION OF LAND COVER CLASSES USING THE WORLDVIEW-2 IMAGERY
 IMPROVEMENT IN THE DETECTION OF LAND COVER CLASSES USING THE WORLDVIEW-2 IMAGERY Ahmed Elsharkawy 1,2, Mohamed Elhabiby 1,3 & Naser El-Sheimy 1,4 1 Dept. of Geomatics Engineering, University of Calgary
An Efficient Color Image Segmentation using Edge Detection and Thresholding Methods
 19 An Efficient Color Image Segmentation using Edge Detection and Thresholding Methods T.Arunachalam* Post Graduate Student, P.G. Dept. of Computer Science, Govt Arts College, Melur - 625 106 Email-Arunac682@gmail.com
Crop and Irrigation Water Management Using High-resolution Airborne Remote Sensing
 Crop and Irrigation Water Management Using High-resolution Airborne Remote Sensing Christopher M. U. Neale and Hari Jayanthi Dept. of Biological and Irrigation Eng. Utah State University & James L.Wright
Atmospheric interactions; Aerial Photography; Imaging systems; Intro to Spectroscopy Week #3: September 12, 2018
 GEOL 1460/2461 Ramsey Introduction/Advanced Remote Sensing Fall, 2018 Atmospheric interactions; Aerial Photography; Imaging systems; Intro to Spectroscopy Week #3: September 12, 2018 I. Quick Review from
Hyperspectral Imagery: A New Tool For Wetlands Monitoring/Analyses
 WRP Technical Note WG-SW-2.3 ~- Hyperspectral Imagery: A New Tool For Wetlands Monitoring/Analyses PURPOSE: This technical note demribea the spectral and spatial characteristics of hyperspectral data and