ME 375. HW 7 Solutions. Original Homework Assigned 10/12, Due 10/19.
|
|
|
- Ernest Pierce
- 5 years ago
- Views:
Transcription
1 ME 375. HW 7 Solutions. Original Homework Assigned /2, Due /9. Problem. Palm 8.2 a-b Part (a). T (s) = 5 6s+2 = 5 2 3s+. Here τ = 3 and the multiplicative factor 5/2 shifts the magnitude curve up by 2log5/2 = 7.52dB. The magnitude plot looks like that in Figure 8..6, but shifted up by 7.5 db. Because < (5/2) = degrees, the phase curve is identical to that shown in Figure By hand, one should get plots like this for each part: For the whole transfer function response, by hand and in Matlab (sys82a=tf([5],[6 2]);bode(sys82a)), one gets the following:
2
3 9s 8s+4 = 2.25 s 2s+. Part (b). T (s) = Here τ = 2 and the multiplicative factor 9/2 shifts the m curve up by 2log9/2 = 3.64 db. The m plot looks like that in Figure 8..9, but shifted up by 3.64 db. Because < (9/2) = degrees the phase curve is identical to that shown in Figure By hand, one should get plots like this for each part: For the whole transfer function response, by hand and in Matlab (sys82b=tf([9 ],[8 4]);bode(sys82b)), one gets the following:
4
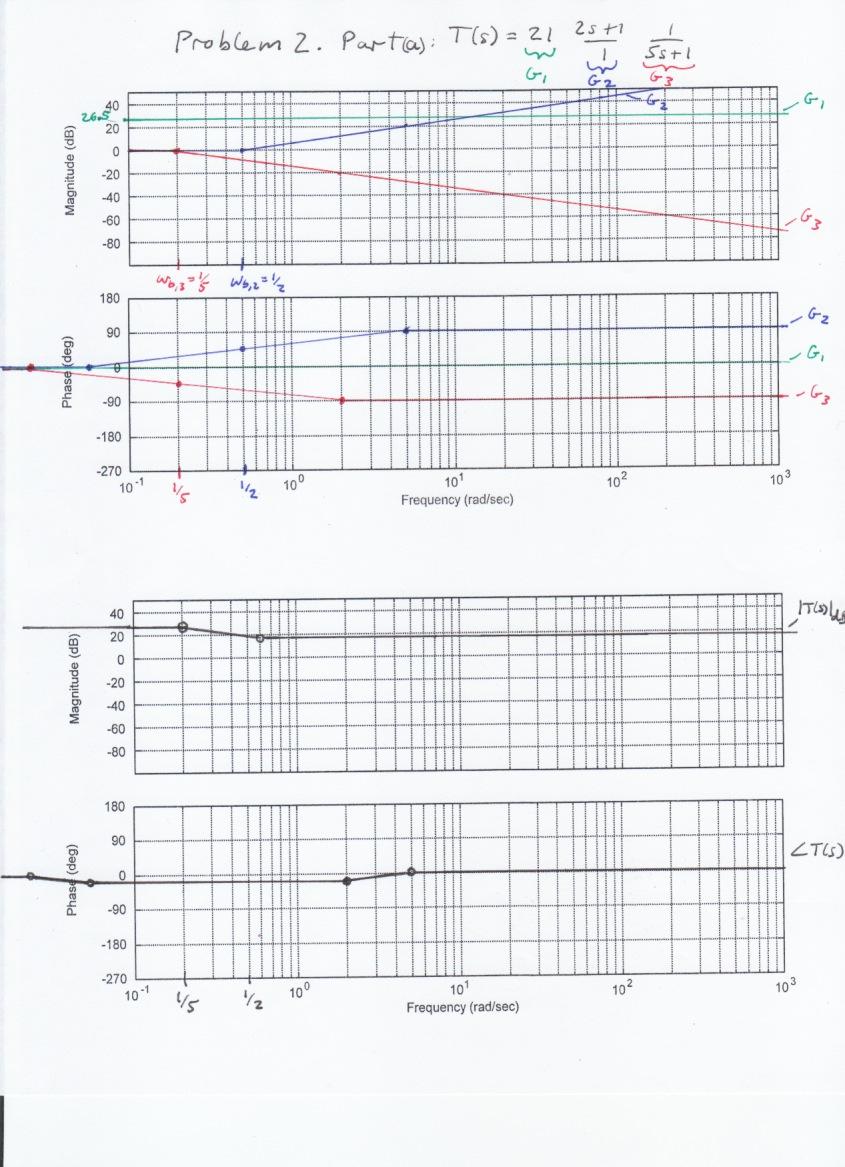
5 Problem 2. Part (a). First draw the approximate Bode plot of the following transfer function by hand (using asymptotic approximations): T (s) = 6(4s+7) (s+2) = 2 2s+ 5s+. Here τ = 2 and τ 2 = 5. The multiplicative factor 7/2 shifts the m curve up by 2log7/2 =.88 db. The magnitude plot looks like that in part (a) of Figure 8..2 (because τ < τ 2 ), but shifted up by.88 db. Note that Figure 8..2 applies to the case where K = in (8..3). Because < (7/2) = degrees, the phase curve is given by φ(ω) =< ( + 2ωj) < ( + 5ωj). At low frequencies, φ degrees but negative. At ω = /τ 2 = /5 and at ω = /τ = /2, φ = 23 degrees (this identical value is a coincidence because here τ = /τ 2 ). As ω inf, φ degrees through negative values. By hand, one should get plots like this for each part: For the whole transfer function response by hand should look like:
6 Part (b). Compute the Bode frequency response plot by numerically calculating and plotting the magnitude and phase response of the above transfer function. (Hint: try typing help bode and help tf at the Matlab prompt). In Matlab: sysp2b=tf([84 42],[ 2]);bode(sysp2b). One gets the following: Part (c). The transfer function from part (a) is modified, with the addition of a pole. Plot the Bode diagram by hand using the approximation method. What affect does this pole have on the previous curve? T (s) = 6(4s+7) (s+)(s+2) = 2 2s+ 5s+ s/+. Added to part (a) is a pole. This adds a breakpoint frequency at rad/s. It also changes the constant to 7/2. Other than a constant shift in the magnitude plot across all frequencies, this has no other effect below the breakpoint frequency of. Above that frequency, the magnitude plot from part (a) is changed such that the magnitude decreases by an additional 2 db/decade. The phase angle decreases by an additional 9 degrees above ω =. By hand, one should get plots like this for each part:
7 For the whole transfer function response by hand should look like: Part (d). Numerically compute the Bode frequency response plot of part (c) (Hint: try typing help bode and help tf at the Matlab prompt). In Matlab: sysp2d=tf([84 42],[ 2 2]);bode(sysp2d). One gets the following:
8
9
10
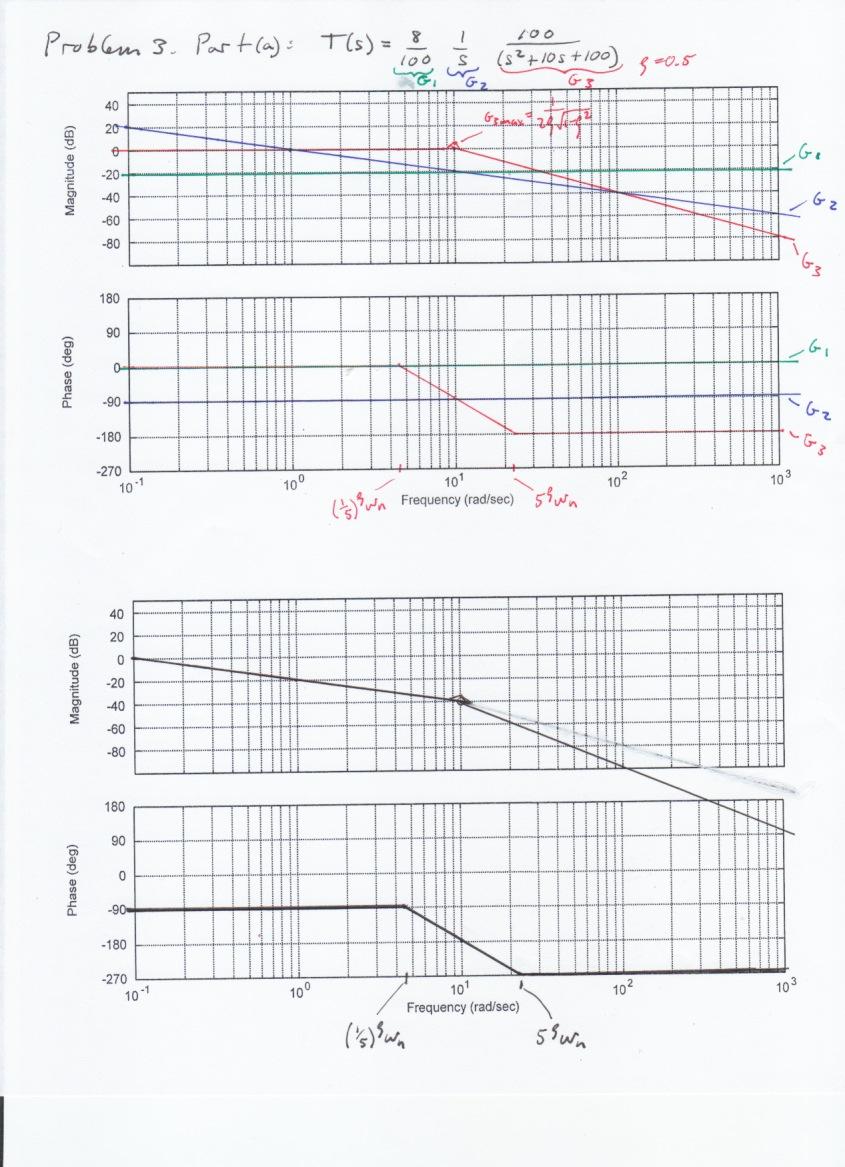
11 Problem 3. Part (a). First draw the approximate Bode plot of the following transfer function by hand (using asymptotic approximations): T (s) = 8 s(s 2 +s+) = 8 s (s 2 +s+). The second order complex poles term has a breakpoint frequency at the natural frequency ω n =, adding an additional decrease of 4 db/decade, and 8 degrees. The integrator term decreases at 2 db/decade. By hand, one should get plots like this for each part: For the whole transfer function response by hand should look like: Part (b). Compute the Bode frequency response plot by numerically calculating and plotting the magnitude and phase response of the above transfer function. (Hint: try typing help bode and help tf at the Matlab prompt).
12 In Matlab: sysp3b=tf([8],[ ]);bode(sysp3b). One gets the following:
13
Bode Plots. Hamid Roozbahani
 Bode Plots Hamid Roozbahani A Bode plot is a graph of the transfer function of a linear, time-invariant system versus frequency, plotted with a logfrequency axis, to show the system's frequency response.
ECE317 Homework 7. where
 ECE317 Homework 7 Problem 1: Consider a system with loop gain, T(s), given by: where T(s) = 300(1+s)(1+ s 40 ) 1) Determine whether the system is stable by finding the closed loop poles of the system using
Bode and Log Magnitude Plots
 Bode and Log Magnitude Plots Bode Magnitude and Phase Plots System Gain and Phase Margins & Bandwidths Polar Plot and Bode Diagrams Transfer Function from Bode Plots Bode Plots of Open Loop and Closed
, answer the next six questions.
 Frequency Response Problems Conceptual Questions 1) T/F Given f(t) = A cos (ωt + θ): The amplitude of the output in sinusoidal steady-state increases as K increases and decreases as ω increases. 2) T/F
University of Illinois at Chicago Spring ECE 412 Introduction to Filter Synthesis Homework #2 Solutions. Problem 1
 Problem 1 (a) Magnitude (impedance) scale the circuit so that all resistors are 1kΩ. Solution: Since all of the resistors in the circuit are 1Ω, we need to magnitude scale by k m = 1000; therefore, we
ME 5281 Fall Homework 8 Due: Wed. Nov. 4th; start of class.
 ME 5281 Fall 215 Homework 8 Due: Wed. Nov. 4th; start of class. Reading: Chapter 1 Part A: Warm Up Problems w/ Solutions (graded 4%): A.1 Non-Minimum Phase Consider the following variations of a system:
Exercise 8: Frequency Response
 Exercise 8: Frequency Response Introduction We can find the frequency response of a system by exciting the system with a sinusoidal signal of amplitude A and frequency ω [rad/s] (Note: ω = 2πf) and observing
EES42042 Fundamental of Control Systems Bode Plots
 EES42042 Fundamental of Control Systems Bode Plots DR. Ir. Wahidin Wahab M.Sc. Ir. Aries Subiantoro M.Sc. 2 Bode Plots Plot of db Gain and phase vs frequency It is assumed you know how to construct Bode
EE233 Autumn 2016 Electrical Engineering University of Washington. EE233 HW7 Solution. Nov. 16 th. Due Date: Nov. 23 rd
 EE233 HW7 Solution Nov. 16 th Due Date: Nov. 23 rd 1. Use a 500nF capacitor to design a low pass passive filter with a cutoff frequency of 50 krad/s. (a) Specify the cutoff frequency in hertz. fc c 50000
Rotary Motion Servo Plant: SRV02. Rotary Experiment #03: Speed Control. SRV02 Speed Control using QuaRC. Student Manual
 Rotary Motion Servo Plant: SRV02 Rotary Experiment #03: Speed Control SRV02 Speed Control using QuaRC Student Manual Table of Contents 1. INTRODUCTION...1 2. PREREQUISITES...1 3. OVERVIEW OF FILES...2
Homework Assignment 10
 Homework Assignment 10 Question The amplifier below has infinite input resistance, zero output resistance and an openloop gain. If, find the value of the feedback factor as well as so that the closed-loop
Homework Assignment 04
 Question 1 (Short Takes) Homework Assignment 04 1. Consider the single-supply op-amp amplifier shown. What is the purpose of R 3? (1 point) Answer: This compensates for the op-amp s input bias current.
Homework Assignment 13
 Question 1 Short Takes 2 points each. Homework Assignment 13 1. Classify the type of feedback uses in the circuit below (i.e., shunt-shunt, series-shunt, ) Answer: Series-shunt. 2. True or false: an engineer
TUTORIAL 9 OPEN AND CLOSED LOOP LINKS. On completion of this tutorial, you should be able to do the following.
 TUTORIAL 9 OPEN AND CLOSED LOOP LINKS This tutorial is of interest to any student studying control systems and in particular the EC module D7 Control System Engineering. On completion of this tutorial,
Outline. Digital Control. Lecture 3
 Outline Outline Outline 1 ler Design 2 What have we talked about in MM2? Sampling rate selection Equivalents between continuous & digital Systems Outline ler Design Emulation Method for 1 ler Design
Homework Assignment 06
 Question 1 (2 points each unless noted otherwise) Homework Assignment 06 1. True or false: when transforming a circuit s diagram to a diagram of its small-signal model, we replace dc constant current sources
Bode Plot for Controller Design
 Bode Plot for Controller Design Dr. Bishakh Bhattacharya Professor, Department of Mechanical Engineering IIT Kanpur Joint Initiative of IITs and IISc - Funded by This Lecture Contains Bode Plot for Controller
Lecture 7:Examples using compensators
 Lecture :Examples using compensators Venkata Sonti Department of Mechanical Engineering Indian Institute of Science Bangalore, India, This draft: March, 8 Example :Spring Mass Damper with step input Consider
R. W. Erickson. Department of Electrical, Computer, and Energy Engineering University of Colorado, Boulder
 R. W. Erickson Department o Electrical, Computer, and Energy Engineering University o Colorado, Boulder Computation ohase! T 60 db 40 db 20 db 0 db 20 db 40 db T T 1 Crossover requency c 1 Hz 10 Hz 100
FREQUENCY RESPONSE AND PASSIVE FILTERS LABORATORY
 FREQUENCY RESPONSE AND PASSIVE FILTERS LABORATORY In this experiment we will analytically determine and measure the frequency response of networks containing resistors, AC source/sources, and energy storage
2.161 Signal Processing: Continuous and Discrete
 MIT OpenCourseWare http://ocw.mit.edu 2.6 Signal Processing: Continuous and Discrete Fall 28 For information about citing these materials or our Terms of Use, visit: http://ocw.mit.edu/terms. MASSACHUSETTS
Open Loop Frequency Response
 TAKE HOME LABS OKLAHOMA STATE UNIVERSITY Open Loop Frequency Response by Carion Pelton 1 OBJECTIVE This experiment will reinforce your understanding of the concept of frequency response. As part of the
MAE143A Signals & Systems - Homework 8, Winter 2013 due by the end of class Tuesday March 5, 2013.
 MAE43A Signals & Systems - Homework 8, Winter 3 due by the end of class uesday March 5, 3. Question Measuring frequency responses Before we begin to measure frequency responses, we need a little theory...
Fall Music 320A Homework #2 Sinusoids, Complex Sinusoids 145 points Theory and Lab Problems Due Thursday 10/11/2018 before class
 Fall 2018 2019 Music 320A Homework #2 Sinusoids, Complex Sinusoids 145 points Theory and Lab Problems Due Thursday 10/11/2018 before class Theory Problems 1. 15 pts) [Sinusoids] Define xt) as xt) = 2sin
Bode plot, named after Hendrik Wade Bode, is usually a combination of a Bode magnitude plot and Bode phase plot:
 Bode plot From Wikipedia, the free encyclopedia A The Bode plot for a first-order (one-pole) lowpass filter Bode plot, named after Hendrik Wade Bode, is usually a combination of a Bode magnitude plot and
Homework Assignment 11
 Homework Assignment 11 Question 1 (Short Takes) Two points each unless otherwise indicated. 1. What is the 3-dB bandwidth of the amplifier shown below if r π = 2.5K, r o = 100K, g m = 40 ms, and C L =
EE152 F13 Midterm 1. Before starting, please check to make sure that you have all 6 pages Total 100. V0.
 EE152 F13 Midterm 1 Name: (please print) Solution In recognition of and in the spirit of the Stanford University Honor Code, I certify that I will neither give nor receive unpermitted aid on this exam.
(A) Based on the second-order FRF provided, determine appropriate values for ω n, ζ, and K. ω n =500 rad/s; ζ=0.1; K=0.
 Based on the second-order FRF provided, determine appropriate values for ω n, ζ, and K. ω n =500 rad/s; ζ=0.1; K=0.") ME35 Homework # Due: 1/1/1 Problem #1 (3%) A co-worker brings you an accelerometer spec sheet with the following frequency response function (FRF):. s G accelerometer = [volt +.1 jω.1 ω m ] (A) Based on
ME35 Homework # Due: 1/1/1 Problem #1 (3%) A co-worker brings you an accelerometer spec sheet with the following frequency response function (FRF):. s G accelerometer = [volt +.1 jω.1 ω m ] (A) Based on
The above figure represents a two stage circuit. Recall, the transfer function relates. Vout
 LABORATORY 12: Bode plots/second Order Filters Material covered: Multistage circuits Bode plots Design problem Overview Notes: Two stage circuits: Vin1 H1(s) Vout1 Vin2 H2(s) Vout2 The above figure represents
EEL2216 Control Theory CT2: Frequency Response Analysis
 EEL2216 Control Theory CT2: Frequency Response Analysis 1. Objectives (i) To analyse the frequency response of a system using Bode plot. (ii) To design a suitable controller to meet frequency domain and
Homework Assignment 03 Solution
 Homework Assignment 03 Solution Question 1 Determine the h 11 and h 21 parameters for the circuit. Be sure to supply the units and proper sign for each parameter. (8 points) Solution Setting v 2 = 0 h
Chapter 3, Sections Electrical Filters
 Chapter 3, Sections 3.2.4-3.2.5 Electrical Filters Signals DC and AC Components - Many signals can be constructed as sums of AC and DC components: 2.5 2 1.5 2 1.5 1.5 1 2 3 4 1.5 -.5-1 1 2 3 4 = + 2.5
Designing Information Devices and Systems II Fall 2018 Elad Alon and Miki Lustig Homework 4
 EECS 16B Designing Information Devices and Systems II Fall 2018 Elad Alon and Miki Lustig Homework 4 This homework is solely for your own practice. However, everything on it is in scope for midterm 1,
Advanced Measurements
 Albaha University Faculty of Engineering Mechanical Engineering Department Lecture 9: Wheatstone Bridge and Filters Ossama Abouelatta o_abouelatta@yahoo.com Mechanical Engineering Department Faculty of
UNIVERSITY OF NORTH CAROLINA AT CHARLOTTE Department of Electrical and Computer Engineering
 UNIVERSITY OF NORTH CAROLINA AT CHARLOTTE Department of Electrical and Computer Engineering EXPERIMENT 8 FILTER NETWORKS OBJECTIVES In this lab session the student will investigate passive low-pass and
Course Outline. Time vs. Freq. Domain Analysis. Frequency Response. Amme 3500 : System Dynamics & Control. Design via Frequency Response
 Course Outline Amme 35 : System Dynamics & Control Design via Frequency Response Week Date Content Assignment Notes Mar Introduction 2 8 Mar Frequency Domain Modelling 3 5 Mar Transient Performance and
EE Experiment 8 Bode Plots of Frequency Response
 EE16:Exp8-1 EE 16 - Experiment 8 Bode Plots of Frequency Response Objectives: To illustrate the relationship between a system frequency response and the frequency response break frequencies, factor powers,
Homework Assignment 13
 Question 1 Short Takes 2 points each. Homework Assignment 13 1. Classify the type of feedback uses in the circuit below (i.e., shunt-shunt, series-shunt, ) 2. True or false: an engineer uses series-shunt
Lecture 16 Date: Frequency Response (Contd.)
") Lecture 16 Date: 03.10.2017 Frequency Response (Contd.) Bode Plot (contd.) Bode Plot (contd.) Bode Plot (contd.) not every transfer function has all seven factors. To sketch the Bode plots for a generic
Lecture 16 Date: 03.10.2017 Frequency Response (Contd.) Bode Plot (contd.) Bode Plot (contd.) Bode Plot (contd.) not every transfer function has all seven factors. To sketch the Bode plots for a generic
ECE3040 Assignment9. 1. The figures show inverting amplifier circuits.
 ECE3040 Assignment9 1. The figures show inverting amplifier circuits. (a) For the circuit of Fig. (a), specify R 1, R F,andR O for a voltage gain of 50, an input resistance of 2kΩ, and an output resistance
EE422G Solution to Homework #8
 EE4G Solution to Homework #8. MATLAB >> H = tf([ 4],[ 6 6]); >> H = tf([ ],[ - 5 5 4]); >> step(h).7 Step Response.6.5 Amplitude.4... 4 5 6 >> step(h) Time (sec).5 Step Response.5 Amplitude.5.5.5..5..5..5.4.45
Microelectronic Circuits II. Ch 9 : Feedback
 Microelectronic Circuits II Ch 9 : Feedback 9.9 Determining the Loop Gain 9.0 The Stability problem 9. Effect on Feedback on the Amplifier Poles 9.2 Stability study using Bode plots 9.3 Frequency Compensation
Homework Assignment 03
 Homework Assignment 03 Question 1 (Short Takes), 2 points each unless otherwise noted. 1. Two 0.68 μf capacitors are connected in series across a 10 khz sine wave signal source. The total capacitive reactance
SIMULATIONS OF LCC RESONANT CIRCUIT POWER ELECTRONICS COLORADO STATE UNIVERSITY. Modified in Spring 2006
 SIMULATIONS OF LCC RESONANT CIRCUIT POWER ELECTRONICS COLORADO STATE UNIVERSITY Modified in Spring 2006 Page 1 of 27 PURPOSE: The purpose of this lab is to simulate the LCC circuit using MATLAB and CAPTURE
NPTEL Online Course: Control Engineering
 NPTEL Online Course: Control Engineering Dr. Ramkrishna Pasumarthy and Dr.Viswanath Assignment - 0 : s. A passive band pass filter with is one which: (a) Attenuates signals between the two cut-off frequencies
SECTION 7: FREQUENCY DOMAIN ANALYSIS. MAE 3401 Modeling and Simulation
 SECTION 7: FREQUENCY DOMAIN ANALYSIS MAE 3401 Modeling and Simulation 2 Response to Sinusoidal Inputs Frequency Domain Analysis Introduction 3 We ve looked at system impulse and step responses Also interested
Use of the LTI Viewer and MUX Block in Simulink
 Use of the LTI Viewer and MUX Block in Simulink INTRODUCTION The Input-Output ports in Simulink can be used in a model to access the LTI Viewer. This enables the user to display information about the magnitude
Cleveland State University MCE441: Intr. Linear Control Systems. Lecture 12: Frequency Response Concepts Bode Diagrams. Prof.
 Cleveland State University MCE441: Intr. Linear Control Systems Lecture 12: Concepts Bode Diagrams Prof. Richter 1 / 2 Control systems are affected by signals which are often unpredictable: noise, disturbances,
Massachusetts Institute of Technology Department of Electrical Engineering and Computer Science Circuits & Electronics Spring 2006
 Massachusetts Institute of Technology Department of Electrical Engineering and omputer Science 6.002 ircuits & Electronics Spring 2006 Problem Set #9 Issued 4/12/06 Due 4/19/06 Exercise 9.1: Determine
Homework Assignment 06
 Homework Assignment 06 Question 1 (Short Takes) One point each unless otherwise indicated. 1. Consider the current mirror below, and neglect base currents. What is? Answer: 2. In the current mirrors below,
Dr Ian R. Manchester
 Week Content Notes 1 Introduction 2 Frequency Domain Modelling 3 Transient Performance and the s-plane 4 Block Diagrams 5 Feedback System Characteristics Assign 1 Due 6 Root Locus 7 Root Locus 2 Assign
(b) 25% (b) increases
 25% (b) increases") Homework Assignment 07 Question 1 (2 points each unless noted otherwise) 1. In the circuit 10 V, 10, and 5K. What current flows through? Answer: By op-amp action the voltage across is and the current through
Homework Assignment 07 Question 1 (2 points each unless noted otherwise) 1. In the circuit 10 V, 10, and 5K. What current flows through? Answer: By op-amp action the voltage across is and the current through
ITT Technical Institute ET245 Devices II Unit 5 Chapter
 ITT Technical Institute ET245 Devices II Unit 5 Chapter 7.1 7.3 Unit 5 Agenda Lecture: Chapter 7, Sections 7.1 7.3 Lab 3, Linear Op amp Circuits continued from last week Assignment: Complete Problems (pg
Figure E2-1 The complete circuit showing the oscilloscope and Bode plotter.
 Example 2 An RC network using the oscilloscope and Bode plotter In this example we use the oscilloscope and the Bode plotter in an RC circuit that has an AC source. The circuit which we will construct
EE 482 : CONTROL SYSTEMS Lab Manual
 University of Bahrain College of Engineering Dept. of Electrical and Electronics Engineering EE 482 : CONTROL SYSTEMS Lab Manual Dr. Ebrahim Al-Gallaf Assistance Professor of Intelligent Control and Robotics
Homework Assignment 12
 Homework Assignment 12 Question 1 Shown the is Bode plot of the magnitude of the gain transfer function of a constant GBP amplifier. By how much will the amplifier delay a sine wave with the following
Designing PID controllers with Matlab using frequency response methodology
 Designing PID controllers with Matlab using frequency response methodology by Frank Owen, PhD, PE polyxengineering, Inc. San Luis Obispo, California 16 March 2017 (www.polyxengineering.com) This paper
Designing Information Devices and Systems II Fall 2018 Elad Alon and Miki Lustig Homework 4
 EECS 6B Designing Information Devices and Systems II Fall 208 Elad Alon and Miki Lustig Homework 4 This homework is solely for your own practice. However, everything on it is in scope for midterm, and
MCE441/541 Midterm Project Position Control of Rotary Servomechanism
 MCE441/541 Midterm Project Position Control of Rotary Servomechanism DUE: 11/08/2011 This project counts both as Homework 4 and 50 points of the second midterm exam 1 System Description A servomechanism
Lab Report 4: Root Locus and Proportional Controller
 Lab Report 4: Root Locus and Proportional Controller University of Tennessee at Chattanooga Engineering 32 Blue Team Kevin Schrumpf Justin Anchanattu Justin Rehagen April 1, 212 Introduction The first
VCC. Digital 16 Frequency Divider Digital-to-Analog Converter Butterworth Active Filter Sample-and-Hold Amplifier (part 2) Last Update: 03/19/14
 Last Update: 03/19/14") Digital 16 Frequency Divider Digital-to-Analog Converter Butterworth Active Filter Sample-and-Hold Amplifier (part 2) ECE3204 Lab 5 Objective The purpose of this lab is to design and test an active Butterworth
Digital 16 Frequency Divider Digital-to-Analog Converter Butterworth Active Filter Sample-and-Hold Amplifier (part 2) ECE3204 Lab 5 Objective The purpose of this lab is to design and test an active Butterworth
Filter Design, Active Filters & Review. EGR 220, Chapter 14.7, December 14, 2017
 Filter Design, Active Filters & Review EGR 220, Chapter 14.7, 14.11 December 14, 2017 Overview ² Passive filters (no op amps) ² Design examples ² Active filters (use op amps) ² Course review 2 Example:
AC BEHAVIOR OF COMPONENTS
 AC BEHAVIOR OF COMPONENTS AC Behavior of Capacitor Consider a capacitor driven by a sine wave voltage: I(t) 2 1 U(t) ~ C 0-1 -2 0 2 4 6 The current: is shifted by 90 o (sin cos)! 1.0 0.5 0.0-0.5-1.0 0
University of Michigan EECS 311: Electronic Circuits Fall 2009 LAB 2 NON IDEAL OPAMPS
 University of Michigan EECS 311: Electronic Circuits Fall 2009 LAB 2 NON IDEAL OPAMPS Issued 10/5/2008 Pre Lab Completed 10/12/2008 Lab Due in Lecture 10/21/2008 Introduction In this lab you will characterize
LESSON 21: METHODS OF SYSTEM ANALYSIS
 ET 438a Automatic Control Systems Technology LESSON 21: METHODS OF SYSTEM ANALYSIS 1 LEARNING OBJECTIVES After this presentation you will be able to: Compute the value of transfer function for given frequencies.
v(t) = V p sin(2π ft +φ) = V p cos(2π ft +φ + π 2 )
 = V p sin(2π ft +φ) = V p cos(2π ft +φ + π 2 )") 1 Let us revisit sine and cosine waves. A sine wave can be completely defined with three parameters Vp, the peak voltage (or amplitude), its frequency w in radians/second or f in cycles/second (Hz), and
1 Let us revisit sine and cosine waves. A sine wave can be completely defined with three parameters Vp, the peak voltage (or amplitude), its frequency w in radians/second or f in cycles/second (Hz), and
Filters and Tuned Amplifiers
 CHAPTER 6 Filters and Tuned Amplifiers Introduction 55 6. Filter Transmission, Types, and Specification 56 6. The Filter Transfer Function 60 6.7 Second-Order Active Filters Based on the Two-Integrator-Loop
Study of Analog Phase-Locked Loop (APLL)
") Laboratory Exercise 9. (Last updated: 18/1/013, Tamás Krébesz) Study of Analog Phase-Locked Loop (APLL) Required knowledge Operation principle of analog phase-locked-loop (APLL) Operation principle of
Laboratory Exercise 9. (Last updated: 18/1/013, Tamás Krébesz) Study of Analog Phase-Locked Loop (APLL) Required knowledge Operation principle of analog phase-locked-loop (APLL) Operation principle of
Microelectronic Circuits - Fifth Edition Sedra/Smith Copyright 2004 by Oxford University Press, Inc.
 Feedback 1 Figure 8.1 General structure of the feedback amplifier. This is a signal-flow diagram, and the quantities x represent either voltage or current signals. 2 Figure E8.1 3 Figure 8.2 Illustrating
Mechatronics. Analog and Digital Electronics: Studio Exercises 1 & 2
 Mechatronics Analog and Digital Electronics: Studio Exercises 1 & 2 There is an electronics revolution taking place in the industrialized world. Electronics pervades all activities. Perhaps the most important
University of Michigan EECS 311: Electronic Circuits Fall 2008 LAB 2 ACTIVE FILTERS
 University of Michigan EECS 311: Electronic Circuits Fall 2008 LAB 2 ACTIVE FILTERS Issued 9/22/2008 Pre Lab Completed 9/29/2008 Lab Due in Lecture 10/6/2008 Introduction In this lab you will design a
Frequency Response Analysis and Design Tutorial
 1 of 13 1/11/2011 5:43 PM Frequency Response Analysis and Design Tutorial I. Bode plots [ Gain and phase margin Bandwidth frequency Closed loop response ] II. The Nyquist diagram [ Closed loop stability
and using the step routine on the closed loop system shows the step response to be less than the maximum allowed 20%.
 Phase (deg); Magnitude (db) 385 Bode Diagrams 8 Gm = Inf, Pm=59.479 deg. (at 62.445 rad/sec) 6 4 2-2 -4-6 -8-1 -12-14 -16-18 1-1 1 1 1 1 2 1 3 and using the step routine on the closed loop system shows
CHAPTER 6 Frequency Response, Bode. Plots, and Resonance
 CHAPTER 6 Frequency Response, Bode Plots, and Resonance CHAPTER 6 Frequency Response, Bode Plots, and Resonance 1. State the fundamental concepts of Fourier analysis. 2. Determine the output of a filter
BJT & FET Frequency Response
 Chapter 4 BJT & FET Spring 2012 4 th Semester Mechatronics SZABIST, Karachi 2 Course Support humera.rafique@szabist.edu.pk Office: 100 Campus (404) Official: ZABdesk Subsidiary: https://sites.google.com/site/zabistmechatronics/home/spring-2012/ecd
EK307 Active Filters and Steady State Frequency Response
 EK307 Active Filters and Steady State Frequency Response Laboratory Goal: To explore the properties of active signal-processing filters Learning Objectives: Active Filters, Op-Amp Filters, Bode plots Suggested
Pole, zero and Bode plot
 Pole, zero and Bode plot EC04 305 Lecture notes YESAREKEY December 12, 2007 Authored by: Ramesh.K Pole, zero and Bode plot EC04 305 Lecture notes A rational transfer function H (S) can be expressed as
SIMULATION OF A SERIES RESONANT CIRCUIT ECE562: Power Electronics I COLORADO STATE UNIVERSITY. Modified in Fall 2011
 SIMULATION OF A SERIES RESONANT CIRCUIT ECE562: Power Electronics I COLORADO STATE UNIVERSITY Modified in Fall 2011 ECE 562 Series Resonant Circuit (NL5 Simulation) Page 1 PURPOSE: The purpose of this
Chapter 19. Basic Filters
 Chapter 19 Basic Filters Objectives Analyze the operation of RC and RL lowpass filters Analyze the operation of RC and RL highpass filters Analyze the operation of band-pass filters Analyze the operation
Build Your Own Bose WaveRadio Bass Preamp Active Filter Design
 EE230 Filter Laboratory Build Your Own Bose WaveRadio Bass Preamp Active Filter Design Objectives 1) Design an active filter on paper to meet a particular specification 2) Verify your design using Spice
Advanced Circuits Topics Part 2 by Dr. Colton (Fall 2017)
") Part 2: Some Possibly New Things Advanced Circuits Topics Part 2 by Dr. Colton (Fall 2017) These are some topics that you may or may not have learned in Physics 220 and/or 145. This handout continues where
Part 2: Some Possibly New Things Advanced Circuits Topics Part 2 by Dr. Colton (Fall 2017) These are some topics that you may or may not have learned in Physics 220 and/or 145. This handout continues where
ECE 203 LAB 2 PRACTICAL FILTER DESIGN & IMPLEMENTATION
 Version 1. 1 of 7 ECE 03 LAB PRACTICAL FILTER DESIGN & IMPLEMENTATION BEFORE YOU BEGIN PREREQUISITE LABS ECE 01 Labs ECE 0 Advanced MATLAB ECE 03 MATLAB Signals & Systems EXPECTED KNOWLEDGE Understanding
Motomatic via Bode by Frank Owen, PhD, PE Mechanical Engineering Department California Polytechnic State University San Luis Obispo
 Motomatic via Bode by Frank Owen, PhD, PE Mechanical Engineering Department California Polytechnic State University San Luis Obispo The purpose of this lecture is to show how to design a controller for
Lab 6: Building a Function Generator
 ECE 212 Spring 2010 Circuit Analysis II Names: Lab 6: Building a Function Generator Objectives In this lab exercise you will build a function generator capable of generating square, triangle, and sine
RC Circuit Activity. Retrieve a power cord and a voltage sensor from the wire rack hanging on the wall in the lab room.
 Purpose RC Circuit Activity Using an RC circuit, students will determine time constants by varying the resistance of the circuit and analyzing the exponential decay. After determining several time constants,
GE420 Laboratory Assignment 8 Positioning Control of a Motor Using PD, PID, and Hybrid Control
 GE420 Laboratory Assignment 8 Positioning Control of a Motor Using PD, PID, and Hybrid Control Goals for this Lab Assignment: 1. Design a PD discrete control algorithm to allow the closed-loop combination
Kent Bertilsson Muhammad Amir Yousaf
 Today s topics Analog System (Rev) Frequency Domain Signals in Frequency domain Frequency analysis of signals and systems Transfer Function Basic elements: R, C, L Filters RC Filters jw method (Complex
Simulating Circuits James Lamberti 5/4/2014
 Simulating Circuits James Lamberti (jal416@lehigh.edu) 5/4/2014 There are many simulation and design platforms for circuits. The two big ones are Altium and Cadence. This tutorial will focus on Altium,
Lecture 8 ECEN 4517/5517
 Lecture 8 ECEN 4517/5517 Experiment 4 Lecture 7: Step-up dcdc converter and PWM chip Lecture 8: Design of analog feedback loop Part I Controller IC: Demonstrate operating PWM controller IC (UC 3525) Part
Lab S-3: Beamforming with Phasors. N r k. is the time shift applied to r k
 DSP First, 2e Signal Processing First Lab S-3: Beamforming with Phasors Pre-Lab: Read the Pre-Lab and do all the exercises in the Pre-Lab section prior to attending lab. Verification: The Exercise section
4 Experiment 4: DC Motor Voltage to Speed Transfer Function Estimation by Step Response and Frequency Response (Part 2)
") 4 Experiment 4: DC Motor Voltage to Speed Transfer Function Estimation by Step Response and Frequency Response (Part 2) 4.1 Introduction This lab introduces new methods for estimating the transfer function
4 Experiment 4: DC Motor Voltage to Speed Transfer Function Estimation by Step Response and Frequency Response (Part 2) 4.1 Introduction This lab introduces new methods for estimating the transfer function
Lecture 48 Review of Feedback HW # 4 Erickson Problems Ch. 9 # s 7 &9 and questions in lectures I. Review of Negative Feedback
 Lecture 48 Review of Feedback HW # 4 Erickson Problems Ch. 9 # s 7 &9 and questions in lectures I. Review of Negative Feedback A. General. Overview 2. Summary of Advantages 3. Disadvantages B. Buck Converter
Välkomna till TSRT15 Reglerteknik Föreläsning 5. Summary of lecture 4 Frequency response Bode plot
 Välkomna till TSRT15 Reglerteknik Föreläsning 5 Summary of lecture 4 Frequency response Bode plot Summary of last lecture 2 Given a pole polynomial with a varying parameter P(s)+KQ(s)=0 We draw the location
The hardest MC questions in optics. A guide for the perplexed
 The hardest MC questions in optics. A guide for the perplexed PHYSICS 123 Exam 3 Spring 2011 Instr: David D. Allred CID# The first part of the exam is multiple choice. Choose the best answer. After that
Electronics basics for MEMS and Microsensors course
 Electronics basics for course, a.a. 2017/2018, M.Sc. in Electronics Engineering Transfer function 2 X(s) T(s) Y(s) T S = Y s X(s) The transfer function of a linear time-invariant (LTI) system is the function
Excelsior Audio Design & Services, llc
 Charlie Hughes August 1, 2007 Phase Response & Receive Delay When measuring loudspeaker systems the question of phase response often arises. I thought it might be informative to review setting the receive
Physics 116A Notes Fall 2004
 Physics 116A Notes Fall 2004 David E. Pellett Draft v.0.9 beta Notes Copyright 2004 David E. Pellett unless stated otherwise. References: Text for course: Fundamentals of Electrical Engineering, second
Boise State University Department of Electrical and Computer Engineering ECE 212L Circuit Analysis and Design Lab
 Objectives Boise State University Department of Electrical and Computer Engineering ECE L Circuit Analysis and Design Lab Experiment #0: Frequency esponse Measurements The objectives of this laboratory
ELE.B: Original Assignment Resistors in Series Classwork Homework
 ELE.B: Original Assignment Resistors in Series Classwork 1. A 3 Ω resistor is connected in series to a 6 Ω resistor and a 12-V battery. What is the current in each of the resistors? What is the voltage
Low Pass Filter Introduction
 Low Pass Filter Introduction Basically, an electrical filter is a circuit that can be designed to modify, reshape or reject all unwanted frequencies of an electrical signal and accept or pass only those