Chapter 3. Data Acquisition Systems. Ayman F. Habib. Remote Sensing
|
|
|
- Charles Hall
- 5 years ago
- Views:
Transcription
1 Chapter 3 Data Acquisition Systems 1
2 Overview Utilized portions of the electro-magnetic radiation. Visible band. Infrared band. LIDAR systems. Microwave band (RADAR). Optical sensors (scanning operational principles): Frame imaging systems. Linear array scanners. Push-broom scanners. Panoramic linear array scanners. Electro-mechanical scanners. 2
3 Overview LIDAR operational principles. RADAR operational principles. Discussion items: Stereo-coverage for 3-D restitution. Processing of B/W & color films. Satellite orbits. Earth observing satellites. Using spectral information for recognition and classification purposes. 3
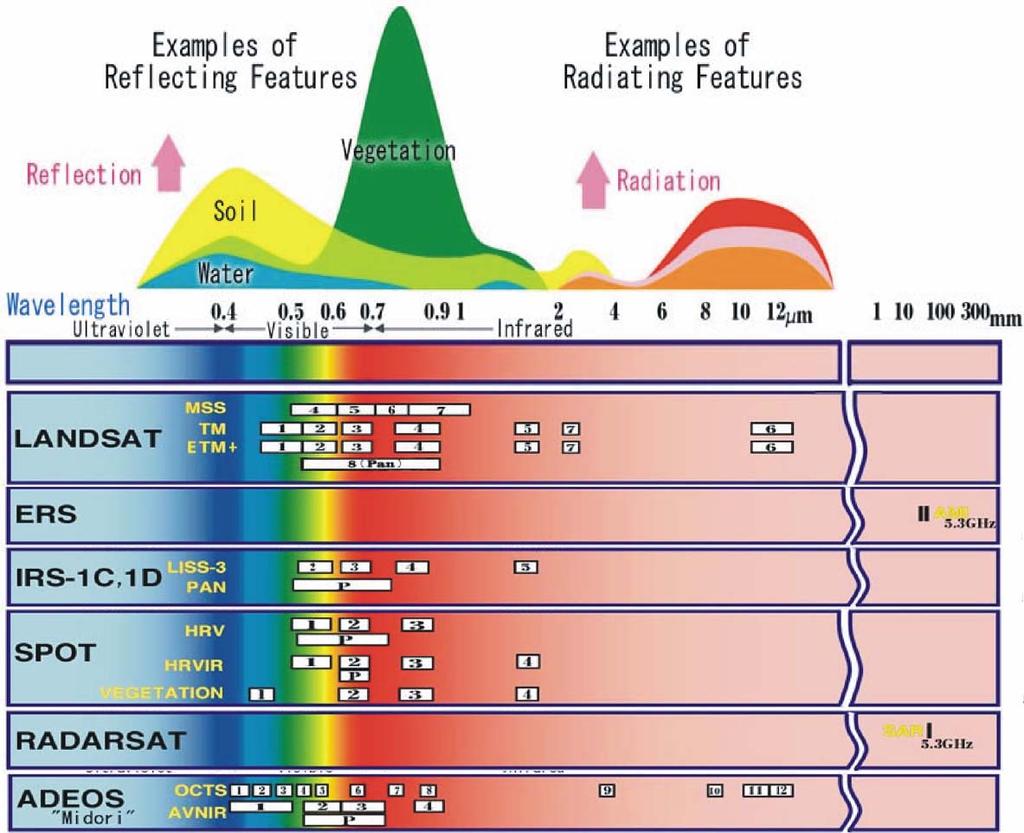
4 Systems Utilized Portions of the EM-Spectrum 4
")
5 EM Radiation (Wavebands) 5

6 6 Visible Sensors


7 Sensors Operating in the Visible Band RC 30 DMC TM 7 ADS 40

8 8 Infrared Band


9 Thermal Imaging EZ THERM Loose Connection in Breaker Box 9
10 LIDAR Systems Laser wavelength nm Typical values nm 10

11 LIDAR ALS 40 11

12 12 Microwave Sensors

13 RADAR Black bulge under fuselage covers the radar antenna 13
14 Active and Passive Imaging Systems 14
")
15 EM Radiation (Wavebands) 15
16 Sun/Earth Radiation 16


17 Visible & LIDAR Range Imagery 17

18 LIDAR Range & Visible Imagery 18


19 Visible & LIDAR Intensity Imagery 19
")

20 Visible & Thermal (Far-Infrared) Imagery True Color Image Thermal Image 20

21 RADAR & Visible Imagery 21
22 Optical Sensors Operational Principles 22
23 Photographic Film Sensitized Emulsion Base Anti-halation Layer 23
24 Emulsion: Photographic Film Micro-thin layer of gelatin in which light-sensitive ingredients (silver bromide crystals) are suspended. Base: Transparent flexible sheet on which light sensitive emulsion is coated. Anti-halation layer: Prevents transmitted light through the base from reflecting back towards the emulsion. 24
25 Black and white Films Negative film: Bright areas in the object space appear dark and dark areas appear bright. Directions are inverted. Inverse film (diapositive): Bright areas in the object space appear bright and dark areas appear dark. Image and object space directions are compatible. 25
26 Processing of Black and White Negative Film development process: Silver speckle crystals with speckle reduced to silver other crystals washed out emulsion Base A.H.L. 26
27 Processing of Black and White Negative Film Exposure of film to light Latent image. Latent Image: The bond between the silver and the bromide is broken. Development of latent image: The silver (in the affected crystals) is separated from the bromide. We get rid of the bromide. Fixing: We get rid of the unaffected crystals. They are converted into salt which can be dissolved into water and released. 27
28 Negative Film Development Bright Intermediate Dark Scene Brightness Unexposed Film Latent Image After Developing Uniform White Light After Fixing Dark Intermediate Bright 28
29 Processing of Black and White Positive Film Exposure of film to light Latent image. Latent Image: The bond between the silver and the bromide is broken. Pre-development (bleaching) of latent image: The affected silver bromide crystals are released. Only, unexposed silver bromide crystals remain. Exposing the film to uniform white light, development and Fixing: The film is uniformly exposed to white light. This is followed by development (where we get rid of the bromide) and fixing stages. 29
30 Development of Reversal (Positive) B/W Film Bright Intermediate Dark Scene Brightness Unexposed Film Latent Image Uniform White Light Pre-development Uniform White Light Development & Fixing Bright Intermediate Dark 30
31 Primary Colors: Nature of Color Colors that can not be derived from other colors. Red, Green and Blue. Red+ Green + Blue White. Green + Blue Cyan. Red+ Green Yellow. Red+ Blue Magenta. Cyan subtracts Red (passes Green and Blue). Yellow subtracts Blue (passes Red and Green). Magentasubtracts Green (passes Red and Blue). Cyan + Yellow + Magenta Black. 31
32 Color Film Blue Sensitive Yellow Filter Green & Blue Sensitive Anti-halation layer Red & Blue Sensitive Base 32
33 Development of Color Negative Film Exposure of film to light Latent image. Latent Image: The bond between the silver and the bromide is broken. Development of latent image: The silver (in the affected crystals) is separated from the bromide. We get rid of the bromide. Only metallic silver and unexposed crystals remain. Fixing and Dying: We get rid of the unaffected crystals and the yellow filter. The silver crystals are dyed with complementary color. 33
34 Processing of Color Negative Film Blue Green Red White Cyan Magenta Yellow Scene Brightness Blue Sensitive Green Sensitive Red Sensitive Blue Sensitive Green Sensitive Red Sensitive Latent Image Blue Sensitive Green Sensitive Red Sensitive Developed Latent Image 34
35 Processing of Color Negative Film Blue Sensitive Green Sensitive Red Sensitive After Fixing Uniform White Light Yellow Dye Magenta Dye Cyan Dye After Dying Yellow Magenta Cyan Black Red Green Blue Blue Green Red White Cyan Magenta Yellow Negative Color Scene Brightness 35
36 Development of Color Positive Film Exposure of film to light Latent image. Latent Image: The bond between the silver and the bromide is broken. Pre-development of latent image: We get rid of the exposed grains. Expose the film to uniform white light. Film Development, Fixing and Dying: We get rid of the bromide and the yellow filter. The silver crystals are dyed with complementary color. 36
37 Processing of Color Positive Film Blue Green Red White Cyan Magenta Yellow Scene Brightness Blue Sensitive Green Sensitive Red Sensitive Blue Sensitive Green Sensitive Red Sensitive Latent Image Blue Sensitive Green Sensitive Red Sensitive Pre-development Latent Image 37
38 Processing of Color Positive Film Uniform White Light Blue Sensitive Green Sensitive Red Sensitive Blue Sensitive Green Sensitive Red Sensitive Uniform White Light After Dying & Fixing Blue Green Red White Cyan Magenta Yellow Blue Green Red White Cyan Magenta Yellow 38 Yellow Dye Magenta Dye Cyan Dye Film Brightness Scene Brightness
39 Frame Camera Focal Plane Perspective Center Footprint The image footprint is captured through a single exposure. 39
40 Frame Camera Aircraft Vehicle Trajectory Ground swath 40
41 Radiometric Resolution: Perceiving Gray Shades 41
42 Radiometric Resolution: Perceiving Gray Shades mu 1 silver crystal: 2 gray shades min 9 gray shades 1--3 microns min 4 gray shades mu 42
43 Spatial Resolution: lp/mm 1 mm 1 line pair (lp) 43

44 Digital Cameras Block Diagram of a Digital Camera 44
45 Film Resolution and Pixel Size Film resolution Fine grained emulsions > 100 lp/mm Including atmosphere + optics ~100 lp/mm Hazy conditions 40 lp/mm Pixel Size Pixel size = 1/2 of smallest detail to be resolved Smallest detail: lp/mm Pixel size = 1/(2*lp/mm) 100 lp/mm pixel size = 1000 µm/200 = 5 µm 40 lp/mm pixel size = 1000 µm/80 = 12.5 µm 45
46 Resolution and Storage Requirement Problem: Largest available 2-D array 9k x 9k. Solution: Linear Array Scanners (Line Cameras). 46
47 Linear Array Scanners Digital frame cameras capture images through a single exposure of a two-dimensional CCD array. Linear array scanners capture scenes with large ground coverage and high geometric and radiometric resolutions through multiple exposures of few scan lines along the focal plane. Successive coverage of different areas on the ground is achieved either through: The motion of the imaging platform (push-broom scanners). The motion of the sensor relative to the imaging platform (panoramic scanners). 47
48 Push Broom Scanners y x Flight Direction x y Perspective Center Perspective Center Frame Camera Single Push Broom Scanner 48

49 Principle of Single Push Broom Scanner 49
50 Push-Broom Scanners Linear CCD array Optics Vehicle Trajectory Ground swath 50
51 Push Broom Scanner: Successive Coverage Flight Direction V t = pixel size H c 51
52 Single Push Broom Scanner (SPOT) PC 1 PC 2 PC 4 PC
53 Single Push Broom Scanner (Stereo Coverage - I) First Pass Second Pass SPOT Stereo Coverage Stereo coverage is achieved by tilting the sensor across the flight direction. 53
54 Single Push Broom Scanner (Stereo Coverage - II) Flight Direction IKONOS Stereo-Coverage Stereo coverage is achieved by tilting the sensor along the flight direction. 54
55 Three-Line Scanner x Flight Direction y Perspective Center 55

56 Principle of Three-Line Scanner 56
57 Three-Line Scanner (MOMS) d d Flight Direction PC(t) PC(t + dt) Backward Image Downward Image Forward Image 57
58 Three-Line Scanner (Triple Coverage) Flight Direction Triple coverage is achieved by having three scanners in the focal plane. 58
")


59 Three-Line Scanner (Triple Coverage) Backward scene Nadir scene Forward scene composed of backward view lines composed of nadir view lines Backward composed of forward view lines Nadir Forward 59
60 Single/Three-Line Push Broom Scanners: Stereo Coverage Stereo coverage can be obtained through: Tilting the sensor across the flight direction (SPOT). The stereo is captured in two different orbits. Problem: Significant time gap between the stereo images (possible variations in the object space and imaging conditions). Tilting the sensor along the flight direction (IKONOS). The stereo is captured along the same orbit. Short time gap between the stereo-images (few seconds). Problem: reduced geometric resolution (scale = f * cos(α) / H). Problem: Non-continuous stereo-coverage. 60
61 Single/Three-Line Push Broom Scanners Stereo Coverage Stereo coverage can be obtained through: Implementing more than one scan line in the focal plane (MOMS & ADS 40). The stereo images are captured along the same flight line. For three-line scanners, triple coverage is possible. Short time gap between the stereo images (few seconds). Continuous stereo/triple coverage. Same geometric resolution (scale = f/h). Problem: Reduced radiometric quality for the forward and backward looking scanners (quality degrades as we move away from the camera optical axis). 61
62 Panoramic Linear Array Scanner Flight Direction Scan Angle 62
63 Panoramic Linear Array Scanner Flight Direction Linear CCD array Ground swath 63
64 Panoramic Linear Array Scanner Flight Direction PC(T) + Linear Array Scanner α o + PC(0) Scanning Direction 64
65 Panoramic Linear Array Scanner The scan line is parallel to the flight direction. Coverage of successive areas on the ground is established by rotating the sensor across the flight direction. The imaging platform moves forward as we rotate the scan line across the flight direction. Question: What is the shape of the scene footprint? 65
66 Scene Footprint PC(T) Flight Direction Last Scan First Scan PC(0) V T 66
67 Scene Footprint No Image Motion Compensation 67
68 Scene Footprint 68

69 Image Coordinate Layout No Image Motion Compensation 69
70 Image Motion Compensation PC(0) PC(T) Footprint Objective: Have a rectangular footprint. 70
71 Image Motion Compensation Flight Direction f imc(t) +PC(t) (V t - V T / 2.0) H /cos( α ) t imc( t) = ( Vt VT /2) f f + H/cos( α ) t ( Vt VT /2) f cos( αt ) H 71
72 Scene Footprint With Image Motion Compensation 72

73 Image Coordinate Layout With Image Motion Compensation 73
74 Panoramic Linear Array Scanner Stereo coverage for panoramic linear array scanners can be obtained in the same way as frame cameras. Overlap between successive images along the same flight line. Side lap between images along adjacent strips. Scale will vary along the columns of the final scene. S t = f * cos(α t ) / H. 74


75 Perturbations in the Flight Trajectory Raw Scene Rectified Scene 75
76 Whiskbroom (point) Sensors/Scanners Point sensor images a single point at a time. Pixels within each line of the image are generated by scanning in the cross track direction with mechanical motion. A new image line is generated by the platform motion. The combined side-to-side and forward motion gives rise to the whiskbroom scanner scenes. 76
77 Whiskbroom Scanners Aircraft Vehicle Trajectory Ground swath 77
78 78 Whiskbroom Scanners Detectors Electronics Prism Dichroic grating Optics Mirror Recorder Detectors Electronics Prism Dichroic grating Optics Mirror Recorder Detectors Electronics Prism Dichroic grating Optics Mirror Recorder Ground Station Energy Detectors Electronics Prism Dichroic grating Optics Mirror Recorder Detectors Electronics Prism Dichroic grating Optics Mirror Recorder Detectors Electronics Prism Dichroic grating Optics Mirror Recorder Detectors Electronics Prism Dichroic grating Optics Mirror Recorder Detectors Electronics Prism Dichroic grating Optics Mirror Recorder Detectors Electronics Prism Dichroic grating Optics Mirror Recorder
79 Light Detection And Ranging (LIDAR) Operational Principles 79
80 LIDAR Operational Principles The LIDAR instrument transmits light out to a target. The transmitted light interacts with and is changed by the target. Some of this light is reflected / scattered back to the instrument where it is analyzed. The change in the properties of the light enables some property of the target to be determined. The time for the light to travel out to the target and back to the LIDAR is used to determine the range to the target 80
81 LIDAR Operational Principles 81

82 LIDAR: Operational Principles INS 82

83 LIDAR: Operational Principles Three Measurement Systems GPS positioning satellites 1. Position: GPS 2. Attitude: IMU 3. Laser Scanner emits laser beams with high frequency and collects the reflections. Time is accurately measured. Onboard GPS Onboard IMU GPS base station 83

84 LIDAR: Operational Principles 84
85 LIDAR: Operational Principles Beam divergence from mrad. LIDAR Footprint Wide Beam (0.8 mrad) 0.8m diameter at 1000m 2.4m diameter at 3000m Narrow Beam (0.2 mrad) 0.2m diameter at 1000m 0.6m diameter at 3000m 85
 / 2.0. Range + pointing direction + GPS + IMU XYZ.")
86 LIDAR: Operational Principles Range = (travel time * speed of light) / 2.0. Range + pointing direction + GPS + IMU XYZ. 86
87 LIDAR: Operational Principles 87
88 88 LIDAR: Operational Principles = α ρ θ α ρ θ α ρ sin sin cos cos cos L L L Z Y X + = L L L INS GPS P P P Z Y X R Z Y X Z Y X ),, ( κ φ ω Point coordinates relative to the LIDAR reference frame. Point coordinates relative to the object reference frame. ρ: Measured Range. (α, θ): The orientation of the laser beam relative to the LIDAR reference frame.

89 Applications (Transportation - Highway Expansion) Farm Buildings Highway 148 Trees Tillage Pattern 89

90 Applications: Cut & Fill 90

91 Applications: Mining & Construction Volume Calculations 91

92 Applications: Power Line Mapping Classified LIDAR Points 92
93 Radio Detection And Ranging (RADAR) Operational Principles 93
94 Distinctive Characteristics of Microwave Capability of penetrating the atmosphere under virtually all conditions. Different view of the environment rough in the visible portion and smooth in the microwave. 94
95 RADAR Wavelengths Band K X C S L P Wavelength (cm)
96 RADAR Wavelengths The division of RADAR spectral bands are entirely arbitrary. The shortest wavelengths are designated K-band. They provide the best radar resolution. They are partially blocked by water vapor and their cloud penetrating capability is limited. They are used by ground-based weather systems to track heavy cloud-cover and storms. Therefore, X-band is typically the shortest wavelength range used for imaging RADAR. 96
97 RADAR Operational Principles Radar transmits a pulse and measures reflected echo (backscatter ) 97
98 RADAR Operational Principles An antenna transmits microwave energy to the ground as a series of pulses. When a pulse strikes an object, it is scattered in all directions. Small portion of the signal (backscatter) is returned to the RADAR and received by the antenna. The strength of the backscatter signal and the transit time from transmission to receipt are recorded. The backscatter amplitudes defines the pixel brightness value. The time delay and known radiation speed are used to derive ranges to ground objects. 98
99 Side Looking RADAR (SLAR) The antenna transmits a fan-shaped beam in a direction orthogonal to the flight direction. The backscatter signals arrive sequentially from objects within the RADAR beam as a function of their range to the antenna. As the radar moves along its flight pass, a different section of ground is illuminated with each transmitted pulse. Since the RADAR motion is continuous, the illumination of the ground forms a series of overlapping scans. 99
100 Operational Principles of SLAR Return signal from house Radar pulse sent from aircraft Return signal from tree Propagation of one radar pulse 100
101 Operational Principles of SLAR Pulse strength High energy output pulse Return form house Return form tree Time Resulting antenna return 101
102 RADAR Reflectivity The following factors will influence the RADAR reflectivity: Collection geometry and topography. Surface roughness Dielectric constant. 102
103 Collection Geometry & Topography Incident angle: The angle between the RADAR line of sight and the normal to the geoid surface. Local incident angle: The angle between the RADAR line of sight and the surface normal. The local incident angle accounts for the influence of the topography. The local incident angle is the major factor affecting the strength of the RADAR return. 103
104 Collection Geometry & Topography The reflectivity decreases as the local incident angle increases since most of the RADAR energy is reflected away from the sensor. An increase in the surface slope increases the strength of the return. This effect is greatest when the normal to slope coincides with the RADAR line of sight. 104
105 Surface Roughness The radar backscatter increases as the roughness increases. A surface is smooth relative to the RADAR energy if its height variation is less than one-eighth of the RADAR wavelength Specular scatter. Specular surfaces reflect RADAR waves away from the antenna. The backscatter is very weak (water bodies appear very dark). Rough surfaces (diffuse reflectors) produce strong backscatter signal. 105
106 Dielectric Constant Dielectric constant is a measure of the reaction of the material to the presence of an electric field. Materials with high dielectric constants are very good reflectors of RADAR energy. Water has a dielectric constant of 80, while the value for dry land surface ranges from 3 to 8. Calm water body is a Specular reflector with a high dielectric constant. It strongly reflects energy away from the antenna (it appears black). 106
107 Dielectric Constant Disturbed water surface (e.g., in a storm)/wave crests provide strong returns and they appear bright. Radar is good for making soil moisture maps. The combination of the high dielectric constant of the water and the surface roughness provided by the soil or vegetation create bright return areas from moist soil. This would not be the case for dry regions. 107
108 Satellite Orbits 108
109 Satellite Orbits: Classification Geostationary (zero inclination) orbits. Geosynchronous orbits Low inclination orbits. Near polar orbits. Sun-synchronous orbits. 109
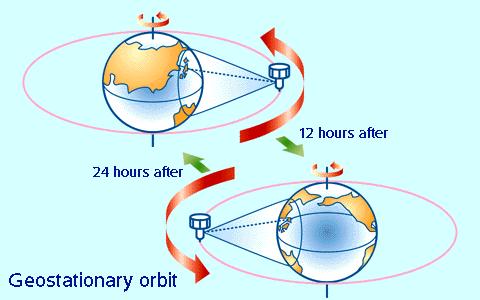
110 Geostationary Orbits Geostationary satellites enable a quasi-continuous time sampling over certain regions on Earth. These satellites are geosynchronous, meaning their orbits keep them synchronized with Earth rotation. They take 24 hours to complete one orbit. When these satellites orbit above the equator, with zero inclination, they are also geostationary (fixed) relative to a point on the equator. They observe the Earth without any significant relative motion. 110
111 Geostationary Orbits 111
112 Geostationary Orbits There is only one orbit in which a satellite can be geostationary. To have a 24 hour orbital period, they must keep an orbital altitude of 35,780 km (22,234 mi, or about 5.61 Earth radii), which sets their speed at 3.07 km/s (6,868 mph). An equatorial point travels underneath at a speed of about km/s (1,040 mph). 112
113 Geostationary Orbits At this distance, and with a wide field of view (FOV), they see the Earth as a full disk, but the area covered is less than a hemisphere, being about 1/4 th of the planetary surface. This results in a much wider field of view than is possible for polar orbiting satellites. However, the large distance from earth causes geostationary satellites to have much poorer spatial resolution than polar orbiting satellites. 113
114 Field of View: Geostationary Vs. Polar Orbits 114

115 Geostationary Satellites Areas viewed by geostationary meteorological satellites. The solid line shows the limits; a satellite sees nothing outside this area. The dashed line encloses the area of useful data. 115
116 GOES Imagery Geostationary Operational Environmental Satellite Channel Channel Name Central Wave-length Resolution km E/W x N/S Example Meteorological Applications 1 Visible 0.65 µm 0.57 x 1.00 Produces high resolution black and white photographs of earth and clouds. 2 Shortwave infrared 3.90 µm 2.30 x 8.00 At night, can be used to track lowlevel cloud fields and thus infer nearsurface wind circulation. GOES provides frequent images at five different wavelengths, including a visible wavelength channel and four infrared channels. 116
117 GOES Imagery Channel Channel Name Central Wave-length Resolution km E/W x N/S Example Meteorological Applications 3 Water vapor channel 6.70 µm 2.30 x 8.00 Detects mid- and upper-level water vapor and clouds. Can derive upper-level wind vectors with the winds plotted on the image 4 Window channel µm 2.30 x 4.00 Cloud top temperatures, nighttime tracking of storm systems. 5 Dirty window/ split window IR µm 2.30 x 4.00 Sensitive to low level water vapor. 117
118 Geostationary Orbits: Advantages Large spatial coverage. Five geostationary satellites are enough to cover all of the non-polar regions of the Earth. Permanent visibility of the satellite allows for continuous telecommunications and high rate of observations repetition. Near continuous time sampling - 30 min and 15 min for Meteosat, few minutes for GOES. One ground segment is enough for satellite monitoring. 118
119 Geostationary Orbits: Limitations Polar regions are not observed. Not adequate for very high spatial resolution of the ground. For example, in visible and infrared wavelengths, the resolution could not reasonably be better than 1 km. Active measurements are not feasible at such a distance from the Earth. Some perturbations of the solar electricity power supply to the satellite occur during eclipse phenomena. 119
120 Geostationary Orbits: Applications Meteorology: real time operational survey of the troposphere, cloud systems, sea, and land surface temperatures. Telecommunications: world wide operational telecommunication systems for telephones, TV, and digitized transmission lines. Army: alarm systems - detection of rocket launches. 120
121 Low Inclination Orbits Low Inclination Orbits fall between near polar orbits and geostationary orbits. They have an inclination between 0 degrees (equatorial orbit) and 90 degrees (polar orbit). These orbits may be determined by the region on Earth that is of most interest (i.e., an instrument to study the tropics may be best put on a low inclination satellite), or by the latitude of the launch site. 121
122 Low Inclination Orbits The orbital altitude of these satellites is generally on the order of a few hundred km. The orbital period is on the order of a few hours. These satellites are not sun-synchronous. So they will view a place on Earth at varying times. 122

123 Polar, high inclination, and low inclination satellite orbits 123
124 Polar Orbiting Environmental Satellites Due to the rotation of the Earth, it is possible to combine the advantages of low-altitude orbits with global coverage, using near-polar orbiting satellites, which have an orbital plane crossing the poles. These satellites are launched into orbits at high inclinations to the Equator, such that they pass across high latitudes near the poles. Most POES orbits are circular to slightly elliptical at distances ranging from 700 to 1700 km ( mi) from the geoid. At different altitudes they travel at different speeds. 124
. 125")
125 Near Polar Orbit The ground track of a polar orbiting satellite is displaced to the west after each orbital period, due to the rotation of the Earth. This displacement of longitude is a function of the orbital period (often less than 2 hours for low altitude orbits). 125

126 Near Polar Orbits Map of the ground path of one revolution of a typical near-polar orbiting satellite 126

127 Near Polar Orbits The orbit of a near polar satellite as viewed from a point rotating with the Earth. 127
128 Near Polar Orbits Depending on the ground swath of the satellite, it is possible to adjust the period (by varying the altitude), and thus the longitudinal displacement, in such a way as to ensure the observation of any point on the Earth within a certain time period. Most of the near polar meteorological satellites ensure complete global coverage of the Earth, during one day. 128

129 Ground paths of multiple orbital revolutions during one day for a near-polar orbiting satellite 129
130 Sun-Synchronous Orbiting Satellites Depending on orbital altitudes, angular velocities, and inclinations, polar orbiting satellites can be sunsynchronous. Sun-synchronous satellites cross some reference position (e.g., the equator) at the same local time. This time is usually between mid-morning and midafternoon on the sunlight side of the orbit. Sun-synchronous satellites pass over any given latitude at almost the same local time during each orbital pass. 130
131 Sun-Synchronous Orbiting Satellites This orbital configuration applies to LANDAT, SPOT, and some of the other land observers. In addition, for a given latitude and season, sunsynchronous satellites observe the Earth surface with a nearly constant sunlight ratio. This characteristic is useful for measurements in the visible and thermal wavelengths. 131

132 Sun-Synchronous Orbits Example of the positions of a sun-synchronous satellite in 12 hour intervals. 132

133 Non Sun-Synchronous / Sun-Synchronous Orbits Non sun-synchronous orbit as the Earth revolves around the sun Sun-synchronous satellite orbit as Earth revolves around the sun. 133
134 Sun-Synchronous Orbits: Advantages The low altitude of a sun-synchronous orbit permits good ground resolution. It also enables easier active measurements with RADAR or LIDAR. The circular orbit implies a constant satellite velocity, which is important for having a regular scanning resolution along the satellite ground track. The near polar orbit allows a global coverage for the observation of the whole Earth. Orbit altitudes of between 700 and 900 km permits both a large ground swath, offering a daily global coverage, and a good ground resolution. 134
135 Sun-Synchronous Orbits: Advantages Most of the Earth observing missions use sun-synchronous satellites in low near polar orbits (NOAA polar orbiting meteorological satellites, LANDSAT, SPOT, ERS, etc...). Sun-synchronism produces time-constant illumination conditions of the observed surfaces, except for seasonal variations. This property is useful for many remote-sensing applications in Earth observation. Another property of interest is the nearly constant sunlight ratio of the satellite on each orbit, which implies a near constant solar energy supply for the satellite platform. 135
136 Sun-Synchronous Orbits: Limitations A continuous temporal observation is not possible with only one sun-synchronous satellite. It passes over polar regions on every orbital period, but much more rarely over equatorial regions (2 times a day for most current meteorological satellites; more generally it depends on the drift and the ground swath). A possibility to ease this difficulty could be to use a constellation of satellites. 136
137 Earth Observing Satellites 137


138 Earth Observing Satellites: LANDSAT LANDSAT San Francisco and Surrounding Areas Bands 3,2,1
139 Earth Observing Satellites: LANDSAT Launched Decommi -ssioned RBV band Landsat1 Landsat2 Landsat3 Landsat4 Landsat5 Landsat6 Landsat7 July 23, 1972 January 22,1975March 5, 1978 July 1, 1982 March 1, 1984 October, 1993 April 5, 1999 January 6, 1978 Feb 25, 1982 March 31, 1983 June Failure upon launch None None None None - MSS band None None TM band None None None (ETM+) 1-7 (plus ETM+) Altitude Repeat Cycles 917 km 917 km 917 km 705 km 705 km 705 km 705 km 18 days 18 days 18 days 16 days 16 days 16 days 16 days 139
140 Earth Observing Satellites: LANDSAT LANDSAT Return Beam Vidicon (RBV) Band Wavelength (µm) Resolution (m) Green Red Near IR LANDSAT Multi-Spectral Sensor (MSS) Band Wavelength (µm) Resolution (m) Green Red Near IR Near IR
141 Earth Observing Satellites: LANDSAT LANDSAT TM, ETM+ Sensor Characteristics Band Wavelength (µm) Resolution (m) Blue Green Red Near IR SWIR Thermal IR (TM) 60 (ETM+) SWIR Panchromatic Thematic Mapper (TM) & Enhanced Thematic Mapper Plus (ETM+) 141


142 Earth Observing Satellites: SPOT Satellite Pour de l'observation de la Terre SPOT Athens, 5m BW 142
143 Earth Observing Satellites: SPOT SPOT 1 (HRV): Launched on 22 February 1986, and withdrawn from active service on 31 December SPOT 2 (HRV): Launched on 22 January 1990 and is still operational. SPOT 3 (HRV): Launched on 26 September An incident occurred on November 14, After 3 years in orbit the satellite has stopped functioning. SPOT 4 (HRVIR): Launched on 24 Mar SPOT 5 (HRVIR): Launched on 3 May
144 Earth Observing Satellites: SPOT Orbit Specifications Type Altitude Inclination Period Repeat Cycle Off-Nadir Revisit Sun-Synchronous 832 km 98.7 deg 101 min 26 days 1 to 3 days 144
145 Earth Observing Satellites: SPOT SPOT HRV and HRVIR Instrument Characteristics Instrument Field of View Ground Sampling Interval (Nadir Viewing) Pixel per Line Ground Swath (Nadir Viewing) Multi-Spectral Mode (XS) 4.13 deg 20 m by 20 m km Panchromatic Mode (P) 4.13 deg 10 m by 10 m km HRV: High Resolution Visible Image. HRVIR: High Resolution Visible Infrared. 145
146 Earth Observing Satellites: SPOT 1, 2, 3 & 4 HRV Spectral Bands Mode Band Multi-spectral XS1 Multi-spectral XS2 Multi-spectral XS3 Panchromatic P Wavelength (µm) (Green) (Red) (Near IR) (Visible) Resolution (m) HRVIR Spectral Bands Mode Band Multi-spectral XI1 Multi-spectral XI2 Multi-spectral XI3 Multi-spectral XI4 Mono-spectral M Wavelength (µm) (Green) (Red) (Near IR) (SWIR) (Red) 146 Resolution (m)
147 Earth Observing Satellites: SPOT 5 Higher ground resolution: 5 meters and 2.5 meters (instead of 10 m) in panchromatic mode. Higher resolution in multi-spectral mode: 10 m (instead of 20 m) in all 3 spectral bands in the visible and near infrared ranges. The spectral band in the short wave infrared band (essential for VEGETATION data) is maintained at a resolution of 20 m. Field width of each instrument: 60 km. 147


148 Earth Observing Satellites: IRS-1C IRS-1C Munich Airport, Germany (IRS-1D) IRS-1C launched in December IRS-1D launched in September
149 Earth Observing Satellites: IRS Indian (IRS). IRS-1 is India's dedicated Earth resources satellite system operated by Indian Space Research Organization (ISRO) and the National Remote Sensing Agency (NRSA). The primary objective of the IRS missions is to provide India's National Natural Resources Management System (NNRMS) with remote sensing data. 149
150 Earth Observing Satellites: IRS-1C Orbit Specifications Type Altitude Inclination Period Repeat Cycle Sun-Synchronous 817 km deg 101 min 24 days Sensor Specifications LISS (Linear Imaging Self Scanning Sensor): Multi-spectral 4-channel sensors. PAN: panchromatic WiFS: Wide Field Sensor 150
151 Earth Observing Satellites: IRS-1C LISS and PAN Sensor Characteristics Sensor Band Wavelength (µm) Resolution (m) Swath Width (km) LISS (Green) LISS (Red) LISS (Near IR) LISS (SWIR) PAN < WiFS bands Wavelength (µm) Resolution (m) Swath (km) Red Near IR

 One 152")
152 Earth Observing Satellites: EO-1 EO-1 New York, NY (Bands 3-2-1) Earth Observing One 152
153 Earth Observing Satellites: EO-1 Orbit Specifications Type Altitude Inclination Period Repeat Cycle Sun-Synchronous, 10:01 am descending node 705 km 98.2 deg 99 min 16 days 153
154 Earth Observing Satellites: EO-1 Sensor Characteristics Spatial Resolution Swath Width Spectral Channels Spectral Bandwidth Digitization Signal-to-Noise Ratio (SNR) 30 m 7.75 km 242 unique channels. VNIR (70 channels, 356 nm nm), SWIR (172 channels, 852 nm nm) 10 nm (nominal) 12 bits 161 (550 nm); 147 (700 nm); 110 (1125 nm); 40 (2125 nm) 154
155 Earth Observing Satellites: RESURS Russian Satellites 155
156 Earth Observing Satellites: RESURS RESURS-O is a series of satellites for monitoring natural resources, Similar in function to the US LANDSAT series. Operation of the RESURS-O1 series was started in The launch of the RESURS-O1 was followed by two other satellites, The latest of which was in November
157 Earth Observing Satellites: RESURS RESURS-O1 Orbit Specifications Type Altitude Inclination Period Repeat Cycle Sun-Synchronous 678 km deg 98 min 21 days 157
158 Earth Observing Satellites: RESURS MSU-SK (Multi-spectral Scanner of Moderate Resolution with Conical Scanning). MSU-E (High Resolution Multi-spectral Scanner with Electronic Scanning). The MSU-E is a narrow swath instrument (45 km) with 45 x 35 m resolution and 3 spectral bands ( µm, µm, and µm). 158
159 Earth Observing Satellites: RESURS MSU-SK Sensor Characteristics Band Wavelength (µm) (green) (red) (near IR) (near IR) (thermal IR) Pixel Size (m)


160 Earth Observing Satellites: IKONOS IKONOS Launched on September 24, 1999 Denver, USA 160
161 Earth Observing Satellites: IKONOS IKONOS Orbit Specifications Type Altitude Inclination Descending node crossing time Period Off-Nadir Revisit Sun-Synchronous 681 km 98.1 deg 10:30 am local solar time 98 min 1.5 to 2.9 days at 40 o latitude 161
162 Earth Observing Satellites: IKONOS Sensor Characteristics Viewing Angle Agile spacecraft, along track and across track pointing Swath Width 11 km nominal at nadir Image Modes Metric Accuracy Radiometric Digitization Single scene: 13 km x 13 km Strips: 11 km x 100 km up to 11 km x 1000 km Image mosaics: up to 12,000 sq. km 12 m horizontal, 10 m vertical without GCP 11 bits 162
163 Earth Observing Satellites: IKONOS Sensor Characteristics Spectral Bands 1 (blue) 2 (green) 3 (red) 4 (NIR) Panchromatic wavelength (µm) Resolution 4 m 4 m 4 m 4 m 1 m 163
164 IKONOS: Product Levels Level 0: Image Archive Product Level 1: Radiometrically Corrected Product Level 2: Standard Geometrically Corrected Product Level 3: Precision Geometrically Corrected Product Level 4: Ortho-rectified Product Level 5: Digital Terrain Matrix (DTM) Level 6: Algorithm Product Level 6a: Pan-Sharpened Image Product Level 6b: Band Ratio Image Product Level 7: Mosaic Product 164


165 Earth Observing Satellites: EROS-A1 Earth Remote Observation Satellite EROS-A1 Deadhorse, Alaska Launched on 5 December 2000, EROS-A1 165
166 Earth Observing Satellites: EROS-A1 EROS-A1 Orbit Specifications Type Descending Node Crossing Time Altitude Inclination Period Sun-Synchronous 9:45 am local solar time km 97.3 deg 94 min 166
167 Earth Observing Satellites: EROS-A1 Sensor Characteristics Viewing Angle Sensor Type Ground Sampling Distance Scanning Radiometric Digitization Spectral Band Pixels-in-line Agile spacecraft along track and across track pointing (up to 45 o from nadir) CCD 1.8 m Asynchronous (up to 750 lines/second) 11 bits Panchromatic, µm


168 Earth Observing Satellites: Quickbird Quickbird2 Montreal, Quebec 168
169 Earth Observing Satellites: Quickbird Quickbird-2 Orbit Specifications Type Altitude Inclination Period Off-Nadir Revisit Sun-Synchronous 450 km 98 deg 93.4 min. 1 to 3.5 days 169
170 Earth Observing Satellites: Quickbird Sensor Characteristics Viewing Angle Swath Width Image Strip Length Metric Accuracy Radiometric Digitization Agile spacecraft, in-track and cross-track pointing +/- 30 deg nominal fore-and-aft and side-to-side, 45 deg maximum 17 km nominal at nadir Up to 225 km 23 m circular error (CE), 17 m linear error (LE) at 90% confidence (without ground control points) 11 bits 170
171 Earth Observing Satellites: Quickbord Spectral Band Wavelength (µm) Resolution (at nadir) Resolution (at 30 o off nadir) 1 (blue) m 2.9 m 2 (green) m 2.9 m 3 (red) m 2.9 m 4 (NIR) m 2.9 m Panchromatic m 0.73 m 171


172 Earth Observing Satellites: ORBVIEW Orbview3 Salt Lake city, Utah Orbview3 was launched in June 26,
173 Earth Observing Satellites: ORBVIEW Orbview-3 Orbit Specifications Type Altitude Revisit Swath Width Sun-Synchronous 470 km Less than 3 days 8km Sensor Characteristics Spectral Band 1 (blue) 2 (green) 3 (red) 4 (NIR) Panchromatic 173 Wavelength (µm) Resolution m m m m m


174 Microwave Satellite RADARSAT-SAR RADARSAT 13 Feb 1997 Cape Byron-Evans Head, northern NSW 174
175 Microwave : RADARSAT RADARSAT Orbit Type Altitude Inclination Period Repeat Cycle Sun-Synchronous 798 km 98.6 deg min 24 days 175
176 Microwave : RADARSAR MODE RESOLUTION (m) Range 1 x azimuth (m) LOOKS 2 WIDTH (km) INCIDENCE ANGLE 3 (degrees) Standard 25 x Wide x Wide x Fine resolution 11-9 x ScanSAR narrow 50 x ScanSAR wide 100 x Extended (H) x Extended (L) x Nominal; ground range resolution varies with range 2. Nominal; range and processor dependent 3. Incidence angle depends on sub-mode 10-23
177 177
178 Spectral Reflectance Curves 178

179 Radiation Interaction with Targets 179
180 Spectral Response Curves Spectral reflectance is the portion of incident radiation that is reflected by a non-transparent surface. The fraction of energy reflected at a particular wavelength varies for different features. Additionally, the reflectance of features varies at different wavelengths. Thus, two features that are indistinguishable in one spectral range may be very different in another portion of the spectrum. This is an essential property of matter that allows for different features to be identified and separated by their spectral response curves. 180

181 Spectral Response Curves 1 2 Legend 1 Grass Lime Stone 3 Sand, dry 4 Snow, old 5 Fir tree 6 Asphalt, wet 7 Water 181

182 Spectral Reflectance Curve (leaves) 182
183 Spectral Response Curve 183
184 Spectral Response Curve 184

185 Vegetation Spectral Reflectance Curves 185

186 Humidity & Spectral Response Curves 186

187 Spectral Reflectance Curves of Plants 187
188 Vegetation Index Healthy vegetation absorbs most of the visible light that hits it, and reflects a large portion of the near-infrared light. Unhealthy or sparse vegetation reflects more visible light and less near-infrared light. Thus, if there is much more reflected radiation in nearinfrared wavelengths than in visible wavelengths, then the vegetation in that pixel is likely to be dense and may contain some type of forest. If there is very little difference in the intensity of visible and near-infrared wavelengths reflected, then the vegetation is probably sparse and may consist of grassland, tundra, or desert. 188

189 Normalized Difference Vegetation Index 189
190 Normalized Difference Vegetation Index Normalized Difference Vegetation Index (NDVI) is defined as follows: NDVI = (NIR VIS)/(NIR + VIS) Calculations of NDVI for a given pixel always result in a number that ranges from minus one (-1) to plus one (+1). No green leaves gives a value close to zero. NDVI close to +1 ( ) indicates the highest possible density of green leaves. 190
")
191 Normalized Difference Vegetation Index NOAA s Advanced Very High Resolution Radiometer (AVHRR) 191

192 Normalized Difference Vegetation Index 192


193 Temporal NDVI Feb., 86 Apr., 86 Jun., 86 Aug., 86 Oct., 86 Dec.,
Chapters 1-3. Chapter 1: Introduction and applications of photogrammetry Chapter 2: Electro-magnetic radiation. Chapter 3: Basic optics
 Chapters 1-3 Chapter 1: Introduction and applications of photogrammetry Chapter 2: Electro-magnetic radiation Radiation sources Classification of remote sensing systems (passive & active) Electromagnetic
NON-PHOTOGRAPHIC SYSTEMS: Multispectral Scanners Medium and coarse resolution sensor comparisons: Landsat, SPOT, AVHRR and MODIS
 NON-PHOTOGRAPHIC SYSTEMS: Multispectral Scanners Medium and coarse resolution sensor comparisons: Landsat, SPOT, AVHRR and MODIS CLASSIFICATION OF NONPHOTOGRAPHIC REMOTE SENSORS PASSIVE ACTIVE DIGITAL
9/12/2011. Training Course Remote Sensing Basic Theory & Image Processing Methods September 2011
 Training Course Remote Sensing Basic Theory & Image Processing Methods 19 23 September 2011 Popular Remote Sensing Sensors & their Selection Michiel Damen (September 2011) damen@itc.nl 1 Overview Low resolution
Lecture 6: Multispectral Earth Resource Satellites. The University at Albany Fall 2018 Geography and Planning
 Lecture 6: Multispectral Earth Resource Satellites The University at Albany Fall 2018 Geography and Planning Outline SPOT program and other moderate resolution systems High resolution satellite systems
Remote Sensing Platforms
 Types of Platforms Lighter-than-air Remote Sensing Platforms Free floating balloons Restricted by atmospheric conditions Used to acquire meteorological/atmospheric data Blimps/dirigibles Major role - news
Outline. Introduction. Introduction: Film Emulsions. Sensor Systems. Types of Remote Sensing. A/Prof Linlin Ge. Photographic systems (cf(
 GMAT x600 Remote Sensing / Earth Observation Types of Sensor Systems (1) Outline Image Sensor Systems (i) Line Scanning Sensor Systems (passive) (ii) Array Sensor Systems (passive) (iii) Antenna Radar
An Introduction to Geomatics. Prepared by: Dr. Maher A. El-Hallaq خاص بطلبة مساق مقدمة في علم. Associate Professor of Surveying IUG
 An Introduction to Geomatics خاص بطلبة مساق مقدمة في علم الجيوماتكس Prepared by: Dr. Maher A. El-Hallaq Associate Professor of Surveying IUG 1 Airborne Imagery Dr. Maher A. El-Hallaq Associate Professor
9/12/2011. Training Course Remote Sensing Basic Theory & Image Processing Methods September 2011
 Training Course Remote Sensing Basic Theory & Image Processing Methods 19 23 September 2011 Remote Sensing Platforms Michiel Damen (September 2011) damen@itc.nl 1 Overview Platforms & missions aerial surveys
Remote Sensing Platforms
 Remote Sensing Platforms Remote Sensing Platforms - Introduction Allow observer and/or sensor to be above the target/phenomena of interest Two primary categories Aircraft Spacecraft Each type offers different
Microwave Remote Sensing (1)
") Microwave Remote Sensing (1) Microwave sensing encompasses both active and passive forms of remote sensing. The microwave portion of the spectrum covers the range from approximately 1cm to 1m in wavelength.
Microwave Remote Sensing (1) Microwave sensing encompasses both active and passive forms of remote sensing. The microwave portion of the spectrum covers the range from approximately 1cm to 1m in wavelength.
The studies began when the Tiros satellites (1960) provided man s first synoptic view of the Earth s weather systems.
 provided man s first synoptic view of the Earth s weather systems.") Remote sensing of the Earth from orbital altitudes was recognized in the mid-1960 s as a potential technique for obtaining information important for the effective use and conservation of natural resources.
Remote sensing of the Earth from orbital altitudes was recognized in the mid-1960 s as a potential technique for obtaining information important for the effective use and conservation of natural resources.
Remote Sensing 1 Principles of visible and radar remote sensing & sensors
 Remote Sensing 1 Principles of visible and radar remote sensing & sensors Nick Barrand School of Geography, Earth & Environmental Sciences University of Birmingham, UK Field glaciologist collecting data
Blacksburg, VA July 24 th 30 th, 2010 Remote Sensing Page 1. A condensed overview. For our purposes
 A condensed overview George McLeod Prepared by: With support from: NSF DUE-0903270 in partnership with: Geospatial Technician Education Through Virginia s Community Colleges (GTEVCC) The art and science
Introduction to Remote Sensing Fundamentals of Satellite Remote Sensing. Mads Olander Rasmussen
 Introduction to Remote Sensing Fundamentals of Satellite Remote Sensing Mads Olander Rasmussen (mora@dhi-gras.com) 01. Introduction to Remote Sensing DHI What is remote sensing? the art, science, and technology
An Introduction to Remote Sensing & GIS. Introduction
 An Introduction to Remote Sensing & GIS Introduction Remote sensing is the measurement of object properties on Earth s surface using data acquired from aircraft and satellites. It attempts to measure something
Aral Sea profile Selection of area 24 February April May 1998
 250 km Aral Sea profile 1960 1960 1985 1986 1987 1988 1989 1990 1991 1992 1993 1994 1995 1996 1997 1998 2010? Selection of area Area of interest Kzyl-Orda Dried seabed 185 km Syrdarya river Aral Sea Salt
Introduction to Remote Sensing
 Introduction to Remote Sensing Spatial, spectral, temporal resolutions Image display alternatives Vegetation Indices Image classifications Image change detections Accuracy assessment Satellites & Air-Photos
RADAR (RAdio Detection And Ranging)
") RADAR (RAdio Detection And Ranging) CLASSIFICATION OF NONPHOTOGRAPHIC REMOTE SENSORS PASSIVE ACTIVE DIGITAL CAMERA THERMAL (e.g. TIMS) VIDEO CAMERA MULTI- SPECTRAL SCANNERS VISIBLE & NIR MICROWAVE Real
RADAR (RAdio Detection And Ranging) CLASSIFICATION OF NONPHOTOGRAPHIC REMOTE SENSORS PASSIVE ACTIVE DIGITAL CAMERA THERMAL (e.g. TIMS) VIDEO CAMERA MULTI- SPECTRAL SCANNERS VISIBLE & NIR MICROWAVE Real
Int n r t o r d o u d c u ti t on o n to t o Remote Sensing
 Introduction to Remote Sensing Definition of Remote Sensing Remote sensing refers to the activities of recording/observing/perceiving(sensing)objects or events at far away (remote) places. In remote sensing,
746A27 Remote Sensing and GIS. Multi spectral, thermal and hyper spectral sensing and usage
 746A27 Remote Sensing and GIS Lecture 3 Multi spectral, thermal and hyper spectral sensing and usage Chandan Roy Guest Lecturer Department of Computer and Information Science Linköping University Multi
Some Basic Concepts of Remote Sensing. Lecture 2 August 31, 2005
 Some Basic Concepts of Remote Sensing Lecture 2 August 31, 2005 What is remote sensing Remote Sensing: remote sensing is science of acquiring, processing, and interpreting images and related data that
Introduction to Radar
 National Aeronautics and Space Administration ARSET Applied Remote Sensing Training http://arset.gsfc.nasa.gov @NASAARSET Introduction to Radar Jul. 16, 2016 www.nasa.gov Objective The objective of this
Important Missions. weather forecasting and monitoring communication navigation military earth resource observation LANDSAT SEASAT SPOT IRS
 Fundamentals of Remote Sensing Pranjit Kr. Sarma, Ph.D. Assistant Professor Department of Geography Mangaldai College Email: prangis@gmail.com Ph. No +91 94357 04398 Remote Sensing Remote sensing is defined
Geo/SAT 2 INTRODUCTION TO REMOTE SENSING
 Geo/SAT 2 INTRODUCTION TO REMOTE SENSING Paul R. Baumann, Professor Emeritus State University of New York College at Oneonta Oneonta, New York 13820 USA COPYRIGHT 2008 Paul R. Baumann Introduction Remote
Sources of Geographic Information
 Sources of Geographic Information Data properties: Spatial data, i.e. data that are associated with geographic locations Data format: digital (analog data for traditional paper maps) Data Inputs: sampled
Active and Passive Microwave Remote Sensing
 Active and Passive Microwave Remote Sensing Passive remote sensing system record EMR that was reflected (e.g., blue, green, red, and near IR) or emitted (e.g., thermal IR) from the surface of the Earth.
Lecture 13: Remotely Sensed Geospatial Data
 Lecture 13: Remotely Sensed Geospatial Data A. The Electromagnetic Spectrum: The electromagnetic spectrum (Figure 1) indicates the different forms of radiation (or simply stated light) emitted by nature.
746A27 Remote Sensing and GIS
 746A27 Remote Sensing and GIS Lecture 1 Concepts of remote sensing and Basic principle of Photogrammetry Chandan Roy Guest Lecturer Department of Computer and Information Science Linköping University What
FOR 353: Air Photo Interpretation and Photogrammetry. Lecture 2. Electromagnetic Energy/Camera and Film characteristics
 FOR 353: Air Photo Interpretation and Photogrammetry Lecture 2 Electromagnetic Energy/Camera and Film characteristics Lecture Outline Electromagnetic Radiation Theory Digital vs. Analog (i.e. film ) Systems
CHAPTER 7: Multispectral Remote Sensing
 CHAPTER 7: Multispectral Remote Sensing REFERENCE: Remote Sensing of the Environment John R. Jensen (2007) Second Edition Pearson Prentice Hall Overview of How Digital Remotely Sensed Data are Transformed
SFR 406 Spring 2015 Lecture 7 Notes Film Types and Filters
 SFR 406 Spring 2015 Lecture 7 Notes Film Types and Filters 1. Film Resolution Introduction Resolution relates to the smallest size features that can be detected on the film. The resolving power is a related
Passive Microwave Sensors LIDAR Remote Sensing Laser Altimetry. 28 April 2003
 Passive Microwave Sensors LIDAR Remote Sensing Laser Altimetry 28 April 2003 Outline Passive Microwave Radiometry Rayleigh-Jeans approximation Brightness temperature Emissivity and dielectric constant
IKONOS High Resolution Multispectral Scanner Sensor Characteristics
 High Spatial Resolution and Hyperspectral Scanners IKONOS High Resolution Multispectral Scanner Sensor Characteristics Launch Date View Angle Orbit 24 September 1999 Vandenberg Air Force Base, California,
REMOTE SENSING INTERPRETATION
 REMOTE SENSING INTERPRETATION Jan Clevers Centre for Geo-Information - WU Remote Sensing --> RS Sensor at a distance EARTH OBSERVATION EM energy Earth RS is a tool; one of the sources of information! 1
remote sensing? What are the remote sensing principles behind these Definition
 Introduction to remote sensing: Content (1/2) Definition: photogrammetry and remote sensing (PRS) Radiation sources: solar radiation (passive optical RS) earth emission (passive microwave or thermal infrared
Atmospheric interactions; Aerial Photography; Imaging systems; Intro to Spectroscopy Week #3: September 12, 2018
 GEOL 1460/2461 Ramsey Introduction/Advanced Remote Sensing Fall, 2018 Atmospheric interactions; Aerial Photography; Imaging systems; Intro to Spectroscopy Week #3: September 12, 2018 I. Quick Review from
Introduction Active microwave Radar
 RADAR Imaging Introduction 2 Introduction Active microwave Radar Passive remote sensing systems record electromagnetic energy that was reflected or emitted from the surface of the Earth. There are also
Satellite/Aircraft Imaging Systems Imaging Sensors Standard scanner designs Image data formats
 CEE 6150: Digital Image Processing 1 Satellite/Aircraft Imaging Systems Imaging Sensors Standard scanner designs Image data formats CEE 6150: Digital Image Processing 2 CEE 6150: Digital Image Processing
Spectral Signatures. Vegetation. 40 Soil. Water WAVELENGTH (microns)
") Spectral Signatures % REFLECTANCE VISIBLE NEAR INFRARED Vegetation Soil Water.5. WAVELENGTH (microns). Spectral Reflectance of Urban Materials 5 Parking Lot 5 (5=5%) Reflectance 5 5 5 5 5 Wavelength (nm)
Spectral Signatures % REFLECTANCE VISIBLE NEAR INFRARED Vegetation Soil Water.5. WAVELENGTH (microns). Spectral Reflectance of Urban Materials 5 Parking Lot 5 (5=5%) Reflectance 5 5 5 5 5 Wavelength (nm)
EO Data Today and Application Fields. Denise Petala
 EO Data Today and Application Fields Denise Petala ! IGD GROUP AE "Infotop SA, Geomet Ltd., Dynatools Ltd. "Equipment and know how in many application fields, from surveying till EO data and RS. # Leica,
Lecture Notes Prepared by Prof. J. Francis Spring Remote Sensing Instruments
 Lecture Notes Prepared by Prof. J. Francis Spring 2005 Remote Sensing Instruments Material from Remote Sensing Instrumentation in Weather Satellites: Systems, Data, and Environmental Applications by Rao,
EXAMPLES OF TOPOGRAPHIC MAPS PRODUCED FROM SPACE AND ACHIEVED ACCURACY CARAVAN Workshop on Mapping from Space, Phnom Penh, June 2000
 EXAMPLES OF TOPOGRAPHIC MAPS PRODUCED FROM SPACE AND ACHIEVED ACCURACY CARAVAN Workshop on Mapping from Space, Phnom Penh, June 2000 Jacobsen, Karsten University of Hannover Email: karsten@ipi.uni-hannover.de
US Commercial Imaging Satellites
 US Commercial Imaging Satellites In the early 1990s, Russia began selling 2-meter resolution product from its archives of collected spy satellite imagery. Some of this product was down-sampled to provide
Module 3 Introduction to GIS. Lecture 8 GIS data acquisition
 Module 3 Introduction to GIS Lecture 8 GIS data acquisition GIS workflow Data acquisition (geospatial data input) GPS Remote sensing (satellites, UAV s) LiDAR Digitized maps Attribute Data Management Data
GIS Data Collection. Remote Sensing
 GIS Data Collection Remote Sensing Data Collection Remote sensing Introduction Concepts Spectral signatures Resolutions: spectral, spatial, temporal Digital image processing (classification) Other systems
Abstract Quickbird Vs Aerial photos in identifying man-made objects
 Abstract Quickbird Vs Aerial s in identifying man-made objects Abdullah Mah abdullah.mah@aramco.com Remote Sensing Group, emap Division Integrated Solutions Services Department (ISSD) Saudi Aramco, Dhahran
Introduction to Remote Sensing. Electromagnetic Energy. Data From Wave Phenomena. Electromagnetic Radiation (EMR) Electromagnetic Energy
 Electromagnetic Energy") A Basic Introduction to Remote Sensing (RS) ~~~~~~~~~~ Rev. Ronald J. Wasowski, C.S.C. Associate Professor of Environmental Science University of Portland Portland, Oregon 1 September 2015 Introduction
A Basic Introduction to Remote Sensing (RS) ~~~~~~~~~~ Rev. Ronald J. Wasowski, C.S.C. Associate Professor of Environmental Science University of Portland Portland, Oregon 1 September 2015 Introduction
Remote Sensing. Ch. 3 Microwaves (Part 1 of 2)
") Remote Sensing Ch. 3 Microwaves (Part 1 of 2) 3.1 Introduction 3.2 Radar Basics 3.3 Viewing Geometry and Spatial Resolution 3.4 Radar Image Distortions 3.1 Introduction Microwave (1cm to 1m in wavelength)
Remote Sensing Ch. 3 Microwaves (Part 1 of 2) 3.1 Introduction 3.2 Radar Basics 3.3 Viewing Geometry and Spatial Resolution 3.4 Radar Image Distortions 3.1 Introduction Microwave (1cm to 1m in wavelength)
EE 529 Remote Sensing Techniques. Introduction
 EE 529 Remote Sensing Techniques Introduction Course Contents Radar Imaging Sensors Imaging Sensors Imaging Algorithms Imaging Algorithms Course Contents (Cont( Cont d) Simulated Raw Data y r Processing
High Resolution Sensor Test Comparison with SPOT, KFA1000, KVR1000, IRS-1C and DPA in Lower Saxony
 High Resolution Sensor Test Comparison with SPOT, KFA1000, KVR1000, IRS-1C and DPA in Lower Saxony K. Jacobsen, G. Konecny, H. Wegmann Abstract The Institute for Photogrammetry and Engineering Surveys
Govt. Engineering College Jhalawar Model Question Paper Subject- Remote Sensing & GIS
 Govt. Engineering College Jhalawar Model Question Paper Subject- Remote Sensing & GIS Time: Max. Marks: Q1. What is remote Sensing? Explain the basic components of a Remote Sensing system. Q2. What is
Active microwave systems (1) Satellite Altimetry
 Satellite Altimetry") Remote Sensing: John Wilkin Active microwave systems (1) Satellite Altimetry jwilkin@rutgers.edu IMCS Building Room 214C 732-932-6555 ext 251 Active microwave instruments Scatterometer (scattering from
Remote Sensing: John Wilkin Active microwave systems (1) Satellite Altimetry jwilkin@rutgers.edu IMCS Building Room 214C 732-932-6555 ext 251 Active microwave instruments Scatterometer (scattering from
Synthetic aperture RADAR (SAR) principles/instruments October 31, 2018
 principles/instruments October 31, 2018") GEOL 1460/2461 Ramsey Introduction to Remote Sensing Fall, 2018 Synthetic aperture RADAR (SAR) principles/instruments October 31, 2018 I. Reminder: Upcoming Dates lab #2 reports due by the start of next
GEOL 1460/2461 Ramsey Introduction to Remote Sensing Fall, 2018 Synthetic aperture RADAR (SAR) principles/instruments October 31, 2018 I. Reminder: Upcoming Dates lab #2 reports due by the start of next
Interpreting land surface features. SWAC module 3
 Interpreting land surface features SWAC module 3 Interpreting land surface features SWAC module 3 Different kinds of image Panchromatic image True-color image False-color image EMR : NASA Echo the bat
Radar Imaging Wavelengths
 A Basic Introduction to Radar Remote Sensing ~~~~~~~~~~ Rev. Ronald J. Wasowski, C.S.C. Associate Professor of Environmental Science University of Portland Portland, Oregon 3 November 2015 Radar Imaging
The Global Imager (GLI)
") The Global Imager (GLI) Launch : Dec.14, 2002 Initial check out : to Apr.14, 2003 (~L+4) First image: Jan.25, 2003 Second image: Feb.6 and 7, 2003 Calibration and validation : to Dec.14, 2003(~L+4) for
The Global Imager (GLI) Launch : Dec.14, 2002 Initial check out : to Apr.14, 2003 (~L+4) First image: Jan.25, 2003 Second image: Feb.6 and 7, 2003 Calibration and validation : to Dec.14, 2003(~L+4) for
Remote Sensing: John Wilkin IMCS Building Room 211C ext 251. Active microwave systems (1) Satellite Altimetry
 Satellite Altimetry") Remote Sensing: John Wilkin wilkin@marine.rutgers.edu IMCS Building Room 211C 732-932-6555 ext 251 Active microwave systems (1) Satellite Altimetry Active microwave instruments Scatterometer (scattering
Remote Sensing: John Wilkin wilkin@marine.rutgers.edu IMCS Building Room 211C 732-932-6555 ext 251 Active microwave systems (1) Satellite Altimetry Active microwave instruments Scatterometer (scattering
ROLE OF SATELLITE DATA APPLICATION IN CADASTRAL MAP AND DIGITIZATION OF LAND RECORDS DR.T. RAVISANKAR GROUP HEAD (LRUMG) RSAA/NRSC/ISRO /DOS HYDERABAD
 RSAA/NRSC/ISRO /DOS HYDERABAD") ROLE OF SATELLITE DATA APPLICATION IN CADASTRAL MAP AND DIGITIZATION OF LAND RECORDS DR.T. RAVISANKAR GROUP HEAD (LRUMG) RSAA/NRSC/ISRO /DOS HYDERABAD WORKSHOP on Best Practices under National Land Records
ROLE OF SATELLITE DATA APPLICATION IN CADASTRAL MAP AND DIGITIZATION OF LAND RECORDS DR.T. RAVISANKAR GROUP HEAD (LRUMG) RSAA/NRSC/ISRO /DOS HYDERABAD WORKSHOP on Best Practices under National Land Records
REMOTE SENSING. Topic 10 Fundamentals of Digital Multispectral Remote Sensing MULTISPECTRAL SCANNERS MULTISPECTRAL SCANNERS
 REMOTE SENSING Topic 10 Fundamentals of Digital Multispectral Remote Sensing Chapter 5: Lillesand and Keifer Chapter 6: Avery and Berlin MULTISPECTRAL SCANNERS Record EMR in a number of discrete portions
Introduction to Remote Sensing
 Introduction to Remote Sensing Outline Remote Sensing Defined Resolution Electromagnetic Energy (EMR) Types Interpretation Applications Remote Sensing Defined Remote Sensing is: The art and science of
Introduction of Satellite Remote Sensing
 Introduction of Satellite Remote Sensing Spatial Resolution (Pixel size) Spectral Resolution (Bands) Resolutions of Remote Sensing 1. Spatial (what area and how detailed) 2. Spectral (what colors bands)
Active and Passive Microwave Remote Sensing
 Active and Passive Microwave Remote Sensing Passive remote sensing system record EMR that was reflected (e.g., blue, green, red, and near IR) or emitted (e.g., thermal IR) from the surface of the Earth.
Philpot & Philipson: Remote Sensing Fundamentals Scanners 8.1 W.D. Philpot, Cornell University, Fall 2015
 Philpot & Philipson: Remote Sensing Fundamentals Scanners 8.1 8. SCANNERS 8.1 General Scanners are scanning radiometers which, when operated from an airborne or spaceborne platform, image the terrain in
Final Examination Introduction to Remote Sensing. Time: 1.5 hrs Max. Marks: 50. Section-I (50 x 1 = 50 Marks)
") Final Examination Introduction to Remote Sensing Time: 1.5 hrs Max. Marks: 50 Note: Attempt all questions. Section-I (50 x 1 = 50 Marks) 1... is the technology of acquiring information about the Earth's
Final Examination Introduction to Remote Sensing Time: 1.5 hrs Max. Marks: 50 Note: Attempt all questions. Section-I (50 x 1 = 50 Marks) 1... is the technology of acquiring information about the Earth's
ACTIVE SENSORS RADAR
 ACTIVE SENSORS RADAR RADAR LiDAR: Light Detection And Ranging RADAR: RAdio Detection And Ranging SONAR: SOund Navigation And Ranging Used to image the ocean floor (produce bathymetic maps) and detect objects
Chapter 8. Remote sensing
 1. Remote sensing 8.1 Introduction 8.2 Remote sensing 8.3 Resolution 8.4 Landsat 8.5 Geostationary satellites GOES 8.1 Introduction What is remote sensing? One can describe remote sensing in different
Coral Reef Remote Sensing
 Coral Reef Remote Sensing Spectral, Spatial, Temporal Scaling Phillip Dustan Sensor Spatial Resolutio n Number of Bands Useful Bands coverage cycle Operation Landsat 80m 2 2 18 1972-97 Thematic 30m 7
The studies began when the Tiros satellites (1960) provided man s first synoptic view of the Earth s weather systems.
 provided man s first synoptic view of the Earth s weather systems.") Remote sensing of the Earth from orbital altitudes was recognized in the mid-1960 s as a potential technique for obtaining information important for the effective use and conservation of natural resources.
Remote sensing of the Earth from orbital altitudes was recognized in the mid-1960 s as a potential technique for obtaining information important for the effective use and conservation of natural resources.
3/31/03. ESM 266: Introduction 1. Observations from space. Remote Sensing: The Major Source for Large-Scale Environmental Information
 Remote Sensing: The Major Source for Large-Scale Environmental Information Jeff Dozier Observations from space Sun-synchronous polar orbits Global coverage, fixed crossing, repeat sampling Typical altitude
Platforms, Sensors & Data Products
 Platforms, Sensors & Data Products Introduction Remote sensing is defined as the science which deals with obtaining information about objects on earth surface by analysis of data, received from a remote
REMOTE SENSING FOR FLOOD HAZARD STUDIES.
 REMOTE SENSING FOR FLOOD HAZARD STUDIES. OPTICAL SENSORS. 1 DRS. NANETTE C. KINGMA 1 Optical Remote Sensing for flood hazard studies. 2 2 Floods & use of remote sensing. Floods often leaves its imprint
Microwave Remote Sensing
 Provide copy on a CD of the UCAR multi-media tutorial to all in class. Assign Ch-7 and Ch-9 (for two weeks) as reading material for this class. HW#4 (Due in two weeks) Problems 1,2,3 and 4 (Chapter 7)
Remote Sensing and GIS
 Remote Sensing and GIS Atmosphere Reflected radiation, e.g. Visible Emitted radiation, e.g. Infrared Backscattered radiation, e.g. Radar (λ) Visible TIR Radar & Microwave 11/9/2017 Geo327G/386G, U Texas,
Part I. The Importance of Image Registration for Remote Sensing
 Part I The Importance of Image Registration for Remote Sensing 1 Introduction jacqueline le moigne, nathan s. netanyahu, and roger d. eastman Despite the importance of image registration to data integration
KOMPSAT Constellation. November 2012 Satrec Initiative
 KOMPSAT Constellation November 2012 Satrec Initiative KOMPSAT Constellation KOMPSAT National program Developed and operated by KARI (Korea Aerospace Research Institute) Dual use : Government & commercial
RADAR REMOTE SENSING
 RADAR REMOTE SENSING Jan G.P.W. Clevers & Steven M. de Jong Chapter 8 of L&K 1 Wave theory for the EMS: Section 1.2 of L&K E = electrical field M = magnetic field c = speed of light : propagation direction
1. Theory of remote sensing and spectrum
 1. Theory of remote sensing and spectrum 7 August 2014 ONUMA Takumi Outline of Presentation Electromagnetic wave and wavelength Sensor type Spectrum Spatial resolution Spectral resolution Mineral mapping
Introduction to Remote Sensing
 Introduction to Remote Sensing Daniel McInerney Urban Institute Ireland, University College Dublin, Richview Campus, Clonskeagh Drive, Dublin 14. 16th June 2009 Presentation Outline 1 2 Spaceborne Sensors
Remote Sensing for Rangeland Applications
 Remote Sensing for Rangeland Applications Jay Angerer Ecological Training June 16, 2012 Remote Sensing The term "remote sensing," first used in the United States in the 1950s by Ms. Evelyn Pruitt of the
Monitoring agricultural plantations with remote sensing imagery
 MPRA Munich Personal RePEc Archive Monitoring agricultural plantations with remote sensing imagery Camelia Slave and Anca Rotman University of Agronomic Sciences and Veterinary Medicine - Bucharest Romania,
(Refer Slide Time: 1:28)
") Introduction to Remote Sensing Dr. Arun K Saraf Department of Earth Sciences Indian Institute of Technology Roorkee Lecture 10 Image characteristics and different resolutions in Remote Sensing Hello everyone,
Introduction to Remote Sensing Dr. Arun K Saraf Department of Earth Sciences Indian Institute of Technology Roorkee Lecture 10 Image characteristics and different resolutions in Remote Sensing Hello everyone,
Acknowledgment. Process of Atmospheric Radiation. Atmospheric Transmittance. Microwaves used by Radar GMAT Principles of Remote Sensing
 GMAT 9600 Principles of Remote Sensing Week 4 Radar Background & Surface Interactions Acknowledgment Mike Chang Natural Resources Canada Process of Atmospheric Radiation Dr. Linlin Ge and Prof Bruce Forster
CHARACTERISTICS OF VERY HIGH RESOLUTION OPTICAL SATELLITES FOR TOPOGRAPHIC MAPPING
 CHARACTERISTICS OF VERY HIGH RESOLUTION OPTICAL SATELLITES FOR TOPOGRAPHIC MAPPING K. Jacobsen Leibniz University Hannover, Institute of Photogrammetry and Geoinformation jacobsen@ipi.uni-hannover.de Commission
LE/ESSE Payload Design
 LE/ESSE4360 - Payload Design 3.2 Spacecraft Sensors Introduction to Sensors Earth, Moon, Mars, and Beyond Dr. Jinjun Shan, Professor of Space Engineering Department of Earth and Space Science and Engineering
Radiometric performance of Second Generation Global Imager (SGLI) using integrating sphere
 using integrating sphere") Radiometric performance of Second Generation Global Imager (SGLI) using integrating sphere Taichiro Hashiguchi, Yoshihiko Okamura, Kazuhiro Tanaka, Yukinori Nakajima Japan Aerospace Exploration Agency
Radiometric performance of Second Generation Global Imager (SGLI) using integrating sphere Taichiro Hashiguchi, Yoshihiko Okamura, Kazuhiro Tanaka, Yukinori Nakajima Japan Aerospace Exploration Agency
Introduction to Remote Sensing Part 1
 Introduction to Remote Sensing Part 1 A Primer on Electromagnetic Radiation Digital, Multi-Spectral Imagery The 4 Resolutions Displaying Images Corrections and Enhancements Passive vs. Active Sensors Radar
Remote Sensing. Measuring an object from a distance. For GIS, that means using photographic or satellite images to gather spatial data
 Remote Sensing Measuring an object from a distance For GIS, that means using photographic or satellite images to gather spatial data Remote Sensing measures electromagnetic energy reflected or emitted
INF-GEO Introduction to remote sensing
 INF-GEO 4310 Introduction to remote sensing Anne Solberg (anne@ifi.uio.no) Satellites, orbits and repeat cycles Optical remote sensings Based on a tutorial adapted from Canadian Center for Remote Sensing,
Outline for today. Geography 411/611 Remote sensing: Principles and Applications. Remote sensing: RS for biogeochemical cycles
 Geography 411/611 Remote sensing: Principles and Applications Thomas Albright, Associate Professor Laboratory for Conservation Biogeography, Department of Geography & Program in Ecology, Evolution, & Conservation
Geostationary satellites
 Polar satellites 800 km. 99 relative to the Equator S-N during ascending leg & N-S during descending leg Each orbit 100 minutes 14 orbits a day. Sun-Synchronous provides consistent lighting of Earth-scan
John P. Stevens HS: Remote Sensing Test
 Name(s): Date: Team name: John P. Stevens HS: Remote Sensing Test 1 Scoring: Part I - /18 Part II - /40 Part III - /16 Part IV - /14 Part V - /93 Total: /181 2 I. History (3 pts. each) 1. What is the name
Remote Sensing of the Environment An Earth Resource Perspective John R. Jensen Second Edition
 Remote Sensing of the Environment An Earth Resource Perspective John R. Jensen Second Edition Pearson Education Limited Edinburgh Gate Harlow Essex CM20 2JE England and Associated Companies throughout
9/12/2011. Training Course Remote Sensing Basic Theory & Image Processing Methods September 2011
 Training Course Remote Sensing Basic Theory & Image Processing Methods 19 23 September 2011 Introduction to Remote Sensing Michiel Damen (September 2011) damen@itc.nl 1 Overview Some definitions Remote
Advanced Optical Satellite (ALOS-3) Overviews
 Overviews") K&C Science Team meeting #24 Tokyo, Japan, January 29-31, 2018 Advanced Optical Satellite (ALOS-3) Overviews January 30, 2018 Takeo Tadono 1, Hidenori Watarai 1, Ayano Oka 1, Yousei Mizukami 1, Junichi
K&C Science Team meeting #24 Tokyo, Japan, January 29-31, 2018 Advanced Optical Satellite (ALOS-3) Overviews January 30, 2018 Takeo Tadono 1, Hidenori Watarai 1, Ayano Oka 1, Yousei Mizukami 1, Junichi
How to Access Imagery and Carry Out Remote Sensing Analysis Using Landsat Data in a Browser
 How to Access Imagery and Carry Out Remote Sensing Analysis Using Landsat Data in a Browser Including Introduction to Remote Sensing Concepts Based on: igett Remote Sensing Concept Modules and GeoTech
Leica ADS80 - Digital Airborne Imaging Solution NAIP, Salt Lake City 4 December 2008
 Luzern, Switzerland, acquired at 5 cm GSD, 2008. Leica ADS80 - Digital Airborne Imaging Solution NAIP, Salt Lake City 4 December 2008 Shawn Slade, Doug Flint and Ruedi Wagner Leica Geosystems AG, Airborne
A map says to you, 'Read me carefully, follow me closely, doubt me not.' It says, 'I am the Earth in the palm of your hand. Without me, you are alone
 A map says to you, 'Read me carefully, follow me closely, doubt me not.' It says, 'I am the Earth in the palm of your hand. Without me, you are alone and lost. Beryl Markham (West With the Night, 1946
Remote sensing in archaeology from optical to lidar. Krištof Oštir ModeLTER Scientific Research Centre of the Slovenian Academy of Sciences and Arts
 Remote sensing in archaeology from optical to lidar Krištof Oštir ModeLTER Scientific Research Centre of the Slovenian Academy of Sciences and Arts Introduction Optical remote sensing Systems Search for
Prototype Software-based Receiver for Remote Sensing using Reflected GPS Signals. Dinesh Manandhar The University of Tokyo
 Prototype Software-based Receiver for Remote Sensing using Reflected GPS Signals Dinesh Manandhar The University of Tokyo dinesh@qzss.org 1 Contents Background Remote Sensing Capability System Architecture