Sensors and Data Interpretation II. Michael Horswell
|
|
|
- Noreen Theresa Rose
- 5 years ago
- Views:
Transcription

1 Sensors and Data Interpretation II Michael Horswell
2 Defining remote sensing 1. When was the last time you did any remote sensing? acquiring information about something without direct contact 2. What are the requirements for remote sensing to possible? - ability to detect something that defines the characteristics of what is being observed, - electromagnetic radiation (EMR) that objects either emit or reflect
3 The problematic view from space Unlimited perspectives on ourselves, the world and the cosmos around us Benefits cannot be over estimated Deployed against the environmental threat, to prevent new ecological and economic falling dominoes and enhance global security Rather than being embedded participants in the reality depicted, earth system scientists become disengaged observers of that reality When quantifiability monopolizes the mantle of legitimacy, qualitative values are given short shrift Decontextualization


4
5 A refined (formal) definition Remote sensing is the practice of deriving information about the Earth s land and water surfaces using images acquired from an overhead perspective, by employing electromagnetic radiation in one or more regions of the electromagnetic spectrum, reflected or emitted from the Earth s surface (Campbell 2006 p. 6)
6 History of remote sensing
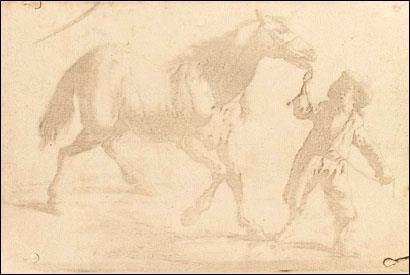
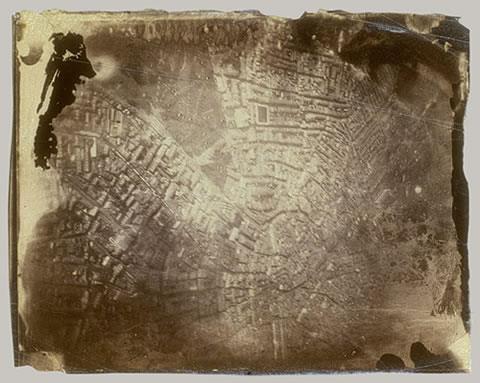
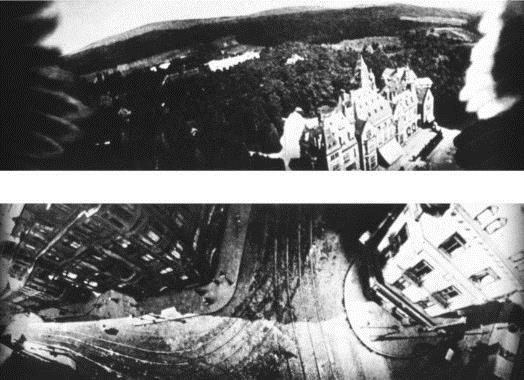
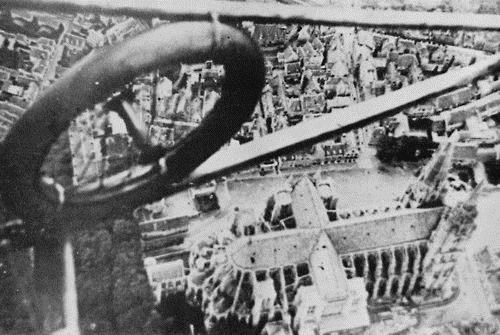
7 1825: Photography 1956: Infra-red & plant health 1972: Landsat : From balloons : WWII: Non-visible radiation 1980s: Hyperspectral RS 1873: Electromagnetism The Great Depression 1990s: Hi-Res spaceborne images 1909: Airplanes 1914: WWI reconnaissance Present: Global RS systems & LiDAR
8
9 Interpreting images
10 Why interpret images? Classification: assigning discernible areas or features to classes Enumeration: counting or listing discrete items visible on an image Measurement: photogrammetry applying knowledge of image geometry to the derivation of accurate measurement Delineation: defining observable regions
11 Methods of interpretation Field observations If knowledge of interpreter is inadequate, a field visit may be required Field visits are routine as a method of checking accuracy Direct recognition Qualitative, subjective interpretation based on experience, skill and judgement Interpretation by inference Using an observable characteristics to infer the presence on a non-observable characteristic e.g. using landform and vegetation to infer soil characteristics
12 Methods of interpretation Probabilistic interpretation Integrating other information into the interpretation process, e.g. knowledge of crop rotation and crop calendar can help to identify the crop growing in a region if winter wheat is harvested in June, the crop on your August image is unlikely to be wheat A decision rule is created which expresses the knowledge as a probability, e.g. there is only a 2% probability that the crop is wheat
13 Methods of interpretation Deterministic interpretation Based on quantitative relationships inherent in the imagery itself, e.g. using stereo imagery pairs to develop elevation data Image interpretation will more than likely involve a mixture of interpretative strategies


 Shadow: gives clues to the profile, and")


14 Elements of interpretation Tone: refers to shades of grey (B&W) or colours in the image. Tone of the same feature type may vary seasonally. Texture: the result of changes in tone, or the arrangement of tone on a landscape (described as e.g. fine, medium, or coarse) Shadow: gives clues to the profile, and shape of landscape features but can obscure detail in other features, as well as alter the spectral signature of other features Pattern: the arrangement of objects into recurrent forms can facilitate their recognition Shape: is an important clue to identifying an object and helps, in particular, to distinguish between constructed and natural features Size: relative size - the size of an unknown object in relation to the size of a known object; absolute size - the actual size of a landscape features Association: some types of features can be identified despite no compliance with any other interpretative element, but through relationships with identifiable features
15 Convergence of evidence Image interpretation is a deductive process Features that can be detected and identified lead the interpreter to the location and identification of other features Deductive interpretation requires either the conscious or unconscious consideration of all of the elements of image interpretation The completeness and accuracy of an interpretation is related to the interpreter s understanding of the "how and the why" of the elements, and the techniques and methods of interpretation This is convergence of evidence combination of knowledge, expertise, image elements, interpretative strategies to come up with a defensible interpretation


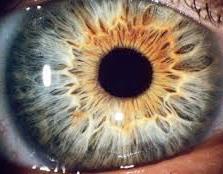
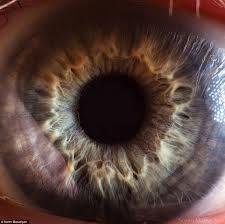
16 People vs. computers Jelly bean that made the news People are extremely good at image interpretation pattern seeking and recognition Believed to have significant evolutionary value at little cost Computers are more sceptical
17 When is enough proof enough? A definitive determination of landcover based on remotely sensed data is achieved when all relevant elements of interpretative process have been considered, and the assessment of no single element stands in strong contradiction to the overall assessment
18 More than meets the eye: Multispectral imagery
 to gamma rays (high frequency, short")
19 The electromagnetic spectrum Continuous range of electromagnetic radiation from radio waves (low frequency, long wavelengths) to gamma rays (high frequency, short wavelengths)


20 Reflection and absorption Objects reflect and absorb different parts of the EMS The combination of these generates a set of observable characteristics that allow us to identify the object


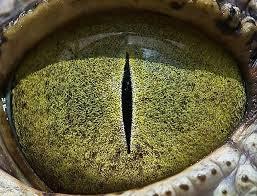
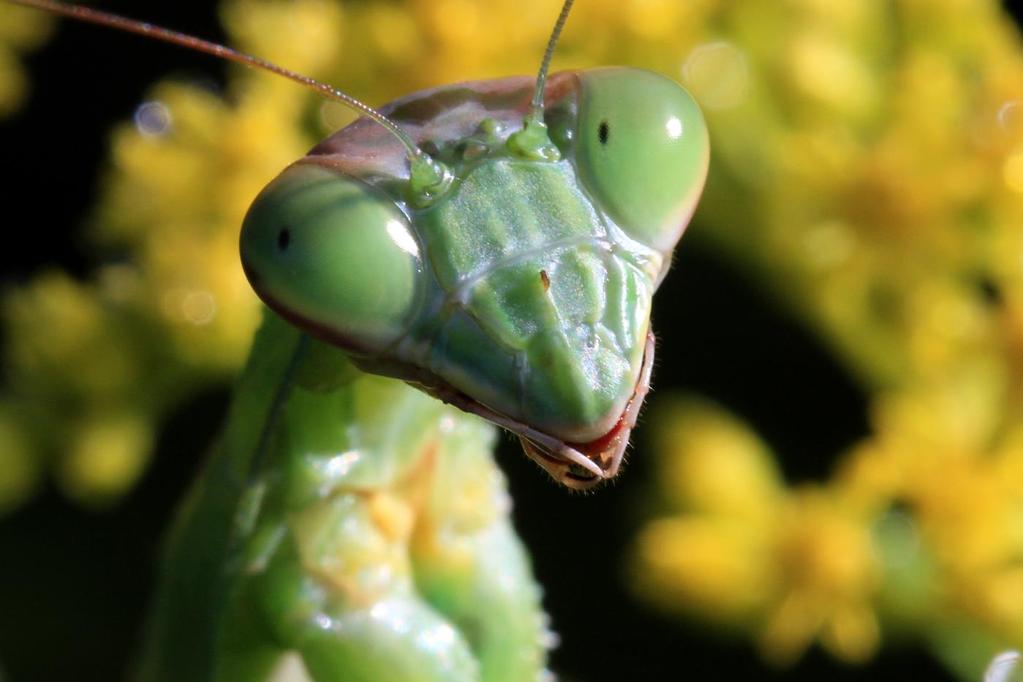
21 Beyond the visible Although we cannot see outside of the visible spectrum, we can detect these wavelengths using sensors Pictures depict flowers refection in the UV part of the spectrum bee s eye view
22 Spectral signatures The particular reflectance and absorption characteristics of EM radiation from the surface of an object is called its spectral signature All surfaces on earth have a specific spectral signature A surface type or material can be identified if the sensor has adequate spectral resolution do distinguish it from other materials The spectral signature of an object is a plot of the fraction of radiation reflected as a function of the incident wavelength
23 Multispectral imagery Measures of radiation in more than one part of the spectrum not only the visible part Each part in which measurement occurs is called a spectral band - a discrete part of the EMR spectrum Spectral bands of satellite-based remote sensors have been selected to enable the discrimination of major surface materials The specific parts of the EMR spectrum that a sensor can detect is called its spectral resolution
 6 1.57-1.65 Short-wave infrared (SWIR) 1 7 2.11-2.29 Short-wave infrared (SWIR) 2 8 0.5-0.68 Panchromatic 9 1.36-1.38 Cirrus 10 10.")
 5 1.55-1.75 Short-wave infrared (SWIR) 1 7 2.09-2.35 Short-wave infrared (SWIR) 2 8 0.52-0.90 Panchromatic - - 6 10.4-12.")
24 Landsat spectral bands Landsat 8: OLI & TIRS Band Wavelength EMS Area / Target Coastal aerosol Blue Green Red Near infrared (NIR) Short-wave infrared (SWIR) Short-wave infrared (SWIR) Panchromatic Cirrus TIRS TIRS 2 Landsat 4,5: TM & Landat 7: ETM+ Band Wavelength EMS Area / Target Blue Green Red Near infrared (NIR) Short-wave infrared (SWIR) Short-wave infrared (SWIR) Panchromatic Thermal Infrared

25 Spectral response curves Represent the reflectance of target objects across the EMS Define the objects due to the characteristic reflectance of objects Equivalent to tone in traditional image interpretation


26 Vegetation reflectance Chlorophyll absorbs red and blue parts of the visible spectrum Palisade mesophyll grouped as it is, means green light is reflected Chlorophyll transmits NIR, but the arrangement of cells in the spongy mesophyll layer causes high reflection in NIR
27 Characteristic reflectance Feature Water Bodies Soil Vegetation Man-Made Materials Snow and Ice Reflectance Response Generally reflect high in the visible spectrum, however, clearer water has less reflectance than turbid water. In the Near IR and Mid-IR regions water increasingly absorbs the light making it darker. This is dependent upon water depth and wavelength. Increasing amounts of dissolved inorganic materials in water bodies tend to shift the peak of visible reflectance toward the red region from the green region (clearer water) of the spectrum. Northern latitudes have black soils and tropical regions have red soils. Soil reflectance decreases as organic matter increases. As soil moisture increases, reflectance of soil decreases at all wavelengths. Texture of soil will cause increased reflectance with decreased particle size, i.e., the bigger particles (rocks, sand, and soils) basically cast a larger shadow. The spectral reflectance is based on the chlorophyll and water absorption in the leaf. Needles have a darker response than leaves. There will be various shades of vegetation based on type, leaf structure, moisture content and health of the plant. Healthy vegetation has high IR reflectance decreases with plant stress. Concrete and asphalt both display spectral curves that generally increase from the visible through the Near IR and Mid-IR regions. However, as concrete ages, it becomes darker and as asphalt ages it becomes lighter. Old snow may develop a compacted crust and the moisture content increases which make it less reflective in the Near IR and Mid-IR region. It is possible to compare old and new snow by its Mid-IR reflectance. GIS & Remote Sensing Applications 27


28 Visualizing non-visible wavelengths Band 2 Band 3 Band4 Band5 Band6 Band7
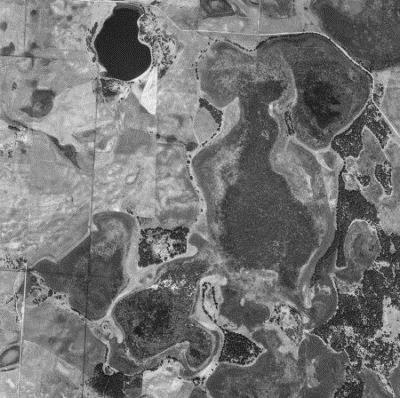
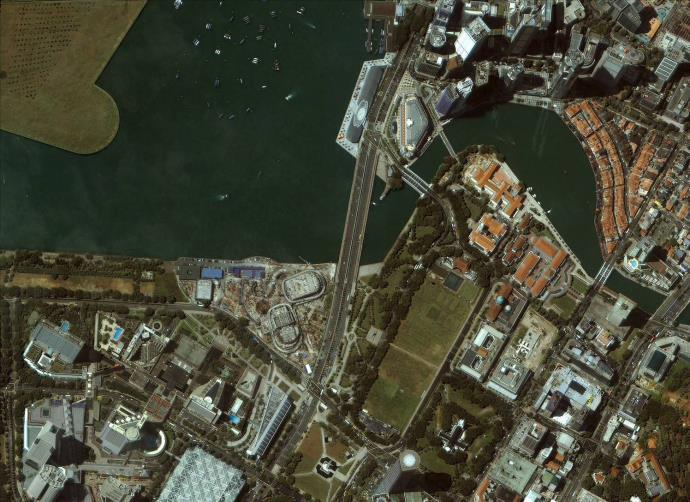
29 Band combination: 432 The "natural colour" band combination Because the visible bands are used in this combination, ground features appear in colours similar to their appearance to the human visual system, healthy vegetation is green, recently cleared fields are very light, unhealthy vegetation is brown and yellow, roads are grey, and shorelines are white This band combination provides the most water penetration and superior sediment and bathymetric information, it is also used for urban studies Cleared and sparsely vegetated areas are not as easily detected here as in the 562 or 543 combination Clouds and snow appear white and are difficult to distinguish Vegetation types are not as easily distinguished as the 562 combination The 432 combination does not distinguish shallow water from soil as well as the 764 combination does
30 Band combination: 432
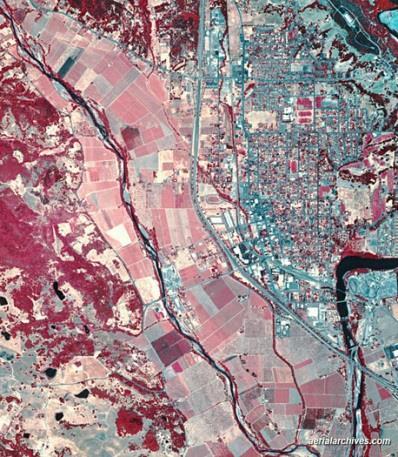
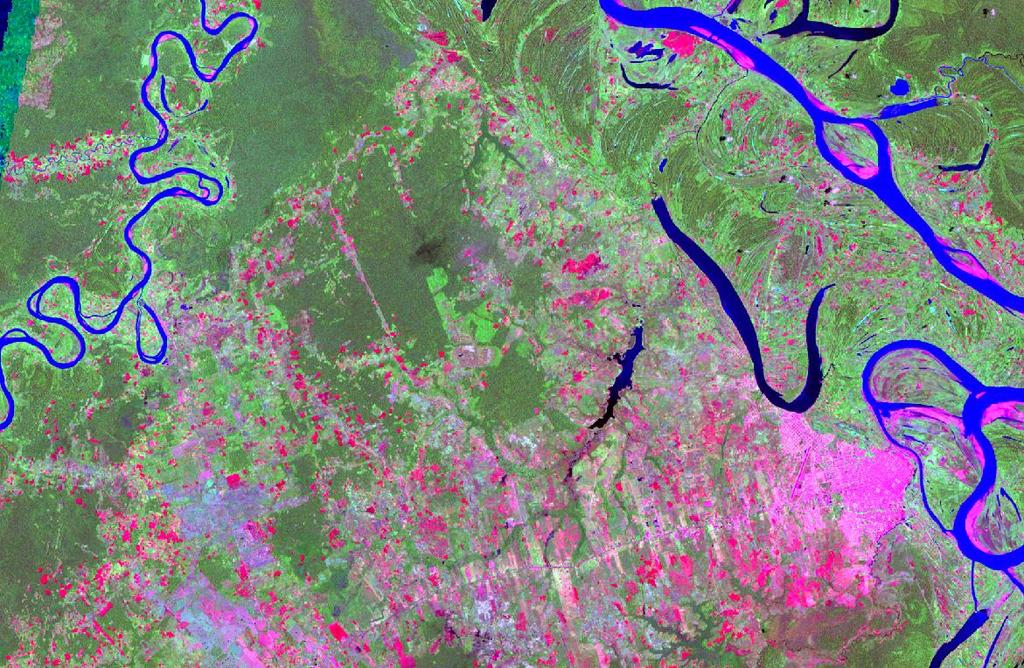
31 Band Combination: 543 The standard "false colour" composite Vegetation appears in shades of red, urban areas are cyan blue, and soils vary from dark to light browns Coniferous trees will appear darker red than hardwoods Deep red hues indicate broad leaf and/or healthier vegetation while lighter reds signify grasslands or sparsely vegetated areas Ice, snow and clouds are white or light cyan Urban areas are shown in light blue This band combination gives results similar to traditional colour infrared aerial photography This band combination is useful for vegetation studies, monitoring drainage and soil patterns and various stages of crop growth.
32 Band Combination: 543
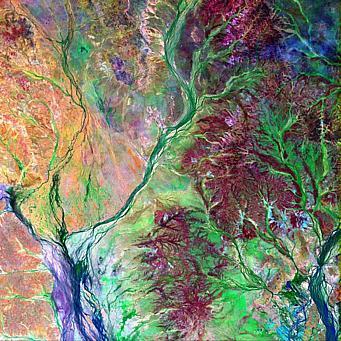
33 Band Combination: 562 Healthy vegetation appears in shades of reds, browns, oranges and yellows Soils may be in greens and browns, urban features are white, cyan and grey, bright blue areas represent recently clear-cut areas and reddish areas show new vegetation growth, probably sparse grasslands Clear, deep water will be very dark in this combination, if the water is shallow or contains sediments it would appear as shades of lighter blue The addition of the Mid-IR band increases sensitivity of detecting various stages of plant growth or stress; however care must be taken in interpretation if acquisition closely follows precipitation Use of OLI5 and OLI6 shows high reflectance in healthy vegetated areas Compare flooded areas and red vegetated areas with the corresponding colours in the 432 combination to assure correct interpretation
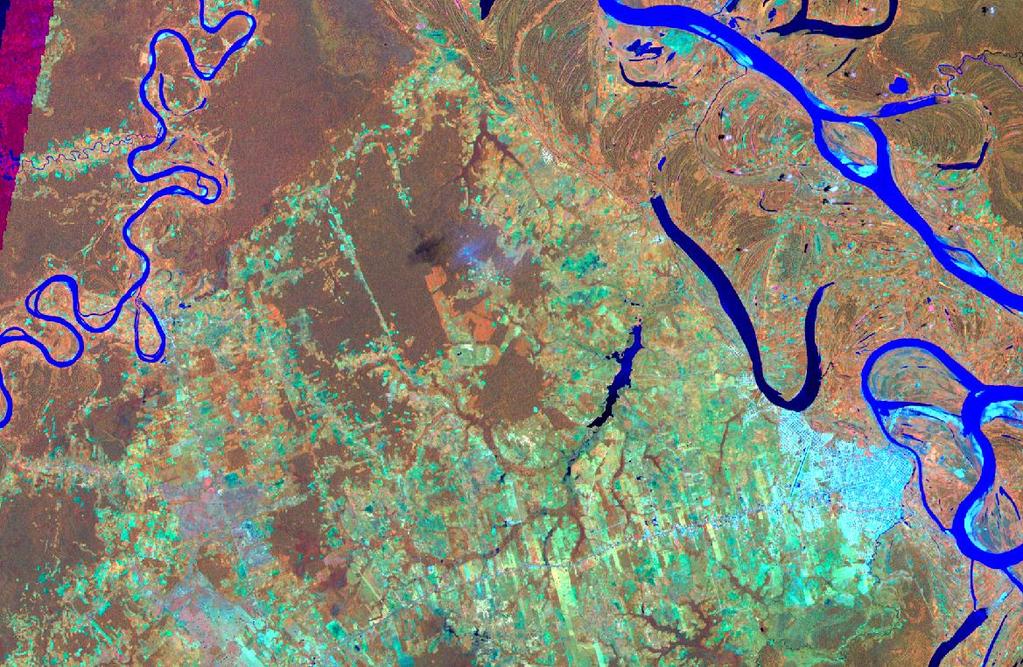
34 Band Combination: 562
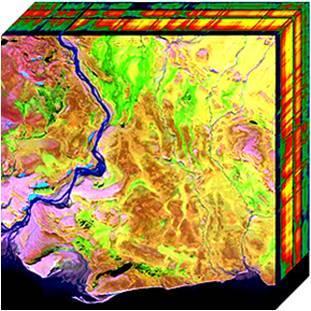
35 Band Combinations: 564 This combination offers added definition of land-water boundaries and highlights subtle details not readily apparent in the visible bands alone Inland lakes and streams can be located with greater precision when more infrared bands are used Vegetation type and condition show as variations of hues (browns, greens and oranges), as well as in tone Demonstrates moisture differences and is useful for analysis of soil and vegetation conditions. Generally, the wetter the soil, the darker it appears, because of the infrared absorption capabilities of water.
36 Band Combination: 564
37 Band Combination: 753 Penetrates atmospheric particles and smoke. Healthy vegetation will be a bright green and can saturate in seasons of heavy growth, grasslands will appear green, pink areas represent barren soil Dry vegetation will be orange and water will be blue Sands, soils and minerals are highlighted in a multitude of colours It is useful for geological, agricultural and wetland studies Fires would appear red. This combination is used in the fire management applications for post-fire analysis. Urban areas appear in varying shades of magenta Grasslands appear as light green. The light-green spots inside cities indicate grassy land cover - parks, cemeteries, golf courses Olive-green to bright-green hues normally indicate forested areas with coniferous forest being darker green than deciduous.
38 Band Combination: 753
39 Band Combination: 764 Penetrates atmospheric particles, smoke and haze Vegetation appears in shades of dark and light green during the growing season, urban features are white, grey, cyan or purple; sands, soils and minerals appear in a variety of colours Provides well defined coast lines and highlighted sources of water within the image. Snow and ice appear as dark blue Hot surfaces such as forest fires and volcano calderas saturate the Mid-IR bands and appear in shades of red or yellow Flooded areas should look very dark blue or black, compared with the 432 combination in which shallow flooded regions are difficult to distinguish.
40 Band Combination: 764
41 Band Combination: 765 This combination involves no visible bands It provides the best atmospheric penetration Coast lines and shores are well defined It may be used to find textural and moisture characteristics of soils Vegetation appears blue This band combination can be useful for geological studies
42 Band Combination: 765
43 Band Combination: 654 This combination provides the user with a great amount of information and colour contrast Healthy vegetation is bright green and soils are mauve Use of Band 6 ensure maximal agricultural information This combination is useful for vegetation studies, and is widely used in the areas of timber management and pest infestation
44 Band Combination: 654
45 Remember CONVERGENCE OF EVIDENCE Spectral response alone may not be enough to determine the characteristics of an observed object
Interpreting land surface features. SWAC module 3
 Interpreting land surface features SWAC module 3 Interpreting land surface features SWAC module 3 Different kinds of image Panchromatic image True-color image False-color image EMR : NASA Echo the bat
746A27 Remote Sensing and GIS. Multi spectral, thermal and hyper spectral sensing and usage
 746A27 Remote Sensing and GIS Lecture 3 Multi spectral, thermal and hyper spectral sensing and usage Chandan Roy Guest Lecturer Department of Computer and Information Science Linköping University Multi
An Introduction to Remote Sensing & GIS. Introduction
 An Introduction to Remote Sensing & GIS Introduction Remote sensing is the measurement of object properties on Earth s surface using data acquired from aircraft and satellites. It attempts to measure something
Introduction to Remote Sensing
 Introduction to Remote Sensing Outline Remote Sensing Defined Resolution Electromagnetic Energy (EMR) Types Interpretation Applications Remote Sensing Defined Remote Sensing is: The art and science of
Figure 1: Percent reflectance for various features, including the five spectra from Table 1, at different wavelengths from 0.4µm to 1.4µm.
 Section 1: The Electromagnetic Spectrum 1. The wavelength range that has the highest reflectance for broadleaf vegetation and needle leaf vegetation is 0.75µm to 1.05µm. 2. Dry soil can be distinguished
REMOTE SENSING. Topic 10 Fundamentals of Digital Multispectral Remote Sensing MULTISPECTRAL SCANNERS MULTISPECTRAL SCANNERS
 REMOTE SENSING Topic 10 Fundamentals of Digital Multispectral Remote Sensing Chapter 5: Lillesand and Keifer Chapter 6: Avery and Berlin MULTISPECTRAL SCANNERS Record EMR in a number of discrete portions
Aerial Photo Interpretation
 Aerial Photo Interpretation Aerial Photo Interpretation To date, course has focused on skills of photogrammetry Scale Distance Direction Area Height There s another side to Aerial Photography: Interpretation
FOR 353: Air Photo Interpretation and Photogrammetry. Lecture 2. Electromagnetic Energy/Camera and Film characteristics
 FOR 353: Air Photo Interpretation and Photogrammetry Lecture 2 Electromagnetic Energy/Camera and Film characteristics Lecture Outline Electromagnetic Radiation Theory Digital vs. Analog (i.e. film ) Systems
NON-PHOTOGRAPHIC SYSTEMS: Multispectral Scanners Medium and coarse resolution sensor comparisons: Landsat, SPOT, AVHRR and MODIS
 NON-PHOTOGRAPHIC SYSTEMS: Multispectral Scanners Medium and coarse resolution sensor comparisons: Landsat, SPOT, AVHRR and MODIS CLASSIFICATION OF NONPHOTOGRAPHIC REMOTE SENSORS PASSIVE ACTIVE DIGITAL
Viewing New Hampshire from Space
 Viewing New Hampshire from Space A Bird s-eye View of the Granite State! Introduction Environmental changes are a major concern for researchers and policy makers today since these changes have both human
GIS Data Collection. Remote Sensing
 GIS Data Collection Remote Sensing Data Collection Remote sensing Introduction Concepts Spectral signatures Resolutions: spectral, spatial, temporal Digital image processing (classification) Other systems
Aerial photography and Remote Sensing. Bikini Atoll, 2013 (60 years after nuclear bomb testing)
") Aerial photography and Remote Sensing Bikini Atoll, 2013 (60 years after nuclear bomb testing) Computers have linked mapping techniques under the umbrella term : Geomatics includes all the following spatial
Aerial photography and Remote Sensing Bikini Atoll, 2013 (60 years after nuclear bomb testing) Computers have linked mapping techniques under the umbrella term : Geomatics includes all the following spatial
REMOTE SENSING INTERPRETATION
 REMOTE SENSING INTERPRETATION Jan Clevers Centre for Geo-Information - WU Remote Sensing --> RS Sensor at a distance EARTH OBSERVATION EM energy Earth RS is a tool; one of the sources of information! 1
NRS 415 Remote Sensing of Environment
 NRS 415 Remote Sensing of Environment 1 High Oblique Perspective (Side) Low Oblique Perspective (Relief) 2 Aerial Perspective (See What s Hidden) An example of high spatial resolution true color remote
Outline Remote Sensing Defined Resolution Electromagnetic Energy (EMR) Types Interpretation Applications
 Types Interpretation Applications") Introduction to Remote Sensing Outline Remote Sensing Defined Resolution Electromagnetic Energy (EMR) Types Interpretation Applications Remote Sensing Defined Remote Sensing is: The art and science of
Introduction to Remote Sensing Outline Remote Sensing Defined Resolution Electromagnetic Energy (EMR) Types Interpretation Applications Remote Sensing Defined Remote Sensing is: The art and science of
Monitoring agricultural plantations with remote sensing imagery
 MPRA Munich Personal RePEc Archive Monitoring agricultural plantations with remote sensing imagery Camelia Slave and Anca Rotman University of Agronomic Sciences and Veterinary Medicine - Bucharest Romania,
Introduction to Remote Sensing
 Introduction to Remote Sensing 1 Outline Remote Sensing Defined Electromagnetic Energy (EMR) Resolution Interpretation 2 Remote Sensing Defined Remote Sensing is: The art and science of obtaining information
Remote sensing in archaeology from optical to lidar. Krištof Oštir ModeLTER Scientific Research Centre of the Slovenian Academy of Sciences and Arts
 Remote sensing in archaeology from optical to lidar Krištof Oštir ModeLTER Scientific Research Centre of the Slovenian Academy of Sciences and Arts Introduction Optical remote sensing Systems Search for
Outline Remote Sensing Defined Resolution Electromagnetic Energy (EMR) Types Interpretation Applications 2
 Types Interpretation Applications 2") Introduction to Remote Sensing 1 Outline Remote Sensing Defined Resolution Electromagnetic Energy (EMR) Types Interpretation Applications 2 Remote Sensing Defined Remote Sensing is: The art and science
Introduction to Remote Sensing 1 Outline Remote Sensing Defined Resolution Electromagnetic Energy (EMR) Types Interpretation Applications 2 Remote Sensing Defined Remote Sensing is: The art and science
IKONOS High Resolution Multispectral Scanner Sensor Characteristics
 High Spatial Resolution and Hyperspectral Scanners IKONOS High Resolution Multispectral Scanner Sensor Characteristics Launch Date View Angle Orbit 24 September 1999 Vandenberg Air Force Base, California,
Sommersemester Prof. Dr. Christoph Kleinn Institut für Waldinventur und Waldwachstum Arbeitsbereich Fernerkundung und Waldinventur.
 Basics of Remote Sensing Some literature references Franklin, SE 2001 Remote Sensing for Sustainable Forest Management Lewis Publishers 407p Lillesand, Kiefer 2000 Remote Sensing and Image Interpretation
The (False) Color World
 Color World") There s more to the world than meets the eye In this activity, your group will explore: The Value of False Color Images Different Types of Color Images The Use of Contextual Clues for Feature Identification
There s more to the world than meets the eye In this activity, your group will explore: The Value of False Color Images Different Types of Color Images The Use of Contextual Clues for Feature Identification
Present and future of marine production in Boka Kotorska
 Present and future of marine production in Boka Kotorska First results from satellite remote sensing for the breeding areas of filter feeders in the Bay of Kotor INTRODUCTION Environmental monitoring is
Remote Sensing in Daily Life. What Is Remote Sensing?
 Remote Sensing in Daily Life What Is Remote Sensing? First time term Remote Sensing was used by Ms Evelyn L Pruitt, a geographer of US in mid 1950s. Minimal definition (not very useful): remote sensing
Lecture 13: Remotely Sensed Geospatial Data
 Lecture 13: Remotely Sensed Geospatial Data A. The Electromagnetic Spectrum: The electromagnetic spectrum (Figure 1) indicates the different forms of radiation (or simply stated light) emitted by nature.
Remote Sensing and GIS
 Remote Sensing and GIS Atmosphere Reflected radiation, e.g. Visible Emitted radiation, e.g. Infrared Backscattered radiation, e.g. Radar (λ) Visible TIR Radar & Microwave 11/9/2017 Geo327G/386G, U Texas,
Land Cover Analysis to Determine Areas of Clear-cut and Forest Cover in Olney, Montana. Geob 373 Remote Sensing. Dr Andreas Varhola, Kathry De Rego
 1 Land Cover Analysis to Determine Areas of Clear-cut and Forest Cover in Olney, Montana Geob 373 Remote Sensing Dr Andreas Varhola, Kathry De Rego Zhu an Lim (14292149) L2B 17 Apr 2016 2 Abstract Montana
Introduction to Remote Sensing
 Introduction to Remote Sensing Spatial, spectral, temporal resolutions Image display alternatives Vegetation Indices Image classifications Image change detections Accuracy assessment Satellites & Air-Photos
Course overview; Remote sensing introduction; Basics of image processing & Color theory
 GEOL 1460 /2461 Ramsey Introduction to Remote Sensing Fall, 2018 Course overview; Remote sensing introduction; Basics of image processing & Color theory Week #1: 29 August 2018 I. Syllabus Review we will
Image interpretation I and II
 Image interpretation I and II Looking at satellite image, identifying different objects, according to scale and associated information and to communicate this information to others is what we call as IMAGE
Important Missions. weather forecasting and monitoring communication navigation military earth resource observation LANDSAT SEASAT SPOT IRS
 Fundamentals of Remote Sensing Pranjit Kr. Sarma, Ph.D. Assistant Professor Department of Geography Mangaldai College Email: prangis@gmail.com Ph. No +91 94357 04398 Remote Sensing Remote sensing is defined
Remote Sensing for Rangeland Applications
 Remote Sensing for Rangeland Applications Jay Angerer Ecological Training June 16, 2012 Remote Sensing The term "remote sensing," first used in the United States in the 1950s by Ms. Evelyn Pruitt of the
Image Band Transformations
 Image Band Transformations Content Band math Band ratios Vegetation Index Tasseled Cap Transform Principal Component Analysis (PCA) Decorrelation Stretch Image Band Transformation Purposes Image band transforms
Remote Sensing Part 3 Examples & Applications
 Remote Sensing Part 3 Examples & Applications Review: Spectral Signatures Review: Spectral Resolution Review: Computer Display of Remote Sensing Images Individual bands of satellite data are mapped to
remote sensing? What are the remote sensing principles behind these Definition
 Introduction to remote sensing: Content (1/2) Definition: photogrammetry and remote sensing (PRS) Radiation sources: solar radiation (passive optical RS) earth emission (passive microwave or thermal infrared
Introduction of Satellite Remote Sensing
 Introduction of Satellite Remote Sensing Spatial Resolution (Pixel size) Spectral Resolution (Bands) Resolutions of Remote Sensing 1. Spatial (what area and how detailed) 2. Spectral (what colors bands)
Satellite Remote Sensing: Earth System Observations
 Satellite Remote Sensing: Earth System Observations Land surface Water Atmosphere Climate Ecosystems 1 EOS (Earth Observing System) Develop an understanding of the total Earth system, and the effects of
OPTICAL RS IMAGE INTERPRETATION
 1 OPTICAL RS IMAGE INTERPRETATION Lecture 8 Visible Middle Infrared Image Bands 2 Data Processing Information data in a useable form Interpretation Visual AI (Machine learning) Recognition, Classification,
On the use of water color missions for lakes in 2021
 Lakes and Climate: The Role of Remote Sensing June 01-02, 2017 On the use of water color missions for lakes in 2021 Cédric G. Fichot Department of Earth and Environment 1 Overview 1. Past and still-ongoing
Blacksburg, VA July 24 th 30 th, 2010 Remote Sensing Page 1. A condensed overview. For our purposes
 A condensed overview George McLeod Prepared by: With support from: NSF DUE-0903270 in partnership with: Geospatial Technician Education Through Virginia s Community Colleges (GTEVCC) The art and science
Introduction to Remote Sensing Part 1
 Introduction to Remote Sensing Part 1 A Primer on Electromagnetic Radiation Digital, Multi-Spectral Imagery The 4 Resolutions Displaying Images Corrections and Enhancements Passive vs. Active Sensors Radar
Using Multi-spectral Imagery in MapInfo Pro Advanced
 Using Multi-spectral Imagery in MapInfo Pro Advanced MapInfo Pro Advanced Tom Probert, Global Product Manager MapInfo Pro Advanced: Intuitive interface for using multi-spectral / hyper-spectral imagery
Remote Sensing of Environment (RSE)
") I N T R O Introduction to Introduction to Remote Sensing T O R S E Remote Sensing of Environment (RSE) with TNTmips page 1 TNTview Before Getting Started Imagery acquired by airborne or satellite sensors
I N T R O Introduction to Introduction to Remote Sensing T O R S E Remote Sensing of Environment (RSE) with TNTmips page 1 TNTview Before Getting Started Imagery acquired by airborne or satellite sensors
Geo/SAT 2 INTRODUCTION TO REMOTE SENSING
 Geo/SAT 2 INTRODUCTION TO REMOTE SENSING Paul R. Baumann, Professor Emeritus State University of New York College at Oneonta Oneonta, New York 13820 USA COPYRIGHT 2008 Paul R. Baumann Introduction Remote
Int n r t o r d o u d c u ti t on o n to t o Remote Sensing
 Introduction to Remote Sensing Definition of Remote Sensing Remote sensing refers to the activities of recording/observing/perceiving(sensing)objects or events at far away (remote) places. In remote sensing,
746A27 Remote Sensing and GIS
 746A27 Remote Sensing and GIS Lecture 1 Concepts of remote sensing and Basic principle of Photogrammetry Chandan Roy Guest Lecturer Department of Computer and Information Science Linköping University What
1. Theory of remote sensing and spectrum
 1. Theory of remote sensing and spectrum 7 August 2014 ONUMA Takumi Outline of Presentation Electromagnetic wave and wavelength Sensor type Spectrum Spatial resolution Spectral resolution Mineral mapping
A map says to you, 'Read me carefully, follow me closely, doubt me not.' It says, 'I am the Earth in the palm of your hand. Without me, you are alone
 A map says to you, 'Read me carefully, follow me closely, doubt me not.' It says, 'I am the Earth in the palm of your hand. Without me, you are alone and lost. Beryl Markham (West With the Night, 1946
Making NDVI Images using the Sony F717 Nightshot Digital Camera and IR Filters and Software Created for Interpreting Digital Images.
 Making NDVI Images using the Sony F717 Nightshot Digital Camera and IR Filters and Software Created for Interpreting Digital Images Draft 1 John Pickle Museum of Science October 14, 2004 Digital Cameras
HYPERSPECTRAL IMAGERY FOR SAFEGUARDS APPLICATIONS. International Atomic Energy Agency, Vienna, Austria
 HYPERSPECTRAL IMAGERY FOR SAFEGUARDS APPLICATIONS G. A. Borstad 1, Leslie N. Brown 1, Q.S. Bob Truong 2, R. Kelley, 3 G. Healey, 3 J.-P. Paquette, 3 K. Staenz 4, and R. Neville 4 1 Borstad Associates Ltd.,
MOVING FROM PIXELS TO PRODUCTS
 TRUE COLOR RGB MOSAIC, OSAKA, JAPAN MOVING FROM PIXELS TO PRODUCTS and data to insight AUTOMATED STRUCTURE IDENTIFICATION, OSAKA, JAPAN Table of Contents Moving from Pixels to Products 3 Doubling the Spectral
Module 3 Introduction to GIS. Lecture 8 GIS data acquisition
 Module 3 Introduction to GIS Lecture 8 GIS data acquisition GIS workflow Data acquisition (geospatial data input) GPS Remote sensing (satellites, UAV s) LiDAR Digitized maps Attribute Data Management Data
Spectral Signatures. Vegetation. 40 Soil. Water WAVELENGTH (microns)
") Spectral Signatures % REFLECTANCE VISIBLE NEAR INFRARED Vegetation Soil Water.5. WAVELENGTH (microns). Spectral Reflectance of Urban Materials 5 Parking Lot 5 (5=5%) Reflectance 5 5 5 5 5 Wavelength (nm)
Spectral Signatures % REFLECTANCE VISIBLE NEAR INFRARED Vegetation Soil Water.5. WAVELENGTH (microns). Spectral Reflectance of Urban Materials 5 Parking Lot 5 (5=5%) Reflectance 5 5 5 5 5 Wavelength (nm)
Introduction to Remote Sensing
 Introduction to Remote Sensing Daniel McInerney Urban Institute Ireland, University College Dublin, Richview Campus, Clonskeagh Drive, Dublin 14. 16th June 2009 Presentation Outline 1 2 Spaceborne Sensors
An Introduction to Geomatics. Prepared by: Dr. Maher A. El-Hallaq خاص بطلبة مساق مقدمة في علم. Associate Professor of Surveying IUG
 An Introduction to Geomatics خاص بطلبة مساق مقدمة في علم الجيوماتكس Prepared by: Dr. Maher A. El-Hallaq Associate Professor of Surveying IUG 1 Airborne Imagery Dr. Maher A. El-Hallaq Associate Professor
In late April of 1986 a nuclear accident damaged a reactor at the Chernobyl nuclear
 CHERNOBYL NUCLEAR POWER PLANT ACCIDENT Long Term Effects on Land Use Patterns Project Introduction: In late April of 1986 a nuclear accident damaged a reactor at the Chernobyl nuclear power plant in Ukraine.
Introduction to Remote Sensing Fundamentals of Satellite Remote Sensing. Mads Olander Rasmussen
 Introduction to Remote Sensing Fundamentals of Satellite Remote Sensing Mads Olander Rasmussen (mora@dhi-gras.com) 01. Introduction to Remote Sensing DHI What is remote sensing? the art, science, and technology
A broad survey of remote sensing applications for many environmental disciplines
 1 2 3 4 A broad survey of remote sensing applications for many environmental disciplines 5 6 7 8 9 10 1. First definition is very general and applies to many types of remote sensing. You use your eyes
Remote Sensing. The following figure is grey scale display of SPOT Panchromatic without stretching.
 Remote Sensing Objectives This unit will briefly explain display of remote sensing image, geometric correction, spatial enhancement, spectral enhancement and classification of remote sensing image. At
Lab 6: Multispectral Image Processing Using Band Ratios
 Lab 6: Multispectral Image Processing Using Band Ratios due Dec. 11, 2017 Goals: 1. To learn about the spectral characteristics of vegetation and geologic materials. 2. To experiment with vegetation indices
Dirty REMOTE SENSING Week 2 Interpreation
 Dirty REMOTE SENSING Week 2 Interpreation Earthobservation.wordpress.com Stuart Green Stuart.Green@teagasc.ie AERIAL PHOTOGRAPHIC INTERPRETATION http://airphotos.nrcan.gc.ca/photos101/photos101_info_e.php
Image interpretation and analysis
 Image interpretation and analysis Grundlagen Fernerkundung, Geo 123.1, FS 2014 Lecture 7a Rogier de Jong Michael Schaepman Why are snow, foam, and clouds white? Why are snow, foam, and clouds white? Today
RADIOMETRIC CALIBRATION
 1 RADIOMETRIC CALIBRATION Lecture 10 Digital Image Data 2 Digital data are matrices of digital numbers (DNs) There is one layer (or matrix) for each satellite band Each DN corresponds to one pixel 3 Digital
Radar Imagery for Forest Cover Mapping
 Purdue University Purdue e-pubs LARS Symposia Laboratory for Applications of Remote Sensing 1-1-1981 Radar magery for Forest Cover Mapping D. J. Knowlton R. M. Hoffer Follow this and additional works at:
FOR 474: Forest Inventory. FOR 474: Forest Inventory. Why do we Care About Forest Sampling?
 FOR 474: Forest Inventory 1. Advanced Forest Inventory The Need for Forest Sampling Brief Intro to Remote Sensing and GIS Readings: FOR 474: Forest Inventory Related Courses! FOR 274: Forest Measurements
Remote Sensing. Measuring an object from a distance. For GIS, that means using photographic or satellite images to gather spatial data
 Remote Sensing Measuring an object from a distance For GIS, that means using photographic or satellite images to gather spatial data Remote Sensing measures electromagnetic energy reflected or emitted
Remote Sensing. in Agriculture. Dr. Baqer Ramadhan CRP 514 Geographic Information System. Adel M. Al-Rebh G Term Paper.
 Remote Sensing in Agriculture Term Paper to Dr. Baqer Ramadhan CRP 514 Geographic Information System By Adel M. Al-Rebh G199325390 May 2012 Table of Contents 1.0 Introduction... 4 2.0 Objective... 4 3.0
Lecture Series SGL 308: Introduction to Geological Mapping Lecture 8 LECTURE 8 REMOTE SENSING METHODS: THE USE AND INTERPRETATION OF SATELLITE IMAGES
 LECTURE 8 REMOTE SENSING METHODS: THE USE AND INTERPRETATION OF SATELLITE IMAGES LECTURE OUTLINE Page 8.0 Introduction 114 8.1 Objectives 115 115 8.2 Remote Sensing: Method of Operation 8.3 Importance
Active and Passive Microwave Remote Sensing
 Active and Passive Microwave Remote Sensing Passive remote sensing system record EMR that was reflected (e.g., blue, green, red, and near IR) or emitted (e.g., thermal IR) from the surface of the Earth.
Outline for today. Geography 411/611 Remote sensing: Principles and Applications. Remote sensing: RS for biogeochemical cycles
 Geography 411/611 Remote sensing: Principles and Applications Thomas Albright, Associate Professor Laboratory for Conservation Biogeography, Department of Geography & Program in Ecology, Evolution, & Conservation
CHARACTERISTICS OF REMOTELY SENSED IMAGERY. Spatial Resolution
 CHARACTERISTICS OF REMOTELY SENSED IMAGERY Spatial Resolution There are a number of ways in which images can differ. One set of important differences relate to the various resolutions that images express.
AR M. Sc. (Rural Technology) II Semester Fundamental of Remote Sensing Model Paper
 II Semester Fundamental of Remote Sensing Model Paper") 1. Multiple choice question ; AR- 7251 M. Sc. (Rural Technology) II Semester Fundamental of Remote Sensing Model Paper 1. Chlorophyll strongly absorbs radition of : (b) Red and Blue wavelength (ii) Which
1. Multiple choice question ; AR- 7251 M. Sc. (Rural Technology) II Semester Fundamental of Remote Sensing Model Paper 1. Chlorophyll strongly absorbs radition of : (b) Red and Blue wavelength (ii) Which
Satellite Imagery and Remote Sensing. DeeDee Whitaker SW Guilford High EES & Chemistry
 Satellite Imagery and Remote Sensing DeeDee Whitaker SW Guilford High EES & Chemistry whitakd@gcsnc.com Outline What is remote sensing? How does remote sensing work? What role does the electromagnetic
Ghazanfar A. Khattak National Centre of Excellence in Geology University of Peshawar
 INTRODUCTION TO REMOTE SENSING Ghazanfar A. Khattak National Centre of Excellence in Geology University of Peshawar WHAT IS REMOTE SENSING? Remote sensing is the science of acquiring information about
Lecture 2. Electromagnetic radiation principles. Units, image resolutions.
 NRMT 2270, Photogrammetry/Remote Sensing Lecture 2 Electromagnetic radiation principles. Units, image resolutions. Tomislav Sapic GIS Technologist Faculty of Natural Resources Management Lakehead University
How can we "see" using the Infrared?
 The Infrared Infrared light lies between the visible and microwave portions of the electromagnetic spectrum. Infrared light has a range of wavelengths, just like visible light has wavelengths that range
Overview. Introduction. Elements of Image Interpretation. LA502 Special Studies Remote Sensing
 LA502 Special Studies Remote Sensing Elements of Image Interpretation Dr. Ragab Khalil Department of Landscape Architecture Faculty of Environmental Design King AbdulAziz University Room 103 Overview Introduction
Atmospheric interactions; Aerial Photography; Imaging systems; Intro to Spectroscopy Week #3: September 12, 2018
 GEOL 1460/2461 Ramsey Introduction/Advanced Remote Sensing Fall, 2018 Atmospheric interactions; Aerial Photography; Imaging systems; Intro to Spectroscopy Week #3: September 12, 2018 I. Quick Review from
INTRODUCTORY REMOTE SENSING. Geob 373
 INTRODUCTORY REMOTE SENSING Geob 373 Landsat 7 15 m image highlighting the geology of Oman http://www.satimagingcorp.com/gallery-landsat.html ASTER 15 m SWIR image, Escondida Mine, Chile http://www.satimagingcorp.com/satellite-sensors/aster.html
Outline. Introduction. Introduction: Film Emulsions. Sensor Systems. Types of Remote Sensing. A/Prof Linlin Ge. Photographic systems (cf(
 GMAT x600 Remote Sensing / Earth Observation Types of Sensor Systems (1) Outline Image Sensor Systems (i) Line Scanning Sensor Systems (passive) (ii) Array Sensor Systems (passive) (iii) Antenna Radar
Contents Remote Sensing for Studying Earth Surface and Changes
 Contents Remote Sensing for Studying Earth Surface and Changes Anupma Prakash Day : Tuesday Date : September 26, 2008 Audience : AMIDST Participants What is remote sensing? How does remote sensing work?
Introduction to Remote Sensing. Electromagnetic Energy. Data From Wave Phenomena. Electromagnetic Radiation (EMR) Electromagnetic Energy
 Electromagnetic Energy") A Basic Introduction to Remote Sensing (RS) ~~~~~~~~~~ Rev. Ronald J. Wasowski, C.S.C. Associate Professor of Environmental Science University of Portland Portland, Oregon 1 September 2015 Introduction
A Basic Introduction to Remote Sensing (RS) ~~~~~~~~~~ Rev. Ronald J. Wasowski, C.S.C. Associate Professor of Environmental Science University of Portland Portland, Oregon 1 September 2015 Introduction
Enhancement of Multispectral Images and Vegetation Indices
 Enhancement of Multispectral Images and Vegetation Indices ERDAS Imagine 2016 Description: We will use ERDAS Imagine with multispectral images to learn how an image can be enhanced for better interpretation.
SFR 406 Spring 2015 Lecture 7 Notes Film Types and Filters
 SFR 406 Spring 2015 Lecture 7 Notes Film Types and Filters 1. Film Resolution Introduction Resolution relates to the smallest size features that can be detected on the film. The resolving power is a related
MSB Imagery Program FAQ v1
 MSB Imagery Program FAQ v1 (F)requently (A)sked (Q)uestions 9/22/2016 This document is intended to answer commonly asked questions related to the MSB Recurring Aerial Imagery Program. Table of Contents
An NDVI image provides critical crop information that is not visible in an RGB or NIR image of the same scene. For example, plants may appear green
 Normalized Difference Vegetation Index (NDVI) Spectral Band calculation that uses the visible (RGB) and near-infrared (NIR) bands of the electromagnetic spectrum NDVI= + An NDVI image provides critical
REMOTE SENSING FOR FLOOD HAZARD STUDIES.
 REMOTE SENSING FOR FLOOD HAZARD STUDIES. OPTICAL SENSORS. 1 DRS. NANETTE C. KINGMA 1 Optical Remote Sensing for flood hazard studies. 2 2 Floods & use of remote sensing. Floods often leaves its imprint
The Benefits of the 8 Spectral Bands of WorldView-2
 W H I T E P A P E R The Benefits of the 8 Spectral Bands of WorldView-2 A U G U S T 2 0 0 9 Corporate (U.S.) 303.684.4561 or 800.496.1225 London +44.20.8899.6801 Singapore +65.6389.4851 www.digitalglobe.com
Remote Sensing. Odyssey 7 Jun 2012 Benjamin Post
 Remote Sensing Odyssey 7 Jun 2012 Benjamin Post Definitions Applications Physics Image Processing Classifiers Ancillary Data Data Sources Related Concepts Outline Big Picture Definitions Remote Sensing
RADAR (RAdio Detection And Ranging)
") RADAR (RAdio Detection And Ranging) CLASSIFICATION OF NONPHOTOGRAPHIC REMOTE SENSORS PASSIVE ACTIVE DIGITAL CAMERA THERMAL (e.g. TIMS) VIDEO CAMERA MULTI- SPECTRAL SCANNERS VISIBLE & NIR MICROWAVE Real
RADAR (RAdio Detection And Ranging) CLASSIFICATION OF NONPHOTOGRAPHIC REMOTE SENSORS PASSIVE ACTIVE DIGITAL CAMERA THERMAL (e.g. TIMS) VIDEO CAMERA MULTI- SPECTRAL SCANNERS VISIBLE & NIR MICROWAVE Real
Govt. Engineering College Jhalawar Model Question Paper Subject- Remote Sensing & GIS
 Govt. Engineering College Jhalawar Model Question Paper Subject- Remote Sensing & GIS Time: Max. Marks: Q1. What is remote Sensing? Explain the basic components of a Remote Sensing system. Q2. What is
Image interpretation. Aliens create Indian Head with an ipod? Badlands Guardian (CBC) This feature can be found 300 KMs SE of Calgary.
 This feature can be found 300 KMs SE of Calgary.") Image interpretation Aliens create Indian Head with an ipod? Badlands Guardian (CBC) This feature can be found 300 KMs SE of Calgary. 50 1 N 110 7 W Milestones in the History of Remote Sensing 19 th century
Image interpretation Aliens create Indian Head with an ipod? Badlands Guardian (CBC) This feature can be found 300 KMs SE of Calgary. 50 1 N 110 7 W Milestones in the History of Remote Sensing 19 th century
Aral Sea profile Selection of area 24 February April May 1998
 250 km Aral Sea profile 1960 1960 1985 1986 1987 1988 1989 1990 1991 1992 1993 1994 1995 1996 1997 1998 2010? Selection of area Area of interest Kzyl-Orda Dried seabed 185 km Syrdarya river Aral Sea Salt
Saturation And Value Modulation (SVM): A New Method For Integrating Color And Grayscale Imagery
: A New Method For Integrating Color And Grayscale Imagery") 87 Saturation And Value Modulation (SVM): A New Method For Integrating Color And Grayscale Imagery By David W. Viljoen 1 and Jeff R. Harris 2 Geological Survey of Canada 615 Booth St. Ottawa, ON, K1A 0E9
87 Saturation And Value Modulation (SVM): A New Method For Integrating Color And Grayscale Imagery By David W. Viljoen 1 and Jeff R. Harris 2 Geological Survey of Canada 615 Booth St. Ottawa, ON, K1A 0E9
Monitoring of mine tailings using satellite and lidar data
 Surveying Monitoring of mine tailings using satellite and lidar data by Prevlan Chetty, Southern Mapping Geospatial This study looks into the use of high resolution satellite imagery from RapidEye and
Acquisition of Aerial Photographs and/or Imagery
 Acquisition of Aerial Photographs and/or Imagery Acquisition of Aerial Photographs and/or Imagery From time to time there is considerable interest in the purchase of special-purpose photography contracted
Application of Remote Sensing in the Monitoring of Marine pollution. By Atif Shahzad Institute of Environmental Studies University of Karachi
 Application of Remote Sensing in the Monitoring of Marine pollution By Atif Shahzad Institute of Environmental Studies University of Karachi Remote Sensing "Remote sensing is the science (and to some extent,
The studies began when the Tiros satellites (1960) provided man s first synoptic view of the Earth s weather systems.
 provided man s first synoptic view of the Earth s weather systems.") Remote sensing of the Earth from orbital altitudes was recognized in the mid-1960 s as a potential technique for obtaining information important for the effective use and conservation of natural resources.
Remote sensing of the Earth from orbital altitudes was recognized in the mid-1960 s as a potential technique for obtaining information important for the effective use and conservation of natural resources.
How to Access Imagery and Carry Out Remote Sensing Analysis Using Landsat Data in a Browser
 How to Access Imagery and Carry Out Remote Sensing Analysis Using Landsat Data in a Browser Including Introduction to Remote Sensing Concepts Based on: igett Remote Sensing Concept Modules and GeoTech
Exercise 4-1 Image Exploration
 Exercise 4-1 Image Exploration With this exercise, we begin an extensive exploration of remotely sensed imagery and image processing techniques. Because remotely sensed imagery is a common source of data