Earth Sciences 089G Short Practical Assignment #4 Working in Three Dimensions
|
|
|
- Mabel Newton
- 5 years ago
- Views:
Transcription
1 Earth Sciences 089G Short Practical Assignment #4 Working in Three Dimensions Introduction Maps are 2-D representations of 3-D features, the developers of topographic maps needed to devise a method for showing not only horizontal distances but vertical distances (height) also. The map-reader wants to know the height of hills and how their height related to the surrounding area. To present height values in an efficient and readily interpretable manner, contour lines are used. Contour lines are lines along which there is a constant elevation above sea level. These facilitate interpretation of the height and shape of various landforms at a glance. To read contour lines, knowing the interval at which the contours are drawn is important. This contour interval is constant throughout the map area. It is added to (or subtracted from the most adjacent contour lines. If the interval is 20 metres, the values of each contour line will increase by 20 m as you go uphill. An isolated contour line may be either a hill or a depression; if it is a depression, it is marked by hatchure lines (figure 1). The following rules are used when interpreting contours. 1) All contours close somewhere, though the closure may not show on the map. 2) On a gentle slope the contours are widely spaced whereas on a steep slope they are closely spaced. 3) Contours NEVER cross each other, unless there is an overhanging cliff. 4) On a vertical cliff 2 or more contours may be superimposed. 5) Contours NEVER split. 6) A contour near the top of a ridge, or the bottom of a valley will be repeated on the other side of the ridge or valley. 7) Where contours cross a stream valley they must bend upstream in order to maintain the same elevation. 8) An isolated closed contour that indicates an elevation has the same elevation as that of the higher of the two adjacent contours. 9) An isolated closed contour that indicates a depression has the same elevation as that of the lower of the two adjacent contours. Topographic Profiles In maps we see the land surface as viewed from vertically above. In profile sections and cross-sections, we see the earth s crust from the side, much like looking at a slice through a cake. A topographic profile consists of four lines. 1) the profile line 2) the base line 3) two vertical end lines. The profile line marks the intersection of the land surface, with a vertical plane. So the profile represents the heights on the map, along the line of the section. The base line is horizontal at the height of the contour below the lowest contour on the profile. Note that it does not have to be at sea level. The vertical end lines mark the 1
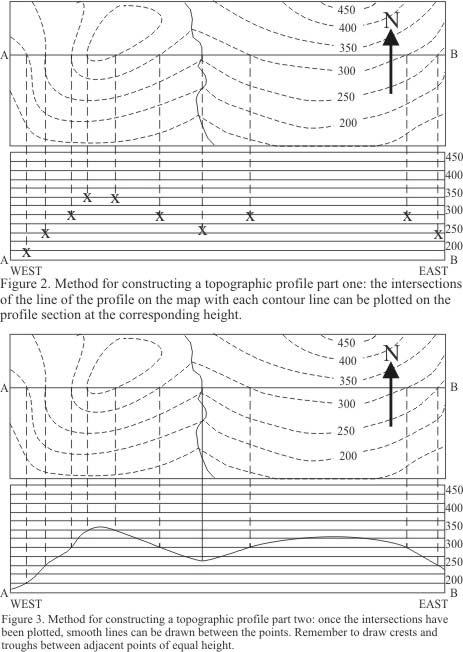
2 end of the profile section. It is essential to mark, with compass directions, the ends of the section to distinguish one from the other. Drawing Profile Sections Figures 2 and 3 show the method for constructing a topographic profile. 1) Take a long piece of paper and lay it with an edge along the section line on the map. At the end of the profile, mark two lines and label them with geographical letters (N, S, W or E). Along the edge of the paper mark the intersection of each contour with the section line and record their elevation directly below. 2) On a separate sheet, construct a frame for the profile section (base and end lines). The height of the profile section depends on the vertical scale. Construct a grid for the profile section. Its horizontal scale is the same as that on the map but the vertical scale may differ. 3) Lay the marked edge of the slip of paper along the line of the height you wish to plot and plot the point at the appropriate distance along the line (see figure 2). Move to other heights ensuring that the end of the profile on your transfer paper is at the corresponding end line of the frame. 4) Join the dots with smooth lines as in figure 3. Note that a smooth curved line joins two adjacent points of the same elevation. Straight horizontal lines imply that the height along the section is constant. This is a rare situation. For the most part, the profile line will make a crest or trough between such points.
3 3

4 It is especially important for Earth scientists to be able to deduce what is happening below surface. By gathering information from seismic surveys, ground penetrating radar and other geophysical techniques as well as surface mapping, it is possible make these deductions. As we ve seen, topographic contours are lines of constant height. When a structure appears on a map, there will almost always be places where it crosses such a line. When two points on a planar feature are at the same height, a line drawn between them will be both straight and horizontal. Such a line may be called a contour line, but it is pertinent to the structure rather than the surface topography. Figure 4 shows the relationship between a geological boundary, topographic contours and structural contours. Notice that where the topographic contour meets the geologic boundary, the structural contour passes through as well. The important thing here is that all three pass through the same points where the elevation is the same. We can treat the information gathered from structural contours in the same way that we treated topographic information. It is important to keep the sets of data discrete from each other. Plot the information for one line and then draw it before proceeding to the next line.

5 ES089 Working in 3-D Exercises NAME STUDENT # A group of archaeologists have found a partially exposed statue of colossal proportions in a desert region of Mexico. Wind is exhuming the top of it from under a sand dune. Ground penetrating radar has been used to establish the general shape that is still buried. It is believed to look something like the Olmec statue illustrated below. You are given two map figures that contain topographic contours so that the following things can be established: 1) Using figure 1, Plot the topographic profile of the sand dune along the X-Y line in the space provided beneath the map. a) Establish vertical end lines to represent the position of X and Y (2). b) Label the X and Y ends of the profile. (2) c) Plot the topographic information and draw the profile. (14) d) How deep would you have to dig at point Z to get to the surface of the statue? (2) A fracture in the rock of the statue appears on both maps (the bold line). In order to minimise the possibility of the top sliding away, repairs are being proposed. 2) Establish a structural cross-section along the line A-B that will include both the topography and the slope of the crack. Use the space prepared for you. a) Establish vertical end lines to represent the position of A and B (2). b) Label the A and B ends of the profile. (2) c) Plot the topographic information and draw the profile. (14) d) Plot the structural information and draw the profile. (24) 5
6
7 7
ENVI.2030L Topographic Maps and Profiles
 Name ENVI.2030L Topographic Maps and Profiles I. Introduction A map is a miniature representation of a portion of the earth's surface as it appears from above. The environmental scientist uses maps as
Surveying & Measurement. Detail Survey Topographic Surveying
 Surveying & Measurement Detail Survey Topographic Surveying Introduction Mapping surveys are made to determine the relief of the earth s surface and locate critical points on it. to determine the locations
COPYRIGHTED MATERIAL. Contours and Form DEFINITION
 1 DEFINITION A clear understanding of what a contour represents is fundamental to the grading process. Technically defined, a contour is an imaginary line that connects all points of equal elevation above
Maps and map interpretation An introduction for geoscientists
 Maps and map interpretation An introduction for geoscientists Produced by the University of Derby in conjunction with UKOGL Aims This teaching package provides an introduction to maps and how to identify
Topographic Maps. Contour Lines
 Topographic Maps Our first task today will consist of locating ourselves with the help of a topographic map. GPS units that can tell you the location of any Dunkin' Donuts within a five mile radius. Paper
Engineering Surveying -1 CE212 Contouring Lectures. Lecture 2016, November 29 th Muhammad Noman
 Engineering Surveying -1 CE212 Contouring Lectures Lecture 2016, November 29 th Muhammad Noman Contour An Imaginary line on the ground surface joining the points of equal elevation is known as contour.
Module 2: Mapping Topic 3 Content: Topographic Maps Presentation Notes. Topographic Maps
 Topographic Maps 1 Take a few moments to study the map shown here of Isolation Peak, Colorado. What land features do you notice? Do you thinking hiking through this area would be easy? Did you see the
BACKGROUND INFORMATION
 Build an Island INTRODUCTION For this assignment, you will be creating a topographic map and three-dimensional model of a fictional island that you have designed. You will start by exploring some basic
CONTOURS SURVEYING 1 CE 215 CHAPTER -3- Ishik University / Sulaimani Civil Engineering Department 12/7/2017. Ishik University / Sulaimani
 Civil Engineering Department SURVEYING 1 CE 215 CHAPTER -3- CONTOURS 1 2 1 3 4 2 PURPOSE OF CONTOURING Contour survey is carried out at the starting of any engineering project such as a road, a railway,
Lab #4 Topographic Maps and Aerial Photographs
 Lab #4 Topographic Maps and Aerial Photographs Purpose To familiarize you with using topographic maps. Visualizing the shape of landforms from topographic maps is an essential skill in geology. Proficiency
A contour line is a line that passes through points having the same elevation.* Definition
 Contour Lines A contour line is a line that passes through points having the same elevation.* Definition Eleven (11) characteristics of contour lines 1. Contour lines are continuous. 2. Contour lines are
PRE-LAB for: Introduction to Aerial Photographs and Topographic maps (Ch. 3)
") GEOLOGY 306 Laboratory Instructor: TERRY J. BOROUGHS NAME: PRE-LAB for: Introduction to Aerial Photographs and Topographic maps (Ch. 3) For this assignment you will require: a calculator and metric ruler.
GEOLOGY 306 Laboratory Instructor: TERRY J. BOROUGHS NAME: PRE-LAB for: Introduction to Aerial Photographs and Topographic maps (Ch. 3) For this assignment you will require: a calculator and metric ruler.
Shoe Box Activity Constructing a Topographic Map
 Shoe Box Activity Constructing a Topographic Map Background Information All maps are models of some feature of the real world. The kind of map oen used by scientists is called a contour or topographic
1. The topographic map below shows a depression contour line on Earth's surface.
 1. The topographic map below shows a depression contour line on Earth's surface. Points A, B, C, and D represent surface locations. Contour line elevations are in feet. Which profile best shows the topography
Introduction to Aerial Photographs and Topographic maps (Chapter 3)
") GEOLOGY 306 Laboratory Instructor: TERRY J. BOROUGHS NAME: Introduction to Aerial Photographs and Topographic maps (Chapter 3) For this assignment you will require: a calculator and metric ruler. Objectives:
GEOLOGY 306 Laboratory Instructor: TERRY J. BOROUGHS NAME: Introduction to Aerial Photographs and Topographic maps (Chapter 3) For this assignment you will require: a calculator and metric ruler. Objectives:
Lab #8: Topographic Map Lab
 NAME: LAB TIME: TA NAME: Lab #8: Topographic Map Lab Topography is the shape of the land. Topographic maps are used to aid in the visualization of the shape of the land. Topographic maps include the accurate
Contour An imaginary line on the ground surface joining the points of equal elevation is known as contour.
 Contour An imaginary line on the ground surface joining the points of equal elevation is known as contour. In other words, contour is a line in which the ground surface is intersected by a level surface
AutoCAD 2016 for Civil Engineering Applications
 Introduction to AutoCAD 2016 for Civil Engineering Applications Learning to use AutoCAD for Civil Engineering Projects Nighat Yasmin Ph.D. SDC P U B L I C AT I O N S Better Textbooks. Lower Prices. www.sdcpublications.com
UNITED STATES MARINE CORPS FIELD MEDICAL TRAINING BATTALION Camp Lejeune, NC
 UNITED STATES MARINE CORPS FIELD MEDICAL TRAINING BATTALION Camp Lejeune, NC 28542-0042 FMST 206 Land Navigation TERMINAL LEARNING OBJECTIVE 1. Given a military topographic map, protractor, and objective,
Introduction to Aerial Photographs and Topographic maps (Chapter 7, 9 th edition) or (chapter 3, 8 th edition)
 or (chapter 3, 8 th edition)") GEOLOGY 306 Laboratory Instructor: TERRY J. BOROUGHS NAME: Introduction to Aerial Photographs and Topographic maps (Chapter 7, 9 th edition) or (chapter 3, 8 th edition) For this assignment you will require:
GEOLOGY 306 Laboratory Instructor: TERRY J. BOROUGHS NAME: Introduction to Aerial Photographs and Topographic maps (Chapter 7, 9 th edition) or (chapter 3, 8 th edition) For this assignment you will require:
Land Navigation / Map Reading
 Land Navigation / Map Reading What is the Field Manual for map reading and land navigation? FM 3-25.26 What are the basic colors of a map, and what does each color represent? Black - Indicates cultural
31, The following isoline map shows the variations in the relative strength of Earth's magnetic field from 1 (strong) to 11 (weak).
 to 11 (weak).") 31, The following isoline map shows the variations in the relative strength of Earth's magnetic field from 1 (strong) to 11 (weak). 33. The following four temperature field maps represent the same region
31, The following isoline map shows the variations in the relative strength of Earth's magnetic field from 1 (strong) to 11 (weak). 33. The following four temperature field maps represent the same region
CHAPTER 3 MARGINAL INFORMATION AND SYMBOLS
 CHAPTER 3 MARGINAL INFORMATION AND SYMBOLS A map could be compared to any piece of equipment, in that before it is placed into operation the user must read the instructions. It is important that you, as
Ch. 1.3: Topographic Maps
 Ch. 1.3: Topographic Maps StudentS will be able to Explain what are topographic maps Read a topographic map Create a topographic map "Geologists don't dislike classical music, they just prefer rock." Topographic
Slope analysis & Grading. Earth shape and earthwork Topographic map Slope form Slope analysis Grading
 6 Slope analysis & Grading Earth shape and earthwork Topographic map Slope form Slope analysis Grading 81 Topographic Map Topographic Contour map Topographic contour map are composed of a series of line
MAKE A CO NTO U R MAP
 Your web browser (Safari 7) is out of date. For more security, comfort and the best experience on this site: Update your browser Ignore Activitydevelop Student Version MAKE A CO NTO U R MAP How does a
TOPOGRAPHIC MAPS A NEW WAY TO VIEW THE WORLD!
 TOPOGRAPHIC MAPS A NEW WAY TO VIEW THE WORLD! http://courtneyjennings.weebly.com/unit-4---weathering-erosiontopo-maps-past.html A topographic map, simply put, is a two-dimensional representation of a portion
NAME: PERIOD: DATE: LAB PARTNERS: LAB #6 DRAWING A CONTOUR MAP FROM A THREE DIMENSIONAL MODEL
 NAME: PERIOD: DATE: LAB PARTNERS: LAB #6 DRAWING A CONTOUR MAP FROM A THREE DIMENSIONAL MODEL INTRODUCTION Since land distances and elevations on the earth's surface can be very great it is necessary to
Gradient and Rate of Change
 Name: 1. Base your answer(s) to the following question(s) on the topographic map shown below. Letters A, B, C, and D represent locations on Earth s surface. The symbol marks the highest elevation on Patty
Topography and Contouring Teaching Assistant Guide
 Topography and Contouring Teaching Assistant Guide Learning Objectives: At the end of the exercise the students will be able to read a contour map contour data draw a topographic profiles Getting Started
Markville Secondary School Geography Department
 Markville Secondary School Geography Department CGC1D1 Geography of Canada PERFORMANCE TASK - UNIT 1 AND 2 DUE DATE: SEPTEMBER 2011 Parent Signature: CONTOUR MAP AND MODEL The performance task for Geography
Name: Topographic Profiles Multiple Choice
 1. Base your answer to the following question on the topographic map below. Points A and B represent locations on the map. Elevations are shown in meters. Which diagram best represents the topographic
Title: How steep are those hills? Engineering Grade: Estimated Time: 3 hours (2 days) Groups: 3 to 4 students
 Groups: 3 to 4 students") Title: How steep are those hills? Engineering Grade: 10-12 Estimated Time: 3 hours (2 days) Groups: 3 to 4 students Synopsis: Students will be able to understand the concept of surveying and mapping ground
Title: How steep are those hills? Engineering Grade: 10-12 Estimated Time: 3 hours (2 days) Groups: 3 to 4 students Synopsis: Students will be able to understand the concept of surveying and mapping ground
1 : 5,000 1cm to 100m
 4.1.1 Scales and Converting Scales In Hong Kong maps, there are 2 types of scales: 1. 1:5000 (Black and white with no color) 2. 1:20000 (With color) If there is no unit in a representative fraction scale,
1 ISOMETRIC PROJECTION SECTION I: INTRODUCTION TO ISOMETRIC PROJECTION
 1 ISOMETRIC PROJECTION SECTION I: INTRODUCTION TO ISOMETRIC PROJECTION Orthographic projection shows drawings of an object in a two-dimensional format, with views given in plan, elevation and end elevation
Following are the geometrical elements of the aerial photographs:
 Geometrical elements/characteristics of aerial photograph: An aerial photograph is a central or perspective projection, where the bundles of perspective rays meet at a point of origin called perspective
SURVEYING I CENG 383
 SURVEYING I CENG 383 9/21/2011 2 Introduction Definition An art of collecting data for mapping the relative positions of points above, below or on the surface of the earth. Surveying also includes the
8/17/2014. Process of directly or indirectly measuring vertical distances to determine the elevation of points or their differences in elevation
 Process of directly or indirectly measuring vertical distances to determine the elevation of points or their differences in elevation Leveling results are used: To design highways, railroads, canals, sewers,
Watershed Topography
 Watershed Topography Adapted from: An original Creek Connections activity. Creek Connections, Allegheny College, Meadville, Pennsylvania, 16335 Topography in Watersheds Grade Level: Basic to intermediate.
Markville Secondary School Geography Department
 Markville Secondary School Geography Department CGC1D1 Geography of Canada PERFORMANCE TASK - UNITS 1 AND 2 February 2012 DUE DATE: Parent Signature: CONTOUR MAP AND MODEL The performance task for the
Important Questions. Surveying Unit-II. Surveying & Leveling. Syllabus
 Surveying Unit-II Important Questions Define Surveying and Leveling Differentiate between Surveying and Leveling. Explain fundamental Principles of Surveying. Explain Plain and Diagonal Scale. What is
At the conclusion of this unit you should be able to accomplish the following with a 70% accuracy
 7 Multiview Drawing OBJECTIVES At the conclusion of this unit you should be able to accomplish the following with a 70% accuracy 1. explain the importance of mulitview drawing as a communication tool far
GUIDELINES FOR MEASURING BUILDING HEIGHT
 GUIDELINES FOR MEASURING BUILDING HEIGHT THE CITY S POLICIES ON BUILDING HEIGHT In 1994, the City adopted a new General Plan that sets direction for development within Brisbane. Among its policies affecting
PART XII: TOPOGRAPHIC SURVEYS
 PART XII: TOPOGRAPHIC SURVEYS 12.1 Purpose and Scope The purpose of performing topographic surveys is to map a site for the depiction of man-made and natural features that are on, above, or below the surface
PHOTOGRAMMETRY STEREOSCOPY FLIGHT PLANNING PHOTOGRAMMETRIC DEFINITIONS GROUND CONTROL INTRODUCTION
 PHOTOGRAMMETRY STEREOSCOPY FLIGHT PLANNING PHOTOGRAMMETRIC DEFINITIONS GROUND CONTROL INTRODUCTION Before aerial photography and photogrammetry became a reliable mapping tool, planimetric and topographic
Mapping The Study Area
 While on the beach you will need to take some measurements to show where the study area is relative to the rest of the world and to show what is inside the study area. Once the measurements have been taken,
Short Introduction to Planes Not on EL VPs (Pitches and Inclined Planes)
") Short Introduction to Planes Not on VPs (Pitches and Inclined Planes) Planes Not on VPs (Pitches and Inclined Planes) Print this page to use as your source drawing guide Short Introduction to Planes Not
Short Introduction to Planes Not on VPs (Pitches and Inclined Planes) Planes Not on VPs (Pitches and Inclined Planes) Print this page to use as your source drawing guide Short Introduction to Planes Not
determining the relative height of different
 Levelling & Contouring Principle of levelling Principle:-The principle of levelling is to obtain horizontal line of sight with respect to which vertical distances of the points above or below this line
Level Curves, Partial Derivatives
 Unit #18 : Level Curves, Partial Derivatives Goals: To learn how to use and interpret contour diagrams as a way of visualizing functions of two variables. To study linear functions of two variables. To
REVIEW TOPICS CEEN 2320 FINAL EXAM
 REVIEW TOPICS CEEN 2320 FINAL EXAM Be familiar with all materials covered in class, your class handouts and the notes you took in class, your homework assignments, test questions, formulas, tables, figures.
Constructing Line Graphs*
 Appendix B Constructing Line Graphs* Suppose we are studying some chemical reaction in which a substance, A, is being used up. We begin with a large quantity (1 mg) of A, and we measure in some way how
Line Graphs. Name: The independent variable is plotted on the x-axis. This axis will be labeled Time (days), and
, and") Name: Graphing Review Graphs and charts are great because they communicate information visually. For this reason graphs are often used in newspapers, magazines, and businesses around the world. Sometimes,
Name: Graphing Review Graphs and charts are great because they communicate information visually. For this reason graphs are often used in newspapers, magazines, and businesses around the world. Sometimes,
Legal Description & Site Plan Requirements and Layouts
 Legal Description & Site Plan Requirements and Layouts Plot Plan * A plot plan shows the location of a house from an aerial view. * The site plan, also known as a plot or lot plan includes: 1. Site plan
Page 21 GRAPHING OBJECTIVES:
 Page 21 GRAPHING OBJECTIVES: 1. To learn how to present data in graphical form manually (paper-and-pencil) and using computer software. 2. To learn how to interpret graphical data by, a. determining the
2 Point Perspective. Point Perspective. Slide 1 of 40: Requirements
 2 Slide 1 of 40: Requirements Before we move on to How to draw a two point perspective, you will require a plan and an elevation of the Object you wish to draw perspective of. With a more complex object
Appendix III Graphs in the Introductory Physics Laboratory
 Appendix III Graphs in the Introductory Physics Laboratory 1. Introduction One of the purposes of the introductory physics laboratory is to train the student in the presentation and analysis of experimental
Graphing Techniques. Figure 1. c 2011 Advanced Instructional Systems, Inc. and the University of North Carolina 1
 Graphing Techniques The construction of graphs is a very important technique in experimental physics. Graphs provide a compact and efficient way of displaying the functional relationship between two experimental
LONGITUDINAL PROFILE COMPLETION
 LONGITUDINAL PROFILE COMPLETION Vertical alignment of the ditch bottom determine using cross-sections plot (refer to fig. 0630) according to the chainage direction: ditch bottom on right side... dotted
MAPPING YOUR STREAM. TIME REQUIRED 50 minutes in Field 50 minutes in Classroom 50 minutes Homework
 OUR MAPPING YOUR STREAM STREAM ACTIVITY SUMMARY Students will draft a cross-sectional profile of the stream and measure the velocity of the current. They will use both of these to calculate the discharge
7. Consider the following common offset gather collected with GPR.
 Questions: GPR 1. Which of the following statements is incorrect when considering skin depth in GPR a. Skin depth is the distance at which the signal amplitude has decreased by a factor of 1/e b. Skin
ORTHOGRAPHIC PROJECTIONS. Ms. Sicola
 ORTHOGRAPHIC PROJECTIONS Ms. Sicola Objectives List the six principal views of projection Sketch the top, front and right-side views of an object with normal, inclined, and oblique surfaces Objectives
47 CFR Ch. I ( Edition)
") 73.684 should decrease more rapidly with distance beyond the horizon than for Channels 2 6, and modification of the curves for Channels 14 69 may be expected as a result of measurements to be made at a
73.684 should decrease more rapidly with distance beyond the horizon than for Channels 2 6, and modification of the curves for Channels 14 69 may be expected as a result of measurements to be made at a
Floods On The Minnesota River Planning For St. Peter
 Floods On The Minnesota River Planning For St. Peter Group Members Section: A B C D E In this lab, we will make a flood hazard map for the city of St. Peter. We will use the 100-year flood as the design
A Visual Display. A graph is a visual display of information or data. This is a graph that shows a girl walking her dog. Communicating with Graphs
 A Visual Display A graph is a visual display of information or data. This is a graph that shows a girl walking her dog. A Visual Display The horizontal axis, or the x-axis, measures time. Time is the independent
List of Figures. List of Forms
 City of Columbia Engineering Regulations PART 1: SUBMISSION OF PLANS Table of Contents Paragraph Description Page No. 1.1 General 1-1 1.2 Engineer s Report 1-1 1.3 Plans 1-3 1.4 Revisions to Approved Plan
Engineering Graphics Essentials with AutoCAD 2015 Instruction
 Kirstie Plantenberg Engineering Graphics Essentials with AutoCAD 2015 Instruction Text and Video Instruction Multimedia Disc SDC P U B L I C AT I O N S Better Textbooks. Lower Prices. www.sdcpublications.com
CHAPTER 3-LAB 1: A TOPOGRAPHIC MAP IN THREE DIMENSIONS
 Name Teacher Period Date CHAPTER 3-LAB 1: A TOPOGRAPHIC MAP IN THREE DIMENSIONS Introduction A topographic map shows the shape ofthe land surface with contour lines. On page 29 you will find Figure 3-6,
Chapter 3. Graphical Methods for Describing Data. Copyright 2005 Brooks/Cole, a division of Thomson Learning, Inc.
 Chapter 3 Graphical Methods for Describing Data 1 Frequency Distribution Example The data in the column labeled vision for the student data set introduced in the slides for chapter 1 is the answer to the
ENGINEERING GRAPHICS ESSENTIALS
 ENGINEERING GRAPHICS ESSENTIALS with AutoCAD 2012 Instruction Introduction to AutoCAD Engineering Graphics Principles Hand Sketching Text and Independent Learning CD Independent Learning CD: A Comprehensive
TWO DIMENSIONAL DESIGN CHAPTER 6: GRADATION. Dr. Hatem Galal A Ibrahim
 TWO DIMENSIONAL DESIGN CHAPTER 6: GRADATION Dr. Hatem Galal A Ibrahim DEFINITION: Gradation is a daily visual experience. Things that are close to us appear large and those that are far from us appear
East Bay Municipal Utility District. Study Guide for Survey Technician I
 East Bay Municipal Utility District Study Guide for Survey Technician I Summer 2018 TABLE OF CONTENTS PAGE Introduction... 1 Scoring... 1 Visual Perception... 2 Sample Questions 1-2... 2 Reading and Interpreting
Scientific Investigation Use and Interpret Graphs Promotion Benchmark 3 Lesson Review Student Copy
 Scientific Investigation Use and Interpret Graphs Promotion Benchmark 3 Lesson Review Student Copy Vocabulary Data Table A place to write down and keep track of data collected during an experiment. Line
Engineering Fundamentals and Problem Solving, 6e
 Engineering Fundamentals and Problem Solving, 6e Chapter 5 Representation of Technical Information Chapter Objectives 1. Recognize the importance of collecting, recording, plotting, and interpreting technical
Cedar fence. Construction plan. fence with shutters of which you. can decide the angle, allowing to create the required amount of privacy.
 4" STEP BY STEP Guide Construction plan Cedar fence A fence with shutters of which you can decide the angle, allowing to create the required amount of privacy. 4" X 4" 76 1 /2" Diffi culty level: 1 2 3
Date Requested, 200_ Work Order No. Funding source Name of project Project limits: Purpose of the project
 Bureau of Engineering SURVEY DIVISION REQUEST FOR TOPOGRAPHIC SURVEY Date Requested, 200_ Work Order No. Funding source Name of project Project limits: Purpose of the project Caltrans involvement (must
AIM. What is-a contour map? 23-
 .. '; AIM 23- What is-a contour map?.,,.,, I. There are many different kinds of maps. The maps we use most often are surface maps. A surface map is a drawing. It shows all or part of the earth's surface.
Electromagnetic Induction
 Electromagnetic Induction Recap the motivation for using geophysics We have problems to solve Slide 1 Finding resources Hydrocarbons Minerals Ground Water Geothermal Energy SEG Distinguished Lecture slide
constant EXAMPLE #4:
 Linear Equations in One Variable (1.1) Adding in an equation (Objective #1) An equation is a statement involving an equal sign or an expression that is equal to another expression. Add a constant value
Copyrighted Material. Copyrighted Material. Copyrighted. Copyrighted. Material
 Engineering Graphics ORTHOGRAPHIC PROJECTION People who work with drawings develop the ability to look at lines on paper or on a computer screen and "see" the shapes of the objects the lines represent.
STATE UNIVERSITY CONSTRUCTION FUND
 DIRECTIVE 1C-12 Issue date: August 2012 1. General SURVEY, MAPPING AND UTILITY LOCATING This Directive has been developed as a general guide for the survey and mapping effort required for Fund projects.
Year 11 Graphing Notes
 Year 11 Graphing Notes Terminology It is very important that students understand, and always use, the correct terms. Indeed, not understanding or using the correct terms is one of the main reasons students
Excel Lab 2: Plots of Data Sets
 Excel Lab 2: Plots of Data Sets Excel makes it very easy for the scientist to visualize a data set. In this assignment, we learn how to produce various plots of data sets. Open a new Excel workbook, and
Sea Surface Backscatter Distortions of Scanning Radar Altimeter Ocean Wave Measurements
 Sea Surface Backscatter Distortions of Scanning Radar Altimeter Ocean Wave Measurements Edward J. Walsh and C. Wayne Wright NASA Goddard Space Flight Center Wallops Flight Facility Wallops Island, VA 23337
Riches of the Earth Guidance Sheet 5
 Riches of the Earth Guidance Sheet 5 www.watershedlandscape.co.uk Recording individual features Several forms of recording are used to give as much information as possible about the feature being recorded.
10 GRAPHING LINEAR EQUATIONS
 0 GRAPHING LINEAR EQUATIONS We now expand our discussion of the single-variable equation to the linear equation in two variables, x and y. Some examples of linear equations are x+ y = 0, y = 3 x, x= 4,
Lecture # 7 Coordinate systems and georeferencing
 Lecture # 7 Coordinate systems and georeferencing Coordinate Systems Coordinate reference on a plane Coordinate reference on a sphere Coordinate reference on a plane Coordinates are a convenient way of
Appendix C: Graphing. How do I plot data and uncertainties? Another technique that makes data analysis easier is to record all your data in a table.
 Appendix C: Graphing One of the most powerful tools used for data presentation and analysis is the graph. Used properly, graphs are an important guide to understanding the results of an experiment. They
How to Design a Geometric Stained Glass Lamp Shade
 This technique requires no calculation tables, math, or angle computation. Instead you can use paper & pencil with basic tech drawing skills to design any size or shape spherical lamp with any number of
CABINET INSTALLATION INSTRUCTIONS
 CABINET INSTALLATION INSTRUCTIONS Please read these instructions through completely before beginning the installation. Thank you for choosing Plato Personalized Custom Cabinetry for your home. Your Plato
8.EE. Development from y = mx to y = mx + b DRAFT EduTron Corporation. Draft for NYSED NTI Use Only
 8.EE EduTron Corporation Draft for NYSED NTI Use Only TEACHER S GUIDE 8.EE.6 DERIVING EQUATIONS FOR LINES WITH NON-ZERO Y-INTERCEPTS Development from y = mx to y = mx + b DRAFT 2012.11.29 Teacher s Guide:
SG-30 A P P L I C A T I O N I N S T R U C T I O N S. Directions For Application
 1 2 3 General Instructions NOTICE: THESE SHINGLES MUST BE APPLIED TO CONFORM WITH ALL APPLICABLE BUILDING CODES. THESE DIRECTIONS REPRESENT COMMON AND ACCEPTED ROOFING PRACTICES. DEVIATIONS FROM THESE
Design & Communication Graphics Higher Level Sections B and C (180 marks)
") Coimisiún na Scrúduithe Stáit State Examinations Commission 202. M8BC Leaving Certificate Examination, 202 Design & Communication Graphics Higher Level Sections B and C (80 marks) Wednesday, 20 June Afternoon,
Coimisiún na Scrúduithe Stáit State Examinations Commission 202. M8BC Leaving Certificate Examination, 202 Design & Communication Graphics Higher Level Sections B and C (80 marks) Wednesday, 20 June Afternoon,
Patterns and Graphing Year 10
 Patterns and Graphing Year 10 While students may be shown various different types of patterns in the classroom, they will be tested on simple ones, with each term of the pattern an equal difference from
LINEAR EQUATIONS IN TWO VARIABLES
 LINEAR EQUATIONS IN TWO VARIABLES What You Should Learn Use slope to graph linear equations in two " variables. Find the slope of a line given two points on the line. Write linear equations in two variables.
In search of a Historic Grave: GPR Investigation near the Yellowstone Lake Store: 7/15/2010
 In search of a Historic Grave: GPR Investigation near the Yellowstone Lake Store: 7/15/2010 Steven Sheriff Professor of Geophysics Department of Geosciences University of Montana Missoula, Montana Introduction
Design & Communication Graphics Higher Level Sections B and C (180 marks)
") Coimisiún na Scrúduithe Stáit State Examinations Commission 2016. M81BC Leaving Certificate Examination, 2016 Design & Communication Graphics Higher Level Sections B and C (180 marks) Wednesday, 22 June
Coimisiún na Scrúduithe Stáit State Examinations Commission 2016. M81BC Leaving Certificate Examination, 2016 Design & Communication Graphics Higher Level Sections B and C (180 marks) Wednesday, 22 June
Chapter Four AIRPORT LAYOUT PLAN SET COMPONENTS
 The purpose of this chapter is to present the graphic representation of the items addressed and recommended in Chapter Three Demand Capacity Analysis and Facility Requirements (page 3-1). The Airport Layout
PASS Sample Size Software
 Chapter 945 Introduction This section describes the options that are available for the appearance of a histogram. A set of all these options can be stored as a template file which can be retrieved later.
DFTG-1305 Technical Drafting Prof. Francis Ha
 DFTG-1305 Technical Drafting Prof. Francis Ha Session 4 Orthographic Projection (or Multiview Projection) Reading: Geisecke s textbook: 14 th Ed. Chapter 5 p.162 15 th Ed. Chapter 6 p.232 Update: 18-0205
Option 1. Design Options are diverse e.g. new route alignments covering a wide area. Option 2. Design Options are restricted
 MINIMUM STANDARD Z/16 SURVEY SPECIFICATIONS 1. GENERAL This specification sets out the Consultant s requirements for topographical survey (ground and aerial) for the Detailed Business Case (DBC) and Pre-Implementation