Lab #4 Topographic Maps and Aerial Photographs
|
|
|
- Barbra Carson
- 6 years ago
- Views:
Transcription

1 Lab #4 Topographic Maps and Aerial Photographs Purpose To familiarize you with using topographic maps. Visualizing the shape of landforms from topographic maps is an essential skill in geology. Proficiency at topographic map use is essential in geologic mapping and using topographic maps to interpret geologic processes. Logistics This lab consists of doing exercises in this handout as well as Exercise 7 in the lab book, Exercises in Physical Geology, to be found in the classroom. Topographic Maps A topographic map, or topo for short, is a two-dimensional (flat) representation of a three-dimensional land surface. It shows the three-dimensional information (relief or height variation) by using contour lines to represent elevations of hills and valleys. Topographic maps also show accurate representations of water bodies, vegetation, roads, buildings, and political boundaries, all at an accurate scale. Topographic maps are a valuable tool in geological and engineering studies. They also are used by hikers, hunters, campers, and anyone who needs to know the three-dimensional aspect of land surfaces. Most U.S. topo maps are published by the US Geological Survey. They cover rectangular sections of the Earth s surface called quadrangles, or quads for short. Latitude and Longitude. Lines of latitude and longitude are used to locate positions on a topo map and to locate the boundaries for the topo map. Lines of latitude are imaginary lines that run parallel to the equator. They are labeled by their angular distance north or south of the equator as shown below. Lines of longitude run from pole to pole and are labeled by their angular distance east or west of Greenwich, England. The north-south line that runs through Greenwich, England is known as the Prime Meridian. See fig 7.4 in the lab book as well. The angular unit of degrees are traditionally broken into units called minutes. There are 60 minutes in a degree. In other words, a minute is 1/60 th of a degree. Topo maps are traditionally named for how many minutes of land they cover. One popular
2 series now published by the USGS is the 71/2 minute series. They are commonly referred to as 71/2 minute quads. These maps cover 71/2 minutes of latitude and 71/2 minutes of longitude. Look at the Crater Lake quad. 1. What is the latitude of the northern boundary of the map? What is the latitude of the southern boundary? 2. What is the longitude of the western boundary of the map? What is the longitude of the eastern boundary? 3. Why do the longitude markers increase to the west? 4. How many minutes of longitude does this map cover? How many minutes of latitude? I Scale -- Measuring distance The ratio of distance on the map to actual distance on the earth s surface is the scale. Two kinds of scales are typically provided on map legends: The first is a fractional scale such as 1:100,000 where the first number on the map is equal to the second number on the Earth using any scale of measurement.. As an example, 1:100,000 means that 1 inch, foot, millimeter, or finger on the map is equal to 100,000 inches, feet, millimeters, or fingers on the surface of the Earth. The second is a bar scale. The bar scale shows graphically how far some measure of distance is on the map. They can be used like a ruler. A third type of scale, not provided on map legends, is a verbal scale. On the Crater Lake map, the verbal scale is 1 inch = 1 mile. 1. What is the fractional scale of the Crater Lake quad? 2. On the Crater Lake quad, how far is it in miles from the top of Mt Thielsen to the Peak on Wizard Island? How far is it in kilometers? 3. How far is it from Mt. Bailey to Mt Thielsen?

3 4. Contour Lines. Contour lines represent elevations and landforms on a flat piece of paper. Contour lines are imaginary, horizontal lines that connect points on the earth of equal elevation. See the demonstration in class and the diagram below. The vertical distance between contour lines is called the contour interval. On the diagram below, the contour interval is 50 feet. You need to be able to look at contour lines on a map and visualize the topography. See also pages in the lab book. Use the stereoglasses to look at the images on the following page. Look at all of them. You can also use the original on page 85 of the lab book. But don t write in the lab book! Only write on this handout to answer the following questions. 1. On the top diagram, where is a hill? Where is a closed depression? Where is a steep slope? Where is the highest point on the map. Mark these things on this handout, not the lab book. 2. On the Canyons, where are v-shaped contours pointing upstream? This is the classic shape for contours along streams on maps. Where is relatively flat terrain? Where is steep terrain? Mark these things on this handout, not the book.
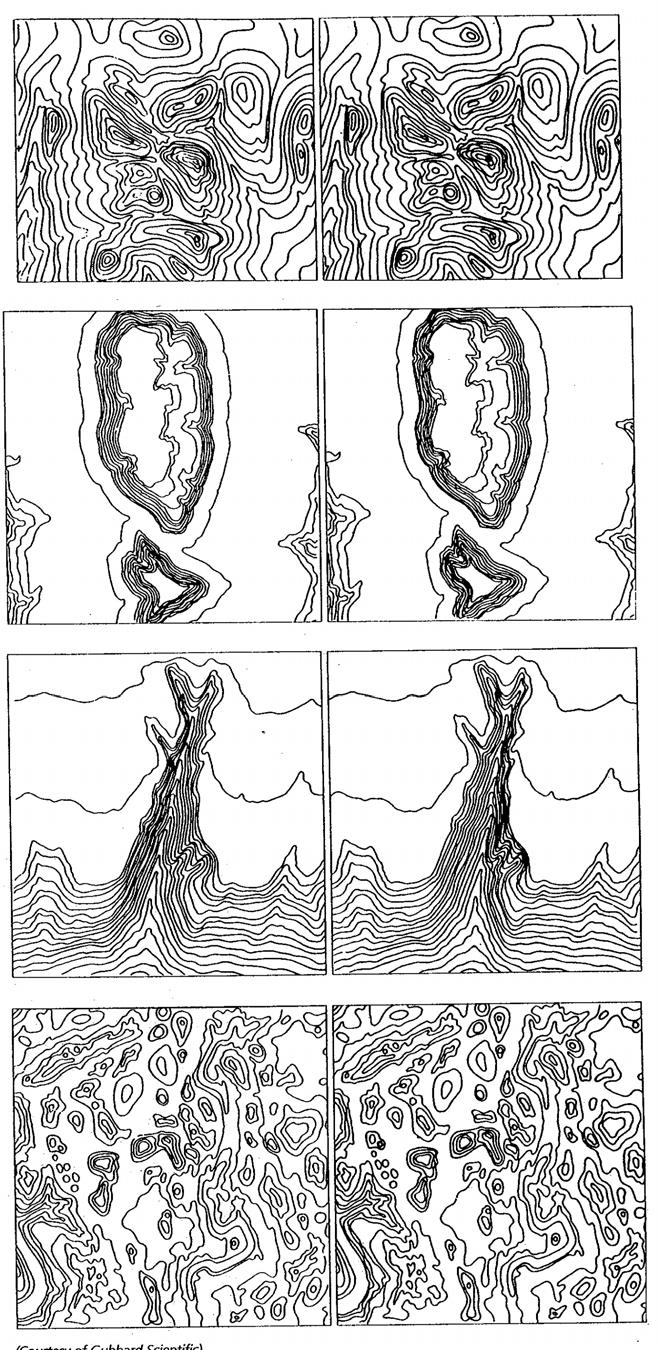
4


5 More detailed contour rules. Don t try to memorize this; rather think through the situations where contours are repeated and where they do not repeat.

6 The diagram below shows elevations. The diagram on the right a possible 500 foot contour drawn through these elevations. Follow this example by drawing the exact same contour on the left-hand diagram. Then add the other contours. Use a 5-foot contour interval. So draw a 485, 490, 495, 505, 510, and 515 foot contour lines. On the following diagram, label the contour lines. Use a 40 meter contour interval. Remember to follow the rules shown on the previous page.

7 Draw a topographic profile of the map shown below. Look on pages of the lab book for directions. The vertical scale is given for you. Be sure to note that the contour interval is 20 feet. Now back to the Crater Lake map. 1. What is the contour interval of the Crater Lake map? 2. What is the area of the Crater Lake map in square miles? 3. Two inches on the Crater Lake map represents how many feet on the ground? How many miles? How many kilometers? 4. What kind of volcano is the mountain on which Crater Lake lies?
ENVI.2030L Topographic Maps and Profiles
 Name ENVI.2030L Topographic Maps and Profiles I. Introduction A map is a miniature representation of a portion of the earth's surface as it appears from above. The environmental scientist uses maps as
Introduction to Aerial Photographs and Topographic maps (Chapter 3)
") GEOLOGY 306 Laboratory Instructor: TERRY J. BOROUGHS NAME: Introduction to Aerial Photographs and Topographic maps (Chapter 3) For this assignment you will require: a calculator and metric ruler. Objectives:
GEOLOGY 306 Laboratory Instructor: TERRY J. BOROUGHS NAME: Introduction to Aerial Photographs and Topographic maps (Chapter 3) For this assignment you will require: a calculator and metric ruler. Objectives:
PRE-LAB for: Introduction to Aerial Photographs and Topographic maps (Ch. 3)
") GEOLOGY 306 Laboratory Instructor: TERRY J. BOROUGHS NAME: PRE-LAB for: Introduction to Aerial Photographs and Topographic maps (Ch. 3) For this assignment you will require: a calculator and metric ruler.
GEOLOGY 306 Laboratory Instructor: TERRY J. BOROUGHS NAME: PRE-LAB for: Introduction to Aerial Photographs and Topographic maps (Ch. 3) For this assignment you will require: a calculator and metric ruler.
Introduction to Aerial Photographs and Topographic maps (Chapter 7, 9 th edition) or (chapter 3, 8 th edition)
 or (chapter 3, 8 th edition)") GEOLOGY 306 Laboratory Instructor: TERRY J. BOROUGHS NAME: Introduction to Aerial Photographs and Topographic maps (Chapter 7, 9 th edition) or (chapter 3, 8 th edition) For this assignment you will require:
GEOLOGY 306 Laboratory Instructor: TERRY J. BOROUGHS NAME: Introduction to Aerial Photographs and Topographic maps (Chapter 7, 9 th edition) or (chapter 3, 8 th edition) For this assignment you will require:
Topographic Maps. Contour Lines
 Topographic Maps Our first task today will consist of locating ourselves with the help of a topographic map. GPS units that can tell you the location of any Dunkin' Donuts within a five mile radius. Paper
BACKGROUND INFORMATION
 Build an Island INTRODUCTION For this assignment, you will be creating a topographic map and three-dimensional model of a fictional island that you have designed. You will start by exploring some basic
Module 2: Mapping Topic 3 Content: Topographic Maps Presentation Notes. Topographic Maps
 Topographic Maps 1 Take a few moments to study the map shown here of Isolation Peak, Colorado. What land features do you notice? Do you thinking hiking through this area would be easy? Did you see the
Lab #8: Topographic Map Lab
 NAME: LAB TIME: TA NAME: Lab #8: Topographic Map Lab Topography is the shape of the land. Topographic maps are used to aid in the visualization of the shape of the land. Topographic maps include the accurate
Shoe Box Activity Constructing a Topographic Map
 Shoe Box Activity Constructing a Topographic Map Background Information All maps are models of some feature of the real world. The kind of map oen used by scientists is called a contour or topographic
Land Navigation / Map Reading
 Land Navigation / Map Reading What is the Field Manual for map reading and land navigation? FM 3-25.26 What are the basic colors of a map, and what does each color represent? Black - Indicates cultural
Surveying & Measurement. Detail Survey Topographic Surveying
 Surveying & Measurement Detail Survey Topographic Surveying Introduction Mapping surveys are made to determine the relief of the earth s surface and locate critical points on it. to determine the locations
COPYRIGHTED MATERIAL. Contours and Form DEFINITION
 1 DEFINITION A clear understanding of what a contour represents is fundamental to the grading process. Technically defined, a contour is an imaginary line that connects all points of equal elevation above
TOPOGRAPHIC MAPS A NEW WAY TO VIEW THE WORLD!
 TOPOGRAPHIC MAPS A NEW WAY TO VIEW THE WORLD! http://courtneyjennings.weebly.com/unit-4---weathering-erosiontopo-maps-past.html A topographic map, simply put, is a two-dimensional representation of a portion
Topography and Contouring Teaching Assistant Guide
 Topography and Contouring Teaching Assistant Guide Learning Objectives: At the end of the exercise the students will be able to read a contour map contour data draw a topographic profiles Getting Started
31, The following isoline map shows the variations in the relative strength of Earth's magnetic field from 1 (strong) to 11 (weak).
 to 11 (weak).") 31, The following isoline map shows the variations in the relative strength of Earth's magnetic field from 1 (strong) to 11 (weak). 33. The following four temperature field maps represent the same region
31, The following isoline map shows the variations in the relative strength of Earth's magnetic field from 1 (strong) to 11 (weak). 33. The following four temperature field maps represent the same region
NAME: PERIOD: DATE: LAB PARTNERS: LAB #6 DRAWING A CONTOUR MAP FROM A THREE DIMENSIONAL MODEL
 NAME: PERIOD: DATE: LAB PARTNERS: LAB #6 DRAWING A CONTOUR MAP FROM A THREE DIMENSIONAL MODEL INTRODUCTION Since land distances and elevations on the earth's surface can be very great it is necessary to
Earth Sciences 089G Short Practical Assignment #4 Working in Three Dimensions
 Earth Sciences 089G Short Practical Assignment #4 Working in Three Dimensions Introduction Maps are 2-D representations of 3-D features, the developers of topographic maps needed to devise a method for
Legal Description & Site Plan Requirements and Layouts
 Legal Description & Site Plan Requirements and Layouts Plot Plan * A plot plan shows the location of a house from an aerial view. * The site plan, also known as a plot or lot plan includes: 1. Site plan
1. The topographic map below shows a depression contour line on Earth's surface.
 1. The topographic map below shows a depression contour line on Earth's surface. Points A, B, C, and D represent surface locations. Contour line elevations are in feet. Which profile best shows the topography
A contour line is a line that passes through points having the same elevation.* Definition
 Contour Lines A contour line is a line that passes through points having the same elevation.* Definition Eleven (11) characteristics of contour lines 1. Contour lines are continuous. 2. Contour lines are
Watershed Topography
 Watershed Topography Adapted from: An original Creek Connections activity. Creek Connections, Allegheny College, Meadville, Pennsylvania, 16335 Topography in Watersheds Grade Level: Basic to intermediate.
MAKE A CO NTO U R MAP
 Your web browser (Safari 7) is out of date. For more security, comfort and the best experience on this site: Update your browser Ignore Activitydevelop Student Version MAKE A CO NTO U R MAP How does a
AutoCAD 2016 for Civil Engineering Applications
 Introduction to AutoCAD 2016 for Civil Engineering Applications Learning to use AutoCAD for Civil Engineering Projects Nighat Yasmin Ph.D. SDC P U B L I C AT I O N S Better Textbooks. Lower Prices. www.sdcpublications.com
CHAPTER 3 MARGINAL INFORMATION AND SYMBOLS
 CHAPTER 3 MARGINAL INFORMATION AND SYMBOLS A map could be compared to any piece of equipment, in that before it is placed into operation the user must read the instructions. It is important that you, as
Maps and map interpretation An introduction for geoscientists
 Maps and map interpretation An introduction for geoscientists Produced by the University of Derby in conjunction with UKOGL Aims This teaching package provides an introduction to maps and how to identify
Photo Scale The photo scale and representative fraction may be calculated as follows: PS = f / H Variables: PS - Photo Scale, f - camera focal
 Scale Scale is the ratio of a distance on an aerial photograph to that same distance on the ground in the real world. It can be expressed in unit equivalents like 1 inch = 1,000 feet (or 12,000 inches)
Ch. 1.3: Topographic Maps
 Ch. 1.3: Topographic Maps StudentS will be able to Explain what are topographic maps Read a topographic map Create a topographic map "Geologists don't dislike classical music, they just prefer rock." Topographic
UNITED STATES MARINE CORPS FIELD MEDICAL TRAINING BATTALION Camp Lejeune, NC
 UNITED STATES MARINE CORPS FIELD MEDICAL TRAINING BATTALION Camp Lejeune, NC 28542-0042 FMST 206 Land Navigation TERMINAL LEARNING OBJECTIVE 1. Given a military topographic map, protractor, and objective,
Important Questions. Surveying Unit-II. Surveying & Leveling. Syllabus
 Surveying Unit-II Important Questions Define Surveying and Leveling Differentiate between Surveying and Leveling. Explain fundamental Principles of Surveying. Explain Plain and Diagonal Scale. What is
CONTOURS SURVEYING 1 CE 215 CHAPTER -3- Ishik University / Sulaimani Civil Engineering Department 12/7/2017. Ishik University / Sulaimani
 Civil Engineering Department SURVEYING 1 CE 215 CHAPTER -3- CONTOURS 1 2 1 3 4 2 PURPOSE OF CONTOURING Contour survey is carried out at the starting of any engineering project such as a road, a railway,
Engineering Surveying -1 CE212 Contouring Lectures. Lecture 2016, November 29 th Muhammad Noman
 Engineering Surveying -1 CE212 Contouring Lectures Lecture 2016, November 29 th Muhammad Noman Contour An Imaginary line on the ground surface joining the points of equal elevation is known as contour.
Introduction to Computer Science with MakeCode for Minecraft
 Introduction to Computer Science with MakeCode for Minecraft Lesson 3: Coordinates This lesson will cover how to move around in a Minecraft world with respect to the three-coordinate grid represented by
Name: Topographic Profiles Multiple Choice
 1. Base your answer to the following question on the topographic map below. Points A and B represent locations on the map. Elevations are shown in meters. Which diagram best represents the topographic
CHAPTER 3-LAB 1: A TOPOGRAPHIC MAP IN THREE DIMENSIONS
 Name Teacher Period Date CHAPTER 3-LAB 1: A TOPOGRAPHIC MAP IN THREE DIMENSIONS Introduction A topographic map shows the shape ofthe land surface with contour lines. On page 29 you will find Figure 3-6,
Gradient and Rate of Change
 Name: 1. Base your answer(s) to the following question(s) on the topographic map shown below. Letters A, B, C, and D represent locations on Earth s surface. The symbol marks the highest elevation on Patty
Lecture # 7 Coordinate systems and georeferencing
 Lecture # 7 Coordinate systems and georeferencing Coordinate Systems Coordinate reference on a plane Coordinate reference on a sphere Coordinate reference on a plane Coordinates are a convenient way of
Introduction to Photogeology
 Geological Mapping 1 Academic Year 2016/2017 Introduction to Photogeology Igor Vlahović igor.vlahovic@rgn.hr Today we will say a little about basic photogeological analysis of terrain: about aerial photographs,
Terrain Modeling with ArcView GIS
 What You Will Need: A Pentium class PC with 32 MB of RAM (minimum) and 100 MB of free hard drive space, ArcView GIS 3.1 or higher and WinZip or an equivalent program, and an Internet connection. Data and/or
East Bay Municipal Utility District. Study Guide for Survey Technician I
 East Bay Municipal Utility District Study Guide for Survey Technician I Summer 2018 TABLE OF CONTENTS PAGE Introduction... 1 Scoring... 1 Visual Perception... 2 Sample Questions 1-2... 2 Reading and Interpreting
NREM 345 Week 2, Material covered this week contributes to the accomplishment of the following course goal:
 NREM 345 Week 2, 2010 Reading assignment: Chapter. 4 and Sec. 5.1 to 5.2.4 Material covered this week contributes to the accomplishment of the following course goal: Goal 1: Develop the understanding and
3. GPS receiver instruction cards GPS receivers
 Subject: GPS (& how its applications with Agriculture) Date: June 10, 2010 Lesson Title: Where exactly are we? Grade Level: Upper Elementary/Middle School Time period: 60-90 minutes Lesson Objectives:
GPS 101. An Introduction to Using a GPS Receiver
 GPS 101 An Introduction to Using a GPS Receiver The goal of this presentation if to provide a basic understanding of what is GPS, how it works, provide some basic terminology and to provide ideas on how
Chapter 6 Navigation and Field Mapping
 Chapter 6 Navigation and Field Mapping In this chapter you will learn about: Orienting maps Measuring a bearing on a map Plotting points on a map using latitude/longitude Plotting points on a map using
PHOTOGRAMMETRY STEREOSCOPY FLIGHT PLANNING PHOTOGRAMMETRIC DEFINITIONS GROUND CONTROL INTRODUCTION
 PHOTOGRAMMETRY STEREOSCOPY FLIGHT PLANNING PHOTOGRAMMETRIC DEFINITIONS GROUND CONTROL INTRODUCTION Before aerial photography and photogrammetry became a reliable mapping tool, planimetric and topographic
Lab Exercise #3 Introduction to the Digital Globe Google Earth Geo210 Rockland Community College Professor Paluzzi Due Date:
 Lab Exercise #3 Introduction to the Digital Globe Google Earth Geo210 Rockland Community College Professor Paluzzi Due Date: The Digital Globe: Google Earth 30 Points Purpose: This lab will introduce the
Section E NSPS MODEL STANDARDS FOR TOPOGRAPHIC SURVEYS Approved 3/12/02
 Section E NSPS MODEL STANDARDS FOR TOPOGRAPHIC SURVEYS Approved 3/12/02 1. INTRODUCTION This standard is written to provide the professional surveyor (Surveyor) and the client with a guideline for producing
Following are the geometrical elements of the aerial photographs:
 Geometrical elements/characteristics of aerial photograph: An aerial photograph is a central or perspective projection, where the bundles of perspective rays meet at a point of origin called perspective
Markville Secondary School Geography Department
 Markville Secondary School Geography Department CGC1D1 Geography of Canada PERFORMANCE TASK - UNITS 1 AND 2 February 2012 DUE DATE: Parent Signature: CONTOUR MAP AND MODEL The performance task for the
Title: How steep are those hills? Engineering Grade: Estimated Time: 3 hours (2 days) Groups: 3 to 4 students
 Groups: 3 to 4 students") Title: How steep are those hills? Engineering Grade: 10-12 Estimated Time: 3 hours (2 days) Groups: 3 to 4 students Synopsis: Students will be able to understand the concept of surveying and mapping ground
Title: How steep are those hills? Engineering Grade: 10-12 Estimated Time: 3 hours (2 days) Groups: 3 to 4 students Synopsis: Students will be able to understand the concept of surveying and mapping ground
Relief Displacement of Vertical Features
 G 210 Lab. Relief Displacement of Vertical Features An increase in the elevation of a feature causes its position on the photograph to be displaced radially outward from the principle point. Hence, when
Floods On The Minnesota River Planning For St. Peter
 Floods On The Minnesota River Planning For St. Peter Group Members Section: A B C D E In this lab, we will make a flood hazard map for the city of St. Peter. We will use the 100-year flood as the design
AIM. What is-a contour map? 23-
 .. '; AIM 23- What is-a contour map?.,,.,, I. There are many different kinds of maps. The maps we use most often are surface maps. A surface map is a drawing. It shows all or part of the earth's surface.
Lesson 8: Surveying the Forest
 Lesson 8: Surveying the Forest TEACHER: SCHOOL: GRADE LEVEL: 9-12 TASKS/COMPETENCIES ANR8046.172 Set up and operate a transit level and rod. ANR8046.173 Read a rod and a level to calculate slope. ANR8046.174
Department of Civil and Environmental Engineering
 Department of Civil and Environmental Engineering CEE213L Surveying & Introduction to GIS Lab SURVEYING LABORATORY NORTH SOUTH UNIVERSITY Center of Excellence in Higher Education The First Private University
Contour An imaginary line on the ground surface joining the points of equal elevation is known as contour.
 Contour An imaginary line on the ground surface joining the points of equal elevation is known as contour. In other words, contour is a line in which the ground surface is intersected by a level surface
A-CR-CCP-803/PF-001 CHAPTER 14 PO 337 DEMONSTRATE AIR NAVIGATION SKILLS
 CHAPTER 14 PO 337 DEMONSTRATE AIR NAVIGATION SKILLS ROYAL CANADIAN AIR CADETS PROFICIENCY LEVEL THREE INSTRUCTIONAL GUIDE SECTION 1 EO M337.01 MEASURE DISTANCE ALONG A ROUTE Total Time: 30 min PREPARATION
NWP of 10 Enclosure
 #6301 4/16/2018 Pacific Habitat Services, Inc. 9450 SW Commerce Circle, Suite 180 Wilsonville, OR 97070 Project Site General Location and Topography Reed Pit Expansion - Marion County, Oregon United States
GPS for Snowmobilers. By Wayne Fischer. November 14, 2006
 GPS for Snowmobilers By Wayne Fischer November 14, 2006 Wayne@TahoeSnowmobiling.org Copy of White Paper & Presentation Both this presentation and the white paper are available on the www.tahoesnowmobiling.org
Lesson 14: Computing Actual Lengths from a Scale Drawing
 Classwork Example 1 The distance around the entire small boat is units. The larger figure is a scale drawing of the smaller drawing of the boat. State the scale factor as a percent, and then use the scale
MAPPING YOUR STREAM. TIME REQUIRED 50 minutes in Field 50 minutes in Classroom 50 minutes Homework
 OUR MAPPING YOUR STREAM STREAM ACTIVITY SUMMARY Students will draft a cross-sectional profile of the stream and measure the velocity of the current. They will use both of these to calculate the discharge
Essential Skills: Reading and Interpreting Maps and Plans
 Essential Skills: Reading and Interpreting Maps and Plans Prepared for: NEW YORK STATE PLANNING FEDERATION April 14, 2015 Prepared by: BME ASSOCIATES Peter G. Vars, P.E. Stages of Plan Review Concept /
v Introduction Images Import images in a variety of formats and register the images to a coordinate projection WMS Tutorials Time minutes
 v. 10.1 WMS 10.1 Tutorial Import images in a variety of formats and register the images to a coordinate projection Objectives Import various types of image files from different sources. Learn how to work
Date Requested, 200_ Work Order No. Funding source Name of project Project limits: Purpose of the project
 Bureau of Engineering SURVEY DIVISION REQUEST FOR TOPOGRAPHIC SURVEY Date Requested, 200_ Work Order No. Funding source Name of project Project limits: Purpose of the project Caltrans involvement (must
COURSE SYLLABUS SURVEYING I
 Solution Manual for Surveying Fundamentals and Practices 6th Edition by Nathanson Lanzafama Emeritus Link full download: http://testbankcollection.com/download/solution-manual-forsurveying-fundamentals-and-practices-6th-edition-by-nathanson-lanzafamaemeritus/
9/13/2011. Training Course Remote Sensing Basic Theory & Image Processing Methods September 2011
 Training Course Remote Sensing Basic Theory & Image Processing Methods 19 23 September 2011 DIGITAL TERRAIN MODELS Introduction Michiel Damen (April 2011) damen@itc.nl 1 Digital Elevation and Terrain Models
GEO-SLOPE International Ltd, Calgary, Alberta, Canada Relief Well Spacing
 1 Introduction Relief Well Spacing Relief wells are commonly installed on the downstream side of an earth dam to control the seepage and pore-pressures (e.g. levee; Figure 1). A key design requirement
Dr. Heather Petcovic TECHNOLOGY FOR TEACHING: HANDHELD GPS AND EARTHCACHING
 TECHNOLOGY FOR TEACHING: HANDHELD GPS AND EARTHCACHING Dr. Heather Petcovic Department of Geosciences and the Mallinson Institute for Science Education TECHNOLOGY FOR TEACHING: HANDHELD GPS AND EARTHCACHING
Lecture Series SGL 308: Introduction to Geological Mapping Lecture 8 LECTURE 8 REMOTE SENSING METHODS: THE USE AND INTERPRETATION OF SATELLITE IMAGES
 LECTURE 8 REMOTE SENSING METHODS: THE USE AND INTERPRETATION OF SATELLITE IMAGES LECTURE OUTLINE Page 8.0 Introduction 114 8.1 Objectives 115 115 8.2 Remote Sensing: Method of Operation 8.3 Importance
CH 21 2-SPACE. Ch 21 2-Space. y-axis (vertical) x-axis. Introduction
 x-axis. Introduction") 197 CH 21 2-SPACE Introduction S omeone once said A picture is worth a thousand words. This is especially true in math, where many ideas are very abstract. The French mathematician-philosopher René Descartes
197 CH 21 2-SPACE Introduction S omeone once said A picture is worth a thousand words. This is especially true in math, where many ideas are very abstract. The French mathematician-philosopher René Descartes
47 CFR Ch. I ( Edition)
") 73.684 should decrease more rapidly with distance beyond the horizon than for Channels 2 6, and modification of the curves for Channels 14 69 may be expected as a result of measurements to be made at a
73.684 should decrease more rapidly with distance beyond the horizon than for Channels 2 6, and modification of the curves for Channels 14 69 may be expected as a result of measurements to be made at a
Chapter Four AIRPORT LAYOUT PLAN SET COMPONENTS
 The purpose of this chapter is to present the graphic representation of the items addressed and recommended in Chapter Three Demand Capacity Analysis and Facility Requirements (page 3-1). The Airport Layout
Slope analysis & Grading. Earth shape and earthwork Topographic map Slope form Slope analysis Grading
 6 Slope analysis & Grading Earth shape and earthwork Topographic map Slope form Slope analysis Grading 81 Topographic Map Topographic Contour map Topographic contour map are composed of a series of line
Markville Secondary School Geography Department
 Markville Secondary School Geography Department CGC1D1 Geography of Canada PERFORMANCE TASK - UNIT 1 AND 2 DUE DATE: SEPTEMBER 2011 Parent Signature: CONTOUR MAP AND MODEL The performance task for Geography
Exploring the Earth with Remote Sensing: Tucson
 Exploring the Earth with Remote Sensing: Tucson Project ASTRO Chile March 2006 1. Introduction In this laboratory you will explore Tucson and its surroundings with remote sensing. Remote sensing is the
Hydraulics and Floodplain Modeling Managing HEC-RAS Cross Sections
 v. 9.1 WMS 9.1 Tutorial Hydraulics and Floodplain Modeling Managing HEC-RAS Cross Sections Modify cross sections in an HEC-RAS model to use surveyed cross section data Objectives Build a basic HEC-RAS
Project Planning and Cost Estimating
 CHAPTER 17 Project Planning and Cost Estimating 17.1 INTRODUCTION Previous chapters have outlined and detailed technical aspects of photogrammetry. The basic tasks and equipment required to create various
Measurement and Data Core Guide Grade 4
 Solve problems involving measurement and conversion of measurements from a larger unit to a smaller unit (Standards 4.MD.1 2) Standard 4.MD.1 Know relative sizes of measurement units within each system
Hartwell Lake Application for Dry Dredging
 Hartwell Lake Application for Dry Dredging Applicant: Mailing Address: E-Mail Address: Day Time Phone Number/s: Dredging Site Address: Subdivision: Lot #: Shoreline Use Permit #: Next Upstream Permit #,
GUIDELINES FOR MEASURING BUILDING HEIGHT
 GUIDELINES FOR MEASURING BUILDING HEIGHT THE CITY S POLICIES ON BUILDING HEIGHT In 1994, the City adopted a new General Plan that sets direction for development within Brisbane. Among its policies affecting
Section 1.3. Slope of a Line
 Slope of a Line Introduction Comparing the Steepness of Two Objects Two ladders leaning against a building. Which is steeper? We compare the vertical distance from the base of the building to the ladder
1 : 5,000 1cm to 100m
 4.1.1 Scales and Converting Scales In Hong Kong maps, there are 2 types of scales: 1. 1:5000 (Black and white with no color) 2. 1:20000 (With color) If there is no unit in a representative fraction scale,
Introduction to Datums James R. Clynch February 2006
 Introduction to Datums James R. Clynch February 2006 I. What Are Datums in Geodesy and Mapping? A datum is the traditional answer to the practical problem of making an accurate map. If you do not have
v WMS 10.0 Tutorial Introduction Images Read images in a variety of formats and register the images to a coordinate projection
 v. 10.0 WMS 10.0 Tutorial Read images in a variety of formats and register the images to a coordinate projection Objectives Read various types of image files from different sources. Learn how to work with
ENGINEERING GRAPHICS ESSENTIALS
 ENGINEERING GRAPHICS ESSENTIALS Text and Digital Learning KIRSTIE PLANTENBERG FIFTH EDITION SDC P U B L I C AT I O N S Better Textbooks. Lower Prices. www.sdcpublications.com ACCESS CODE UNIQUE CODE INSIDE
Lesson 10. Unit 2. Reading Maps. Graphing Points on the Coordinate Plane
 Lesson Graphing Points on the Coordinate Plane Reading Maps In the middle ages a system was developed to find the location of specific places on the Earth s surface. The system is a grid that covers the
Oakland County Michigan Register of Deeds Plat Engineering, GIS, & Remonumentation Dept. Ph: (248) Fax (248)
 Fax (248)") Oakland County Michigan Register of Deeds Plat Engineering, GIS, & Remonumentation Dept. Ph: (248)-858-1447 Fax (248)-858-7466 Requirements Needed for Final Condominium Approval General Requirements. 1
Oakland County Michigan Register of Deeds Plat Engineering, GIS, & Remonumentation Dept. Ph: (248)-858-1447 Fax (248)-858-7466 Requirements Needed for Final Condominium Approval General Requirements. 1
REVIEW TOPICS CEEN 2320 FINAL EXAM
 REVIEW TOPICS CEEN 2320 FINAL EXAM Be familiar with all materials covered in class, your class handouts and the notes you took in class, your homework assignments, test questions, formulas, tables, figures.
Water Well Report ES
 Water Well Report Prepared for: Banks Environmental Data, Inc. 1601 Rio Grande, Ste. 331 Austin, TX 78701 Water Well Report Commercial Property Airline Drive Houston, TX Harris County PO #: 123456.7 ES-100000
Guide to Developing a Stream Photograph Documentation Program
 Guide to Developing a Stream Photograph Documentation Program William Robertson: MSUEWQ & BSWC Introduction Landscape photographs can offer a qualitative and, in some situations, quantitative evaluation
PHOTOGRAMMETRIC RESECTION DIFFERENCES BASED ON LABORATORY vs. OPERATIONAL CALIBRATIONS
 PHOTOGRAMMETRIC RESECTION DIFFERENCES BASED ON LABORATORY vs. OPERATIONAL CALIBRATIONS Dean C. MERCHANT Topo Photo Inc. Columbus, Ohio USA merchant.2@osu.edu KEY WORDS: Photogrammetry, Calibration, GPS,
Scientific Investigation Use and Interpret Graphs Promotion Benchmark 3 Lesson Review Student Copy
 Scientific Investigation Use and Interpret Graphs Promotion Benchmark 3 Lesson Review Student Copy Vocabulary Data Table A place to write down and keep track of data collected during an experiment. Line
Radio Mobile. Software for Wireless Systems Planning
 Latin American Networking School (EsLaRed) Universidad de Los Andes Merida Venezuela Javier Triviño and E.Pietrosemoli Radio Mobile Software for Wireless Systems Planning About Radio Mobile It is a tool
not to be republished NCERT Introduction To Aerial Photographs Chapter 6
 Chapter 6 Introduction To Aerial Photographs Figure 6.1 Terrestrial photograph of Mussorrie town of similar features, then we have to place ourselves somewhere in the air. When we do so and look down,
STATE UNIVERSITY CONSTRUCTION FUND
 DIRECTIVE 1C-12 Issue date: August 2012 1. General SURVEY, MAPPING AND UTILITY LOCATING This Directive has been developed as a general guide for the survey and mapping effort required for Fund projects.
At the conclusion of this unit you should be able to accomplish the following with a 70% accuracy
 7 Multiview Drawing OBJECTIVES At the conclusion of this unit you should be able to accomplish the following with a 70% accuracy 1. explain the importance of mulitview drawing as a communication tool far
CONTRACT PLANS READING
 CONTRACT PLANS READING A training course developed by the FLORIDA DEPARTMENT OF TRANSPORTATION This 2009 revision was carried out under the direction of Ralph Ellis, P. E., Associate Professor of Civil
SPECIAL PUBLIC NOTICE
 SPECIAL PUBLIC NOTICE Draft Map and Drawing Standards for the South Pacific Division Regulatory Program August 6, 2012 Corps contacts: Sacramento District: Michael Finan (916) 557-5324 (Michael.C.Finan@usace.army.mil)
PART 1 Basic Land Navigation
 www.landnavigation.org www.landnavigation.weebly.com LAND NAVIGATION WITH MAP AND LENSATIC COMPASS PART 1 Basic Land Navigation STUDENT HANDBOOK 1 USING THE MILITARY LENSATIC COMPASS WARNING This presentation
Geodesy, Geographic Datums & Coordinate Systems
 Geodesy, Geographic Datums & Coordinate Systems What is the shape of the earth? Why is it relevant for GIS? 1/23/2018 2-1 From Conceptual to Pragmatic Dividing a sphere into a stack of pancakes (latitude)