Ch. 1.3: Topographic Maps
|
|
|
- Arthur Rich
- 6 years ago
- Views:
Transcription

1 Ch. 1.3: Topographic Maps StudentS will be able to Explain what are topographic maps Read a topographic map Create a topographic map "Geologists don't dislike classical music, they just prefer rock."
2 Topographic Maps Maps that show the change in elevation of land. Elevation is the height of land above the level of the sea.
3 Topographic Maps Elevation is shown by contour lines. Elevation starts at (0) sea level.
4

5 Contour Lines Lines on a map that connect points of equal elevation Every point on a contour line has the same elevation. Contour lines NEVER touch.


6 Imagine it this way. Rising water and Spray Paint! Every time the water rose, we painted the level of the water. We also plotted the elevation of the water. When the water receded, we were left with the paint rings. We just created contour lines. Everywhere on the line is equal in elevation. Look down from above to visualize a topographic map.


7 Where the lines Come From Topographic Map (as seen from above) Actual Land
8 Joke Q. What do you call a map guide to Alcatraz? A. A con-tour map.


9 Index Contours The darker, thicker contour lines are called: INDEX CONTOURS Typically every 5 th line on a Topo map is an index contour.
10 Joke Q:What do penguins wear on their heads? A:Ice caps.


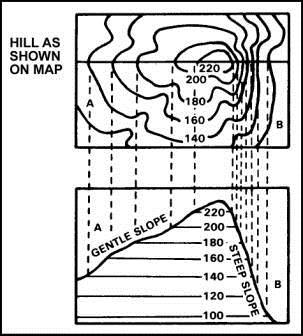
11 Topographic Profile Helps us to see the actual shape of land. Follow these simple steps to draw a profile:
12 Contour Intervals The word interval means THE DIFFERENCE BETWEEN. When you go from contour line to another the elevation changes. The difference in elevation from one line to another is called the CONTOUR INTERVAL. Find an index contour. Find an index contour that is right BELOW the one you just found. Subtract the two index contours. Divide that number by 5 (or the number of contour lines to the next index contour).


13 Contour Intervals = 10 0
14 Joke Q:What did the sea say to the shore? A:Nothing, it just waved!
15 Rivers and Streams Shown by V-shaped contour lines. V s point in the direction water is COMING FROM. Water always moves from up high to down low (higher contours to lower contours). NORTH SOUTH
16 North South
17 Shape of the Land What do we notice about the shape of the land and the arrangement of contours?

18 Steep and Gentle Slopes GENTLE SLOPES: Contour lines are far apart. STEEP SLOPES: Contour lines are close together
19

20


21 Hills and Depressions Shown by closed-circles o A hill: land that raises up-hill. When you see hachure marks you re looking at a depression. Example: A VOLCANO!!!
22
23 Hill or Depression 40 10
24 Topographic Maps Reading in-between the lines What is the elevation at point A? = 20 What is the elevation at point B? = 90
25 Topographic Maps Reading in-between the lines What would the terrain look like if you were to walk from point A to point B? Up hill.
26 Approximately how tall is Able Hill?
27 How many meters of elevation are there between contour lines on the topographic map?
28 Which mountain is steeper?

29 what are the bold contours called?
30 What is the contour interval?
31 Joke Q. What projection do birds use to track their migration? A. A robins-son (Robinson) projection.
32 1) The elevation at Point A is a) 60 m b) 140 m c) 100 m d) 300 m
33 2. In which direction is the stream flowing? a) northwest b) Southwest c) Northeast d) Southeast
34 3. Which side of Lookout Hill has the steepest slope? a) North b) East c) South d) West

35 What is the contour Interval?
36
37
38 B. Continue Step A for points B-H
39 C. Connect the dots for each contour line, following the shape of the coastline.
40 C. Connect the dots for each contour line, following the shape of the coastline.
41 C. Connect the dots for each contour line, following the shape of the coastline.
42 Finish the mountain diagram below the topographic map, completing Oak Hill and drawing Ash Hill with proper elevations.

43 Finish the mountain diagram below the topographic map, completing Oak Hill and drawing Ash Hill with proper elevations.
Module 2: Mapping Topic 3 Content: Topographic Maps Presentation Notes. Topographic Maps
 Topographic Maps 1 Take a few moments to study the map shown here of Isolation Peak, Colorado. What land features do you notice? Do you thinking hiking through this area would be easy? Did you see the
1. The topographic map below shows a depression contour line on Earth's surface.
 1. The topographic map below shows a depression contour line on Earth's surface. Points A, B, C, and D represent surface locations. Contour line elevations are in feet. Which profile best shows the topography
PRE-LAB for: Introduction to Aerial Photographs and Topographic maps (Ch. 3)
") GEOLOGY 306 Laboratory Instructor: TERRY J. BOROUGHS NAME: PRE-LAB for: Introduction to Aerial Photographs and Topographic maps (Ch. 3) For this assignment you will require: a calculator and metric ruler.
GEOLOGY 306 Laboratory Instructor: TERRY J. BOROUGHS NAME: PRE-LAB for: Introduction to Aerial Photographs and Topographic maps (Ch. 3) For this assignment you will require: a calculator and metric ruler.
Gradient and Rate of Change
 Name: 1. Base your answer(s) to the following question(s) on the topographic map shown below. Letters A, B, C, and D represent locations on Earth s surface. The symbol marks the highest elevation on Patty
MAKE A CO NTO U R MAP
 Your web browser (Safari 7) is out of date. For more security, comfort and the best experience on this site: Update your browser Ignore Activitydevelop Student Version MAKE A CO NTO U R MAP How does a
TOPOGRAPHIC MAPS A NEW WAY TO VIEW THE WORLD!
 TOPOGRAPHIC MAPS A NEW WAY TO VIEW THE WORLD! http://courtneyjennings.weebly.com/unit-4---weathering-erosiontopo-maps-past.html A topographic map, simply put, is a two-dimensional representation of a portion
AutoCAD 2016 for Civil Engineering Applications
 Introduction to AutoCAD 2016 for Civil Engineering Applications Learning to use AutoCAD for Civil Engineering Projects Nighat Yasmin Ph.D. SDC P U B L I C AT I O N S Better Textbooks. Lower Prices. www.sdcpublications.com
BACKGROUND INFORMATION
 Build an Island INTRODUCTION For this assignment, you will be creating a topographic map and three-dimensional model of a fictional island that you have designed. You will start by exploring some basic
31, The following isoline map shows the variations in the relative strength of Earth's magnetic field from 1 (strong) to 11 (weak).
 to 11 (weak).") 31, The following isoline map shows the variations in the relative strength of Earth's magnetic field from 1 (strong) to 11 (weak). 33. The following four temperature field maps represent the same region
31, The following isoline map shows the variations in the relative strength of Earth's magnetic field from 1 (strong) to 11 (weak). 33. The following four temperature field maps represent the same region
A contour line is a line that passes through points having the same elevation.* Definition
 Contour Lines A contour line is a line that passes through points having the same elevation.* Definition Eleven (11) characteristics of contour lines 1. Contour lines are continuous. 2. Contour lines are
NAME: PERIOD: DATE: LAB PARTNERS: LAB #6 DRAWING A CONTOUR MAP FROM A THREE DIMENSIONAL MODEL
 NAME: PERIOD: DATE: LAB PARTNERS: LAB #6 DRAWING A CONTOUR MAP FROM A THREE DIMENSIONAL MODEL INTRODUCTION Since land distances and elevations on the earth's surface can be very great it is necessary to
Lab #4 Topographic Maps and Aerial Photographs
 Lab #4 Topographic Maps and Aerial Photographs Purpose To familiarize you with using topographic maps. Visualizing the shape of landforms from topographic maps is an essential skill in geology. Proficiency
Earth Sciences 089G Short Practical Assignment #4 Working in Three Dimensions
 Earth Sciences 089G Short Practical Assignment #4 Working in Three Dimensions Introduction Maps are 2-D representations of 3-D features, the developers of topographic maps needed to devise a method for
Land Navigation / Map Reading
 Land Navigation / Map Reading What is the Field Manual for map reading and land navigation? FM 3-25.26 What are the basic colors of a map, and what does each color represent? Black - Indicates cultural
Topographic Maps. Contour Lines
 Topographic Maps Our first task today will consist of locating ourselves with the help of a topographic map. GPS units that can tell you the location of any Dunkin' Donuts within a five mile radius. Paper
CONTOURS SURVEYING 1 CE 215 CHAPTER -3- Ishik University / Sulaimani Civil Engineering Department 12/7/2017. Ishik University / Sulaimani
 Civil Engineering Department SURVEYING 1 CE 215 CHAPTER -3- CONTOURS 1 2 1 3 4 2 PURPOSE OF CONTOURING Contour survey is carried out at the starting of any engineering project such as a road, a railway,
Surveying & Measurement. Detail Survey Topographic Surveying
 Surveying & Measurement Detail Survey Topographic Surveying Introduction Mapping surveys are made to determine the relief of the earth s surface and locate critical points on it. to determine the locations
CHAPTER 3-LAB 1: A TOPOGRAPHIC MAP IN THREE DIMENSIONS
 Name Teacher Period Date CHAPTER 3-LAB 1: A TOPOGRAPHIC MAP IN THREE DIMENSIONS Introduction A topographic map shows the shape ofthe land surface with contour lines. On page 29 you will find Figure 3-6,
Lab #8: Topographic Map Lab
 NAME: LAB TIME: TA NAME: Lab #8: Topographic Map Lab Topography is the shape of the land. Topographic maps are used to aid in the visualization of the shape of the land. Topographic maps include the accurate
Topography and Contouring Teaching Assistant Guide
 Topography and Contouring Teaching Assistant Guide Learning Objectives: At the end of the exercise the students will be able to read a contour map contour data draw a topographic profiles Getting Started
AIM. What is-a contour map? 23-
 .. '; AIM 23- What is-a contour map?.,,.,, I. There are many different kinds of maps. The maps we use most often are surface maps. A surface map is a drawing. It shows all or part of the earth's surface.
Introduction to Aerial Photographs and Topographic maps (Chapter 3)
") GEOLOGY 306 Laboratory Instructor: TERRY J. BOROUGHS NAME: Introduction to Aerial Photographs and Topographic maps (Chapter 3) For this assignment you will require: a calculator and metric ruler. Objectives:
GEOLOGY 306 Laboratory Instructor: TERRY J. BOROUGHS NAME: Introduction to Aerial Photographs and Topographic maps (Chapter 3) For this assignment you will require: a calculator and metric ruler. Objectives:
Shoe Box Activity Constructing a Topographic Map
 Shoe Box Activity Constructing a Topographic Map Background Information All maps are models of some feature of the real world. The kind of map oen used by scientists is called a contour or topographic
COPYRIGHTED MATERIAL. Contours and Form DEFINITION
 1 DEFINITION A clear understanding of what a contour represents is fundamental to the grading process. Technically defined, a contour is an imaginary line that connects all points of equal elevation above
Exploring rate of change in motion problems Block 4 Student Activity Sheet
 1. Sketch the graph of each elevator ride described. [EX3, page2] a. The elevator starts on floor 4 and rises at a rate of 1 floor per second. b. The elevator starts on floor -3 rises at a rate of 2 floors
Introduction to Aerial Photographs and Topographic maps (Chapter 7, 9 th edition) or (chapter 3, 8 th edition)
 or (chapter 3, 8 th edition)") GEOLOGY 306 Laboratory Instructor: TERRY J. BOROUGHS NAME: Introduction to Aerial Photographs and Topographic maps (Chapter 7, 9 th edition) or (chapter 3, 8 th edition) For this assignment you will require:
GEOLOGY 306 Laboratory Instructor: TERRY J. BOROUGHS NAME: Introduction to Aerial Photographs and Topographic maps (Chapter 7, 9 th edition) or (chapter 3, 8 th edition) For this assignment you will require:
Maps and map interpretation An introduction for geoscientists
 Maps and map interpretation An introduction for geoscientists Produced by the University of Derby in conjunction with UKOGL Aims This teaching package provides an introduction to maps and how to identify
ENVI.2030L Topographic Maps and Profiles
 Name ENVI.2030L Topographic Maps and Profiles I. Introduction A map is a miniature representation of a portion of the earth's surface as it appears from above. The environmental scientist uses maps as
Watershed Topography
 Watershed Topography Adapted from: An original Creek Connections activity. Creek Connections, Allegheny College, Meadville, Pennsylvania, 16335 Topography in Watersheds Grade Level: Basic to intermediate.
UNITED STATES MARINE CORPS FIELD MEDICAL TRAINING BATTALION Camp Lejeune, NC
 UNITED STATES MARINE CORPS FIELD MEDICAL TRAINING BATTALION Camp Lejeune, NC 28542-0042 FMST 206 Land Navigation TERMINAL LEARNING OBJECTIVE 1. Given a military topographic map, protractor, and objective,
Name: Topographic Profiles Multiple Choice
 1. Base your answer to the following question on the topographic map below. Points A and B represent locations on the map. Elevations are shown in meters. Which diagram best represents the topographic
Floods On The Minnesota River Planning For St. Peter
 Floods On The Minnesota River Planning For St. Peter Group Members Section: A B C D E In this lab, we will make a flood hazard map for the city of St. Peter. We will use the 100-year flood as the design
Engineering Surveying -1 CE212 Contouring Lectures. Lecture 2016, November 29 th Muhammad Noman
 Engineering Surveying -1 CE212 Contouring Lectures Lecture 2016, November 29 th Muhammad Noman Contour An Imaginary line on the ground surface joining the points of equal elevation is known as contour.
Level Curves, Partial Derivatives
 Unit #18 : Level Curves, Partial Derivatives Goals: To learn how to use and interpret contour diagrams as a way of visualizing functions of two variables. To study linear functions of two variables. To
Slope analysis & Grading. Earth shape and earthwork Topographic map Slope form Slope analysis Grading
 6 Slope analysis & Grading Earth shape and earthwork Topographic map Slope form Slope analysis Grading 81 Topographic Map Topographic Contour map Topographic contour map are composed of a series of line
The Picture Tells the Linear Story
 The Picture Tells the Linear Story Students investigate the relationship between constants and coefficients in a linear equation and the resulting slopes and y-intercepts on the graphs. This activity also
MOUNT MANGERE VOLCANO QUESTION & ANSWER SHEET (See accompanying map for stop locations)
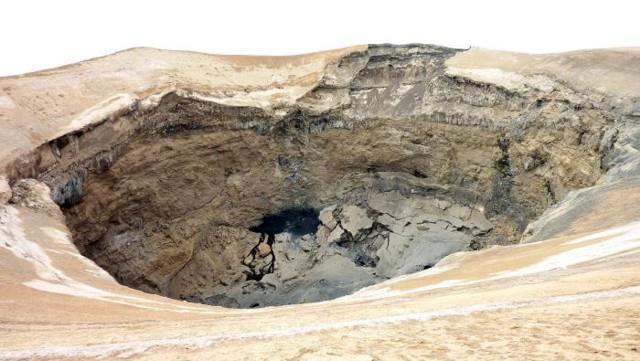
") MOUNT MANGERE VOLCANO QUESTION & ANSWER SHEET (See accompanying map for stop locations) STOP 1 - On edge of main crater. How was the crater formed? Can you see a small hill inside the crater? How might
MOUNT MANGERE VOLCANO QUESTION & ANSWER SHEET (See accompanying map for stop locations) STOP 1 - On edge of main crater. How was the crater formed? Can you see a small hill inside the crater? How might
Contour An imaginary line on the ground surface joining the points of equal elevation is known as contour.
 Contour An imaginary line on the ground surface joining the points of equal elevation is known as contour. In other words, contour is a line in which the ground surface is intersected by a level surface
Excellence in SAMPLE. Reading Skills. Year 4. Peter Howard
 Excellence in Reading Skills Year 4 Peter Howard Foreword Excellence in Reading Skills Year 4 is the fourth of six books aimed at primary children to help improve their reading and vocabulary. Students
Northern Pass. Transmission Project: Visual Simulations. The THE NORTHERN PASS SM. MAY 2011_v2
 The Northern Pass Transmission Project: Visual Simulations THE NORTHERN PASS SM Northern Pass PO Box 330 780 North Commercial Street Manchester, NH 03105-0330 800-286-7305 www.northernpass.us MAY 2011_v2
Investigate Slope. 1. By observation, A B arrange the lines shown in order of steepness, from least steep to steepest. Explain your. reasoning.
 6.5 Slope Focus on determining the slope of a line using slope to draw lines understanding slope as a rate of change solving problems involving slope The national, provincial, and territorial parks of
Following are the geometrical elements of the aerial photographs:
 Geometrical elements/characteristics of aerial photograph: An aerial photograph is a central or perspective projection, where the bundles of perspective rays meet at a point of origin called perspective
HOW TO USE BINOCULARS VOLUNTEER DIRECTIONS
 HOW TO USE BINOCULARS VOLUNTEER DIRECTIONS 1. Your station, How to Use Binoculars, will teach students magnification, focus, and wearing binoculars. You will also briefly discuss some of the distinctive
Perspective in Art. Yuchen Wu 07/20/17. Mathematics in the universe. Professor Hubert Bray. Duke University
 Perspective in Art Yuchen Wu 07/20/17 Mathematics in the universe Professor Hubert Bray Duke University Introduction: Although it is believed that science is almost everywhere in our daily lives, few people
MAPPING YOUR STREAM. TIME REQUIRED 50 minutes in Field 50 minutes in Classroom 50 minutes Homework
 OUR MAPPING YOUR STREAM STREAM ACTIVITY SUMMARY Students will draft a cross-sectional profile of the stream and measure the velocity of the current. They will use both of these to calculate the discharge
Date Requested, 200_ Work Order No. Funding source Name of project Project limits: Purpose of the project
 Bureau of Engineering SURVEY DIVISION REQUEST FOR TOPOGRAPHIC SURVEY Date Requested, 200_ Work Order No. Funding source Name of project Project limits: Purpose of the project Caltrans involvement (must
Title: How steep are those hills? Engineering Grade: Estimated Time: 3 hours (2 days) Groups: 3 to 4 students
 Groups: 3 to 4 students") Title: How steep are those hills? Engineering Grade: 10-12 Estimated Time: 3 hours (2 days) Groups: 3 to 4 students Synopsis: Students will be able to understand the concept of surveying and mapping ground
Title: How steep are those hills? Engineering Grade: 10-12 Estimated Time: 3 hours (2 days) Groups: 3 to 4 students Synopsis: Students will be able to understand the concept of surveying and mapping ground
IAN HUMBY TEACHING. List of Hand-Outs. Levelling
 IAN HUMBY TEACHING List of Hand-Outs Levelling 6-1 Equipment List (Levelling) 11-1 to 11-3 Introduction to Levelling 11-4 Levelling Terminology 12-1 to 12-2 Measuring Height Change by Basic Methods 13-1
Photograph #2: 11/29/12 Area 1, view facing northeast.
 Photograph #1: 11/29/12 Area 1,view facing southwest. Photograph #2: 11/29/12 Area 1, view facing northeast. 10404-03 Draft Final Supplemental Remedial Investigation #2 Page 1 of 25 June 2013 Photograph
Markville Secondary School Geography Department
 Markville Secondary School Geography Department CGC1D1 Geography of Canada PERFORMANCE TASK - UNITS 1 AND 2 February 2012 DUE DATE: Parent Signature: CONTOUR MAP AND MODEL The performance task for the
Line Graphs. Name: The independent variable is plotted on the x-axis. This axis will be labeled Time (days), and
, and") Name: Graphing Review Graphs and charts are great because they communicate information visually. For this reason graphs are often used in newspapers, magazines, and businesses around the world. Sometimes,
Name: Graphing Review Graphs and charts are great because they communicate information visually. For this reason graphs are often used in newspapers, magazines, and businesses around the world. Sometimes,
determining the relative height of different
 Levelling & Contouring Principle of levelling Principle:-The principle of levelling is to obtain horizontal line of sight with respect to which vertical distances of the points above or below this line
CHAPTER 3 MARGINAL INFORMATION AND SYMBOLS
 CHAPTER 3 MARGINAL INFORMATION AND SYMBOLS A map could be compared to any piece of equipment, in that before it is placed into operation the user must read the instructions. It is important that you, as
Book 10: Slope & Elevation
 Math 21 Home Book 10: Slope & Elevation Name: Start Date: Completion Date: Year Overview: Earning and Spending Money Home Travel and Transportation Recreation and Wellness 1. Budget 2. Personal Banking
14.1 Functions of Several Variables
 14 Partial Derivatives 14.1 Functions of Several Variables Copyright Cengage Learning. All rights reserved. 1 Copyright Cengage Learning. All rights reserved. Functions of Several Variables In this section
GUIDELINES FOR MEASURING BUILDING HEIGHT
 GUIDELINES FOR MEASURING BUILDING HEIGHT THE CITY S POLICIES ON BUILDING HEIGHT In 1994, the City adopted a new General Plan that sets direction for development within Brisbane. Among its policies affecting
Lesson 15: The Slope of a Non Vertical Line
 Classwork Opening Exercise Example Graph A Graph B a. Which graph is steeper? b. Write directions that explain how to move from one point on the graph to the other for each of Graph A and Graph B. c. Write
East Bay Municipal Utility District. Study Guide for Survey Technician I
 East Bay Municipal Utility District Study Guide for Survey Technician I Summer 2018 TABLE OF CONTENTS PAGE Introduction... 1 Scoring... 1 Visual Perception... 2 Sample Questions 1-2... 2 Reading and Interpreting
Legal Description & Site Plan Requirements and Layouts
 Legal Description & Site Plan Requirements and Layouts Plot Plan * A plot plan shows the location of a house from an aerial view. * The site plan, also known as a plot or lot plan includes: 1. Site plan
You will need 9x12 blue construction paper, SOFT LEAD pencil colors, an eraser, and a metric ruler.
 Here is a nice picture for a beginner to start using color. This is a copy of the black and white barn drawing so if you wish you can do that one first. Scroll down. You will need 9x12 blue construction
Sea Surface Backscatter Distortions of Scanning Radar Altimeter Ocean Wave Measurements
 Sea Surface Backscatter Distortions of Scanning Radar Altimeter Ocean Wave Measurements Edward J. Walsh and C. Wayne Wright NASA Goddard Space Flight Center Wallops Flight Facility Wallops Island, VA 23337
47 CFR Ch. I ( Edition)
") 73.684 should decrease more rapidly with distance beyond the horizon than for Channels 2 6, and modification of the curves for Channels 14 69 may be expected as a result of measurements to be made at a
73.684 should decrease more rapidly with distance beyond the horizon than for Channels 2 6, and modification of the curves for Channels 14 69 may be expected as a result of measurements to be made at a
Lecture 4 : Monday April 6th
 Lecture 4 : Monday April 6th jacques@ucsd.edu Key concepts : Tangent hyperplane, Gradient, Directional derivative, Level curve Know how to find equation of tangent hyperplane, gradient, directional derivatives,
NREM 345 Week 2, Material covered this week contributes to the accomplishment of the following course goal:
 NREM 345 Week 2, 2010 Reading assignment: Chapter. 4 and Sec. 5.1 to 5.2.4 Material covered this week contributes to the accomplishment of the following course goal: Goal 1: Develop the understanding and
Test Yourself. 11. The angle in degrees between u and w. 12. A vector parallel to v, but of length 2.
 Test Yourself These are problems you might see in a vector calculus course. They are general questions and are meant for practice. The key follows, but only with the answers. an you fill in the blanks
Crater Lake National Park Habitats
 Overview Students will identify essential components of a habitat and presence of habitat & bird species at various Klamath Basin Birding Trail Sites. California Science Standards Grade 3: 3.b.c.d.-L.S.
Beach monitoring with GPS William F Price Department of Civil Engineering, University of Brighton, BRIGHTON, BN1 4GJ, UK
 Beach monitoring with GPS William F Price Department of Civil Engineering, University of Brighton, BRIGHTON, BN1 4GJ, UK Abstract In common with many other countries that have an extended coastline, sea
Algebra 1 2 nd Six Weeks
 Algebra 1 2 nd Six Weeks Second Six Weeks October 6 November 14, 2014 Monday Tuesday Wednesday Thursday Friday October 6 B Day 7 A Day 8 B Day 9 A Day 10 B Day Elaboration Day Test 1 - Cluster 2 Test Direct
STEP-BY-STEP THINGS TO TRY FINISHED? START HERE NEW TO SCRATCH? CREATE YOUR FIRST SCRATCH PROJECT!
 STEP-BY-STEP NEW TO SCRATCH? CREATE YOUR FIRST SCRATCH PROJECT! In this activity, you will follow the Step-by- Step Intro in the Tips Window to create a dancing cat in Scratch. Once you have completed
Markville Secondary School Geography Department
 Markville Secondary School Geography Department CGC1D1 Geography of Canada PERFORMANCE TASK - UNIT 1 AND 2 DUE DATE: SEPTEMBER 2011 Parent Signature: CONTOUR MAP AND MODEL The performance task for Geography
Lecture Series SGL 308: Introduction to Geological Mapping Lecture 8 LECTURE 8 REMOTE SENSING METHODS: THE USE AND INTERPRETATION OF SATELLITE IMAGES
 LECTURE 8 REMOTE SENSING METHODS: THE USE AND INTERPRETATION OF SATELLITE IMAGES LECTURE OUTLINE Page 8.0 Introduction 114 8.1 Objectives 115 115 8.2 Remote Sensing: Method of Operation 8.3 Importance
Spatial Filtering of Surface Profile Data
 Spatial Filtering of Surface Profile Data/1 Spatial Filtering of Surface Profile Data Chapman Technical Note-TG-1 spat_fil.doc Rev-01-09 Spatial Filtering of Surface Profile Data/2 Explanation of Filtering
Photo 4: Looking north
 S 308 th Ln Interstate 5 28th Avenue S Photo 2: Looking east toward I-5 Photo 3: Looking west toward 2833 S 308 th Ln Monitoring Location M-27A 2833 S 308th Lane (Home) Federal Way, Washington Photo 4:
Graphs of linear equations will be perfectly straight lines. Why would we say that A and B are not both zero?
 College algebra Linear Functions : Definition, Horizontal and Vertical Lines, Slope, Rate of Change, Slopeintercept Form, Point-slope Form, Parallel and Perpendicular Lines, Linear Regression (sections.3
NWP of 10 Enclosure
 #6301 4/16/2018 Pacific Habitat Services, Inc. 9450 SW Commerce Circle, Suite 180 Wilsonville, OR 97070 Project Site General Location and Topography Reed Pit Expansion - Marion County, Oregon United States
Saderan a tutorial. page 1. Contents. Introduction
 page 1 Saderan a tutorial Introduction Contents Several people on the Cartographer s Guild forums asked for a tutorial about the style I used in my Saderan map. This document tries to deliver. This is
Measuring the Thickness of Fills & Coatings
 1. Why do it? The Dipstick helps you obtain the exact thickness of fills or coatings quickly and non-destructively without coring! Because of the extreme accuracy and repeatability of the Dipstick, you
History of Cartographic Landscape Representation
 History of Cartographic Landscape Representation Graphic representations Where is the observer? Here are the 2 most typical mapping situations: Above the surface with no perspective foreshortening Often
Motion Graphs. Plotting distance against time can tell you a lot about motion. Let's look at the axes:
 Motion Graphs 1 Name Motion Graphs Describing the motion of an object is occasionally hard to do with words. Sometimes graphs help make motion easier to picture, and therefore understand. Remember: Motion
Section E NSPS MODEL STANDARDS FOR TOPOGRAPHIC SURVEYS Approved 3/12/02
 Section E NSPS MODEL STANDARDS FOR TOPOGRAPHIC SURVEYS Approved 3/12/02 1. INTRODUCTION This standard is written to provide the professional surveyor (Surveyor) and the client with a guideline for producing
SHORT ANSWER. Write the word or phrase that best completes each statement or answers the question.
 Math 1316 Ch.1-2 Review Name SHORT ANSWER. Write the word or phrase that best completes each statement or answers the question. Provide an appropriate response. 1) Find the supplement of an angle whose
REVIEW TOPICS CEEN 2320 FINAL EXAM
 REVIEW TOPICS CEEN 2320 FINAL EXAM Be familiar with all materials covered in class, your class handouts and the notes you took in class, your homework assignments, test questions, formulas, tables, figures.
Introduction to Photogeology
 Geological Mapping 1 Academic Year 2016/2017 Introduction to Photogeology Igor Vlahović igor.vlahovic@rgn.hr Today we will say a little about basic photogeological analysis of terrain: about aerial photographs,
1 : 5,000 1cm to 100m
 4.1.1 Scales and Converting Scales In Hong Kong maps, there are 2 types of scales: 1. 1:5000 (Black and white with no color) 2. 1:20000 (With color) If there is no unit in a representative fraction scale,
Black Dot shows actual Point location
 207 Plate 1 Use of scanned archive aerial photographs, digital photogrammetry and GIS to plot river channel erosion along the Afon Trannon, Wales (part of the study by Mount et al 2000, 2003). Plate 2
PART 1 Basic Land Navigation
 www.landnavigation.org www.landnavigation.weebly.com LAND NAVIGATION WITH MAP AND LENSATIC COMPASS PART 1 Basic Land Navigation STUDENT HANDBOOK 1 USING THE MILITARY LENSATIC COMPASS WARNING This presentation
Relief Displacement of Vertical Features
 G 210 Lab. Relief Displacement of Vertical Features An increase in the elevation of a feature causes its position on the photograph to be displaced radially outward from the principle point. Hence, when
OMINECA MINING DIVISION
 A GEOI'HYSICAL REPORT ON llfe NARY CLAIMS OMINECA MINING DIVISION TABLE OF CONTENTS Page INTRODUC TION LOCATION 1969 FROGBAN AIRBORNE SURrn EQUIPMENT, RESULTS SURVEY AND DATA REDUCTION COBCLUSIONS AKD
BRUSH DRAWING AS APPLIED TO
 BRUSH DRAWING AS APPLIED TO Natural Forms and Common Objects by May Mallam YESTERDAY'S CLASSICS ITHACA, NEW YORK Cover and arrangement 2018 Yesterday s Classics, LLC. This edition, first published in 2018
MAKING A SCENE. Nigel Stillman
 MAKING A SCENE Warmaster is warfare on a whole new scale! Not just the Citadel Miniatures, but the scenery as well! Builder of the modular terrain boards used in last month s battle report, Nigel Stillman
The Basics. HECRAS Basis Input. Geometry Data - the basics. Geometry Data. Flow Data. Perform Hydraulic Computations. Viewing the Output
 The Basics HECRAS Basis Input Geometry Data. Flow Data. Perform Hydraulic Computations by G. Parodi WRS ITC The Netherlands Viewing the Output ITC Faculty of Geo-Information Science and Earth Observation
Appendix A Lower Columbia River Chart Datum Modeling
 Appendix A Lower Columbia River Chart Datum Modeling David Evans and Associates, Inc. David Evans and Associates, Inc. 2801 SE Columbia Way, Ste. 130 Vancouver, WA 98661 (360) 314-3200 1.0 Vertical Datum
CertainTeed INSTALLATION GUIDE SIMTEK FENCE PRODUCTS. Fence Installation Guide 3', 4' & 6' High
 CertainTeed INSTALLATION GUIDE SIMTEK FENCE PRODUCTS Fence Installation Guide 3', 4' & 6' High INSTALLATION GUIDE These instructions are designed to assist both professional installers and do-it-yourselfers
Hydraulics and Floodplain Modeling Managing HEC-RAS Cross Sections
 v. 9.1 WMS 9.1 Tutorial Hydraulics and Floodplain Modeling Managing HEC-RAS Cross Sections Modify cross sections in an HEC-RAS model to use surveyed cross section data Objectives Build a basic HEC-RAS
Question bank. Unit 1: Introduction
 Question bank Unit 1: Introduction 1. Define surveying. 2. State the objects of surveying 3. State and explain the principle of surveying 4. State and explain the classification of surveying 5. Differentiate
FENCE INSTALLATION GUIDE 6 HIGH FENCE
 FENCE INSTALLATION GUIDE 6 HIGH FENCE 1.866.648.9336 www.simtekfence.com INSTALLATION GUIDE These instructions are designed to assist both professional installers and do-it-yourselfers of SimTek decorative
Appendix A Site Reconnaissance Photographs
 Appendix A Site Reconnaissance Photographs PHOTOGRAPH 1. Access to the Site from the intersection of 7 th Street and Michigan Avenue Direction : West PHOTOGRAPH 2. Access to the Site from the intersection
Riches of the Earth Guidance Sheet 5
 Riches of the Earth Guidance Sheet 5 www.watershedlandscape.co.uk Recording individual features Several forms of recording are used to give as much information as possible about the feature being recorded.
HIGH RESOLUTION STEREO SATELLITE ELEVATION MAPPING ACCURACY ASSESSMENT INTRODUCTION
 HIGH RESOLUTION STEREO SATELLITE ELEVATION MAPPING ACCURACY ASSESSMENT Gerry Mitchell, P. Geo, Geophysicist, President PhotoSat Information Ltd. Vancouver, BC V6E 3S7 gerry@photosat.ca Kevin MacNabb, Geophysicist,
A Visual Display. A graph is a visual display of information or data. This is a graph that shows a girl walking her dog. Communicating with Graphs
 A Visual Display A graph is a visual display of information or data. This is a graph that shows a girl walking her dog. A Visual Display The horizontal axis, or the x-axis, measures time. Time is the independent