Algebra 1 2 nd Six Weeks
|
|
|
- Gervais McLaughlin
- 6 years ago
- Views:
Transcription
1 Algebra 1 2 nd Six Weeks Second Six Weeks October 6 November 14, 2014 Monday Tuesday Wednesday Thursday Friday October 6 B Day 7 A Day 8 B Day 9 A Day 10 B Day Elaboration Day Test 1 - Cluster 2 Test Direct Variation -parent functions (constant/linear) -constant of variation A Day 15 B Day 16 A Day 17 B Day Professional Development Day Slope -from a table, ordered pairs, equations, verbal PSAT Day 9-11 th Slope -from a table, ordered pairs, equations, verbal X and Y intercepts 20 A Day 21 B Day 22 A Day 23 B Day 24 A Day Applications Day (Changes to m & b) SKILL CHECK Graphing Linear Equations - Day 1 -use y = and f(x)= -from slope-intercept (solve for y and graph) -from standard form (x and y intercepts) Graphing Linear- Day 2 -transformations including function notation for specific a, b, c, and d values QUIZ 27 B Day 28 A Day 29 B Day 30 A Day 31 B Day Graphing Linear -Day 2 -transformations QUIZ Applications (Reasonable Domain and Range) Review Concepts -Slope -Intercepts -Graphing Linear -Direct Variation Test 2 Teacher Test Nov 3 A Day 4 B Day 5 A Day 6 B Day 7 A Day Writing Equations - Day 1 -given m and b -point/slope -given 2 points -from a table Writing Equations - Day 2 -verbal -go between forms Scatterplots -regression -correlation coefficient QUIZ 10 B Day 11 A Day 12 B Day 13 A Day 14 B Day Scatterplots -regression -correlation coefficient QUIZ Parallel & Perpendicular Lines Day 1 -use graphs to compare -write parallel and perpendicular lines -include horizontal and vertical -parallel and perpendicular with respect to the x & y axis (new) Parallel & Perpendicular Lines Day 2 1
2 2
3 Variables x and y show when =. k is called the of. We say, varies with. Identify k 1 y = -5x y = x y = x 2 k = k = k = Sketch a graph for each equation. Create a table for each graph. What do you notice about each graph and each table? 3
4 Find the constant of variation. a. y = 3 when x = 24 b. y = 36 when x = -9 c Assume y varies directly with x. Find the specified value. a. If y = 8 when x = 4, find y when x = 12. b. If y = -15 when x = 5, find x when y = -4. Summary: 4
5 Name Date Direct Variation For each table find the constant of variation (slope) and corresponding equation. 1. x y k = (slope) Equation 2. x k = (slope) y Equation Tell whether each illustrates a direct variation. If yes, why? 3. A person s arm span, and his or her height. 4. The number of eggs used in a particular recipe, and the number of cups of flour used. 5. The number of people sharing an apartment, and the number of dollars rent each one must pay a month. Find the constant of variation (k) for each. Assume y varies directly with x. 6. y = 12 when x = y = 7 when x = y = 36 when x = 4 5
6 Solve. Assume y varies directly with x. (Hint: Set up proportion) 9. If y = 2 when x = 6, find y when x = If x = 12 when y = 3, find x when y = If y = 7 when x = 2, find y when x = If y = 6 when x = 3, find x when y = Gary s wages vary directly with the times he works. If his wages for 5 hours are $60, what are his wages for 50 hours? 14. Kate earned $120 for 12 cars she washed. If the amount Kate earns varies directly with the number of cars she washed, how much will she earn for 5 cars? 6
7 Slope: Exploring Rate of Change Complete the table to show Heather s distance while bike riding. # of hours Calculation Total Distance Ordered Pair What does the ordered pair (3, 18) mean? 2. What is the rate of change for Heather s bike ride? 3. Write the equation that describes the relationship between the number of hours (h) Heather rides her bike and the total distance she travels (d). 4. Graph the ordered pairs from the table above. Label each axis. 5. a. What is the change in miles from (2, 12) to (5, 30)? b. How did you get this answer? c. On the graph, is the change in miles vertical or horizontal? 7
8 6. a. What is the change in hours from (2, 12) to (5, 30)? b. How did you get this answer? c. On the graph, is the change in hours vertical or horizontal? miles 7. a. What is the speed as a fraction? hour b. How did you get this answer? c. How do the answers you got in 5a and 6a relate to speed? 8. How did we find this speed using our x and y values on the graph? (What is in the numerator and what is in the denominator?) 9. We are creating an equation we can use to find slope/rate of change anytime! What do you think the equation is? 10. Complete the chart and show how you can use the definition of slope to find the rate of change in the following table. x y Slope = 8
9 H horizontal O zero slope Y crosses y-axis Y y = # V vertical U undefined slope X crosses x-axis X x = # y = - 4 x = - 3 I can find SLOPE (M) from Graph Table Ordered Pairs Equation x f(x) (2, -3) (5, -6) y = -2x + 5 9
10 SLOPE (M) SLOPE (M) RATIO Division! SLOPE (M) SLOPE (M) Slope-Intercept Form y = Mx + B x f(x) Ex: Find the slope: y = -2x + 5 Ex: Find the slope of the line that passes through the points (2, -3) (5, -6) y = ¼x + 3 y = x Rate of Change RATIO Steepness of a Line 10


 and (-3, -2) a. Positive b. Zero d.")

11 Evaluate: Algebra I HW: Slope Name Date Period Plot the points and draw a line through them. Without calculating, tell whether the slope of the line is positive, negative, zero or undefined. 1. (1, -4) and (5, -8) 2. (-3, 6) and (-3, 0) a. Positive b. Negative c. Zero d. Undefined a. Positive b. Negative c. Zero d. Undefined 3. (7, 1) and (-2, 1) 4. (-4, -5) and (-3, -2) a. Positive b. Negative c. Zero d. Undefined a. Positive b. Negative c. Zero d. Undefined Find the slope value of the line that passes through the points. 5. Slope = 6. Slope = 7. Slope = 11
12 Find the slope value of the line that passes through the points represented in each table. 8. Slope = 9. Slope = 10. Slope = x y x y x y Find the slope value of the line that passes through the points. 11. Slope = 12. Slope = 13. Slope = (3, 1) and (-5, 3) (3, 2) and (8, 2) (-5, -4) and (1, -2) Find the slope value from the following equations. 14.Slope = 15. Slope = 16. Slope = y = 2x + 7 y = -x -3 y = x + 8 Find the value of x or y so that the line passing through the two points has the given slope. 17. (-3, y), (-9, -2); m = (x, -7), (1, 2); m = (8, 1), (1, y); m = (7, 5), (x, 2); m = 12
13 x- and y-intercepts What is an x-intercept? What is a y-intercept? A. What are the x- and y-intercepts of the graph below? Write you answer as an ordered pair. x-intercept y-intercept Find the x- and y-intercepts in ordered pair form for the following two graphs. x-intercept y-intercept x-intercept y-intercept B. Write the coordinates for the x- and y-intercepts for the following examples. 1. x-intercept is 4 2. y-intercept is 4 3. y-intercept is x-intercept is x-intercept is 0 6. y-intercept is -3/4 C. Graph the equation 2 x + 3y = 6 and then find the x- and y-intercepts. Use your calculator to find good points! x-int: y-int: x y 13
14 Given the table below, what is the x-intercept and the y-intercept? x- intercept: y intercept: x y D. We can also find the intercepts using algebra rather than graphing. To find the x-intercept To find the y-intercept Find the x- and y-intercepts for the following examples using algebra. Show all work! 1. y = x y = x x 5y = x +9y = 12 14
15 Algebra 1 Name Linear Equations Assignment Date Period Given Equation X-Intercept Y-Intercept graph Solve for Y Slope 1. -3x + y = 4 x-intercept (, ) y-intercept (, ) 2. x 2y = 4 x-intercept (, ) y-intercept (, ) 3. y = 4 x-intercept (, ) y-intercept (, ) 4. x = -2 x-intercept (, ) y-intercept (, ) 15
16 Given Equation X-Intercept Y-Intercept graph Solve for Y Slope 5. 2x y = -1 x-intercept (, ) y-intercept (, ) 6. -3x + y = 0 x-intercept (, ) y-intercept (, ) 7. x y = 3 x-intercept (, ) y-intercept (, ) 8. x + y = -1 x-intercept (, ) y-intercept (, ) 16
17 17
18 Safari Hunt Treasure Map 18
19 Fill in the table for each situation. Interpreting Slope and Intercepts 19
20 Interpreting Slope and Intercepts 20
21 Interpreting Slope and Intercepts 21


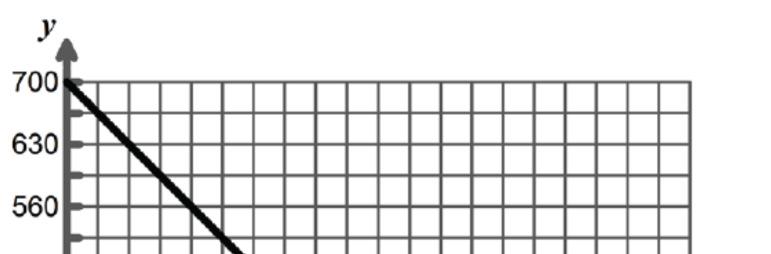
22 Name Date Understanding Slope and Intercepts Identify the correct answer choice. Explain why the other answer choices are wrong. 1. The graph shows the amount of gasoline in a car s gas tank after x hours. Which statement is true? A. The car uses 2 gallons of gas each hour. B. The car uses 8 gallons of gas every 4 hours. C. The car has a 16 gallon tank. D. The gas tank is empty after 4 hours. 2. Alex s office has a water cooler. The table shows how many liters y of water are left in the cooler x days after it is filled. Which statement describes the x-intercept of the function that models the data? A. The cooler holds 36 liters of water. B. The cooler is empty after 3 days. C. People drink 9 liters per day. D. People drink 12 liters per day. 3. The graph of the line models the amount of memory remaining on Julia s mp3 player as she adds songs to the device. In this situation, what does the slope of the line represent? A. The memory remaining decreases at a rate of approximately 4.2 MB per song. B. The memory remaining increases at a rate of approximately 4.2 MB per song. C. The memory remaining decreases at a rate of approximately 42 MB per song. D. The memory remaining increases at a rate of approximately 42 MB per song. 22

23 4. In the equation y = 2x + 3, y represents the total number of preseason and regular season games that your softball team played this summer. The variable x represents the number of weeks in the regular season. Which statement is true? A. The regular season lasts 2 weeks. B. The preseason lasts 2 weeks. C. Your team plays 3 preseason games. D. Your team plays 3 regular season games each week. 5. A particular mosaic tile is being used in a kitchen backsplash design. The graph of the equation that models the situation shows the relationship between the number of tiles needed and the length of the design in feet. Which of the following best describes the meaning of the slope of the line for this situation? A. The length of the design increases at a rate of 12 tiles per foot. B. The length of the design increases at a rate of 10 tiles per foot. C. The length of the design increases at a rate of 6 tiles per foot. D. The length of the design increases at a rate of 2 tiles per foot. 6. The cost of a plumbing repair includes a $50 fee plus a cost of $15 per hour. In a graph of the equation to model this situation, what does the $50 fee represent? A. x-intercept B. y-intercept C. slope D. point of intersection 23


24 7. Belinda bought lemonade to serve at her birthday party. The graph models the relationship between the number of glasses of lemonade served and the amount of lemonade remaining. In this situation, what does the x-intercept represent? A. Belinda is serving 12 ounces of lemonade per glass. B. Belinda started with 320 ounces of lemonade. C. Belinda has enough lemonade for about 26 servings. D. Belinda can serve about 5 people per gallon. 8. The equation y = 4x + 5 gives the elevation y in meters of an elevator as a function of x seconds. Which statement describes the meaning of the slope of the function? A. The elevator starts at 4 meters above street level. B. The elevator starts at 5 meters above street level. C. The elevator rises 5 meters per second. D. The elevator rises 4 meters per second. 9. Sam is walking down the stairs in his office building. The equation y = -4x + 11 gives his elevation y in floors above the street after x minutes. What statement is true? A. Sam starts below street level. B. Sam descends 4 floors per minute. C. Sam starts 4 floors above street level. D. Same descends 11 floors per minute. 24
25 Name: Algebra 1 Graphing Lines Graphing Lines For questions #1 3, graph the line that contains the two points listed. 1. (-3, 1) and (2, 6) 2. (1,-2) and (- 1, 2) 3. (0, 4) and (0, 7) Graph the following lines, given the slope and a point on the line. 4. m = 2/5 ; (0, -1) 5. m = -3 ; (0, 5) 6. m = 1/4 ; (0, 0) 25
26 7. m = 0 ; (-1, 6) 8. m = -1 ; (6, -2) 9. m = undefined ; (5, 4) For #10-15, solve for y. Then graph the line y + 3 = -2(x 5) 11. y + 4 = (x 3) 12. 5x + 4y = 20 3 m= (, ) m= (, ) (, ) & (, ) 13. 3x + 4y = X = y = 5x + 3 y= Two Points: (, ) & (, ) y= 26
27 HW Graphing Equations: Name Date Period Solve the following problems for the variable y and graph them on the graph provided. 1) 5x = y + 4 2) y - 10 = -4x 3) 6x + y = 6 4) 4x + 3y = 12 27
28 5) 6x - 2y = 2 6) 9x - 3y = 3 7) y -4 = 2 (x + 3) 8) y = -4x
29 Transformations to Linear Functions Engage 1. What is the linear parent function? 2. What is its slope? 3. What is its y-intercept? 4. Why is it considered a function? 5. What does its graph look like? 6. Where is its graph in relation to the origin? 7. What quadrants does its graph pass through? 8. What is its domain? 9. What is its range? 10. Why do you think it is called the parent function? 11. Compare and contrast the parent function to other lines that you have seen. 29
30 Changes to m and b EXPLORE 1. The parent function is y = x. Highlight (or circle) the part that is different on the y 2, and y 3 equations. 2. Sketch a graph of the following equations on the same coordinate plane, using a different color for each line. 1. y 1 = x y 2 = 2x y 3 = 5x 3. y 1 = x y 2 = x + 1 y 3 = x + 3 Describe the change of the slope and the change of the graph. Describe the change of the y-intercept and the change of the graph. 2. y 1 = x y 2 = 0.5x y 3 = 0.8x 4. y 1 = x y 2 = x 1 y 3 = x 5 Describe the change of the slope and the change of the graph. Describe the change of the y-intercept and the change of the graph. 30
31 Changes to and Meaning of m and b EXPLAIN Changes to m: What is the equation of the line on the graph? EQ: b = m = What is the difference between y = 6x + 1 and y = 2/3 x + 1? y = 6x + 1 m = b = What is the new equation if the slope is changed to 2? Graph this EQ. When the slope, the line got. y = 2 / 3 x + 1 m = b = When the slope, the line got. SUMMARY of changes to m: When the absolute value of the slope ( ) is increased, a line gets. When the absolute value of the slope ( ) is decreased, a line gets. When the sign of the slope ( ) is changed, the line changes. Changes to b: What is the equation of the line on the graph? EQ: b = m = What is the equation that results when you replace b with -3? What happens to the line? What kind of lines are these? What is the equation of the line on the graph? EQ: b = m = What is the equation of this line if it is translated 5 units up? What happens to the line? What kind of lines are these? SUMMARY of changes to b: When the y-intercept ( ) is changed, it results in a shift. A positive change means an shift. A negative change means a shift. 31
32 Meaning of m and b: 1. How do you find the y- intercept given the following linear representations a. an equation? 2. How do you find the slope given the following linear representations a. an equation? 3. What is the slope formula? b. a table or points? b. a table or points? 4. What does y mean? x c. a graph? c. a graph? Using this information, interpret the slope and y-intercept for each of the following: 5. a. What is the y-intercept? b. What does it mean? 6. a. What is the x-intercept? b. What does it mean? 7. a. What is the slope? b. What does it mean? 8. Label each axis as independent or dependent. 9. depends on. 10. How can the slope be interpreted given just the independent and dependent variables? Practice Equation: y = -25x What happens to the line if the slope changes to 50? 12. What happens to the line if the 500 is changed to a -40? 13. What would cause the line to shift up 15 units? 14. What would make the line flatter? 15. If the equation was a situation where amount of money in a savings account depends on the number of weeks, what is the meaning of the: slope? y-intercept? x-intercept? 32
33 Changes to and Meaning of m and b ELABORATE 1. A recording studio charges musicians a fee of $50 to record an album in their studio. Studio time costs an additional $35 per hour. Next year, the fee will go up to $100 for the recording and the hourly rate for studio time will change to $25. Original EQ: New EQ: What effects would these changes have on the graph? Meaning of the slope: Meaning of the y-intercept: 2. # bottles recycled $ made Slope and meaning: y-intercept and meaning: What would happen to the graph if you earned $0.07 per bottle you recycled? 3. Irma has a 12-gallon bucket. She fills the bucket with 9 gallons of water. The bucket has a crack and leaks water. x-intercept with meaning: y-intercept with meaning: Slope with meaning: Equation: Independent: Dependent: Domain: Range: What would happen to the graph if she only filled the bucket with 6 gallons? Andrew sells electronics. He earns 14% commission on his daily sales. x-intercept with meaning: y-intercept with meaning: Slope with meaning: Equation: Independent: Dependent: Domain: Range: What would happen to the graph if he earned 15% commission? 33
34 34
35 Changes to and Meaning of m and b EVALUATE Name: For #1-3, consider the following graph 1. What are the coordinates of the x-intercept? 2. If the x-intercept stays the same and the y-intercept is changed to (0, -6), What happens to the slope of the line? 3. If the y-intercept stays as shown and the x-intercept becomes (-8, 0), what happens to the slope of the line? Give the new Equation for each line. 4. y = 5x + 9 is translated 7 units down 5. y = 1 x is translated 5 up. 6. y = / 2 x is translated 2 units up 7. y = x is translated 8 units down For #8-12, a submarine was at -195 meters and then it rose at 12 meters per minute. 8. Write the equation of the line. Find the reasonable domain and range. EQ: Reasonable Domain: Reasonable Range: 9. How would the slope of the line change if the -195 were changed to a. The line would be steeper b. The line would be less steep c. The line would have the same slope 10. How would the slope of the line change if the 12 were changed to 10. a. The line would be steeper b. The line would be less steep c. The line would have the same slope 11. How would the y-intercept of the line change if the -195 were changed to a. It would translate up 15 b. It would translate down 15 c. It would stay the same 12. How would the y-intercept of the line change if the 12 were changed to 15. a. It would translate up 3 b. It would translate up 15 c. It would stay the same 35


36 Dan visits his grandmother in Alaska. On Sunday he hears on the radio that the temperature in his grandmother s city way -2 F from 8:00 AM until 4:00 PM. x-intercept with meaning: y-intercept with meaning: Slope with meaning: Equation: Independent: Dependent: Domain: Range: What would happen to the slope if the temperature was -7 F throughout the day? A beetle is 28 inches underground. The beetle digs straight upwards, in a vertical line, at a constant rate until it reaches the surface. x-intercept with meaning: y-intercept with meaning: Slope with meaning: Equation: Independent: Dependent: Domain: Range: What would happen to the x- intercept if the slope was changed to 3? The popcorn kernels weigh 30 ounces. Betsy pours the kernels into her popcorn maker at a constant rate. x-intercept with meaning: y-intercept with meaning: Slope with meaning: Equation: Independent: Dependent: Domain: Range: What would change about the graph if the slope was -3? Dawn buys plastic beads in bulk. The beads sell for $3 a pound, including sales tax. x-intercept with meaning: y-intercept with meaning: Slope with meaning: Equation: Independent: Dependent: Domain: Range: What would change about the graph if there was a shipping fee of $5? 36


37 Finding Intercepts with Meaning Name: Equation x-intercept with y-intercept with meaning meaning A bird is 32 meters from its next. It flies further away at a rate of 1 meter per second. Slope with meaning Reasonable Domain: Reasonable Range: Equation A beetle is 28 inches underground. The beetle digs straight upwards, in a vertical line, at a constant rate of 4 inches per minute until it reaches the surface. x-intercept with meaning y-intercept with meaning Slope with meaning Reasonable Domain: Reasonable Range: Equation Andrew sells electronics. He earns 14% commission on his daily sales. x-intercept with meaning y-intercept with meaning Slope with meaning Reasonable Domain: Reasonable Range: 37
38 Equation Irma has a 12-gallon bucket. She fills the bucket with 9 gallons of water. The bucket has a crack. The graph shows the remaining amount of water with respect to time. x-intercept with meaning y-intercept with meaning Slope with meaning Reasonable Domain: Reasonable Range: Equation Dan visits his grandmother in Alaska. On Sunday he hears on the radio that the temperature in his grandmother s city way -2 degrees F from 8:00 AM until 3:00 PM. x-intercept with meaning y-intercept with meaning Slope with meaning Reasonable Domain: Reasonable Range: You spent $500 setting up a jewelry business and charge $20 per necklace. Define Variables: x = y = Equation: x-intercept with meaning y-intercept with meaning Slope with meaning Reasonable Domain: Reasonable Range: A hot air balloon is at 200 feet and is descending at 5 feet per minute. Define Variables: x = y = Equation: x-intercept with meaning y-intercept with meaning Slope with meaning Reasonable Domain: Reasonable Range: 38
 B. (0, 2) C. (1, 2) D. (2, 5) 2.")
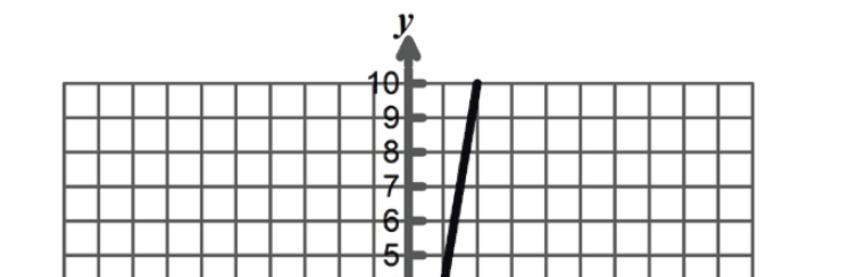
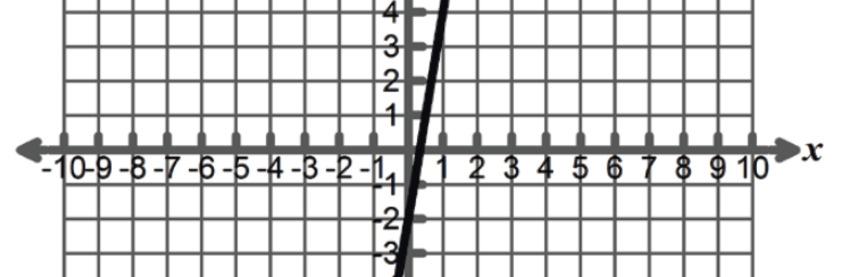
39 Name Date Changes to M and B Identify the correct answer choice. 1. The graph of y = x + 1 is shown. Which point will lie on the graph if the slope of the line is doubled and the y-intercept stays the same? A. (-2, -2) B. (0, 2) C. (1, 2) D. (2, 5) 2. Suppose the y-intercept of y = 2x 3 doubles but the slope remains the same. Which point will lie on the graph of the new line? A. (1, 1) B. (2, 2) C. (1, -2) D. (2, -2) 3. The graph of y = 4 1 x 2 is shown. Which point will lie on the graph if the slope of the line is 5 5 tripled and the y-intercept is increased by 1? A. (-2, 3 3 ) B. (0, 5 4. Which line has the steepest slope? 1 3 ) C. (1, 3) D. (2,-4) 5 A. y = 3x + 5 B. y = x 8 C. y = -x + 10 D. y = -6x 4 39


40 5. What happens to the graph of y = -3x + 2 when the y-intercept is decreased by 2? A. The new line is half as steep. B. The graph rises from left to right. C. The graph is 2 units higher for each value of x. D. The graph passes through the origin. 6. What happens to the graph of y = x 3 when the slope is divided by 2? A. The new line is half as steep. B. The new line is twice as steep. C. The graph is 2 units higher for each value of x. D. The graph is 2 units lower for each value of x. 7. The graph of a linear function is shown below. Another linear function, with a graph steeper than the one shown, is to be added to the same grid. Which equation could represent the new function? A. y = 3 5 x B. y = 5 3 x C. y = 1.25x D. y = 2.75x 40

41 8. How does multiplying the slope by -1 change the graph of y = -x + 1? A. The line then rises from left to right. B. The line then falls from left to right. C. The y-intercept becomes -1. D. The y-intercept is 1 unit less for every value of x. 9. The original function y = 3 2 x 7 is graphed on the same grid as the new function y = 4 3 x 7. Which of the following statements about these graphs is true? A. The graph of the original function is steeper than the graph of the new function. B. The graph of the original function is parallel than the graph of the new function. C. The graph of the new function is steeper than the graph of the original function. D. The graph of the new function is the same as the graph of the original function. 10. How does the graph of y = 0.75x 4 change when the y-intercept is increased by 0.25? A. The slope becomes 1. B. The line becomes less steep. C. The graph is 0.25 unit higher for every value of x. D. The graph is 0.25 unit lower for every value of x. 11. If the slope of the equation y = 3 x 2 is 4 changed to y = 4 3 x and the y-intercept remains the same, which statement best describes this situation? A. The new line is perpendicular to the original line. B. The new line is parallel to the original line. C. The new line and the original line have the same graph. D. The new line and the original line will intersect at (0, -2). 41


42 12. The function y = 6x 4 is graph below. If the slope of the function is multiplied by 0.5, and the y-intercept remains the same. Which of the following graphs best represents the new function? A. B. C. D. 42
Answers for the lesson Plot Points in a Coordinate Plane
 LESSON 3.1 Answers for the lesson Plot Points in a Coordinate Plane Skill Practice 1. 5; 23 2. No; the point could lie in either Quadrant II or Quadrant IV. 3. (3, 22) 4. (, 21) 5. (4, 4) 6. (24, 3) 7.
Chapter 7, Part 1B Equations & Functions
 Chapter 7, Part 1B Equations & Functions Fingerstache Fingerstaches cost $7 per box. Copy and complete the table to find the cost of 2, 3, and 4 boxes. Number of Boxes Multiply by 7 Cost 1 1 x 7 $7 2 3
y-intercept remains constant?
 1. The graph of a line that contains the points ( 1, 5) and (4, 5) is shown below. Which best represents this line if the slope is doubled and the y-intercept remains constant? F) G) H) J) 2. The graph
Section 1.3. Slope formula: If the coordinates of two points on the line are known then we can use the slope formula to find the slope of the line.
 MATH 11009: Linear Functions Section 1.3 Linear Function: A linear function is a function that can be written in the form f(x) = ax + b or y = ax + b where a and b are constants. The graph of a linear
MATH 021 TEST 2 REVIEW SHEET
 TO THE STUDENT: MATH 021 TEST 2 REVIEW SHEET This Review Sheet gives an outline of the topics covered on Test 2 as well as practice problems. Answers for all problems begin on page 8. In several instances,
Chapter 9 Linear equations/graphing. 1) Be able to graph points on coordinate plane 2) Determine the quadrant for a point on coordinate plane
 Be able to graph points on coordinate plane 2) Determine the quadrant for a point on coordinate plane") Chapter 9 Linear equations/graphing 1) Be able to graph points on coordinate plane 2) Determine the quadrant for a point on coordinate plane Rectangular Coordinate System Quadrant II (-,+) y-axis Quadrant
Chapter 9 Linear equations/graphing 1) Be able to graph points on coordinate plane 2) Determine the quadrant for a point on coordinate plane Rectangular Coordinate System Quadrant II (-,+) y-axis Quadrant
UNIT 4 Math 621. Forms of Lines and Modeling Using Linear Equations
 UNIT 4 Math 621 Forms of Lines and Modeling Using Linear Equations Description: This unit focuses on different forms of linear equations. Slope- intercept, point-slope and standard forms are introduced.
Adding & Subtracting Decimals. Multiplying Decimals. Dividing Decimals
 1. Write the problem vertically, lining up the decimal points. 2. Add additional zeroes at the end, if necessary, to make the numbers have the same number of decimal places. 3. Add/subtract as if the numbers
LINEAR EQUATIONS IN TWO VARIABLES
 LINEAR EQUATIONS IN TWO VARIABLES What You Should Learn Use slope to graph linear equations in two " variables. Find the slope of a line given two points on the line. Write linear equations in two variables.
Graphing Lines with a Table
 Graphing Lines with a Table Select (or use pre-selected) values for x Substitute those x values in the equation and solve for y Graph the x and y values as ordered pairs Connect points with a line Graph
Section 3.5. Equations of Lines
 Section 3.5 Equations of Lines Learning objectives Use slope-intercept form to write an equation of a line Use slope-intercept form to graph a linear equation Use the point-slope form to find an equation
In this section, we find equations for straight lines lying in a coordinate plane.
 2.4 Lines Lines In this section, we find equations for straight lines lying in a coordinate plane. The equations will depend on how the line is inclined. So, we begin by discussing the concept of slope.
MTH 103 Group Activity Problems (W2B) Name: Equations of Lines Section 2.1 part 1 (Due April 13) platform. height 5 ft
 Name: Equations of Lines Section 2.1 part 1 (Due April 13) platform. height 5 ft") MTH 103 Group Activity Problems (W2B) Name: Equations of Lines Section 2.1 part 1 (Due April 13) Learning Objectives Write the point-slope and slope-intercept forms of linear equations Write equations
MTH 103 Group Activity Problems (W2B) Name: Equations of Lines Section 2.1 part 1 (Due April 13) Learning Objectives Write the point-slope and slope-intercept forms of linear equations Write equations
Actual testimonials from people that have used the survival guide:
 Algebra 1A Unit: Coordinate Plane Assignment Sheet Name: Period: # 1.) Page 206 #1 6 2.) Page 206 #10 26 all 3.) Worksheet (SIF/Standard) 4.) Worksheet (SIF/Standard) 5.) Worksheet (SIF/Standard) 6.) Worksheet
Algebra I Notes Unit Seven: Writing Linear Equations
 Sllabus Objective.6 The student will be able to write the equation of a linear function given two points, a point and the slope, table of values, or a graphical representation. Slope-Intercept Form of
Graphs, Linear Equations and Functions
 Graphs, Linear Equations and Functions There are several ways to graph a linear equation: Make a table of values Use slope and y-intercept Use x and y intercepts Oct 5 9:37 PM Oct 5 9:38 PM Example: Make
Unit 3 Algebra What is the y-intercept for the graph of the equation 3x 5y = 15?
 Unit 3 lgebra 1 Name: ate: 1. The equation below is used to find (x, y) coordinates. y = 3x + 2 3. ennie is using this pattern to make stars for an laska state flag. Which coordinates could be found using
Review for Mastery. Identifying Linear Functions
 Identifying Linear Functions You can determine if a function is linear by its graph, ordered pairs, or equation. Identify whether the graph represents a linear function. Step 1: Determine whether the graph
Lesson 1: Understanding Proportional. Relationships
 Unit 3, Lesson 1: Understanding Proportional Relationships 1. Priya jogs at a constant speed. The relationship between her distance and time is shown on the graph. Diego bikes at a constant speed twice
MA Lesson 16 Sections 2.3 and 2.4
 MA 1500 Lesson 16 Sections.3 and.4 I Piecewise Functions & Evaluating such Functions A cab driver charges $4 a ride for a ride less than 5 miles. He charges $4 plus $0.50 a mile for a ride greater than
Determine the intercepts of the line and ellipse below: Definition: An intercept is a point of a graph on an axis. Line: x intercept(s)
") Topic 1 1 Intercepts and Lines Definition: An intercept is a point of a graph on an axis. For an equation Involving ordered pairs (x, y): x intercepts (a, 0) y intercepts (0, b) where a and b are real
Topic 1 1 Intercepts and Lines Definition: An intercept is a point of a graph on an axis. For an equation Involving ordered pairs (x, y): x intercepts (a, 0) y intercepts (0, b) where a and b are real
E. Slope-Intercept Form and Direct Variation (pp )
") and Direct Variation (pp. 32 35) For any two points, there is one and only one line that contains both points. This fact can help you graph a linear equation. Many times, it will be convenient to use the
and Direct Variation (pp. 32 35) For any two points, there is one and only one line that contains both points. This fact can help you graph a linear equation. Many times, it will be convenient to use the
Chapter 4. Lesson Lesson The parabola should pass through the points (0, 0) and (2, 0) and have vertex (1, 1).
 and (2, 0) and have vertex (1, 1).") Chapter 4 Lesson 4.1.1 4-3. The parabola should pass through the points (0, 0) and (2, 0) and have vertex (1, 1). 4-4. She should have received two sports cars and ten pieces of furniture. 4-5. 1 3 ( 2x)=
Chapter 4 Lesson 4.1.1 4-3. The parabola should pass through the points (0, 0) and (2, 0) and have vertex (1, 1). 4-4. She should have received two sports cars and ten pieces of furniture. 4-5. 1 3 ( 2x)=
Graphs of linear equations will be perfectly straight lines. Why would we say that A and B are not both zero?
 College algebra Linear Functions : Definition, Horizontal and Vertical Lines, Slope, Rate of Change, Slopeintercept Form, Point-slope Form, Parallel and Perpendicular Lines, Linear Regression (sections.3
Grade 8, Unit 3 Practice Problems - Open Up Resources
 Grade 8, - Open Up Resources Lesson 1 Priya jogs at a constant speed. The relationship between her distance and time is shown on the graph. Diego bikes at a constant speed twice as fast as Priya. Sketch
Released Items. Grade 6 Mathematics North Carolina End-of-Grade Assessment. Published January 2019
 Released Items Published January 2019 Grade 6 Mathematics North Carolina End-of-Grade Assessment Public Schools of North Carolina Department of Public Instruction State Board of Education Division of Accountability
Exploring rate of change in motion problems Block 4 Student Activity Sheet
 1. Sketch the graph of each elevator ride described. [EX3, page2] a. The elevator starts on floor 4 and rises at a rate of 1 floor per second. b. The elevator starts on floor -3 rises at a rate of 2 floors
4-2 Using Intercepts. Warm Up Lesson Presentation Lesson Quiz
 4-2 Using Intercepts Warm Up Lesson Presentation Lesson Quiz Holt Algebra McDougal 1 Algebra 1 Warm Up Solve each equation. 1. 5x + 0 = 10 2 2. 33 = 0 + 3y 11 3. 1 4. 2x + 14 = 3x + 4 2 5. 5y 1 = 7y +
Using Slopes and Intercepts
 CODE Name Date Teacher Practice A Using Slopes and Intercepts 1. Name the ordered pair if the x-intercept is 2. 2. Name the ordered pair if the y-intercept is 8. 3. In the ordered pair (9, 0), what is
Sect Linear Equations in Two Variables
 99 Concept # Sect. - Linear Equations in Two Variables Solutions to Linear Equations in Two Variables In this chapter, we will examine linear equations involving two variables. Such equations have an infinite
Part 5: Math. Chapter 28: Numbers, Arithmetic, and Number Sense ( ) +? Questions. Bonus Chapter
 +? Questions. Bonus Chapter") Bonus Chapter Chapter 28: Numbers, Arithmetic, and Number Sense Questions 1. The speed of light is about 186,000 miles per second. A light year is the distance light travels in a year. What is the approximate
Bonus Chapter Chapter 28: Numbers, Arithmetic, and Number Sense Questions 1. The speed of light is about 186,000 miles per second. A light year is the distance light travels in a year. What is the approximate
G.2 Slope of a Line and Its Interpretation
 G.2 Slope of a Line and Its Interpretation Slope Slope (steepness) is a very important concept that appears in many branches of mathematics as well as statistics, physics, business, and other areas. In
Chapter 2: Functions and Graphs Lesson Index & Summary
 Section 1: Relations and Graphs Cartesian coordinates Screen 2 Coordinate plane Screen 2 Domain of relation Screen 3 Graph of a relation Screen 3 Linear equation Screen 6 Ordered pairs Screen 1 Origin
Unit 5: Moving Straight Ahead
 Unit 5: Moving Straight Ahead Investigation 4 Exploring Slope: Connecting Rates and Ratios I can demonstrate understanding that linear relationships are relationships represented by the slope of the line
2. A rectangle has a length of meter. The area is square meter. What is the width of the rectangle?
 6G2Test1 #18 Katherine s aquarium, in the shape of a right rectangular prism, has dimensions of 10 ½ in. long, 22 ½ in. wide, and 12 in. tall. She filled her aquarium with water, leaving 2 inches empty
2. To receive credit on any problem, you must show work that explains how you obtained your answer or you must explain how you obtained your answer.
 Math 50, Spring 2006 Test 2 PRINT your name on the back of the test. Circle your class: MW @ 11 TTh @ 2:30 Directions 1. Time limit: 50 minutes. 2. To receive credit on any problem, you must show work
PROPORTIONAL VERSUS NONPROPORTIONAL RELATIONSHIPS NOTES
 PROPORTIONAL VERSUS NONPROPORTIONAL RELATIONSHIPS NOTES Proportional means that if x is changed, then y is changed in the same proportion. This relationship can be expressed by a proportional/linear function
Rosa Parks Middle School. Summer Math Packet C2.0 Algebra Student Name: Teacher Name: Date:
 Rosa Parks Middle School Summer Math Packet C2.0 Algebra Student Name: Teacher Name: Date: Dear Student and Parent, The purpose of this packet is to provide a review of objectives that were taught the
Unit 10: The Equation of a Linear Function
 Section 10.1: The Equation of a Linear Function Section 10.2: Writing Linear Equations in Slope-Intercept Form Section 10.3: Parallel and Perpendicular Lines Section 10.4: Applications Slope-Intercept
Solving Equations and Graphing
 Solving Equations and Graphing Question 1: How do you solve a linear equation? Answer 1: 1. Remove any parentheses or other grouping symbols (if necessary). 2. If the equation contains a fraction, multiply
Name Date. and y = 5.
 Name Date Chapter Fair Game Review Evaluate the epression when = and =.... 0 +. 8( ) Evaluate the epression when a = 9 and b =.. ab. a ( b + ) 7. b b 7 8. 7b + ( ab ) 9. You go to the movies with five
The Picture Tells the Linear Story
 The Picture Tells the Linear Story Students investigate the relationship between constants and coefficients in a linear equation and the resulting slopes and y-intercepts on the graphs. This activity also
Up and Down or Down and Up
 Lesson.1 Assignment Name Date Up and Down or Down and Up Exploring Quadratic Functions 1. The citizens of Herrington County are wild about their dogs. They have an existing dog park for dogs to play, but
Name: Date: Period: Activity 4.6.2: Point-Slope Form of an Equation. 0, 4 and moving to another point on the line using the slope.
 Name: Date: Period: Activity.6.2: Point-Slope Form of an Equation 1.) Graph the equation y x = + starting at ( ) 0, and moving to another point on the line using the slope. 2.) Now, draw another graph
Review Journal 6 Assigned Work: Page 146, All questions
 MFM2P Linear Relations Checklist 1 Goals for this unit: I can explain the properties of slope and calculate its value as a rate of change. I can determine y-intercepts and slopes of given relations. I
Since each element is paired with unique element in the range, it is a function.
 1. State the domain and range of the relation {( 3, 2), (4, 1), (0, 3), (5, 2), (2, 7)}. Then determine whether the relation is a function. The domain is the set of x-coordinates. The range is the set
(a) Find the equation of the line that is parallel to this line and passes through the point.
 Find the equation of the line that is parallel to this line and passes through the point.") 1. Consider the line. (a) Find the equation of the line that is parallel to this line and passes through the point. (b) Find the equation of the line that is perpendicular to this line and passes through
1. Consider the line. (a) Find the equation of the line that is parallel to this line and passes through the point. (b) Find the equation of the line that is perpendicular to this line and passes through
Linear Functions Review
 Name: Period: Date: 1. Which of the following graphs does not represent as a function of? 2. Kelly will enclose her rectangular tomato garden with 32 feet of fencing material. She wants the length of the
Unit 8: Coordinate Plane (including x/y tables), Proportional Reasoning, and Slope
, Proportional Reasoning, and Slope") Page 1 CCM6+7+ --Unit 9 Graphing and Slope Unit 8: Coordinate Plane (including x/y tables), Proportional Reasoning, and Slope 2015-16 Name Teacher Projected Test Date Main Topic(s) Page(s) Vocabulary 2-3
Page 1 CCM6+7+ --Unit 9 Graphing and Slope Unit 8: Coordinate Plane (including x/y tables), Proportional Reasoning, and Slope 2015-16 Name Teacher Projected Test Date Main Topic(s) Page(s) Vocabulary 2-3
Roberto Clemente Middle School
 Roberto Clemente Middle School Summer Math Packet for Students Entering Algebra I Name: 1. On the grid provided, draw a right triangle with whole number side lengths and a hypotenuse of 10 units. The
Ch. 6 Linear Functions Notes
 First Name: Last Name: Block: Ch. 6 Linear Functions Notes 6.1 SLOPE OF A LINE Ch. 6.1 HW: p. 9 #4 1, 17,,, 8 6. SLOPES OF PARALLEL AND PERPENDICULAR LINES 6 Ch. 6. HW: p. 49 # 6 odd letters, 7 0 8 6.
GRADE LEVEL: SEVENTH SUBJECT: MATH DATE: CONTENT STANDARD INDICATORS SKILLS ASSESSMENT VOCABULARY ISTEP
 GRADE LEVEL: SEVENTH SUBJECT: MATH DATE: 2015 2016 GRADING PERIOD: QUARTER 2 MASTER COPY 10 8 15 CONTENT STANDARD INDICATORS SKILLS ASSESSMENT VOCABULARY ISTEP COMPUTATION Unit Rates Ratios Length Area
Name. 5. Fill in the blanks to complete the table. D 2,000
 . A school s Parent-Teacher Club raises $280 by washing and waxing cars. Each car wash and wax costs $4. How many cars did the club wash and wax? A 2 B 20 C 200 D 2,000 2. An online game awards players
Name: Period: Date: 1. Which of the following graphs does not represent. 2. It is given that. What is A. B. C. D.
 Name: Period: Date: 1. Which of the following graphs does not represent as a function of? 2. It is given that,, and. What is? Page 1 of 21 3. Which of the following are the domain and range for the graph
Essential Question How can you describe the graph of the equation y = mx + b?
 .5 Graphing Linear Equations in Slope-Intercept Form COMMON CORE Learning Standards HSA-CED.A. HSF-IF.B. HSF-IF.C.7a HSF-LE.B.5 Essential Question How can ou describe the graph of the equation = m + b?
Study Guide: Slope and Linear Equations
 Rates and Unit Rates A rate is a proportional relationship between two quantities. Unit rate is a rate where the second quantity is 1. Example: Pauline can mow 35 square feet of lawn is 2.5 minutes. (this
Lesson 6.1 Linear Equation Review
 Name: Lesson 6.1 Linear Equation Review Vocabulary Equation: a math sentence that contains Linear: makes a straight line (no Variables: quantities represented by (often x and y) Function: equations can
Core Connections, Course 2 Checkpoint Materials
 Core Connections, Course Checkpoint Materials Notes to Students (and their Teachers) Students master different skills at different speeds. No two students learn exactly the same way at the same time. At
8.EE. Development from y = mx to y = mx + b DRAFT EduTron Corporation. Draft for NYSED NTI Use Only
 8.EE EduTron Corporation Draft for NYSED NTI Use Only TEACHER S GUIDE 8.EE.6 DERIVING EQUATIONS FOR LINES WITH NON-ZERO Y-INTERCEPTS Development from y = mx to y = mx + b DRAFT 2012.11.29 Teacher s Guide:
Discovery Activity: Slope
 Page 1 of 14 1. Lesson Title: Discovering Slope-Intercept Form 2. Lesson Summary: This lesson is a review of slope and guides the students through discovering slope-intercept form using paper/pencil and
constant EXAMPLE #4:
 Linear Equations in One Variable (1.1) Adding in an equation (Objective #1) An equation is a statement involving an equal sign or an expression that is equal to another expression. Add a constant value
Chapter 3 Graphing Linear Equations
 Chapter 3 Graphing Linear Equations Rectangular Coordinate System Cartesian Coordinate System Origin Quadrants y-axis x-axis Scale Coordinates Ex: Plot each point: (0,0), (-1, 3), (1, 3), (1, -3), (-1,
Algebra 1B. Chapter 6: Linear Equations & Their Graphs Sections 6-1 through 6-7 & 7-5. COLYER Fall Name: Period:
 Chapter 6: Linear Equations & Their Graphs Sections 6-1 through 6-7 & 7-5 COLYER Fall 2016 Name: Period: What s the Big Idea? Analyzing Linear Equations & Inequalities What can I expect to understand when
Block: Date: Name: REVIEW Linear Equations. 7.What is the equation of the line that passes through the point (5, -3) and has a slope of -3?
 and has a slope of -3?") Name: REVIEW Linear Equations 1. What is the slope of the line y = -2x + 3? 2. Write the equation in slope-intercept form. Block: Date: 7.What is the equation of the line that passes through the point
Name: REVIEW Linear Equations 1. What is the slope of the line y = -2x + 3? 2. Write the equation in slope-intercept form. Block: Date: 7.What is the equation of the line that passes through the point
3-4 Slope-Intercept Form. State the slope and the y-intercept for the graph of each equation. 1. y = 3x + 4 ANSWER: 3; 4. 2.
 State the slope and the y-intercept for the graph of each equation. 1. y = 3x + 4 3; 4 Write an equation in slope-intercept form for the graph shown. 6. 2. y = x ; 3. 3x + y = 4 3; 4 Write an equation
Slope. Domain 2 Lesson 11. Getting the Idea
 Domain Lesson Slope Common Core Standard: 8.EE. Getting the Idea The graph of a linear equation is a straight line. The steepness of the line is called its slope. The slope shows the rate at which two
10 GRAPHING LINEAR EQUATIONS
 0 GRAPHING LINEAR EQUATIONS We now expand our discussion of the single-variable equation to the linear equation in two variables, x and y. Some examples of linear equations are x+ y = 0, y = 3 x, x= 4,
A slope of a line is the ratio between the change in a vertical distance (rise) to the change in a horizontal
 to the change in a horizontal") The Slope of a Line (2.2) Find the slope of a line given two points on the line (Objective #1) A slope of a line is the ratio between the change in a vertical distance (rise) to the change in a horizontal
The Slope of a Line (2.2) Find the slope of a line given two points on the line (Objective #1) A slope of a line is the ratio between the change in a vertical distance (rise) to the change in a horizontal
Section 2.3 Task List
 Summer 2017 Math 108 Section 2.3 67 Section 2.3 Task List Work through each of the following tasks, carefully filling in the following pages in your notebook. Section 2.3 Function Notation and Applications
 Page 1 of 17 Name: Which graph does not represent a function of x? What is the slope of the graph of the equation y = 2x -? 2 2x If the point ( 4, k) is on the graph of the equation 3x + y = 8, find the
4.4 Slope and Graphs of Linear Equations. Copyright Cengage Learning. All rights reserved.
 4.4 Slope and Graphs of Linear Equations Copyright Cengage Learning. All rights reserved. 1 What You Will Learn Determine the slope of a line through two points Write linear equations in slope-intercept
Math 154 :: Elementary Algebra
 Math :: Elementary Algebra Section. Section. Section. Section. Section. Math :: Elementary Algebra Section. The Rectangular (Cartesian) Coordinate System. The variable x usually represents the independent
6.1 Slope of a Line Name: Date: Goal: Determine the slope of a line segment and a line.
 6.1 Slope of a Line Name: Date: Goal: Determine the slope of a line segment and a line. Toolkit: - Rate of change - Simplifying fractions Main Ideas: Definitions Rise: the vertical distance between two
Essential Question: How can you represent a linear function in a way that reveals its slope and y-intercept?
 COMMON CORE 5 Locker LESSON Slope-Intercept Form Common Core Math Standards The student is epected to: COMMON CORE F-IF.C.7a Graph linear... functions and show intercepts... Also A-CED.A., A-REI.D. Mathematical
Test Booklet. Subject: MA, Grade: 07 TAKS Grade 7 Math Student name:
 Test Booklet Subject: MA, Grade: 07 Student name: Author: Texas District: Texas Released Tests Printed: Friday March 02, 2012 1 The top, front, and side views of a 3-dimensional figure built with identical
Representing Ratios and Rates
 ? UNIT Study Guide Review MODULE 6 ESSENTIAL QUESTION Representing Ratios and Rates How can you use ratios and rates to solve real-world problems? Key Vocabulary equivalent ratios (razones equivalentes)
Slope. Plug In. Finding the Slope of a Line. m 5 1_ 2. The y-intercept is where a line
 LESSON Slope Plug In Finding the Slope of a Line The slope of a line is the ratio of the change in the -values to the change in the corresponding -values. 0 7 8 change in -values Slope change in -values
Accuplacer Math Packet
 College Level Math Accuplacer Math Packet 1. 23 0 2. 5 8 5-6 a. 0 b. 23 c. 1 d. None of the above. a. 5-48 b. 5 48 c. 5 14 d. 5 2 3. (6x -3 y 5 )(-7x 2 y -9 ) a. 42x -6 y -45 b. -42x -6 y -45 c. -42x -1
Vocabulary: colon, equivalent ratios, fraction, part-to-part, part-to-whole, ratio
 EE8-39 Ratios and Fractions Pages 144 147 Standards: preparation for 8.EE.B.5 Goals: Students will review part-to-part and part-to-whole ratios, different notations for a ratio, and equivalent ratios.
Section 1.3. Slope of a Line
 Slope of a Line Introduction Comparing the Steepness of Two Objects Two ladders leaning against a building. Which is steeper? We compare the vertical distance from the base of the building to the ladder
Appendix M TERMINOLOGY. Slope of a Line. Slope. Undefined Slope. Slope-Intercept Form
 Appendices : Slope of a Line TERMINOLOGY For each of the following terms, provide ) a definition in our own words, 2) the formal definition (as provided b our text or instructor), and ) an example of the
Test Booklet. Subject: MA, Grade: 07 7th Grade Math May Student name:
 Test Booklet Subject: MA, Grade: 07 7th Grade Math May 2005 Student name: Author: Ohio District: Ohio Released Tests Printed: Monday July 09, 2012 1 There are 2 9 bacteria in a sample. How many bacteria
Algebra & Trig. 1. , then the slope of the line is given by
 Algebra & Trig. 1 1.4 and 1.5 Linear Functions and Slope Slope is a measure of the steepness of a line and is denoted by the letter m. If a nonvertical line passes through two distinct points x, y 1 1
Lesson 15: The Slope of a Non Vertical Line
 Classwork Opening Exercise Example Graph A Graph B a. Which graph is steeper? b. Write directions that explain how to move from one point on the graph to the other for each of Graph A and Graph B. c. Write
NAME DATE PERIOD. Study Guide and Intervention
 1-1 A Plan for Problem Solving Four-Step Problem-Solving Plan When solving problems, it is helpful to have an organized plan to solve the problem. The following four steps can be used to solve any math
Scatter Plots, Correlation, and Lines of Best Fit
 Lesson 7.3 Objectives Interpret a scatter plot. Identify the correlation of data from a scatter plot. Find the line of best fit for a set of data. Scatter Plots, Correlation, and Lines of Best Fit A video
Graphing Linear Nonproportional Relationships Using Slope and y-intercept
 L E S S O N. Florida Standards The student is epected to: Functions.F.. Construct a function to model a linear relationship between two quantities. Determine the rate of change and initial value of the
Chapter 3 Parallel and Perpendicular Lines
 Chapter 3 Parallel and Perpendicular Lines Parallel Lines Lines Parallel Symbol: Perpendicular Lines Lines that Perpendicular Symbol: Postulate 13: Parallel Postulate For any and a not on the line, there
Coordinate Algebra 1 Common Core Diagnostic Test 1. about 1 hour and 30 minutes for Justin to arrive at work. His car travels about 30 miles per
 1. When Justin goes to work, he drives at an average speed of 55 miles per hour. It takes about 1 hour and 30 minutes for Justin to arrive at work. His car travels about 30 miles per gallon of gas. If
4.2 modeling WITh linear FUnCTIOnS
 SECTION 4.2 modeling with linear functions 3 0 9 learning ObjeCTIveS In this section, you will: Build linear models from verbal descriptions. Model a set of data with a linear function. 4.2 modeling WITh
Core Learning Standards for Mathematics Grade 6
 Core Learning Standards for Mathematics Grade 6 Write and evaluate numerical expressions involving whole-number exponents. Write, read, and evaluate expressions; identify parts of an expression using mathematical
Module 1. Ratios and Proportional Relationships Lessons Lesson #15 You need: pencil, calculator and binder. Do Now:
 Module 1 Ratios and Proportional Relationships Lessons 15 19 Lesson #15 You need: pencil, calculator and binder. Do Now: 1. The table gives pairs of values for the variables x and y. x 1 2 3 y 3 6 9 Determine
Number Systems and Fractions
 Number Systems and Fractions Section 1: Fractions A. Adding and Subtracting Fractions The rule: When adding or subtracting fractions find a common denominator in order to add or subtract the fractions.
Unit 2. Linear Functions
 Unit 2 Linear Functions Foundations of Math 1 Fall 2016 Contents Daily Calendar... 3 Standard Descriptions... 3 Standard 21 Slope between Points... 4 Notes: Slope between two points using the formula or
THE DOMAIN AND RANGE OF A FUNCTION Basically, all functions do is convert inputs into outputs.
 THE DOMAIN AND RANGE OF A FUNCTION Basically, all functions do is convert inputs into outputs. Exercise #1: Consider the function y = f (x) shown on the graph below. (a) Evaluate each of the following:
Math 1023 College Algebra Worksheet 1 Name: Prof. Paul Bailey September 22, 2004
 Math 1023 College Algebra Worksheet 1 Name: Prof. Paul Bailey September 22, 2004 Every vertical line can be expressed by a unique equation of the form x = c, where c is a constant. Such lines have undefined
Characteristics of Linear Relations
 HW Mark: 10 9 8 7 6 RE-Submit Characteristics of Linear Relations This booklet belongs to: Period LESSON # DATE QUESTIONS FROM NOTES Questions that I find difficult Pg. Pg. Pg. Pg. Pg. Pg. Pg. Pg. Pg.
Study Guide: Slope and Linear Equations
 Rates and Unit Rates A rate is a proportional relationship between two quantities. Unit rate is a rate where the second quantity is 1. Example: Pauline can mow 35 square feet of lawn is 2.5 minutes. (this
Level Curves, Partial Derivatives
 Unit #18 : Level Curves, Partial Derivatives Goals: To learn how to use and interpret contour diagrams as a way of visualizing functions of two variables. To study linear functions of two variables. To
Mathematics Success Grade 8
 T936 Mathematics Success Grade 8 [OBJECTIVE] The student will find the line of best fit for a scatter plot, interpret the equation and y-intercept of the linear representation, and make predictions based