Introduction to Aerial Photographs and Topographic maps (Chapter 7, 9 th edition) or (chapter 3, 8 th edition)
|
|
|
- Valentine George
- 5 years ago
- Views:
Transcription
1 GEOLOGY 306 Laboratory Instructor: TERRY J. BOROUGHS NAME: Introduction to Aerial Photographs and Topographic maps (Chapter 7, 9 th edition) or (chapter 3, 8 th edition) For this assignment you will require: a calculator and metric ruler. Objectives: you should be able to use a stereoscope to view a stereogram, a pair of aerial photographs; explain what a topographic map is and how it can be used to study landforms; use map scales to determine distances; determine the latitude and longitude of a place from a topographic map; use the Public Land Survey System (township and range) to locate features; explain how contour lines are drawn and be able to use contours to determine elevation, relief, and slope of the land; construct a simple contour map and topographic profile. THE FOLLOWING QUESTIONS REFER TO CHAPTER 7 IN YOUR MANUAL (Read the questions from your manual and place your answers in the following spaces provided.) 1. Complete questions 1 through 2 on the diagrams in you manual, page 113, 9 th edition. This will give you the needed practice to move on to the following questions. 3. What is the white, curved feature that extends from the base of the cone to its summit? 4. Complete this question on the diagram in your manual, page 113, 9 th edition. Use the topographic map provided by your instructor for the following questions: 5. What is the name of your map? 6. Notice the small reference map and compass arrow in the lower margin of the map. In what part of the state (center, northwestern, southwestern, etc.) is the area depicted in this map located? 7. The names of adjoining maps are given along the four margins and four corners of your map, or via a grid diagram at the bottom of your map, depending upon the year it was printed. What is the name of the map that adjoins the Western edge of your map? What is the name of the map that adjoins the Northeastern edge of your map? 8. Information about when the area was surveyed and the map published is provided in the margin of the map. When was the area surveyed? When was the map published? If the map has been revised, when was the revision completed? Surveyed: Published: Revised: 9. Since the geographic North Pole and North Magnetic Pole of Earth do not coincide, the north arrow on a topographic map often shows the difference between true north or geographic (TN) and magnetic north (MN), the direction a compass would point, for the area represented this difference in degrees is called the magnetic declination. What is the magnetic declination for this map? Don t forget to include the direction of declination. Magnetic declination: 10. Depending upon the map scale, 1 inch on a topographic map represents various distances on Earth. Convert the following scales and round to the nearest mile. (Hint: 5280 feet = 1 mile.) 1:62,500 1inch on map = mile(s) on Earth 1:250,000 1inch on map = mile(s) on Earth 1
2 11. Examine your topographic map as well as the large wall maps in the laboratory and write out the fractional scale for each in the following space. Then answer the following questions. Topographic map: USA Map: World Map: Which of the three maps has the largest scale (smallest denominator in the fractional scale)? Which of the three maps covers more square miles? 12. Examine figure 7.6 (9 th edition) or figure 3.6 (8 th edition) and complete the map description by choosing the appropriate terms (smaller or larger) (more or less). Maps with small fractional scales (e.g. 1:250,000) cover a area and provide detail. Maps with large fractional scales (e.g. 1:24,000) cover a area and provide detail. 13. In general what color(s) are used for the following types of features? Highways and roads: Buildings: Urban or populated areas are depicted using (color and/or features): Wooded areas: Water features: 14. Use the PLS system described in figures 7.7 and 7.8 (9 th edition) or figures 3.7 and 3.8 (8 th edition) to label the townships, ranges, and sections in the following figure (3.7) (7 th edition). Use the copy of Figure 3.7 (7 th edition) provided on Page 3 of this packet to complete the following. Not all sections will be subdivided more than once, so you may not use all of the spaces provided below. W: 1/4, 1/4, Sec., T, R X: 1/4, 1/4, Sec., T, R Y: 1/4, 1/4, Sec., T, R Z: 1/4, 1/4, Sec., T, R 15. Use the copy of figure 7.8 provided on Page 3 of this packet to locate each of the areas described below on diagrams A, B, and C in figure 3.7 by placing the appropriate letter (D or E) on each of the three diagrams. D: SW ¼, SW ¼, Sec. 2, T3N, R3E E: SE ¼, NE ¼, Sec. 34, T4S, R5W 2
3 W W W 16. Your instructor will supply you with the name of a feature (school, church, etc.) located on the map provided by your instructor. Using the PLS (Public Land Survey system) write the name of the feature, as well as its complete PLS location. Feature name: Location: 17. Practice with the stereoscopes on figure 7.2 (9th edition) and compare the stereoscope image with the actual contour map. 18. Figure 7.16 (9 th edition) or figure 3.16 (8 th edition) shows both a perspective view and contour map of a hypothetical area situated along an ocean coast. The elevations in feet above mean sea level of several contour lines and points are identified on the map for reference. Use this figure to answer the following questions. What is the Contour interval? feet 3
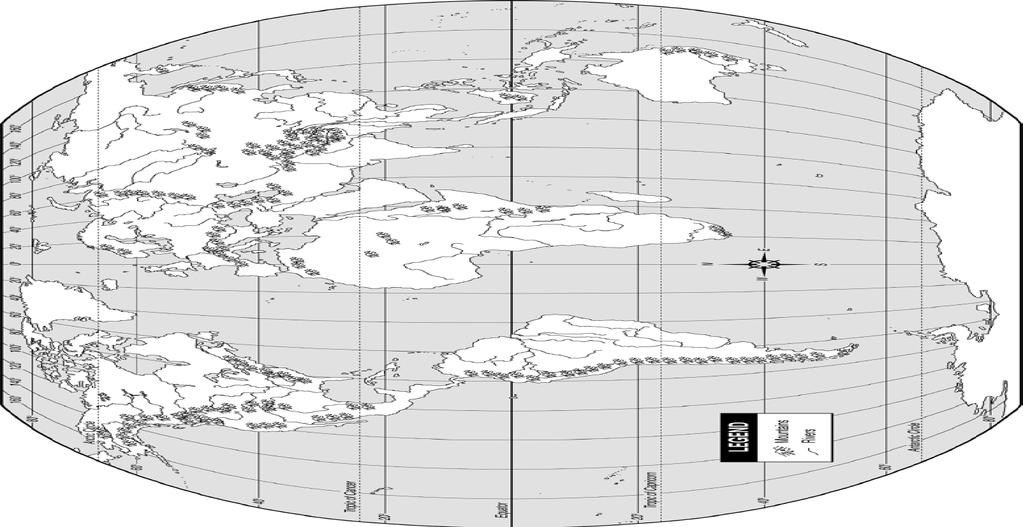
4 What characteristics of the contour lines indicate that the slopes are steep? Notice what happens to the contour lines as they cross a stream. The peak or V formed by a contour line as it crosses a stream points (upstream or downstream) Write your answer here, don t circle it. What are the elevations of the points designated with the following letters? A: feet B: feet C: feet The approximate elevation of the church is (12, 22, or 32) feet. Write your answer here, don t circle it. 19. Use the following map to complete this question. Use a wall map of the world or world map in an atlas to find the following water bodies, rivers, and mountains. Examine their latitudes and longitudes, and then label each on the world map provided. To conserve space mark only the number or letter of the feature at the appropriate location on the map. The letter or number should be located and written directly on top of the appropriate feature, not off to the side of it!!! Water Bodies A. Pacific Ocean B. Atlantic Ocean C. Indian Ocean D. Arctic Ocean E. Gulf of Mexico F. Mediterranean Sea G. Caribbean Sea Rivers North America a. Mississippi b. Colorado c. Missouri d. Ohio Mountains North America 1. Rocky Mountains 2. Cascade Range 3. Sierra Nevada 4. Appalachian Mountains Co-ordinates: degrees S, 60 degrees E degrees S, 40 degrees E degrees N, 10 degrees W degrees N, 50 degrees E 4
5 5
6 Use the topographic map supplied by your instructor to answer the following questions. 20. What is the datum that has been used for determining the elevations of the map? A Datum is the various sets of data used to determine elevations, etc. and are used to construct the topographic map. The titles of these datums refer to specific sets of data. More than one datum may be used to construct the map. Datum(s): 21. What is the Contour interval of the map? 22. What are the lowest and highest elevations found on the map? Lowest: Highest: 23. Your instructor will provide you with the names of three features (school, church, mine, etc.) located on the map. Write the elevation of each feature in the following spaces. Feature name: Feature name: Feature name: Elevation: Elevation: Elevation: 24. After examining the topographic map, describe the shape of the landscapes depicted by the map. For example, is it mountainous with sharp peaks, hilly, flat valleys, desert, forested, many lakes, etc.? 25. What are the latitudes of the top and bottom edge of the map supplied by your instructor? Don t forget to include whether the latitude is North or South of the Equator. Northern (top of map) edge: Southern (bottom of map) edge: How many total minutes of latitude does the map cover? What are the longitudes of the left and right edges of the map? Don t forget to include whether the longitude is East or West of the Prime Meridian. Western (left side of map) edge: Eastern (right side of map) edge: 26. How many total minutes of longitude does the map cover? 6
7 27. Your instructor will supply you with the names of two features (school, church, etc.) located on the map supplied in class. Write the name of each feature, as well as its latitude and longitude. Don t forget to include whether the latitude is North or South of the Equator and whether the longitude is East or West of the Prime Meridian. Feature name: Lat: Long: Feature name: Lat: Long: To help understand the process of drawing a contour map, using a pencil, complete the contour map shown below. The points illustrated are of known elevation. FOR THE FOLLOWING DIAGRAM, YOU MAY WANT TO LIGHTLY PENCIL IN YOUR ANSWERS INITIALLY AND THEN GO OVER IT AGAIN WITH A DARKER LINE. 28. Draw in the topographic contours for the following figure, using a contour interval of 10 feet. Label all contour lines from 50 to 110! Label the hill with an "H. Start with the 50- foot contour line. This problem is worth a large amount of points!!!!! A) What is the total relief of the river (shown by the dashed and dotted line) from where it begins in the upper left to where it enters the lake? A) Feet B) What is the total slope or gradient of the river (shown by the dashed and dotted line) from where it begins in the upper left to where it enters the lake? B) Feet/Mile 7
8 Contour Interval = 10 feet 26. Use the figure included below. After examining the contour lines and elevations in the figure, show the directions that the streams are flowing by drawing arrows on the map. 27. Use the figure below. In general, if North is up, the land slopes toward the (north or south). Write your answer here, don t circle it. 28. Use the profile graph in the figure below to construct a (west-east) profile along the line A-A on the contour map. Follow the guidelines for preparing a topographic profile described in your manual. Your profile will show the relative shape of the topography along the line A-A. In other words, it will show the shape of the landscape if you were to walk along the line A-A. 8
. The points illustrated are of known elevation.")
9 Scale: 0 1 mile The following is extra credit! 29. Use the copy of the figure 7.12 (9 th edition) or figure 3.12 (8 th edition) included on the following page. To help understand the process of drawing a contour map, using a pencil, complete the contour map shown in figure 7.12 (9 th edition). The points illustrated are of known elevation. The 100-foot contour line has been drawn to provide a reference. Using a 20-foot contour interval, draw a contour line for each 20- foot change in elevation below and above 100 feet (e.g. 80 feet, 60 feet, 120 feet, etc.) You will have to estimate the elevations between the points. Label each of the lines with the proper elevation. 30. Use the copy of figure 7.12 (9 th edition) or figure 3.12 (8 th edition) included on the following page. In Figure 7.12, in general, the land slopes toward the (north or south). Write your answer here, don t circle it. 9
10 31. Use the copy of figure 7.12 (9 th edition) or figure 3.12 (8 th edition) included on the following page. After examining the contour lines and elevations in figure 3.11, show the directions that the streams are flowing by drawing arrows on the map. 32. Use the copy of figure 7.12 (9 th edition) or figure 3.12 (8 th edition) included on the following page. What is the average slope of the stream on the west side of the map you drew in Figure 3.11? Slope = feet/mile Scale: 0 1 mile This page is extra credit! 10
Introduction to Aerial Photographs and Topographic maps (Chapter 3)
") GEOLOGY 306 Laboratory Instructor: TERRY J. BOROUGHS NAME: Introduction to Aerial Photographs and Topographic maps (Chapter 3) For this assignment you will require: a calculator and metric ruler. Objectives:
GEOLOGY 306 Laboratory Instructor: TERRY J. BOROUGHS NAME: Introduction to Aerial Photographs and Topographic maps (Chapter 3) For this assignment you will require: a calculator and metric ruler. Objectives:
PRE-LAB for: Introduction to Aerial Photographs and Topographic maps (Ch. 3)
") GEOLOGY 306 Laboratory Instructor: TERRY J. BOROUGHS NAME: PRE-LAB for: Introduction to Aerial Photographs and Topographic maps (Ch. 3) For this assignment you will require: a calculator and metric ruler.
GEOLOGY 306 Laboratory Instructor: TERRY J. BOROUGHS NAME: PRE-LAB for: Introduction to Aerial Photographs and Topographic maps (Ch. 3) For this assignment you will require: a calculator and metric ruler.
Lab #4 Topographic Maps and Aerial Photographs
 Lab #4 Topographic Maps and Aerial Photographs Purpose To familiarize you with using topographic maps. Visualizing the shape of landforms from topographic maps is an essential skill in geology. Proficiency
Lab #8: Topographic Map Lab
 NAME: LAB TIME: TA NAME: Lab #8: Topographic Map Lab Topography is the shape of the land. Topographic maps are used to aid in the visualization of the shape of the land. Topographic maps include the accurate
ENVI.2030L Topographic Maps and Profiles
 Name ENVI.2030L Topographic Maps and Profiles I. Introduction A map is a miniature representation of a portion of the earth's surface as it appears from above. The environmental scientist uses maps as
Module 2: Mapping Topic 3 Content: Topographic Maps Presentation Notes. Topographic Maps
 Topographic Maps 1 Take a few moments to study the map shown here of Isolation Peak, Colorado. What land features do you notice? Do you thinking hiking through this area would be easy? Did you see the
BACKGROUND INFORMATION
 Build an Island INTRODUCTION For this assignment, you will be creating a topographic map and three-dimensional model of a fictional island that you have designed. You will start by exploring some basic
NAME: PERIOD: DATE: LAB PARTNERS: LAB #6 DRAWING A CONTOUR MAP FROM A THREE DIMENSIONAL MODEL
 NAME: PERIOD: DATE: LAB PARTNERS: LAB #6 DRAWING A CONTOUR MAP FROM A THREE DIMENSIONAL MODEL INTRODUCTION Since land distances and elevations on the earth's surface can be very great it is necessary to
1. The topographic map below shows a depression contour line on Earth's surface.
 1. The topographic map below shows a depression contour line on Earth's surface. Points A, B, C, and D represent surface locations. Contour line elevations are in feet. Which profile best shows the topography
Topographic Maps. Contour Lines
 Topographic Maps Our first task today will consist of locating ourselves with the help of a topographic map. GPS units that can tell you the location of any Dunkin' Donuts within a five mile radius. Paper
Shoe Box Activity Constructing a Topographic Map
 Shoe Box Activity Constructing a Topographic Map Background Information All maps are models of some feature of the real world. The kind of map oen used by scientists is called a contour or topographic
CHAPTER 3 MARGINAL INFORMATION AND SYMBOLS
 CHAPTER 3 MARGINAL INFORMATION AND SYMBOLS A map could be compared to any piece of equipment, in that before it is placed into operation the user must read the instructions. It is important that you, as
31, The following isoline map shows the variations in the relative strength of Earth's magnetic field from 1 (strong) to 11 (weak).
 to 11 (weak).") 31, The following isoline map shows the variations in the relative strength of Earth's magnetic field from 1 (strong) to 11 (weak). 33. The following four temperature field maps represent the same region
31, The following isoline map shows the variations in the relative strength of Earth's magnetic field from 1 (strong) to 11 (weak). 33. The following four temperature field maps represent the same region
TOPOGRAPHIC MAPS A NEW WAY TO VIEW THE WORLD!
 TOPOGRAPHIC MAPS A NEW WAY TO VIEW THE WORLD! http://courtneyjennings.weebly.com/unit-4---weathering-erosiontopo-maps-past.html A topographic map, simply put, is a two-dimensional representation of a portion
Legal Description & Site Plan Requirements and Layouts
 Legal Description & Site Plan Requirements and Layouts Plot Plan * A plot plan shows the location of a house from an aerial view. * The site plan, also known as a plot or lot plan includes: 1. Site plan
Surveying & Measurement. Detail Survey Topographic Surveying
 Surveying & Measurement Detail Survey Topographic Surveying Introduction Mapping surveys are made to determine the relief of the earth s surface and locate critical points on it. to determine the locations
Earth Sciences 089G Short Practical Assignment #4 Working in Three Dimensions
 Earth Sciences 089G Short Practical Assignment #4 Working in Three Dimensions Introduction Maps are 2-D representations of 3-D features, the developers of topographic maps needed to devise a method for
AutoCAD 2016 for Civil Engineering Applications
 Introduction to AutoCAD 2016 for Civil Engineering Applications Learning to use AutoCAD for Civil Engineering Projects Nighat Yasmin Ph.D. SDC P U B L I C AT I O N S Better Textbooks. Lower Prices. www.sdcpublications.com
Chapter 6 Navigation and Field Mapping
 Chapter 6 Navigation and Field Mapping In this chapter you will learn about: Orienting maps Measuring a bearing on a map Plotting points on a map using latitude/longitude Plotting points on a map using
Gradient and Rate of Change
 Name: 1. Base your answer(s) to the following question(s) on the topographic map shown below. Letters A, B, C, and D represent locations on Earth s surface. The symbol marks the highest elevation on Patty
Land Navigation / Map Reading
 Land Navigation / Map Reading What is the Field Manual for map reading and land navigation? FM 3-25.26 What are the basic colors of a map, and what does each color represent? Black - Indicates cultural
Name: Topographic Profiles Multiple Choice
 1. Base your answer to the following question on the topographic map below. Points A and B represent locations on the map. Elevations are shown in meters. Which diagram best represents the topographic
Title: How steep are those hills? Engineering Grade: Estimated Time: 3 hours (2 days) Groups: 3 to 4 students
 Groups: 3 to 4 students") Title: How steep are those hills? Engineering Grade: 10-12 Estimated Time: 3 hours (2 days) Groups: 3 to 4 students Synopsis: Students will be able to understand the concept of surveying and mapping ground
Title: How steep are those hills? Engineering Grade: 10-12 Estimated Time: 3 hours (2 days) Groups: 3 to 4 students Synopsis: Students will be able to understand the concept of surveying and mapping ground
CHAPTER 3-LAB 1: A TOPOGRAPHIC MAP IN THREE DIMENSIONS
 Name Teacher Period Date CHAPTER 3-LAB 1: A TOPOGRAPHIC MAP IN THREE DIMENSIONS Introduction A topographic map shows the shape ofthe land surface with contour lines. On page 29 you will find Figure 3-6,
Maps and map interpretation An introduction for geoscientists
 Maps and map interpretation An introduction for geoscientists Produced by the University of Derby in conjunction with UKOGL Aims This teaching package provides an introduction to maps and how to identify
Watershed Topography
 Watershed Topography Adapted from: An original Creek Connections activity. Creek Connections, Allegheny College, Meadville, Pennsylvania, 16335 Topography in Watersheds Grade Level: Basic to intermediate.
GPS for Snowmobilers. By Wayne Fischer. November 14, 2006
 GPS for Snowmobilers By Wayne Fischer November 14, 2006 Wayne@TahoeSnowmobiling.org Copy of White Paper & Presentation Both this presentation and the white paper are available on the www.tahoesnowmobiling.org
UNITED STATES MARINE CORPS FIELD MEDICAL TRAINING BATTALION Camp Lejeune, NC
 UNITED STATES MARINE CORPS FIELD MEDICAL TRAINING BATTALION Camp Lejeune, NC 28542-0042 FMST 206 Land Navigation TERMINAL LEARNING OBJECTIVE 1. Given a military topographic map, protractor, and objective,
Markville Secondary School Geography Department
 Markville Secondary School Geography Department CGC1D1 Geography of Canada PERFORMANCE TASK - UNIT 1 AND 2 DUE DATE: SEPTEMBER 2011 Parent Signature: CONTOUR MAP AND MODEL The performance task for Geography
COPYRIGHTED MATERIAL. Contours and Form DEFINITION
 1 DEFINITION A clear understanding of what a contour represents is fundamental to the grading process. Technically defined, a contour is an imaginary line that connects all points of equal elevation above
Mapping The Study Area
 While on the beach you will need to take some measurements to show where the study area is relative to the rest of the world and to show what is inside the study area. Once the measurements have been taken,
Markville Secondary School Geography Department
 Markville Secondary School Geography Department CGC1D1 Geography of Canada PERFORMANCE TASK - UNITS 1 AND 2 February 2012 DUE DATE: Parent Signature: CONTOUR MAP AND MODEL The performance task for the
MAKE A CO NTO U R MAP
 Your web browser (Safari 7) is out of date. For more security, comfort and the best experience on this site: Update your browser Ignore Activitydevelop Student Version MAKE A CO NTO U R MAP How does a
ASTER GDEM Version 2 Validation Report
 ASTER GDEM Version 2 Validation Report Japan s Validation Report August 12th, 2011 Tetsushi Tachikawa (ERSDAC) Manabu Kaku (Mitsubishi Material Techno Corp.) Akira Iwasaki (University of Tokyo) ---------------------------------------------------------------------------------------
Lesson 8: Surveying the Forest
 Lesson 8: Surveying the Forest TEACHER: SCHOOL: GRADE LEVEL: 9-12 TASKS/COMPETENCIES ANR8046.172 Set up and operate a transit level and rod. ANR8046.173 Read a rod and a level to calculate slope. ANR8046.174
AIM. What is-a contour map? 23-
 .. '; AIM 23- What is-a contour map?.,,.,, I. There are many different kinds of maps. The maps we use most often are surface maps. A surface map is a drawing. It shows all or part of the earth's surface.
CONTOURS SURVEYING 1 CE 215 CHAPTER -3- Ishik University / Sulaimani Civil Engineering Department 12/7/2017. Ishik University / Sulaimani
 Civil Engineering Department SURVEYING 1 CE 215 CHAPTER -3- CONTOURS 1 2 1 3 4 2 PURPOSE OF CONTOURING Contour survey is carried out at the starting of any engineering project such as a road, a railway,
In this 3D model, facets appear as semi-transparent to reveal overhangs.
 Sunsite TM Report ebruary 21, 2017 123 Main St., City, ST 00000 In this 3D model, facets appear as semi-transparent to reveal overhangs. Report Details Roof Details Total Area =10,734 sq ft Total Roof
Oakland County Michigan Register of Deeds Plat Engineering, GIS, & Remonumentation Dept. Ph: (248) Fax (248)
 Fax (248)") Oakland County Michigan Register of Deeds Plat Engineering, GIS, & Remonumentation Dept. Ph: (248)-858-1447 Fax (248)-858-7466 Requirements Needed for Final Condominium Approval General Requirements. 1
Oakland County Michigan Register of Deeds Plat Engineering, GIS, & Remonumentation Dept. Ph: (248)-858-1447 Fax (248)-858-7466 Requirements Needed for Final Condominium Approval General Requirements. 1
East Bay Municipal Utility District. Study Guide for Survey Technician I
 East Bay Municipal Utility District Study Guide for Survey Technician I Summer 2018 TABLE OF CONTENTS PAGE Introduction... 1 Scoring... 1 Visual Perception... 2 Sample Questions 1-2... 2 Reading and Interpreting
In this 3D model, facets appear as semi-transparent to reveal overhangs.
 SunSite TM Report 3 Main St., City, ST 00000 In this 3D model, facets appear as semi-transparent to reveal overhangs. Report Details Roof Details Total Area =2,609 sq ft Total Roof Facets =13 Predominant
NREM 345 Week 2, Material covered this week contributes to the accomplishment of the following course goal:
 NREM 345 Week 2, 2010 Reading assignment: Chapter. 4 and Sec. 5.1 to 5.2.4 Material covered this week contributes to the accomplishment of the following course goal: Goal 1: Develop the understanding and
Appendix C: Graphing. How do I plot data and uncertainties? Another technique that makes data analysis easier is to record all your data in a table.
 Appendix C: Graphing One of the most powerful tools used for data presentation and analysis is the graph. Used properly, graphs are an important guide to understanding the results of an experiment. They
1 : 5,000 1cm to 100m
 4.1.1 Scales and Converting Scales In Hong Kong maps, there are 2 types of scales: 1. 1:5000 (Black and white with no color) 2. 1:20000 (With color) If there is no unit in a representative fraction scale,
Geodesy, Geographic Datums & Coordinate Systems
 Geodesy, Geographic Datums & Coordinate Systems What is the shape of the earth? Why is it relevant for GIS? 1/23/2018 2-1 From Conceptual to Pragmatic Dividing a sphere into a stack of pancakes (latitude)
Ch. 1.3: Topographic Maps
 Ch. 1.3: Topographic Maps StudentS will be able to Explain what are topographic maps Read a topographic map Create a topographic map "Geologists don't dislike classical music, they just prefer rock." Topographic
MATHEMATICS OF GRAPHING AND SURVEYING CHAPTER 9 INTRODUCTION TO GRAPHING AND SURVEYING
 CHAPTER 9 MATHEMATICS OF GRAPHING AND SURVEYING INTRODUCTION TO GRAPHING AND SURVEYING Real estate typically refers to a physical asset that is tied to one geographic location. Because it is durable (lasts
MAPPING YOUR STREAM. TIME REQUIRED 50 minutes in Field 50 minutes in Classroom 50 minutes Homework
 OUR MAPPING YOUR STREAM STREAM ACTIVITY SUMMARY Students will draft a cross-sectional profile of the stream and measure the velocity of the current. They will use both of these to calculate the discharge
Important Questions. Surveying Unit-II. Surveying & Leveling. Syllabus
 Surveying Unit-II Important Questions Define Surveying and Leveling Differentiate between Surveying and Leveling. Explain fundamental Principles of Surveying. Explain Plain and Diagonal Scale. What is
Floods On The Minnesota River Planning For St. Peter
 Floods On The Minnesota River Planning For St. Peter Group Members Section: A B C D E In this lab, we will make a flood hazard map for the city of St. Peter. We will use the 100-year flood as the design
CHECKLIST PRELIMINARY SUBDIVISION AND PRELIMINARY SITE PLAN
 N/A Waiver (1) Four (4) copies of application form. (2) Fifteen (15) copies of plan (3) Subdivision/site plan application fee & professional review escrow deposit (4) Variance application fee & professional
Lesson 10. Unit 2. Reading Maps. Graphing Points on the Coordinate Plane
 Lesson Graphing Points on the Coordinate Plane Reading Maps In the middle ages a system was developed to find the location of specific places on the Earth s surface. The system is a grid that covers the
Appendix B. Airport Master Plan Update William R. Fairchild International Airport Port Angeles, Washington AIRPORT LAYOUT PLAN CHECKLIST
 APPENDICES Appendix B AIRPORT LAYOUT PLAN CHECKLIST 3 Airport Master Plan Update William R. Fairchild International Airport Port Angeles, Washington September 2011 AC 150/5070-6B (incl. Chg. 1, 5/1/07)
CONTRACT PLANS READING
 CONTRACT PLANS READING A training course developed by the FLORIDA DEPARTMENT OF TRANSPORTATION This 2009 revision was carried out under the direction of Ralph Ellis, P. E., Associate Professor of Civil
The Basics. HECRAS Basis Input. Geometry Data - the basics. Geometry Data. Flow Data. Perform Hydraulic Computations. Viewing the Output
 The Basics HECRAS Basis Input Geometry Data. Flow Data. Perform Hydraulic Computations by G. Parodi WRS ITC The Netherlands Viewing the Output ITC Faculty of Geo-Information Science and Earth Observation
Engineering Surveying -1 CE212 Contouring Lectures. Lecture 2016, November 29 th Muhammad Noman
 Engineering Surveying -1 CE212 Contouring Lectures Lecture 2016, November 29 th Muhammad Noman Contour An Imaginary line on the ground surface joining the points of equal elevation is known as contour.
Introduction to Computer Science with MakeCode for Minecraft
 Introduction to Computer Science with MakeCode for Minecraft Lesson 3: Coordinates This lesson will cover how to move around in a Minecraft world with respect to the three-coordinate grid represented by
GUIDELINES FOR MEASURING BUILDING HEIGHT
 GUIDELINES FOR MEASURING BUILDING HEIGHT THE CITY S POLICIES ON BUILDING HEIGHT In 1994, the City adopted a new General Plan that sets direction for development within Brisbane. Among its policies affecting
3.0 AFFECTED ENVIRONMENT
 3.0 AFFECTED ENVIRONMENT 3.1 Visual Resources This section provides a discussion of the existing visual resources in the vicinity of the Imperial Valley Solar Energy Center South project site that could
Question bank. Unit 1: Introduction
 Question bank Unit 1: Introduction 1. Define surveying. 2. State the objects of surveying 3. State and explain the principle of surveying 4. State and explain the classification of surveying 5. Differentiate
List of Figures. List of Forms
 City of Columbia Engineering Regulations PART 1: SUBMISSION OF PLANS Table of Contents Paragraph Description Page No. 1.1 General 1-1 1.2 Engineer s Report 1-1 1.3 Plans 1-3 1.4 Revisions to Approved Plan
Topography and Contouring Teaching Assistant Guide
 Topography and Contouring Teaching Assistant Guide Learning Objectives: At the end of the exercise the students will be able to read a contour map contour data draw a topographic profiles Getting Started
Essentials of Navigation
 Essentials of Navigation Latitudes & Longitudes, GPS, and more For Race Officers and Mark Boat Operators by Ed Bottrell eztrap Developer Glen Haven, Nova Scotia CANADA v13 email: info@bottrell.ca Website:
Relief Displacement of Vertical Features
 G 210 Lab. Relief Displacement of Vertical Features An increase in the elevation of a feature causes its position on the photograph to be displaced radially outward from the principle point. Hence, when
14.1 Functions of Several Variables
 14 Partial Derivatives 14.1 Functions of Several Variables Copyright Cengage Learning. All rights reserved. 1 Copyright Cengage Learning. All rights reserved. Functions of Several Variables In this section
COURSE SYLLABUS SURVEYING I
 Solution Manual for Surveying Fundamentals and Practices 6th Edition by Nathanson Lanzafama Emeritus Link full download: http://testbankcollection.com/download/solution-manual-forsurveying-fundamentals-and-practices-6th-edition-by-nathanson-lanzafamaemeritus/
Free Pre-Algebra Lesson 37! page 1
 Free Pre-Algebra Lesson 37! page 1 Lesson 37 Scale and Proportion Ratios and rates are a powerful way to compare data. Comparing and calculating with ratios and rates is one of the most common and useful
B.2 MAJOR SUBDIVISION PRELIMINARY PLAN CHECKLIST
 B.2 MAJOR SUBDIVISION PRELIMINARY PLAN CHECKLIST YES* GENERAL SUBMISSION ITEMS Does the submission include: 1. Thirteen (13) copies of completed Application Form? 2. Thirteen (13) copies of the Preliminary
A. ARTICLE 4 SKETCH PLAN REQUIREMENTS, MAJOR SUBDIVISION AND/OR LAND DEVELOPMENT
 400. 402.A. ARTICLE 4 SKETCH PLAN REQUIREMENTS, MAJOR SUBDIVISION AND/OR LAND DEVELOPMENT SECTION 400 PURPOSE The purpose of the Sketch Plan is to provide an opportunity for the applicant to consult early
STUDENT HANDOUT How to Convert within the Metric System
 STUDENT HANDOUT How to Convert within the Metric System Metric Conversion Pneumonic King Henry Died Monday Drinking Chocolate Milk kilo hecta deca meter (unit) deci centi milli To make the conversion:
A contour line is a line that passes through points having the same elevation.* Definition
 Contour Lines A contour line is a line that passes through points having the same elevation.* Definition Eleven (11) characteristics of contour lines 1. Contour lines are continuous. 2. Contour lines are
Lesson 12. Stereoscopy and Photo Preparation. Steven J. Steinberg
 Lesson 12 Stereoscopy and Photo Preparation Steven J. Steinberg Description: The lessons in this section focus on stereoscopy and photo preparation. We begin with a discussion of the principles of stereoscopy.
Section E NSPS MODEL STANDARDS FOR TOPOGRAPHIC SURVEYS Approved 3/12/02
 Section E NSPS MODEL STANDARDS FOR TOPOGRAPHIC SURVEYS Approved 3/12/02 1. INTRODUCTION This standard is written to provide the professional surveyor (Surveyor) and the client with a guideline for producing
UNIT #4 LINEAR FUNCTIONS AND ARITHMETIC SEQUENCES REVIEW QUESTIONS
 Name: Date: UNIT # LINEAR FUNCTIONS AND ARITHMETIC SEQUENCES REVIEW QUESTIONS Part I Questions. Carl walks 30 feet in seven seconds. At this rate, how man minutes will it take for Carl to walk a mile if
Sewer Line Extension Permit Design Checklist
 CHECKLIST C1 Revised 4/7/2017 Sewer Line Extension Permit Design Checklist DISCLAIMER - This checklist is provided to Consulting Engineers for the express purpose of assisting them in compiling sewer line
Department of Civil and Environmental Engineering
 Department of Civil and Environmental Engineering CEE213L Surveying & Introduction to GIS Lab SURVEYING LABORATORY NORTH SOUTH UNIVERSITY Center of Excellence in Higher Education The First Private University
Hydraulics and Floodplain Modeling Managing HEC-RAS Cross Sections
 v. 9.1 WMS 9.1 Tutorial Hydraulics and Floodplain Modeling Managing HEC-RAS Cross Sections Modify cross sections in an HEC-RAS model to use surveyed cross section data Objectives Build a basic HEC-RAS
Lecture # 7 Coordinate systems and georeferencing
 Lecture # 7 Coordinate systems and georeferencing Coordinate Systems Coordinate reference on a plane Coordinate reference on a sphere Coordinate reference on a plane Coordinates are a convenient way of
Fall 2001 Whooping Crane Migrational Survey Protocol Implementation Report
 Fall 2001 Whooping Crane Migrational Survey Protocol Implementation Report Prepared by Executive Director s Office For Committee s of the Platte River Cooperative Agreement June 5, 2002 I. Introduction
Dr. Heather Petcovic TECHNOLOGY FOR TEACHING: HANDHELD GPS AND EARTHCACHING
 TECHNOLOGY FOR TEACHING: HANDHELD GPS AND EARTHCACHING Dr. Heather Petcovic Department of Geosciences and the Mallinson Institute for Science Education TECHNOLOGY FOR TEACHING: HANDHELD GPS AND EARTHCACHING
Date Requested, 200_ Work Order No. Funding source Name of project Project limits: Purpose of the project
 Bureau of Engineering SURVEY DIVISION REQUEST FOR TOPOGRAPHIC SURVEY Date Requested, 200_ Work Order No. Funding source Name of project Project limits: Purpose of the project Caltrans involvement (must
Lab Exercise #3 Introduction to the Digital Globe Google Earth Geo210 Rockland Community College Professor Paluzzi Due Date:
 Lab Exercise #3 Introduction to the Digital Globe Google Earth Geo210 Rockland Community College Professor Paluzzi Due Date: The Digital Globe: Google Earth 30 Points Purpose: This lab will introduce the
Alabama Standards of Practice for Surveying
 PDHonline Course L144 (6 PDH) Alabama Standards of Practice for Surveying Instructor: Jerry Thacker, PLS, P.E. and John C. Huang, Ph.D., P.E. 2012 PDH Online PDH Center 5272 Meadow Estates Drive Fairfax,
SPECIAL PUBLIC NOTICE
 SPECIAL PUBLIC NOTICE Draft Map and Drawing Standards for the South Pacific Division Regulatory Program August 6, 2012 Corps contacts: Sacramento District: Michael Finan (916) 557-5324 (Michael.C.Finan@usace.army.mil)
2. CHARTS. 2.1 Chart projections Mercator projections. Maps which are used for marine or aeronautical navigation are called charts.
 Maps which are used for marine or aeronautical navigation are called charts. In Canadian waters, mariners are required to carry the latest editions of the paper charts, at the largest scale available (see
Dear Student, June 26, 2014
 Dear Student, June 26, 2014 Welcome to AP Environmental Science at School of the Future! During the upcoming school year we will be covering a large range of topics to determine what makes our Earth habitable
Map Basics: Datums and Coordinate Systems
 Map Basics: Datums and Coordinate Systems ESRM 304 Autumn 2015 Contributors: Phil Hurvitz, Peter Schiess, Eric Turnblom 1 of 39 Datums, land division systems, & coordinate systems Datums (from Wikipedia)
Red-breasted Merganser Minnesota Conservation Summary
 Credit Jim Williams Red-breasted Merganser Minnesota Conservation Summary Audubon Minnesota Spring 2014 The Blueprint for Minnesota Bird Conservation is a project of Audubon Minnesota written by Lee A.
Let s examine this situation further by preparing a scatter plot with our graphing calculator:
 Name Directions: 1. Start with one 8 ½ by 11 sheet of paper. 2. Hold the paper vertically and fold the paper in half. 3. Unfold the paper. Count the number of smallest rectangles seen. 4. Record your finding
 Page 1 of 17 Name: Which graph does not represent a function of x? What is the slope of the graph of the equation y = 2x -? 2 2x If the point ( 4, k) is on the graph of the equation 3x + y = 8, find the
47 CFR Ch. I ( Edition)
") 73.684 should decrease more rapidly with distance beyond the horizon than for Channels 2 6, and modification of the curves for Channels 14 69 may be expected as a result of measurements to be made at a
73.684 should decrease more rapidly with distance beyond the horizon than for Channels 2 6, and modification of the curves for Channels 14 69 may be expected as a result of measurements to be made at a
Hydraulics and Floodplain Modeling Managing HEC-RAS Cross Sections
 WMS 10.1 Tutorial Hydraulics and Floodplain Modeling Managing HEC-RAS Cross Sections Modify cross sections in an HEC-RAS model to use surveyed cross section data v. 10.1 Objectives Build a basic HEC-RAS
CRITICAL FREQUENCY By Marcel H. De Canck, ON5AU
 CRITICAL FREQUENCY By Marcel H. De Canck, ON5AU Before reading onward, it would be good to refresh your knowledge about refraction rules in the section on Refraction of the earlier "Wave Propagation Direction
Riches of the Earth Guidance Sheet 5
 Riches of the Earth Guidance Sheet 5 www.watershedlandscape.co.uk Recording individual features Several forms of recording are used to give as much information as possible about the feature being recorded.
PRELIMINARY PLAT CHECK LIST
 Name of Proposed Subdivision: The following items must be included with the initial submittal of a Preliminary Plat: Application, filled out completely Project Narrative Pre-application Conference Report
Example Application C H A P T E R 4. Contents
 C H A P T E R 4 Example Application This chapter provides an example application of how to perform steady flow water surface profile calculations with HEC-RAS. The user is taken through a step-by-step
Loy Gulch, Paint Pony, East Fork Paint Pony LOMR
 Loy Gulch, Paint Pony, East Fork Paint Pony LOMR Woodland Park, CO Prepared by: Michael Baker International 165 S. Union Blvd, Suite 200 Lakewood, CO 80226 TABLE OF CONTENTS I. INTRODUCTION... 2 1.1 Purpose...
Photo Scale The photo scale and representative fraction may be calculated as follows: PS = f / H Variables: PS - Photo Scale, f - camera focal
 Scale Scale is the ratio of a distance on an aerial photograph to that same distance on the ground in the real world. It can be expressed in unit equivalents like 1 inch = 1,000 feet (or 12,000 inches)
Page 1 part 1 PART 2
 Page 1 part 1 PART 2 Page 2 Part 1 Part 2 Page 3 part 1 Part 2 Page 4 Page 5 Part 1 10. Which point on the curve y x 2 1 is closest to the point 4,1 11. The point P lies in the first quadrant on the graph
Slope analysis & Grading. Earth shape and earthwork Topographic map Slope form Slope analysis Grading
 6 Slope analysis & Grading Earth shape and earthwork Topographic map Slope form Slope analysis Grading 81 Topographic Map Topographic Contour map Topographic contour map are composed of a series of line