GET10B Radar Measurement Basics- Spectrum Analysis of Pulsed Signals. Copyright 2001 Agilent Technologies, Inc.
|
|
|
- Leon Doyle
- 5 years ago
- Views:
Transcription
1 GET10B Radar Measurement Basics- Spectrum Analysis of Pulsed Signals Copyright 2001 Agilent Technologies, Inc.
2 Agenda: Power Measurements Module #1: Introduction Module #2: Power Measurements Module #3: Time Domain Measurements Module #4: Noise Measurements Module #5: Evaluating I/Q Demodulator Errors Module #6: Pulsed Component Measurements Page 2
3 Demo: Power Meter Measurement See Demo Page 3
4 Hi.. I m John Wineman, and I ll be presenting the demonstrations for today s seminar. Page 4

5 we are going to measure CW and then pulsed power from the new PSG signal generator. Page 5

6 I ll set the center frequency of the generator to 20GHz and the output power to +10dBm. Page 6

7 We ll use a high quality microwave cable with a 10dB pad at the output to insure a good VSWR. Page 7
8 The first thing we must do to make a good measurement is to calibrate the power head. Page 8

9 The first step in calibration is to zero the power meter. This corrects for DC offsets in the meter. Page 9

10 Once the zero is complete, we need to run the power cal. Note the precision 50MHz source. Page 10
11 After the cal is complete, we must enter the frequency of the signal to be measured 20GHz. Page 11

12 Now that the meter has been zeroed and calibrated, we will connect the sensor to the PSG. Page 12

13 The CW power of the PSG is set to +10dBm, and through the 10dB pad, we measure -0.89dBm. Page 13
14 Now turn on a the pulse modulator with a 1usec PW and 10usec PRI and measure dBm. Page 14
15 .and so with a 1 sec pulse width and a 10 sec pulse repetition interval, we have a 10% duty cycle. The average power of this signal is dBm. Note that the pulsed power dropped from our CW power (which is also our peak power in this instance) = 10log(PW/PRI) = 10*log(1 sec/10 sec) = -10dB This agrees nicely with our measured results. Page 15
16 Q and A Agilent Restricted Page 16
17 Why Measure Power Spectrum? Unintentional radiation Wastes expensive peak power Increases vulnerability (creates a signature for the particular transmitter) Interferes with other electronic signals Inbandspurs A F } } Desired Radiation Out of Band Radiation Unintentional Radiation Page 17
18 Spectrum Analyzer Block Diagram RF Input Mixer IF IF Peak Detector LO Smoothing Sweep (Animation) Animation Page 18
19 Page 19
20 Page 20
21 Page 21
22 Page 22
23 Q and A Agilent Restricted Page 23

24 VSA Block Diagram Page 24
25 Measuring Pulsed Power with a Spectrum Analyzer Pulsing RF Desensitizes Measurement Pulse Desensitization = 20 log (PW/PRI){ = 60dB Peak Pulse Power PRF Measured Power -30dBm Example Measured: P meas = -30 dbm PRI = 1 ms PW = 1 s (Animation) Line Spectrum 1 PW Calculated: = -60 db P peak = 30 dbm Animation Page 25
26 Page 26
27 Page 27
28 Page 28
29 Page 29
30 Page 30
31 Page 31
32 Page 32
33 Page 33
34 Page 34
35 Q and A Agilent Restricted Page 35
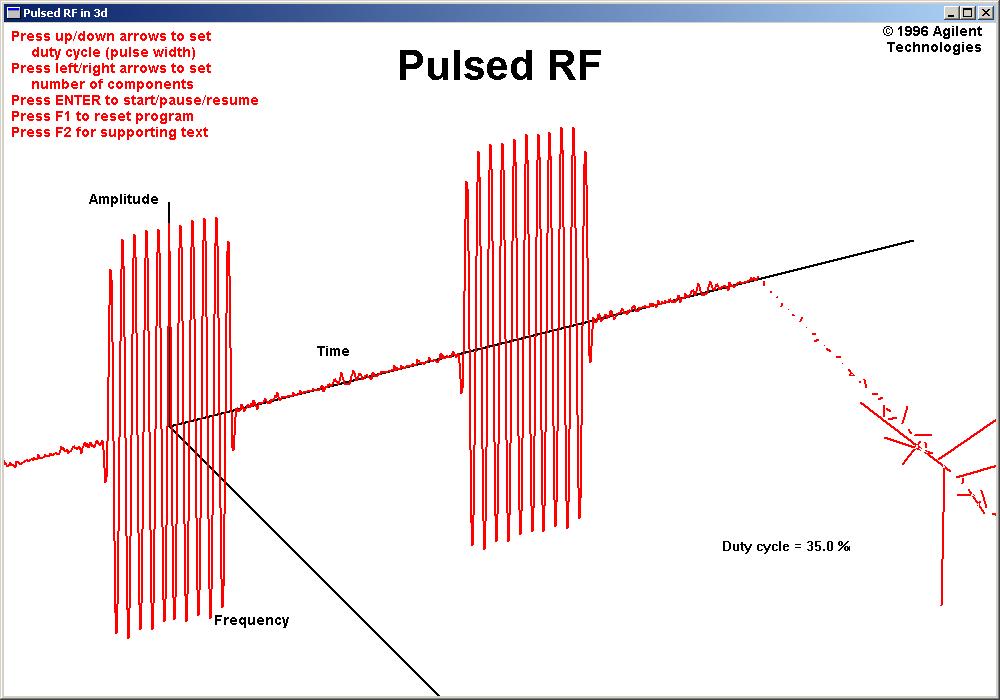
36 Power Power Pulse Parameters PRF=1/T T Peak Power Pulse Width t Time PRF=1/T Average Power Pavg = Ppk * t /T The frequency domain representation of a pulse. 2/t Frequency Page 36
37 How the Spectrum Changes With PRF Same PRF t PRF Same t PRF Same t Same PRF t Page 37
38 Measuring with a Spectrum Analyzer Advantages Wide frequency range Wide dynamic range Zero span (time domain) Relative power measurement Band Power Considerations Identification of narrowband vs. broadband signals Absolute amplitude accuracy Dealing with noise like measurements Page 38
39 Spectrum Measurements COHO BPF AMP RF BPF PREDRIVER PULSED POWER DUPLEXER AMP TRANSMITTER Antenna Transmitter/Exciter STALO PRF GENERATOR PULSE MODULATOR RECEIVER PROTECTION LNA ADC S/H LPF VIDEO AMP FREQUENCY AGILE L.O. Doppler and Range FFT Processor COHO LIMITER LPF 90 o o 0 SPLITTER 2nd IFA IF BPF 1st IFA IF BPF ADC S/H LPF VIDEO AMP 2nd L.O. Receiver/Signal Processor Page 39
40 Demo: Band Power Measurement Using a Spectrum Analyzer See Demo Page 40

41 We will now use the spectrum analyzer to take a closer look at our pulsed signal. Page 41
42 First, we will do a preset. This defaults to a reference level of 0dBm. Our peak signal level. Don t let the smoke out!! Page 42

43 Connect the PSG to the spectrum analyzer, set the CF to 20GHz and Span to 5MHz. Observe the -.79dBm CW signal near the ref level Page 43
.")
44 Now turn on the pulse modulation. The power of the central line drops as 20*log(duty cycle). The marker now reads dBm. Page 44
45 Now integrate the power in the central three lobes using band power markers. The band power (average power) is dBm. Page 45
46 Q and A Agilent Restricted Page 46
47 Frequency Selective Time Domain Measurement Swept tuned spectrum analyzer in zero span Using a fast internal digitizer Look at the spectrum analyzer s detected video Vector signal analyzer Faster than a swept tuned analyzer Can make complex measurements (phase, group delay, etc) Page 47
48 Pulsed Power Measurements COHO BPF AMP RF BPF PREDRIVER PULSED POWER DUPLEXER AMP TRANSMITTER Antenna Transmitter/Exciter STALO PRF GENERATOR PULSE MODULATOR RECEIVER PROTECTION LNA ADC S/H LPF VIDEO AMP FREQUENCY AGILE L.O. Doppler and Range FFT Processor COHO LIMITER LPF 90 o o 0 SPLITTER 2nd IFA IF BPF 1st IFA IF BPF ADC S/H LPF VIDEO AMP 2nd L.O. Receiver/Signal Processor PM SA Page 48
49 Demo: Zero Span Pulse Measurements Using a Spectrum Analyzer See Demo Page 49

50 Now we will use the spectrum analyzer as a fixed tuned receiver and see the pulse power vs time. Page 50
51 Set the Span to 0Hz, RBW to 8MHz, and the Sweep time to 10 sec, and trigger externally. Page 51
52 Now we can use the marker to measure the peak power of our signal in an 8MHz bandwidth. The marker reads a peak pulse power of dBm. Page 52

53 Q and A Agilent Restricted Page 53
54 Thanks for Attending!
Understanding RF and Microwave Analysis Basics
 Understanding RF and Microwave Analysis Basics Kimberly Cassacia Product Line Brand Manager Keysight Technologies Agenda µw Analysis Basics Page 2 RF Signal Analyzer Overview & Basic Settings Overview
Agilent PNA Microwave Network Analyzers
 Agilent PNA Microwave Network Analyzers Application Note 1408-12 Pulsed-RF S-Parameter Measurements Using Wideband and Narrowband Detection Table of Contents Introduction..................................................................3
Utilizzo del Time Domain per misure EMI
 Utilizzo del Time Domain per misure EMI Roberto Sacchi Measurement Expert Manager - Europe 7 Giugno 2017 Compliance EMI receiver requirements (CISPR 16-1-1 ) range 9 khz - 18 GHz: A normal +/- 2 db absolute
PXA Configuration. Frequency range
 Keysight Technologies Making Wideband Measurements Using the Keysight PXA Signal Analyzer as a Down Converter with Infiniium Oscilloscopes and 89600 VSA Software Application Note Introduction Many applications
Fast, Simple, Accurate Applies to Mixers Too
 Fast, Simple, Accurate Applies to Mixers Too Joel Dunsmore, Ph.D. Agilent Fellow Component Test Division R&D 1 2013 Agilent Technologies All-in-one Measurement Systems SCMM Performs S-parameter, IMD, Gain
RF Fundamentals Part 2 Spectral Analysis
 Spectral Analysis Dec 8, 2016 Kevin Nguyen Keysight Technologies Agenda Overview Theory of Operation Traditional Spectrum Analyzers Modern Signal Analyzers Specifications Features Wrap-up Page 2 Overview
Understanding Probability of Intercept for Intermittent Signals
 2013 Understanding Probability of Intercept for Intermittent Signals Richard Overdorf & Rob Bordow Agilent Technologies Agenda Use Cases and Signals Time domain vs. Frequency Domain Probability of Intercept
Measurement of Digital Transmission Systems Operating under Section March 23, 2005
 Measurement of Digital Transmission Systems Operating under Section 15.247 March 23, 2005 Section 15.403(f) Digital Modulation Digital modulation is required for Digital Transmission Systems (DTS). Digital
Keysight Technologies PNA-X Series Microwave Network Analyzers
 Keysight Technologies PNA-X Series Microwave Network Analyzers Active-Device Characterization in Pulsed Operation Using the PNA-X Application Note Introduction Vector network analyzers (VNA) are the common
The Value of Pre-Selection in EMC Testing. Scott Niemiec Application Engineer
 The Value of Pre-Selection in EMC Testing Scott Niemiec Application Engineer Video Demonstrating Benefit of Pre-selection 400MHz -1GHz Sweep with RBW = 120kHz Yellow: w/ preselection Green: w/o pre-selection
Integration of Measurement Equipment in a Matlab Environment for the Example of Radar Chirps
 Integration of Measurement Equipment in a Matlab Environment for the Example of Radar Chirps Špiro Moškov RF and Wireless Application Engineer Agilent Technologies Page 1 Agenda Signal creation and instrument
Wide bandwidth measurements and Calibration
 Wide bandwidth measurements and Calibration Agenda Wide bandwidth measurement definitions The need for wide bandwidth measurements Types of wide bandwidth measurements Accurate measurements and system
Understanding Low Phase Noise Signals. Presented by: Riadh Said Agilent Technologies, Inc.
 Understanding Low Phase Noise Signals Presented by: Riadh Said Agilent Technologies, Inc. Introduction Instabilities in the frequency or phase of a signal are caused by a number of different effects. Each
DFS (Dynamic Frequency Selection) Introduction and Test Solution
 Introduction and Test Solution") DFS (Dynamic Frequency Selection) Introduction Sept. 2015 Present by Brian Chi Brian-tn_chi@keysight.com Keysight Technologies Agenda Introduction to DFS DFS Radar Profiles Definition DFS test procedure
DFS (Dynamic Frequency Selection) Introduction Sept. 2015 Present by Brian Chi Brian-tn_chi@keysight.com Keysight Technologies Agenda Introduction to DFS DFS Radar Profiles Definition DFS test procedure
Power Measurement Basics
 Back to Basics - 2006 Objectives On completion of this module, you will be able to: Explain the importance of power measurements Define the three basic types of power measurements Describe the power meter/sensor
Keysight Technologies Gustaaf Sutorius
 1 1 mmw Seminar 2017 Keysight Technologies 18-04-2018 Gustaaf Sutorius Introduction & Agenda Why mmwave Industry needs & mmwave challenges Generating mmwave Analyzing mmwave Characterizing mmwave components
Pulsed VNA Measurements:
 Pulsed VNA Measurements: The Need to Null! January 21, 2004 presented by: Loren Betts Copyright 2004 Agilent Technologies, Inc. Agenda Pulsed RF Devices Pulsed Signal Domains VNA Spectral Nulling Measurement
Keysight Technologies
 Keysight Technologies Generating Signals Basic CW signal Block diagram Applications Analog Modulation Types of analog modulation Block diagram Applications Digital Modulation Overview of IQ modulation
RF and Microwave Test and Design Roadshow 5 Locations across Australia and New Zealand
 RF and Microwave Test and Design Roadshow 5 Locations across Australia and New Zealand ni.com Design and test of RADAR systems Agenda Radar Overview Tools Overview VSS LabVIEW PXI Design and Simulation
Interference Analysis and Spectrum Monitor Seminar
 Interference Analysis and Spectrum Monitor Seminar Handheld RF & Microwave Instruments Andrew Benn Business Development Manager Agilent Technologies Wednesday 12 th October 2011 1 Agilent Technologies,
R&S FSWP Phase Noise Analyzer Specifications
 R&S FSWP Phase Noise Analyzer Specifications Data Sheet Version 06.00 CONTENTS Definitions... 4 Specifications... 5 Frequency... 5 Phase noise measurements... 5 Phase noise sensitivity with R&S FSWP-B61
MAKING TRANSIENT ANTENNA MEASUREMENTS
 MAKING TRANSIENT ANTENNA MEASUREMENTS Roger Dygert, Steven R. Nichols MI Technologies, 1125 Satellite Boulevard, Suite 100 Suwanee, GA 30024-4629 ABSTRACT In addition to steady state performance, antennas
Introduction. In the frequency domain, complex signals are separated into their frequency components, and the level at each frequency is displayed
 SPECTRUM ANALYZER Introduction A spectrum analyzer measures the amplitude of an input signal versus frequency within the full frequency range of the instrument The spectrum analyzer is to the frequency
Albuquerque, New Mexico
 Albuquerque, New Mexico Document Number: Effective Date: 20090318 Title: TP, STX 165 Transmitter CCA Revision: 1-WK REVISION LIST REVISION DATE DESCRIPTION BY/APPROVAL 1 20090318 Initial Draft FEF68926
DSA-815 Demo Guide. Solution: The DSA 800 series of spectrum analyzers are packed with features.
 FAQ Instrument Solution FAQ Solution Title DSA-815 Demo Guide Date:08.29.2012 Solution: The DSA 800 series of spectrum analyzers are packed with features. Spectrum analyzers are similar to oscilloscopes..
8 Hints for Better Spectrum Analysis. Application Note
 8 Hints for Better Spectrum Analysis Application Note 1286-1 The Spectrum Analyzer The spectrum analyzer, like an oscilloscope, is a basic tool used for observing signals. Where the oscilloscope provides
FieldFox Handheld Education Series Part 7: Precision Validation of Radar System Performance in the Field
 FieldFox Handheld Education Series Part 7: Precision Validation of Radar System Performance in the Field FieldFox Handheld Education Series Interference Testing Cable and Antenna Measurements Calibration
Understanding New Pulse-analysis Techniques
 Understanding New Pulse-analysis Techniques Giuseppe Savoia Keysight Technologies Aerospace Defense Symposium Agenda Concept for Radar/Pulse signal analysis AD Symposium Page 2 Vector signal analyzers
EMC Training. Ing Angelo Cereser Mobile:
 EMC Training Ing Angelo Cereser angelo.cereser@microlease.com Mobile: 335 57 88 293 Dott Mirko Bombelli mirko.bombelli@microlease.com Mobile: 335 12 36 792 Agenda Introduzione alle misure EMI Terminologia;
LB680A Pulse Profiling USB PowerSensor+ Data Sheet
 Key PowerSensor+ Specifications 50 MHz to 20 GHz - 40 dbm to +20 dbm 2.8% Total Error* 1.20:1 VSWR (-21 db Return Loss) * Measuring a well matched DUT (-20 dbm @ 2 GHz) Measurement Capability Time Gated
8 Hints for Better Spectrum Analysis. Application Note
 8 Hints for Better Spectrum Analysis Application Note 1286-1 The Spectrum Analyzer The spectrum analyzer, like an oscilloscope, is a basic tool used for observing signals. Where the oscilloscope provides
ESA-E Series Spectrum Analyzer
 ESA-E Series Spectrum Analyzer Data Sheet Available frequency ranges: E4402B 9 khz to 3.0 GHz E4404B 9 khz to 6.7 GHz E4405B 9 khz to 13.2 GHz E4407B 9 khz to 26.5 GHz Table of Contents Definitions of
Agilent X-Series Signal Analyzer This manual provides documentation for the following X-Series Analyzer: CXA Signal Analyzer N9000A
 Agilent X-Series Signal Analyzer This manual provides documentation for the following X-Series Analyzer: CXA Signal Analyzer N9000A N9000A CXA Functional Tests Notices Agilent Technologies, Inc. 2006-2008
Federal Communications Commission Office of Engineering and Technology Laboratory Division
 April 9, 2013 Federal Communications Commission Office of Engineering and Technology Laboratory Division Guidance for Performing Compliance Measurements on Digital Transmission Systems (DTS) Operating
LB480A Pulse Profiling USB PowerSensor+ Data Sheet
 Key PowerSensor+ Specifications 100 MHz to 8 GHz (functional to 10 GHz) -60 dbm to +20 dbm 1.95% Total Error* 1.09:1 VSWR (-27 db Return Loss) * Measuring a well matched DUT (-20 dbm @ 1 GHz) Measurement
Network Analysis Basics
 Adolfo Del Solar Application Engineer adolfo_del-solar@agilent.com MD1010 Network B2B Agenda Overview What Measurements do we make? Network Analyzer Hardware Error Models and Calibration Example Measurements
Spectrum Analyzer Training
 Spectrum Analyzer Training Roberto Sacchi Application Engineer roberto_sacchi@agilent.com Page 1 Agenda Introduction Overview: What is Signal Analysis? What Measurements are available? Theory of Operation
6. 6dB &26dB Bandwidth Test
 FCC ID:2AO7Q-X600W1 Page 6-1 6. 6dB &26dB Bandwidth Test 6.1. Test Equipment Item Equipment Manufacturer Model No. Serial No. Last Cal. Cal. Interval 1. PXA Signal Analyzer Agilent N9030A MY53311015 Oct.15,17
Keysight Technologies Pulsed Antenna Measurements Using PNA Network Analyzers
 Keysight Technologies Pulsed Antenna Measurements Using PNA Network Analyzers White Paper Abstract This paper presents advances in the instrumentation techniques that can be used for the measurement and
PN9000 PULSED CARRIER MEASUREMENTS
 The specialist of Phase noise Measurements PN9000 PULSED CARRIER MEASUREMENTS Carrier frequency: 2.7 GHz - PRF: 5 khz Duty cycle: 1% Page 1 / 12 Introduction When measuring a pulse modulated signal the
Precision Validation of Radar System Performance in the Field
 Precision Validation of Radar System Performance in the Field August 19, 2015 Tom Hoppin Application Specialist Component Test Division Keysight Technologies Keysight Technologies 2015 1 Precision Validation
LB480A Pulse Profiling USB PowerSensor+ Data Sheet
 Key PowerSensor+ Specifications 50 MHz to 8 GHz (functional to 10 GHz) - 60 dbm to +20 dbm 1.95% Total Error* 1.09:1 VSWR (-27 db Return Loss) * Measuring a well matched DUT (-20 dbm @ 1 GHz) No Zero No
LB679A CW and Pulse (Modulation) USB PowerSensor+ Data Sheet
 USB PowerSensor+ Data Sheet") Key PowerSensor+ Specifications 50 MHz to 20 GHz - 40 dbm to +20 dbm 2.8% Total Error* 1.20:1 VSWR (-21 db Return Loss) * Measuring a well matched DUT (-20 dbm @ 2 GHz) Key PowerSensor+ Capability Test
Key PowerSensor+ Specifications 50 MHz to 20 GHz - 40 dbm to +20 dbm 2.8% Total Error* 1.20:1 VSWR (-21 db Return Loss) * Measuring a well matched DUT (-20 dbm @ 2 GHz) Key PowerSensor+ Capability Test
Pulsed S-Parameter Measurements using the ZVA network Analyzer
 Pulsed S-Parameter Measurements using the ZVA network Analyzer 1 Pulse Profile measurements ZVA Advanced Network Analyser 3 Motivation for Pulsed Measurements Typical Applications Avoid destruction of
Swept-tuned spectrum analyzer. Gianfranco Miele, Ph.D
 Swept-tuned spectrum analyzer Gianfranco Miele, Ph.D www.eng.docente.unicas.it/gianfranco_miele g.miele@unicas.it Reference level and logarithmic amplifier The signal displayed on the instrument screen
Signal Detection with EM1 Receivers
 Signal Detection with EM1 Receivers Werner Schaefer Hewlett-Packard Company Santa Rosa Systems Division 1400 Fountaingrove Parkway Santa Rosa, CA 95403-1799, USA Abstract - Certain EM1 receiver settings,
Measuring Non-linear Amplifiers
 Measuring Non-linear Amplifiers Transceiver Components & Measuring Techniques MM3 Jan Hvolgaard Mikkelsen Radio Frequency Integrated Systems and Circuits Division Aalborg University 27 Agenda Non-linear
Pulse Timing and Latency Measurements Using Wideband Video Detectors
 Pulse Timing and Latency Measurements Using Wideband Video Detectors LadyBug Technologies 3317 Chanate Rd. Suite 2F Santa Rosa, CA 95404 ladybug-tech.com 1-866-789-7111 An efficient, accurate, and cost-effective
Addressing the Challenges of Wideband Radar Signal Generation and Analysis. Marco Vivarelli Digital Sales Specialist
 Addressing the Challenges of Wideband Radar Signal Generation and Analysis Marco Vivarelli Digital Sales Specialist Agenda Challenges of Wideband Signal Generation Challenges of Wideband Signal Analysis
VR5-HD Functionality Verification Procedure. Application Note
 VR5-HD Functionality Verification Procedure Application Note Spirent 541 Industrial Way West Eatontown, NJ 07724 USA Email: sales@spirent.com Web: http://www.spirent.com AMERICAS 1-800-SPIRENT +1-818-676-2683
Simulating and Testing of Signal Processing Methods for Frequency Stepped Chirp Radar
 Test & Measurement Simulating and Testing of Signal Processing Methods for Frequency Stepped Chirp Radar Modern radar systems serve a broad range of commercial, civil, scientific and military applications.
Advanced RF Measurements You Didn t Know Your Oscilloscope Could Make. Brad Frieden Philip Gresock
 Advanced RF Measurements You Didn t Know Your Oscilloscope Could Make Brad Frieden Philip Gresock Agenda RF measurement challenges Oscilloscope platform overview Typical RF characteristics Bandwidth vs.
ELEN 701 RF & Microwave Systems Engineering. Lecture 2 September 27, 2006 Dr. Michael Thorburn Santa Clara University
 ELEN 701 RF & Microwave Systems Engineering Lecture 2 September 27, 2006 Dr. Michael Thorburn Santa Clara University Lecture 2 Radio Architecture and Design Considerations, Part I Architecture Superheterodyne
Dive deep into interference analysis
 Dive deep into interference analysis Dive deep into interference analysis Contents 1. Introducing Narda Outstanding features 2. Basics IDA 2 3. IDA 2 presentation How IDA 2 is used: 1) Detect 2) Analyze
USB Vector Spectrum Analyzer Operating Manual
 Triarchy VSA6G2A/B USB Vector Spectrum Analyzer Operating Manual CW Signal Spectrum Narrow band FM signal Wide Band FM signal QPSK signal density Cell phone signal at air MSK eye Diagram Waterfall display
RF Measurements You Didn't Know Your Oscilloscope Could Make
 RF Measurements You Didn't Know Your Oscilloscope Could Make January 21, 2015 Brad Frieden Product Manager Keysight Technologies Agenda RF Measurements using an oscilloscope (30 min) When to use an Oscilloscope
FieldFox Handheld Education Series Part 1: Techniques for Precise Interference Measurements in the Field
 FieldFox Handheld Education Series Part 1: Techniques for Precise Interference Measurements in the Field FieldFox Handheld Education Series Interference Testing Cable and Antenna Measurements Calibration
PGT313 Digital Communication Technology. Lab 6. Spectrum Analysis of CDMA Signal
 PGT313 Digital Communication Technology Lab 6 Spectrum Analysis of CDMA Signal Objectives i) To measure the channel power of a CDMA modulated RF signal using an oscilloscope and the VSA software ii) To
DCNTS Phase Noise Analyzer 2 MHz to 1.8 / 26 / 50 / 140 GHz
 DCNTS Phase Noise Analyzer 2 MHz to 1.8 / 26 / 50 / 140 GHz Datasheet The DCNTS is the highest performance Phase Noise Analyzer with unique flexible capabilities as summarized below: Phase Noise Amplitude
Agilent CSA Spectrum Analyzer
 Agilent CSA Spectrum Analyzer N1996A Exceptional performance... anytime, anywhere Frequency coverage Frequency range: 100 khz to 3 or 6 GHz Signal source: 10 MHz to 3 or 6 GHz Preamplifier to 3 or 6 GHz
RF, HIL and Radar Test
 RF, HIL and Radar Test Abhay Samant Marketing Manager India, Russia and Arabia RF Hardware In The Loop Complex Radio Environment Components of RF HIL Communication Modems Channel Simulation GPS Simulation
EMI Test Receivers: Past, Present and Future
 EM Test Receivers: Past, Present and Future Andy Coombes EMC Product Manager Rohde & Schwarz UK Ltd 9 th November 2016 ntroduction ı Andy Coombes EMC Product Manager ı 20 years experience in the field
ECE 2111 Signals and Systems Spring 2009, UMD Experiment 3: The Spectrum Analyzer
 ECE 2111 Signals and Systems Spring 2009, UMD Experiment 3: The Spectrum Analyzer Objective: Student will gain an understanding of the basic controls and measurement techniques of the Rohde & Schwarz Handheld
Model 7000 Series Phase Noise Test System
 Established 1981 Advanced Test Equipment Rentals www.atecorp.com 800-404-ATEC (2832) Model 7000 Series Phase Noise Test System Fully Integrated System Cross-Correlation Signal Analysis to 26.5 GHz Additive
Agilent Technologies Gli analizzatori di reti della serie-x
 Agilent Technologies Gli analizzatori di reti della serie-x Luigi Fratini 1 Introducing the PNA-X Performance Network Analyzer For Active Device Test 500 GHz & beyond! 325 GHz 110 GHz 67 GHz 50 GHz 43.5
3250 Series Spectrum Analyzer
 The most important thing we build is trust ADVANCED ELECTRONIC SOLUTIONS AVIATION SERVICES COMMUNICATIONS AND CONNECTIVITY MISSION SYSTEMS 3250 Series Spectrum Analyzer > Agenda Introduction
Contents. CALIBRATION PROCEDURE NI PXIe GHz and 14 GHz RF Vector Signal Analyzer
 CALIBRATION PROCEDURE NI PXIe-5665 3.6 GHz and 14 GHz RF Vector Signal Analyzer This document contains the verification procedures for the National Instruments PXIe-5665 (NI 5665) RF vector signal analyzer
Advances in RF and Microwave Measurement Technology
 1 Advances in RF and Microwave Measurement Technology Chi Xu Certified LabVIEW Architect Certified TestStand Architect New Demands in Modern RF and Microwave Test In semiconductor and wireless, technologies
DSA800. No.1 RIGOL TECHNOLOGIES, INC.
 No.1 DSA800 9 khz to 1.5 GHz Frequency Range Typical -135 dbm Displayed Average Noise Level (DANL) -80 dbc/hz @10 khz offset Phase Noise Total Amplitude Uncertainty
Appnote - Realtime Spectrum Analyzer vs Spectrum Analyzer
 Appnote - Realtime Spectrum Analyzer vs Spectrum Analyzer Today the RF industry has to face more and more the open question, how to transport the data from my test device (DUT) to different receiver spots
Reconfigurable 6 GHz RF Vector Signal Transceiver with 1 GHz Bandwidth
 CALIBRATION PROCEDURE PXIe-5840 Reconfigurable 6 GHz RF Vector Signal Transceiver with 1 GHz Bandwidth This document contains the verification procedures for the PXIe-5840 vector signal transceiver. Refer
Techniques for Characterizing Spurious Signals
 Techniques for Characterizing Spurious Signals October 21, 2014 Riadh Said Product Manager Microwave and Communications Division Keysight Technologies Our Goals today Review the sweep time equation to
APPH6040B / APPH20G-B Specification V2.0
 APPH6040B / APPH20G-B Specification V2.0 (July 2014, Serial XXX-XX33XXXXX-XXXX or higher) A fully integrated high-performance cross-correlation signal source analyzer for to 7 or 26 GHz 1 Introduction
Agilent Back to Basics. Spectrum Analysis Back to Basics. Presented by: Michel Joussemet
 Agilent Back to Basics Spectrum Analysis Back to Basics Presented by: Michel Joussemet Aerospace and Defense Symposium 2007 EuMw 2007 Agilent Workshop Agenda Introduction Overview: What is Signal Analysis?
A Guide to Calibrating Your Spectrum Analyzer
 A Guide to Calibrating Your Application Note Introduction As a technician or engineer who works with electronics, you rely on your spectrum analyzer to verify that the devices you design, manufacture,
Agilent PNA Microwave Network Analyzers
 Agilent PNA Microwave Network Analyzers Application Note 1408-11 Accurate Pulsed Measurements High Performance Pulsed S-parameter Measurements Vector network analyzers are traditionally used to measure
Module 1B RF Test & Measurement
 1 EECE 411 Antennas and Propagation Module 1B RF Test & Measurement Introduction to Spectrum Analyzers 2 Why Measure the Spectrum of a Signal? to characterize noise and interference to measure distortion
100 Hz to 22. HP 8566B Spectrum Analyzer. Discontinued Product Support Information Only. Outstanding Precision and Capability
 Discontinued Product Support Information Only This literature was published years prior to the establishment of Agilent Technologies as a company independent from Hewlett-Packard and describes products
Keysight X-Series Signal Analyzers
 Keysight X-Series Signal Analyzers This manual provides documentation for the following Analyzers: PXA Signal Analyzer N9030A EXA Signal Analyzer N9010A MXE EMI Receiver N9038A MXA Signal Analyzer N9020A
Agilent ESA-L Series Spectrum Analyzers
 Agilent ESA-L Series Spectrum Analyzers Data Sheet Available frequency ranges E4403B E4408B 9 khz to 1.5 GHz 9 khz to 3.0 GHz 9 khz to 26.5 GHz As the lowest cost ESA option, these basic analyzers are
Sensitivity of Series Direction Finders
 Sensitivity of Series 6000-6100 Direction Finders 1.0 Introduction A Technical Application Note from Doppler Systems April 8, 2003 This application note discusses the sensitivity of the 6000/6100 series
Agilent PSA Series Spectrum Analyzers Self-Guided Demonstration for Phase Noise Measurements
 Agilent PSA Series Spectrum Analyzers Self-Guided Demonstration for Phase Noise Measurements Product Note This demonstration guide is a tool to help you gain familiarity with the basic functions and important
Agilent X-Series Signal Analyzer
 Agilent X-Series Signal Analyzer This manual provides documentation for the following X-Series Instruments: PXA Signal Analyzer N9030A MXA Signal Analyzer N9020A EXA Signal Analyzer N9010A CXA Signal Analyzer
Advances in RF and Microwave Measurement Technology
 1 Advances in RF and Microwave Measurement Technology Rejwan Ali Marketing Engineer NI Africa and Oceania New Demands in Modern RF and Microwave Test In semiconductor and wireless, technologies such as
Spectrum Analyzers U3771/3772. Handling frequencies of up to 43 GHz!! Our new microwave spectrum analyzer, ideal for field use, is now available.
 Spectrum Analyzers U3771/3772 Handling frequencies of up to 43 GHz!! Our new microwave spectrum analyzer, ideal for field use, is now available. A New Standard for Microwave and Millimeter-wave Spectrum
Agilent Pulsed Measurements Using Narrowband Detection and a Standard PNA Series Network Analyzer
 Agilent Pulsed Measurements Using Narrowband Detection and a Standard PNA Series Network Analyzer White Paper Contents Introduction... 2 Pulsed Signals... 3 Pulsed Measurement Technique... 5 Narrowband
Agilent E7400A Series EMC Analyzers
 Agilent E7400A Series EMC Analyzers Data Sheet These specifications apply to the Agilent Technologies E7402A and E7405A EMC analyzers. Frequency Specifications Frequency range E7402A dc coupled 100 Hz
Demo / Application Guide for DSA815(-TG) / DSA1000 Series
 / DSA1000 Series") Demo / Application Guide for DSA815(-TG) / DSA1000 Series TX1000 Mobile Phone Frontend Mixer Bandpass Filter PA The schematic above shows a typical front end of a mobile phone. Our TX1000 RF Demo Kit shows
Demo / Application Guide for DSA815(-TG) / DSA1000 Series TX1000 Mobile Phone Frontend Mixer Bandpass Filter PA The schematic above shows a typical front end of a mobile phone. Our TX1000 RF Demo Kit shows
Suitable firmware can be found on Anritsu's web site under the instrument library listings.
 General Caution Please use a USB Memory Stick for firmware updates. Suitable firmware can be found on Anritsu's web site under the instrument library listings. If your existing firmware is older than v1.19,
Agilent N9320B RF Spectrum Analyzer
 Agilent N9320B RF Spectrum Analyzer 9 khz to 3.0 GHz Data Sheet Definitions and Conditions The spectrum analyzer will meet its specifications when: It is within its calibration cycle It has been turned
Agilent 8360B/8360L Series Synthesized Swept Signal/CW Generators 10 MHz to 110 GHz
 Agilent 8360B/8360L Series Synthesized Swept Signal/CW Generators 10 MHz to 110 GHz ity. l i t a ers V. n isio c e r P. y t i l i ib Flex 2 Agilent 8360 Synthesized Swept Signal and CW Generator Family
Frequency and Time Domain Representation of Sinusoidal Signals
 Frequency and Time Domain Representation of Sinusoidal Signals By: Larry Dunleavy Wireless and Microwave Instruments University of South Florida Objectives 1. To review representations of sinusoidal signals
Contents. CALIBRATION PROCEDURE NI PXIe-5668R 14 GHz and 26.5 GHz Signal Analyzer
 CALIBRATION PROCEDURE NI PXIe-5668R 14 GHz and 26.5 GHz Signal Analyzer This document contains the verification procedures for the National Instruments PXIe-5668R (NI 5668R) vector signal analyzer (VSA)
R&S FSWP Phase Noise Analyzer Specifications
 R&S FSWP Phase Noise Analyzer Specifications Test & Measurement Data Sheet 05.00 CONTENTS Definitions... 4 Specifications... 5 Frequency... 5 Phase noise measurements... 5 Phase noise sensitivity with
UWB Antennas & Measurements. Gabriela Quintero MICS UWB Network Meeting 11/12/2007
 UWB Antennas & Measurements Gabriela Quintero MICS UWB Network Meeting 11/12/27 Outline UWB Antenna Analysis Frequency Domain Time Domain Measurement Techniques Peak and Average Power Measurements Spectrum
DSA700 Series Spectrum Analyzer
 DSA700 Series Spectrum Analyzer Product Features: All-Digital IF Technology Frequency Range from 100 khz up to 1 GHz Min. -155 dbm Displayed Average Noise Level (Typ.) Min.
Application Note: Swept Return Loss & VSWR Antenna Measurements using the Eagle Technologies RF Bridge
 : Swept Return Loss & VSWR Antenna Measurements using the Eagle Technologies RF Bridge FCT-1008A Introduction Return loss and VSWR are a measure of the magnitude of a transmitted RF Signal in relation
Spectrum and signal analyzers for every requirement an overview
 Spectrum and signal analyzers for every requirement an overview The introduction of the Handheld Spectrum Analyzer R&S FSH6 (page 26) expands an already full range of analyzers from Rohde & Schwarz, covering
PGT313 Digital Communication Technology. Lab 3. Quadrature Phase Shift Keying (QPSK) and 8-Phase Shift Keying (8-PSK)
 and 8-Phase Shift Keying (8-PSK)") PGT313 Digital Communication Technology Lab 3 Quadrature Phase Shift Keying (QPSK) and 8-Phase Shift Keying (8-PSK) Objectives i) To study the digitally modulated quadrature phase shift keying (QPSK) and
PGT313 Digital Communication Technology Lab 3 Quadrature Phase Shift Keying (QPSK) and 8-Phase Shift Keying (8-PSK) Objectives i) To study the digitally modulated quadrature phase shift keying (QPSK) and
ME1000 RF Circuit Design. Lab 1. Calibration with Spectrum Analyzer
 ME1000 RF Circuit Design Lab 1 Calibration with Spectrum Analyzer This courseware product contains scholarly and technical information and is protected by copyright laws and international treaties. No