Spectrum Analyzer Training
|
|
|
- Alison Hunter
- 6 years ago
- Views:
Transcription


1 Spectrum Analyzer Training Roberto Sacchi Application Engineer Page 1
2 Agenda Introduction Overview: What is Signal Analysis? What Measurements are available? Theory of Operation Specifications Modern Signal Analyzer Designs & Capabilities Wide Bandwidth Vector Measurements Basics on digital modulation Measurements on digital modulation Slide 2

3 Overview What is Signal, Vector and Spectrum Analysis? Spectrum Analysis Display and measure amplitude versus frequency for RF & MW signals Separate or demodulate complex signals into their base components (sine waves) Slide 3
4 Overview Frequency versus Time Domain Amplitude (power) Time domain Measurements (Oscilloscope) Frequency Domain Measurements (Spectrum Analyzer) Slide 4


5 Overview Types of Tests Made Modulation Noise Distortion Slide 5
6 Overview Different Types of Analyzers Swept Analyzer A Filter 'sweeps' over range of interest LCD shows full spectral display f 1 f 2 f Slide 6
7 Overview Different Types of Analyzers FFT Analyzer A Parallel filters measured simultaneously LCD shows full spectral display f 1 f 2 f Slide 7
8 Agenda Introduction Overview Theory of Operation Specifications Modern spectrum analyzer designs & capabilities Wide Bandwidth Vector Measurements Basics on digital modulation Measurements on digital modulation Slide 8
9 Theory of Operation Swept Spectrum Analyzer Block Diagram RF input attenuator mixer IF gain IF filter (RBW) envelope detector Input signal Pre-Selector Or Low Pass Input Filter local oscillator Log Amp video filter sweep generator Crystal Reference Oscillator ADC, Display & Video Processing Slide 9
10 Theory of Operation Mixer MIXER f sig 1.5 GHz RF IF LO f sig f LO - f sig f + LO f LO f sig f LO 3,6 GHz 6.5 GHz Slide 10
11 Theory of Operation IF Filter (Resolution Bandwidth RBW) IF Filter Input Spectrum IF Bandwidth (RBW) Display A B C Slide 11

12 Theory of Operation Envelope Detector Before detector After detector Envelope Detector Slide 12
13 Theory of Operation Envelope Detector and Detection Types Envelope Detector Digitally Implemented Detection Types ADC, Display & Video Processing bins/buckets* Positive detection: largest value in bin displayed Negative detection: smallest value in bin displayed Sample detection: middle value in bin displayed Other Detectors: Normal (Rosenfell), Average (RMS Power) *Sweep points Slide 13
14 Theory of Operation Average Detector Type Envelope Detector Volts Pos Peak detection x bin ADC, Display & Video Processing Sample detection Time Power Average Detection (rms) = Square root of the sum of the squares of ALL of the voltage data values in the bin /50Ω x x Neg Peak detection Slide 14
15 Theory of Operation Video Filter (Video Bandwidth VBW) Video Filter Slide 15
16 Theory of Operation Other Components RF INPUT ATTENUATOR IF GAIN LO SWEEP GEN LCD Display, ADC & Video processing Slide 16
17 Theory of Operation How it All Works Together - 3 GHz spectrum analyzer f s Signal Range LO Range (GHz) f LO - f s f LO f LO + f s f s IF filter input mixer detector 3.6 GHz sweep generator f IF A LO f LO (GHz) LCD display (GHz) f Slide 17
18 Agenda Introduction Overview Theory of Operation Specifications Modern spectrum analyzer designs & capabilities Wide Bandwidth Vector Measurements Basics on digital modulation Measurements on digital modulation Slide 18
19 SPECTRUM ANALYZER 9 khz GHz Key Specifications 8563A Safe spectrum analysis Frequency Range Accuracy: Frequency & Amplitude Resolution Sensitivity Distortion Dynamic Range Slide 19
20 Specifications Resolution What Determines Resolution? Resolution Bandwidth RBW Type and Selectivity Noise Sidebands Slide 20
21 Specifications Resolution: Resolution Bandwidth Mixer 3 db BW 3 db Envelope Detector Input Spectrum LO IF Filter/ Resolution Bandwidth Filter (RBW) Sweep RBW Display Slide 21
22 Specifications Resolution: Resolution BW 10 khz RBW 3 db 10 khz Determines resolvability of equal amplitude signals Slide 22
23 Specifications Resolution BW Selectivity or Shape Factor 3 db 3 db BW 60 db 60 db BW Selectivity = 60 db BW 3 db BW Determines resolvability of unequal amplitude signals Slide 23
24 Specifications Resolution BW Selectivity or Shape Factor RBW = 1 khz Selectivity 15:1 RBW = 10 khz 3 db 7.5 khz distortion products 60 db 60 db BW = 15 khz 10 khz 10 khz Slide 24
25 Specifications Resolution: RBW Type and Selectivity ANALOG FILTER Typical Selectivity Analog 15:1 Digital 5:1 DIGITAL FILTER RES BW 100 Hz SPAN 3 khz Slide 25
26 Specifications Sensitivity/DANL RF Input Mixer RES BW Filter Detector LO Sweep A Spectrum Analyzer Generates and Amplifies Noise Just Like Any Active Circuit Slide 26

27 Specifications Sensitivity/DANL Effective Level of Displayed Noise is a Function of RF Input Attenuation signal level 10 db Attenuation = 10 db Attenuation = 20 db Signal To Noise Ratio Decreases as RF Input Attenuation is Increased Slide 27
28 Specifications Sensitivity/DANL: IF Filter(RBW) Displayed Noise is a Function of IF Filter Bandwidth 100 khz RBW 10 db 10 db 10 khz RBW 1 khz RBW Decreased BW = Decreased Noise Slide 28
29 Specifications Sensitivity/DANL: Summary For Best Sensitivity Use: Narrowest Resolution BW Minimum RF Input Attenuation Sufficient Averaging (video or trace) Slide 29

30 Specifications Spectrum Analyzer Dynamic Range Dynamic Range The ratio, expressed in db, of the largest to the smallest signals simultaneously present at the input of the spectrum analyzer that allows measurement of the smaller signal to a given degree of uncertainty. Slide 30
31 Agenda Introduction Overview Theory of Operation Specifications Modern spectrum analyzer designs & capabilities Wide Bandwidth Vector Measurements Basics on digital modulation Measurements on digital modulation Slide 31
32 Modern Spectrum Analyzer Block Diagram Pre-amp Analog IF Filter Digital IF Filter Digital Detectors FFT Attenuation Sweep vs. FFT Digital Log Amp YIG ADC Slide 32
33 Wide Band Block Diagram of the PSA option 122 Third Converter WB Analog IF WB Digital IF UPHB* 3 rd LO Calibrator FPGA HB 1 st LO 2 nd LO Low Band 3 rd LO NB IF *Un-preselected High Band Slide 33
34 Simplified Block Diagram Highband Preselected Mixer A MHz IF ACP Module Option D 21.4 MHz IF RF INPUT Input Attenuator 0-70 db 2 db Step 3Hz - 3GHz 1st LO 3-7 GHz 3 GHz GHz 1st IF 3.9 GHz Lowband C MHz IF Unpreselected Highband Mixer Digital Demod Option Preamp Option B MHz IF 1st LO 3-7 GHz 2nd LO 3.6 GHz PMYO 1st LO 3-7 GHz A B C MHz Out 21.4 MHz 3rd IF IF Processing ADC ASIC CPU D fs = 30 MHz 300 MHz LO 28.9 MHz LO Slide 34
35 rf Analog RBW filter set here RBW IF Processing Past Amplitude Only - Spectrum Analyzer (HP856x) IF2 Log Amp/ Detector ADC Bits LO1 LO2 Detected and logged level called video, mostly dc or slow moving Quadrature - Network Analyzer (HP8510A,..) Bits ADC rf/if Analog Cos(wt) RBW filter set here Sin (wt) Gain/Phase match errors ADC Bits Analog -- Digital Slide 35
36 IF Digitizers Now Amplitude or Vector Analyzer Push the digitizers up the rf chain ASIC I rf IF MHz ADC Bits Cos(wt) Sin (wt) RBW filters done digitally LO Fs Sample Rate ADC digitizes IF - not detected amplitude Q Q Fewer analog adjustments No temperature dependence Cheaper to manufacture Fewer components More flexible processing Analog -- Digital I Slide 36

37 Swept tuned measurements of broadband signals RF In IF out BPF Detectors Display processor Swept LO With narrow band measurements some information can be gained, such as amplitude and frequency range occupied by signal. Information contained within the signal will be lost because of the reduced BW. Slide 37

38 Digitization and FFT of broadband signals RF In IF out WBF ADC Display processor Fixed or step tuned All information is captured using a fast digitizer. An FFT is then performed to view signal in the frequency domain Slide 38


39 Types of wideband measurements There are basically two types of wide BW measurements: 1. Signal amplitude and lobe width for very narrow pulse radar measured in the pulse mode. 2. Phase and amplitude are needed for complete evaluation such as Chirp Radar 200 MHz linear chirp Slide 39
40 Instrument and System Calibration Calibration Q Amplitude error Amplitude Flatness Phase linearity Minimum Error Vector Magnitude Measured signal θ EVM Ideal Signal Phase linearity error I The goal is to measure the EVM of the DUT not the EVM introduced by the measuring system Slide 40

41 Signal used to calibrate IF path Amplitude and phase characterized comb covering the entire 80 MHz information BW Slide 41

42 Three loops of calibration Outer Loop IF cal Third Converter WB Analog IF WB Digital IF UPHB 3 rd LO HB Low Band 1 st LO 2 nd LO Calibrato r ADC cal Inner Loop IF cal FPGA 3 rd LO NB IF Slide 42
43 Modern Spectrum Analyzer Block Diagram Digital Detectors 3 GHz PreAmp Improve 1GHz DANL from 153 dbm to 167 dbm Analog IF Filter (Single Pole) Digital IF Filter 160 Settings 1 Hz to 8 MHz RBW 1 Hz to 50 MHz VBW Min Switching Uncertainty Normal Peak Minimum Peak Sample RMS Quasi Peak FFT Attenuator 2 db Step VCO Fast Tune Stepped for FFT Optimization for Close in PhaseNoise Far out PhaseNoise 14 Bit ADC Autoranging Dither on/off Sweep vs FFT Fast Sweep Narrow BW High Selectivity Digital Log Amp Min Linearity Contribution > 100 db Dynamic Range Slide 43
44 Agenda Introduction Overview Theory of Operation Specifications Modern spectrum analyzer designs & capabilities Basics on digital modulation Measurements on digital modulation Slide 44
45 Transmitting Information (Analog or Digital) Modify a Signal "Modulate" Detect the Modifications "Demodulate" Any reliably detectable change in signal characteristics can carry information Slide 45
46 The Communications Hierarchy The OSI Model: We are here Application Presentation Session Transport Network Data Link Physical e.g. Microsoft Exchange Encrypt/cross format translation E to E dialogue, billing etc. Mux, Flow and sequencing Switch, route and order packets Error detection/correction and Frames Raw bits/ Electrical specifications Slide 46
47 Why do we modulate? to move the signal to a frequency band where the medium has best transmitting properties radio transmission: to reduce antenna physical dimensions (f= 30 KHz = 10 Km) to multiplex multiple users in a given bandwidth Slide 47

")
")
48 Electromagnetic Spectrum Wave length 10 mm 1 mm f (Frequency) = (Velocity) (Wave length) Slide 48
 Scientific Research")
49 mmwaves Atmospheric Windows Millimeter waves ( GHz) have unique transmission channel characteristics of great interest for: Communications Transportation Scientific Research National Security Minimum attenuation bands 35, 94, 140, 220 GHz Maximum absorption bands 60, 120, 182 GHz Satellite Automotive RADAR National Security (imaging) Scientific Research Slide 49

50 Atmospheric Windows for Satellite Communications O 2 /H 2 O Minimum attenuation band: 35, 94, 140, 220 GHz Most effective for the satellite-earth signal transmissions? Maximum absorption band: 60, 120, 182 GHz Hard to be intercepted Effective for secured intersatellite transmissions Slide 50
51 Voltage Voltage Digital vs. Analog Time Time Analog: Faithful reproduction of signal at RX Digital: Decide which symbol was sent from a pre-defined alphabet Slide 51
52 Response (db) Response Response Bandwidth of a Signal Time (t/tb) Bandwidth of pulse of duration Tb is infinite Spectrum has sinc(x) shape extending from - to + First sidelobe -13 db down, rolls off at 20 db/dec Some form of filtering is required Normalised Frequency (f.tb) Slide 52
53 Response (db) Impulse Response Nyquist Brickwall Filter Pulse Response Nyquist Brickwall Filter Normalised Frequency (f/rb) Normalised Time (t/tb) Nyquist filter - achieves zero crossings at integer multiples of symbol period e.g. brickwall filter with cut-off at RS/2 Zero crossings at symbol interval - no ISI at sample point Slide 53
54 The Nyquist Bandwidth In a radio transmitter the filtering is done at baseband. Ideal brick-wall filter at the minimum bandwidth Envelope of digital baseband spectrum. f n = Nyquist Frequency frequency = Symbol Rate/2 This condition gives zero ISI (Inter Symbol Interference) Slide 54
55 Filter Bandwidth Parameter " Practical Filter Shapes = 1.0 = 0.5 = 0.3 = 0 brickwall Fs : Symbol Rate Alpha describes the "sharpness" of the filter. Occupied bandwidth is approximately: Symbol rate X (1 + ) Slide 55
56 Single Carrier Modulation Frequency Domain View 1 carrier BW = SymRate(1+ ) Slide 56
57 Polar vs. "I-Q" Format Project signal to "I" and "Q" axes Polar to Rectangular Conversion "Q" Q-Value 0 deg "I" I-Value Slide 57
58 Creating Digital Modulation (1,0) Q +1volt (0,0) We have used the concept of Signal Space to view our modulations. We can use the same idea to engineer these modulations. 1volt +1volt I (1,1) 1volt (0,1) +1v I (0,1) f C 90º 1v Q Slide 58
59 How Does this Work? Putting two different messages into one signal space. (These could be independent messages.) I(t) cos( t) 90º S(t) Q(t) S(t) = I(t)cos( t) Q(t)sin( t) = A(t)[cos ( t + (t))] A I 2 Q 2 tan 1 Q I Slide 59
60 Separating the Components: The Receiver S(t) = I(t)cos( t) Q(t)sin( t) The composite signal is separated by multiplying (mixing) by sin( t) and cos ( t), the resulting sin 2 and cos 2 terms become [I(t) or Q(t)] ½[1 ± cos(2 t)] terms - the 2 t s are removed by LPF. LPF I(t) S(t) cos( t) +90º LPF Q(t) Slide 60
61 Agenda Introduction Overview Theory of Operation Specifications Modern spectrum analyzer designs & capabilities Basics on digital modulation Measurements on digital modulation Slide 61
62 Measurements on digital radios Swept Spectrum Analyzer (with span zero and enough ResBW) Time Domain (CCDF, pulse shaping, timing) Frequency Domain (Channel Power, spectrum mask, ) Modulation Domain Overall Modulation Quality, Modulation Quality on individual carriers Channel Response, Group Delay In Channel Spurious Search Slide 62 Vector Signal Analyzer
63 FFT Analyzer Block Diagram Digital Data Flow (time) Digital Filter assembly Input Signal ADC Assembly ADC 90 o phase shift Real Part (I) Imaginary Part Re-Sampling DSP D e m o d W i n d o w F F T (freq) D I S P L A Y F s (demod time) (Q) Quadrature Anti-alaising and Sampling Decimation Slide 63
")
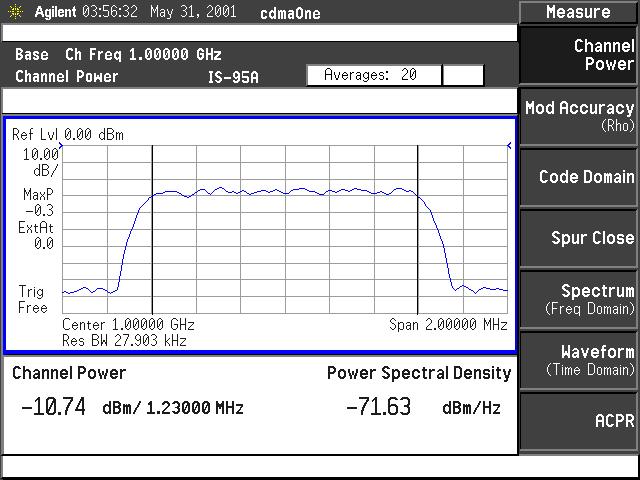
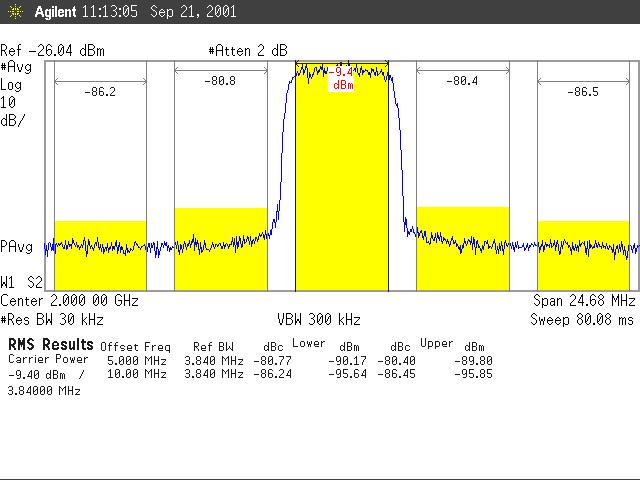
64 Measurements in the frequency domain: - Channel power and occupied bandwidth - Adjacent channel power ratio (ACPR) Slide 64

65 Measurements in the frequency domain: Spurious signals In band Out of band Slide 65
66 - time domain Slide 66
67 Power Amplifier (PA) Compression How to verify? Useful measurements: ACP, CCDF With compression Without compression Compare these measurements performed: - at the input and output of the PA - at the output for decreasing values of the input level Slide 67
68 Modulation Quality Analysis EVM[%] MER[dB] Modulation Error Basic Concept: Q Ideal point Ideal Signal at decision time Error Vector Magnitude Error Vector Measured point Measured Signal at decision time Measured signal is never equal to ideal signal, due to noise, transmitter impairments, propagation phenomena, I Slide 68
69 Effect of Noise Noise adds vectorially to a signal. Noise on a QPSK constellation. Slide 69
70 Overlapping Probabilities There is a finite probability that adjacent states could be confused. A measure of the functioning of the system is BER (Bit Error Ratio) e.g. if 100 bits are in error in 10 8 bits. Then the BER is 10-6 Slide 70
71 I/Q Impairments: I/Q gain imbalance, Quadrature errors, I/Q offsets I/Q impairments are typically cause by matching problems due to component differences between the I side and Q side of the block diagram Significant measurements: constellation and EVM metrics Slide 71

 Mag & Phase Errors High and")
72 Signal B: Demodulation Spectrum B Demod Points are not randomly distributed EVM High (3.6%) Mag & Phase Errors High and comparable Slide 72
73 Signal B: EVM Spectrum Shows Spur EVM Spectrum Spurious Signal -36dBc spur was buried under the modulated carrier Spectrum B Slide 73
74 Clock impairments Incorrect symbol rate The effect of symbol rate errors on the different measurements depends on the the magnitude of the errors: - different methods to verify small or large symbol errors Slide 74

75 Incorrect Symbol Rate + Symbol Clock Transmitter and Receiver operate with different clocks Recovered Symbol Clock Symbol Rate Error = 0.1% Slide 75
76 Incorrect symbol rate: small errors (2) Measurement: EVM vs time Detection and troubleshooting hint: Verify the V shape of the magnitude of the error vector versus time display Slide 76

77 Troubleshooting examples: QPSK transmitter with symbol rate errors Slide 77
78 End Roberto Sacchi Application Engineer Slide 78
RF Fundamentals Part 2 Spectral Analysis
 Spectral Analysis Dec 8, 2016 Kevin Nguyen Keysight Technologies Agenda Overview Theory of Operation Traditional Spectrum Analyzers Modern Signal Analyzers Specifications Features Wrap-up Page 2 Overview
Digital Signal Analysis
 Digital Signal Analysis Objectives - Provide a digital modulation overview - Review common digital radio impairments Digital Modulation Overview Signal Characteristics to Modify Polar Display / IQ Relationship
Wide bandwidth measurements and Calibration
 Wide bandwidth measurements and Calibration Agenda Wide bandwidth measurement definitions The need for wide bandwidth measurements Types of wide bandwidth measurements Accurate measurements and system
Agilent Back to Basics. Spectrum Analysis Back to Basics. Presented by: Michel Joussemet
 Agilent Back to Basics Spectrum Analysis Back to Basics Presented by: Michel Joussemet Aerospace and Defense Symposium 2007 EuMw 2007 Agilent Workshop Agenda Introduction Overview: What is Signal Analysis?
Utilizzo del Time Domain per misure EMI
 Utilizzo del Time Domain per misure EMI Roberto Sacchi Measurement Expert Manager - Europe 7 Giugno 2017 Compliance EMI receiver requirements (CISPR 16-1-1 ) range 9 khz - 18 GHz: A normal +/- 2 db absolute
Understanding RF and Microwave Analysis Basics
 Understanding RF and Microwave Analysis Basics Kimberly Cassacia Product Line Brand Manager Keysight Technologies Agenda µw Analysis Basics Page 2 RF Signal Analyzer Overview & Basic Settings Overview
Keysight Technologies
 Keysight Technologies Generating Signals Basic CW signal Block diagram Applications Analog Modulation Types of analog modulation Block diagram Applications Digital Modulation Overview of IQ modulation
8 Hints for Better Spectrum Analysis. Application Note
 8 Hints for Better Spectrum Analysis Application Note 1286-1 The Spectrum Analyzer The spectrum analyzer, like an oscilloscope, is a basic tool used for observing signals. Where the oscilloscope provides
Addressing the Challenges of Wideband Radar Signal Generation and Analysis. Marco Vivarelli Digital Sales Specialist
 Addressing the Challenges of Wideband Radar Signal Generation and Analysis Marco Vivarelli Digital Sales Specialist Agenda Challenges of Wideband Signal Generation Challenges of Wideband Signal Analysis
TESTING METHODS AND ERROR BUDGET ANALYSIS OF A SOFTWARE DEFINED RADIO By Richard Overdorf
 TESTING METHODS AND ERROR BUDGET ANALYSIS OF A SOFTWARE DEFINED RADIO By Richard Overdorf SDR Considerations Data rates Voice Image Data Streaming Video Environment Distance Terrain High traffic/low traffic
8 Hints for Better Spectrum Analysis. Application Note
 8 Hints for Better Spectrum Analysis Application Note 1286-1 The Spectrum Analyzer The spectrum analyzer, like an oscilloscope, is a basic tool used for observing signals. Where the oscilloscope provides
Advanced RF Measurements You Didn t Know Your Oscilloscope Could Make. Brad Frieden Philip Gresock
 Advanced RF Measurements You Didn t Know Your Oscilloscope Could Make Brad Frieden Philip Gresock Agenda RF measurement challenges Oscilloscope platform overview Typical RF characteristics Bandwidth vs.
Satellite Communications: Part 4 Signal Distortions & Errors and their Relation to Communication Channel Specifications. Howard Hausman April 1, 2010
 Satellite Communications: Part 4 Signal Distortions & Errors and their Relation to Communication Channel Specifications Howard Hausman April 1, 2010 Satellite Communications: Part 4 Signal Distortions
Agilent Spectrum Analysis Basics. Application Note 150
 Agilent Spectrum Analysis Basics Application Note 150 Table of Contents Chapter 1 Introduction.......................................................4 Frequency domain versus time domain.......................................4
A year and a half after the first introduction of the PXA, Agilent is now introducing the world s highest performance mmw signal analyzer in April
 1 This presentation is intended to be a beginning tutorial on signal analysis. Vector signal analysis includes but is not restricted to spectrum analysis. It is written for those who are unfamiliar with
Successful Modulation Analysis in 3 Steps. Ben Zarlingo Application Specialist Agilent Technologies Inc. January 22, 2014
 Successful Modulation Analysis in 3 Steps Ben Zarlingo Application Specialist Agilent Technologies Inc. January 22, 2014 Agilent Technologies, Inc. 2014 This Presentation Focus on Design, Validation, Troubleshooting
Understanding Low Phase Noise Signals. Presented by: Riadh Said Agilent Technologies, Inc.
 Understanding Low Phase Noise Signals Presented by: Riadh Said Agilent Technologies, Inc. Introduction Instabilities in the frequency or phase of a signal are caused by a number of different effects. Each
RF/IF Terminology and Specs
 RF/IF Terminology and Specs Contributors: Brad Brannon John Greichen Leo McHugh Eamon Nash Eberhard Brunner 1 Terminology LNA - Low-Noise Amplifier. A specialized amplifier to boost the very small received
TSEK02: Radio Electronics Lecture 8: RX Nonlinearity Issues, Demodulation. Ted Johansson, EKS, ISY
 TSEK02: Radio Electronics Lecture 8: RX Nonlinearity Issues, Demodulation Ted Johansson, EKS, ISY RX Nonlinearity Issues: 2.2, 2.4 Demodulation: not in the book 2 RX nonlinearities System Nonlinearity
Techniques for Characterizing Spurious Signals
 Techniques for Characterizing Spurious Signals October 21, 2014 Riadh Said Product Manager Microwave and Communications Division Keysight Technologies Our Goals today Review the sweep time equation to
Advances in RF and Microwave Measurement Technology
 1 Advances in RF and Microwave Measurement Technology Chi Xu Certified LabVIEW Architect Certified TestStand Architect New Demands in Modern RF and Microwave Test In semiconductor and wireless, technologies
Spectrum Analysis Back to Basics
 Spectrum Analysis Back to Basics Agilent Technologies 1 Agenda Introduction Overview: What is Spectrum and Signal Analysis? What Measurements are available? Theory of Operation Specifications Modern Signal
Understanding Probability of Intercept for Intermittent Signals
 2013 Understanding Probability of Intercept for Intermittent Signals Richard Overdorf & Rob Bordow Agilent Technologies Agenda Use Cases and Signals Time domain vs. Frequency Domain Probability of Intercept
Measuring Non-linear Amplifiers
 Measuring Non-linear Amplifiers Transceiver Components & Measuring Techniques MM3 Jan Hvolgaard Mikkelsen Radio Frequency Integrated Systems and Circuits Division Aalborg University 27 Agenda Non-linear
TSEK02: Radio Electronics Lecture 8: RX Nonlinearity Issues, Demodulation. Ted Johansson, EKS, ISY
 TSEK02: Radio Electronics Lecture 8: RX Nonlinearity Issues, Demodulation Ted Johansson, EKS, ISY 2 RX Nonlinearity Issues, Demodulation RX nonlinearities (parts of 2.2) System Nonlinearity Sensitivity
Advances in RF and Microwave Measurement Technology
 1 Advances in RF and Microwave Measurement Technology Rejwan Ali Marketing Engineer NI Africa and Oceania New Demands in Modern RF and Microwave Test In semiconductor and wireless, technologies such as
Measuring ACPR of W-CDMA signals with a spectrum analyzer
 Measuring ACPR of W-CDMA signals with a spectrum analyzer When measuring power in the adjacent channels of a W-CDMA signal, requirements for the dynamic range of a spectrum analyzer are very challenging.
Interference Analysis and Spectrum Monitor Seminar
 Interference Analysis and Spectrum Monitor Seminar Handheld RF & Microwave Instruments Andrew Benn Business Development Manager Agilent Technologies Wednesday 12 th October 2011 1 Agilent Technologies,
Bandwidth and dynamic range for future systems and technologies
 Signal nalyzers R&S FSQ Bandwidth and dynamic range for future systems and technologies The R&S FSQ is fully in line with the trend towards systems with higher data rates (e.g. wireless LN) and multicarrier
3250 Series Spectrum Analyzer
 The most important thing we build is trust ADVANCED ELECTRONIC SOLUTIONS AVIATION SERVICES COMMUNICATIONS AND CONNECTIVITY MISSION SYSTEMS 3250 Series Spectrum Analyzer > Agenda Introduction
SC5307A/SC5308A 100 khz to 6 GHz RF Downconverter. Datasheet SignalCore, Inc.
 SC5307A/SC5308A 100 khz to 6 GHz RF Downconverter Datasheet 2017 SignalCore, Inc. support@signalcore.com P RODUCT S PECIFICATIONS Definition of Terms The following terms are used throughout this datasheet
ADI 2006 RF Seminar. Chapter II RF/IF Components and Specifications for Receivers
 ADI 2006 RF Seminar Chapter II RF/IF Components and Specifications for Receivers 1 RF/IF Components and Specifications for Receivers Fixed Gain and Variable Gain Amplifiers IQ Demodulators Analog-to-Digital
Making Noise in RF Receivers Simulate Real-World Signals with Signal Generators
 Making Noise in RF Receivers Simulate Real-World Signals with Signal Generators Noise is an unwanted signal. In communication systems, noise affects both transmitter and receiver performance. It degrades
Introduction. In the frequency domain, complex signals are separated into their frequency components, and the level at each frequency is displayed
 SPECTRUM ANALYZER Introduction A spectrum analyzer measures the amplitude of an input signal versus frequency within the full frequency range of the instrument The spectrum analyzer is to the frequency
PXIe Contents SPECIFICATIONS. 14 GHz and 26.5 GHz Vector Signal Analyzer
 SPECIFICATIONS PXIe-5668 14 GHz and 26.5 GHz Vector Signal Analyzer These specifications apply to the PXIe-5668 (14 GHz) Vector Signal Analyzer and the PXIe-5668 (26.5 GHz) Vector Signal Analyzer with
PN9000 PULSED CARRIER MEASUREMENTS
 The specialist of Phase noise Measurements PN9000 PULSED CARRIER MEASUREMENTS Carrier frequency: 2.7 GHz - PRF: 5 khz Duty cycle: 1% Page 1 / 12 Introduction When measuring a pulse modulated signal the
9 Best Practices for Optimizing Your Signal Generator Part 2 Making Better Measurements
 9 Best Practices for Optimizing Your Signal Generator Part 2 Making Better Measurements In consumer wireless, military communications, or radar, you face an ongoing bandwidth crunch in a spectrum that
GET10B Radar Measurement Basics- Spectrum Analysis of Pulsed Signals. Copyright 2001 Agilent Technologies, Inc.
 GET10B Radar Measurement Basics- Spectrum Analysis of Pulsed Signals Copyright 2001 Agilent Technologies, Inc. Agenda: Power Measurements Module #1: Introduction Module #2: Power Measurements Module #3:
Lab Assignment #3 Analog Modulation (An Introduction to RF Signal, Noise and Distortion Measurements in the Frequency Domain)
") Lab Assignment #3 Analog Modulation (An Introduction to RF Signal, Noise and Distortion Measurements in the Frequency Domain) By: Timothy X Brown, Olivera Notaros, Nishant Jadhav TLEN 5320 Wireless Systems
Lab Assignment #3 Analog Modulation (An Introduction to RF Signal, Noise and Distortion Measurements in the Frequency Domain) By: Timothy X Brown, Olivera Notaros, Nishant Jadhav TLEN 5320 Wireless Systems
2015 Interference 101. Robin Jackman Application Engineer
 2015 Interference 101 Robin Jackman Application Engineer Agenda What is Interference Introduction Definitions Spectrum Analyzer Concepts Concepts, Controls, Displays Making good measurements Measuring
Agilent Vector Signal Analysis Basics. Application Note
 Agilent Vector Signal Analysis Basics Application Note Table of Contents Vector signal Analysis 3 VSA measurement advantages 4 VSA measurement concepts and theory of operation 6 Data windowing leakage
Keysight Technologies Spectrum Analysis Basics. Application Note 150
 Keysight Technologies Spectrum Analysis Basics Application Note 150 2 Keysight Spectrum Analysis Basics Application Note 150 Keysight Technologies. Inc. dedicates this application note to Blake Peterson.
Specifications Guide
 Agilent Technologies PSA Series Spectrum Analyzers This manual provides documentation for the following instruments: E4443A (3 Hz 6.7 GHz) E4445A (3 Hz 13.2 GHz) E4440A (3 Hz 26.5 GHz) E4446A (3 Hz 44
Why/When I need a Spectrum Analyzer. Jan 12, 2017
 Why/When I need a Jan 12, 2017 Common Questions What s the difference of Oscilloscope and Spectrum Analysis Almost all Oscilloscope has FFT for a spectrum view, why I need a spectrum analyzer? When shall
A New Look at SDR Testing
 A New Look at SDR Testing (presented at SDR Academy 2016, Friedrichshafen, Germany) Adam Farson VA7OJ/AB4OJ Copyright 2016 A. Farson VA7OJ/AB4OJ 25-Dec-17 SDR Academy 2016 - SDR Testing 1 Performance issues
Simulating and Testing of Signal Processing Methods for Frequency Stepped Chirp Radar
 Test & Measurement Simulating and Testing of Signal Processing Methods for Frequency Stepped Chirp Radar Modern radar systems serve a broad range of commercial, civil, scientific and military applications.
22 Marzo 2012 IFEMA, Madrid spain.ni.com/nidays.
 22 Marzo 2012 IFEMA, Madrid spain.ni.com/nidays www.infoplc.net The Art of Benchmarking Speed PXI Versus Rack-and-Stack Test Equipment Filippo Persia Systems Engineer Automated Test Mediterranean Region
Addressing the Challenges of Wideband Radar and SatCom Measurements
 2011 Agilent RF/uW Symposium Addressing the Challenges of Wideband Radar and SatCom Measurements Presented by: Giuseppe Savoia, Agilent Technologies Agenda Applications requiring broadband uw test equipment
Measurement of Digital Transmission Systems Operating under Section March 23, 2005
 Measurement of Digital Transmission Systems Operating under Section 15.247 March 23, 2005 Section 15.403(f) Digital Modulation Digital modulation is required for Digital Transmission Systems (DTS). Digital
Receiver Architecture
 Receiver Architecture Receiver basics Channel selection why not at RF? BPF first or LNA first? Direct digitization of RF signal Receiver architectures Sub-sampling receiver noise problem Heterodyne receiver
Exploring Trends in Technology and Testing in Satellite Communications
 Exploring Trends in Technology and Testing in Satellite Communications Aerospace Defense Symposium Giuseppe Savoia Keysight Technologies Agenda Page 2 Evolving military and commercial satellite communications
EE470 Electronic Communication Theory Exam II
 EE470 Electronic Communication Theory Exam II Open text, closed notes. For partial credit, you must show all formulas in symbolic form and you must work neatly!!! Date: November 6, 2013 Name: 1. [16%]
SC5407A/SC5408A 100 khz to 6 GHz RF Upconverter. Datasheet. Rev SignalCore, Inc.
 SC5407A/SC5408A 100 khz to 6 GHz RF Upconverter Datasheet Rev 1.2 2017 SignalCore, Inc. support@signalcore.com P R O D U C T S P E C I F I C A T I O N S Definition of Terms The following terms are used
SC5306B 1 MHz to 3.9 GHz RF Downconverter Core Module. Datasheet SignalCore, Inc.
 SC5306B 1 MHz to 3.9 GHz RF Downconverter Core Module Datasheet 2015 SignalCore, Inc. support@signalcore.com SC5306B S PECIFICATIONS Definition of Terms The following terms are used throughout this datasheet
Spectrum and signal analyzers for every requirement an overview
 Spectrum and signal analyzers for every requirement an overview The introduction of the Handheld Spectrum Analyzer R&S FSH6 (page 26) expands an already full range of analyzers from Rohde & Schwarz, covering
Understanding Spectrum Analysis
 Understanding Spectrum Analysis Swept, FFT, and RTSA principles E & T Team September 2017 Operation principles of SPA architectures Agenda Part I Chasing dynamic and transient signals Probability of intercept
June 09, 2014 Document Version: 1.1.0
 DVB-T2 Analysis Toolkit Data Sheet An ideal solution for SFN network planning, optimization, maintenance and Broadcast Equipment Testing June 09, 2014 Document Version: 1.1.0 Contents 1. Overview... 3
Twelve voice signals, each band-limited to 3 khz, are frequency -multiplexed using 1 khz guard bands between channels and between the main carrier
 Twelve voice signals, each band-limited to 3 khz, are frequency -multiplexed using 1 khz guard bands between channels and between the main carrier and the first channel. The modulation of the main carrier
Spectrum Analyzers 2680 Series Features & benefits
 Data Sheet Features & benefits n Frequency range: 9 khz to 2.1 or 3.2 GHz n High Sensitivity -161 dbm/hz displayed average noise level (DANL) n Low phase noise of -98 dbc/hz @ 10 khz offset n Low level
PXI WiMAX Measurement Suite Data Sheet
 PXI WiMAX Measurement Suite Data Sheet The most important thing we build is trust Transmit power Spectral mask Occupied bandwidth EVM (all, data only, pilots only) Frequency error Gain imbalance, Skew
Signal Generators for Anritsu RF and Microwave Handheld Instruments
 Measurement Guide Signal Generators for Anritsu RF and Microwave Handheld Instruments BTS Master Spectrum Master Tracking Generator Option 20 Vector signal Generator Option 23 Anritsu Company 490 Jarvis
The Value of Pre-Selection in EMC Testing. Scott Niemiec Application Engineer
 The Value of Pre-Selection in EMC Testing Scott Niemiec Application Engineer Video Demonstrating Benefit of Pre-selection 400MHz -1GHz Sweep with RBW = 120kHz Yellow: w/ preselection Green: w/o pre-selection
R3477. Ideal for mobile communication applications including base stations and handsets, from the development stage to production and installation
 R3477 Signal Analyzers Ideal for mobile communication applications including base stations and handsets, from the development stage to production and installation Frequency range: 9 khz to 13.5 GHz World
RFID Systems: Radio Architecture
 RFID Systems: Radio Architecture 1 A discussion of radio architecture and RFID. What are the critical pieces? Familiarity with how radio and especially RFID radios are designed will allow you to make correct
DSA700 Series Spectrum Analyzer
 DSA700 Series Spectrum Analyzer Product Features: All-Digital IF Technology Frequency Range from 100 khz up to 1 GHz Min. -155 dbm Displayed Average Noise Level (Typ.) Min.
Appnote - Realtime Spectrum Analyzer vs Spectrum Analyzer
 Appnote - Realtime Spectrum Analyzer vs Spectrum Analyzer Today the RF industry has to face more and more the open question, how to transport the data from my test device (DUT) to different receiver spots
CLOUDSDR RFSPACE #CONNECTED SOFTWARE DEFINED RADIO. final design might vary without notice
 CLOUDSDR #CONNECTED SOFTWARE DEFINED RADIO final design might vary without notice 1 - PRELIMINARY SPECIFICATIONS http://www.rfspace.com v0.1 RFSPACE CloudSDR CLOUDSDR INTRODUCTION The RFSPACE CloudSDR
Data Sheet SC5317 & SC5318A. 6 GHz to 26.5 GHz RF Downconverter SignalCore, Inc. All Rights Reserved
 Data Sheet SC5317 & SC5318A 6 GHz to 26.5 GHz RF Downconverter www.signalcore.com 2018 SignalCore, Inc. All Rights Reserved Definition of Terms 1 Table of Contents 1. Definition of Terms... 2 2. Description...
Reconfigurable 6 GHz Vector Signal Transceiver with I/Q Interface
 SPECIFICATIONS PXIe-5645 Reconfigurable 6 GHz Vector Signal Transceiver with I/Q Interface Contents Definitions...2 Conditions... 3 Frequency...4 Frequency Settling Time... 4 Internal Frequency Reference...
Using a design-to-test capability for LTE MIMO (Part 1 of 2)
") Using a design-to-test capability for LTE MIMO (Part 1 of 2) System-level simulation helps engineers gain valuable insight into the design sensitivities of Long Term Evolution (LTE) Multiple-Input Multiple-Output
Using a design-to-test capability for LTE MIMO (Part 1 of 2) System-level simulation helps engineers gain valuable insight into the design sensitivities of Long Term Evolution (LTE) Multiple-Input Multiple-Output
ECE 440L. Experiment 1: Signals and Noise (1 week)
") ECE 440L Experiment 1: Signals and Noise (1 week) I. OBJECTIVES Upon completion of this experiment, you should be able to: 1. Use the signal generators and filters in the lab to generate and filter noise
ECE 440L Experiment 1: Signals and Noise (1 week) I. OBJECTIVES Upon completion of this experiment, you should be able to: 1. Use the signal generators and filters in the lab to generate and filter noise
Understanding Level Accuracy specifications and techniques in Spectrum Analysers.
 Understanding Level Accuracy specifications and techniques in Spectrum Analysers. Anritsu Spectrum Analyser roadshow. Feb 2018 Agenda Measurement fundamentals and uncertainties Amplitude level accuracy
Real-Time Digital Down-Conversion with Equalization
 Real-Time Digital Down-Conversion with Equalization February 20, 2019 By Alexander Taratorin, Anatoli Stein, Valeriy Serebryanskiy and Lauri Viitas DOWN CONVERSION PRINCIPLE Down conversion is basic operation
PXI. TD-SCDMA Measurement Suite Data Sheet. The most important thing we build is trust. Total Average Power plus Midamble / Data Power
 PXI TD-SCDMA Measurement Suite Data Sheet The most important thing we build is trust Total Average Power plus Midamble / Data Power Transmit On/Off Time Mask Transmit Closed Loop Power Control (CLPC) Spectrum
DSA-815 Demo Guide. Solution: The DSA 800 series of spectrum analyzers are packed with features.
 FAQ Instrument Solution FAQ Solution Title DSA-815 Demo Guide Date:08.29.2012 Solution: The DSA 800 series of spectrum analyzers are packed with features. Spectrum analyzers are similar to oscilloscopes..
Understanding New Pulse-analysis Techniques
 Understanding New Pulse-analysis Techniques Giuseppe Savoia Keysight Technologies Aerospace Defense Symposium Agenda Concept for Radar/Pulse signal analysis AD Symposium Page 2 Vector signal analyzers
Measurement Guide and Programming Examples
 Measurement Guide and Programming Examples N9073A-1FP W-CDMA Measurement Application N9073A-2FP HSDPA/HSUPA Measurement Application For use with the Agilent N9020A MXA and N9010A EXA Signal Analyzers Manufacturing
Agilent PSA Series Spectrum Analyzers Self-Guided Demonstration for GSM and EDGE Measurements
 Agilent PSA Series Spectrum Analyzers Self-Guided Demonstration for GSM and EDGE Measurements Product Note This demonstration guide is a tool to help you gain familiarity with the basic functions and important
Outline. Communications Engineering 1
 Outline Introduction Signal, random variable, random process and spectra Analog modulation Analog to digital conversion Digital transmission through baseband channels Signal space representation Optimal
Digital Receiver Experiment or Reality. Harry Schultz AOC Aardvark Roost Conference Pretoria 13 November 2008
 Digital Receiver Experiment or Reality Harry Schultz AOC Aardvark Roost Conference Pretoria 13 November 2008 Contents Definition of a Digital Receiver. Advantages of using digital receiver techniques.
Fundamentals of Digital Communication
 Fundamentals of Digital Communication Network Infrastructures A.A. 2017/18 Digital communication system Analog Digital Input Signal Analog/ Digital Low Pass Filter Sampler Quantizer Source Encoder Channel
Keysight Technologies 8 Hints for Making Better Measurements Using RF Signal Generators. Application Note
 Keysight Technologies 8 Hints for Making Better Measurements Using RF Signal Generators Application Note 02 Keysight 8 Hints for Making Better Measurements Using RF Signal Generators - Application Note
Agilent Technologies PSA Series Spectrum Analyzers Test and Adjustment Software
 Test System Overview Agilent Technologies PSA Series Spectrum Analyzers Test and Adjustment Software Test System Overview The Agilent Technologies test system is designed to verify the performance of the
FFT Analyzer. Gianfranco Miele, Ph.D
 FFT Analyzer Gianfranco Miele, Ph.D www.eng.docente.unicas.it/gianfranco_miele g.miele@unicas.it Introduction It is a measurement instrument that evaluates the spectrum of a time domain signal applying
R&S FSWP Phase Noise Analyzer Specifications
 R&S FSWP Phase Noise Analyzer Specifications Data Sheet Version 06.00 CONTENTS Definitions... 4 Specifications... 5 Frequency... 5 Phase noise measurements... 5 Phase noise sensitivity with R&S FSWP-B61
EMC Training. Ing Angelo Cereser Mobile:
 EMC Training Ing Angelo Cereser angelo.cereser@microlease.com Mobile: 335 57 88 293 Dott Mirko Bombelli mirko.bombelli@microlease.com Mobile: 335 12 36 792 Agenda Introduzione alle misure EMI Terminologia;
Chapter 5 Specifications
 RIGOL Specifications are valid under the following conditions: the instrument is within the calibration period, is stored for at least two hours at 0 to 50 temperature and is warmed up for 40 minutes.
Antenna Measurements using Modulated Signals
 Antenna Measurements using Modulated Signals Roger Dygert MI Technologies, 1125 Satellite Boulevard, Suite 100 Suwanee, GA 30024-4629 Abstract Antenna test engineers are faced with testing increasingly
RF Measurements You Didn't Know Your Oscilloscope Could Make
 RF Measurements You Didn't Know Your Oscilloscope Could Make January 21, 2015 Brad Frieden Product Manager Keysight Technologies Agenda RF Measurements using an oscilloscope (30 min) When to use an Oscilloscope
Agilent PSA Series Spectrum Analyzers Self-Guided Demonstration for Spectrum Analysis
 Agilent PSA Series Spectrum Analyzers Self-Guided Demonstration for Spectrum Analysis Product Note This demonstration guide will help you gain familiarity with the basic functions and important features
 HF Receiver Testing: Issues & Advances (also presented at APDXC 2014, Osaka, Japan, November 2014) Adam Farson VA7OJ Copyright 2014 North Shore Amateur Radio Club NSARC HF Operators HF RX Testing 1 HF
Efficiently simulating a direct-conversion I-Q modulator
 Efficiently simulating a direct-conversion I-Q modulator Andy Howard Applications Engineer Agilent Eesof EDA Overview An I-Q or vector modulator is a commonly used integrated circuit in communication systems.
Bridging the Gap between System & Circuit Designers
 Bridging the Gap between System & Circuit Designers October 27, 2004 Presented by: Kal Kalbasi Q & A Marc Petersen Copyright 2003 Agilent Technologies, Inc. The Gap System Communication System Design System
GA GHz. Digital Spectrum Analyzer
 Digital Spectrum Analyzer GA4063 3GHz Professional Performance Robust Measurement features High frequency stability Easy- to-use User Interface Compact size, Light weight, Portable design www.attenelectronics.com
TRANSCOM Manufacturing & Education
 www.transcomwireless.com 1 G6 Vector Signal Generator Overview G6 Vector Signal Generator is a high performance vector signal generator. It can generate arbitrary wave signal, continuous wave signal, common
Agenda. Spectrum Analyzer Basics
 Agenda Overview: What is spectrum analysis? What measurements do we make? Theory of Operation: Spectrum analyzer hardware Specifications: Which are important and why? Features Making the analyzer more
Digital Spectrum Analyzer GA40XX Series
 GA4062/GA4032 9kHz~1.5GHz GA4033/GA4063 9kHz~3GHz GA4064 9kHz~7.5GHz Product Overview GA40XX series is a small size, light weight, cost-effective portable spectrum analyzer to meet your all the RF application
Agilent ESA-L Series Spectrum Analyzers
 Agilent ESA-L Series Spectrum Analyzers Data Sheet Available frequency ranges E4403B E4408B 9 khz to 1.5 GHz 9 khz to 3.0 GHz 9 khz to 26.5 GHz As the lowest cost ESA option, these basic analyzers are
Some Aspects Regarding the Measurement of the Adjacent Channel Interference for Frequency Hopping Radio Systems
 Some Aspects Regarding the Measurement of the Adjacent Channel Interference for Frequency Hopping Radio Systems PAUL BECHET, RADU MITRAN, IULIAN BOULEANU, MIRCEA BORA Communications and Information Systems
Keysight Technologies N9320B RF Spectrum Analyzer
 Keysight Technologies N9320B RF Spectrum Analyzer 9 khz to 3.0 GHz Data Sheet Definitions and Conditions The spectrum analyzer will meet its specifications when: It is within its calibration cycle It has