Understanding Probability of Intercept for Intermittent Signals
|
|
|
- Brooke Little
- 6 years ago
- Views:
Transcription


1 2013 Understanding Probability of Intercept for Intermittent Signals Richard Overdorf & Rob Bordow Agilent Technologies
2 Agenda Use Cases and Signals Time domain vs. Frequency Domain Probability of Intercept Real-Time Spectrum Analysis Windowing and Amplitude Windowing vs. Sample Rate Display and Analyze Agilent RTSA Review 2
3 Finding Dynamic and/or Transient Events Where this is becoming more important: Intermittent spurious emissions (restrictions, SIGINT ) Agile communications Modern radar Jamming Switching Modes Components or subsystems 3
4 Time vs. Frequency Domain Time Domain: When Simple to understand Relationship to other events Peak power Repetition Instrumentation Widest bandwidth (higher SR) Triggering Capture Phase and amplitude Frequency Domain What Decompose crowded spectrum Understand the type of signals Frequency relationships Dynamic frequencies Instrumentation Higher frequency Better dynamic range Scalar or vector analysis Vector is narrow band (analysis) 4
5 Probability of Intercept GOAL: Find an event that is of a specified duration (or longer) The next level: Detection Accuracy Power Every event? 5
6 The Swept Analysis Mode A swept LO w/ an assigned RBW. Covers much wider span. Good for events that are stable in the freq domain. Magnitude ONLY, no phase information (scalar info). Captures only events that occur at right time and right frequency point. Data (info) loss when LO is not there. Lost Information Lost Information Lost Information Swept LO Freq Time 6
7 IQ Analyzer (Basic) Mode Complex Spectrum and Waveform Measurements A parked LO w/ a given IF BW Collects IQ data over an interval of time. Performs FFT for timefreq-domain conversion Captures both magnitude and phase information (vector info). Data is collected in bursts with data loss between acquisitions. Lost Information Analysis BW Parked LO Freq Meas Time or FFT Window Length Meas Time or FFT Window Length Time 7
8 What is Real-Time Analysis? In this context it means the following things: Gap free no dead time between acquisitions; all sampled data is processed; process is continuous Consistent speed all hardware implementation of FFT spectrum generation not subject to Windows task interruptions High speed measurements many thousands of FFT generated spectrums per second, vastly exceeding software FFT speed High speed displays - combine large numbers of measurements to form responsive, insight-producing displays 8

9 Real Time Spectrum Analysis A parked LO w/ a given IF BW Collects IQ data over an interval of time. Data is corrected and FFT d in parallel Vector information is lost Advanced displays for large amounts of FFT s Parked LO Freq Acquisition or slice time Acquisition or slice time Real-time BW Time 9

10 Simplified block diagram of a real-time system ADC Real-time corrections and decimation Time Domain Processor Overlap Memory FFT Engine Power vs Time trace memory Display trace memory Display trace memory Frequency Mask Trigger Display processor 10
11 The FFT At first glance Window Window Samples 11
")
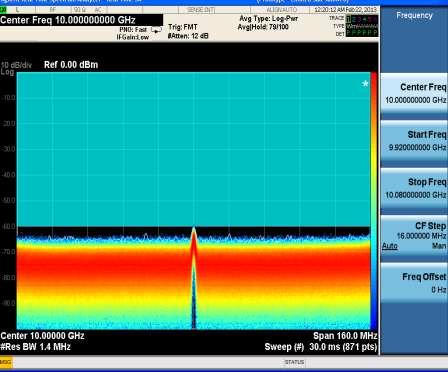
12 Specifications for POI Target: Never miss a signal get it 100% of the time Amplitude reading equivalent to CW signal Trigger on the event using frequency mask trigger (FMT) 12


13 Windowing Basics Off bin vs. on-bin On-bin: even number of wavelengths in FFT Off-bin: uneven number of wavelengths in the FFT Degraded SNR, Inaccurate representation of the signal, Poor visual representation FFT size Larger the FFT the narrower RBW Lower noise floor Better Resolution 13
14 Windowing Variations Rectangular Does not attenuate signal Poor representation of off-bin signals SNR degradation Other windows Kaiser, Blackmann-Harris, Hanning Much more forgiving for where signal lands in FFT More attenuation of the signals as you get further away from the center 14

15 Windowing Understanding Choices Rectangular Blackmann-Harris Hanning Kaiser Flat-top 15
16 Signals that are shorter than the FFT Signal shorter than 1 FFT Signal amplitude will not be accurate Function of what percentage the signal is on for FFT length Amplitude reported is a function of the area under the curve (window) Signal On 16
 Example 1 Assume ¼ of the window and right in the middle Middle of window (blue) Example 2 Assume ¼ of the window and starting at the very right side")
17 Signals that are shorter than the FFT Use cases Examples Sample rate 200 MHz, 1024 pt. FFT Full amplitude accuracy (5.12 us) Example 1 Assume ¼ of the window and right in the middle Middle of window (blue) Example 2 Assume ¼ of the window and starting at the very right side Example 1: db Example 2: db 17
18 Effect of Sample Rate Sample rate changes time scale t Same number of points in FFT but they come faster Same signal (t is the same) Top signal represents a slow sample rate Bottom signal represents a faster sample rate samples t Time samples 18
19 Effect of Overlap FFT clock running faster than the sample rate The larger the difference the more the overlap P = (1024*(Fclk Fs)/Fclk). Samp Rate (MHz) Span (MHz) Overlap (points) Duration for 1024 Window (usec) Duration for 512 Window (usec) Duration for 256 Window (usec) Duration for 128 Window (usec) Duration for 64 Window (usec) Duration for 32 Window (usec) * * 6.82 * * 8.53 * * 13.6 * 8.52 * * 23.9 * 13.6 * 8.52 *

20 Effect of Overlap For full amplitude accuracy the signal must stay on for almost 2 FFT s 1024 point window Center of window is spaced 1024 samples apart Signal must last point window Signal must last FFT size is still
: N = (32 + 1024-341 - 1) = 714 ; Tmin = 714 / 200 (MHz) = 3.")
21 Effect of Overlap The number of samples (N) the signal must last for amplitude accuracy equal to a CW signal is: N = (Window Size P - 1) To calculate the minimum duration a signal would need to be for full amplitude accuracy: Tmin = N / Fs Example (32 pt window 341 pt FFT overlap): N = ( ) = 714 ; Tmin = 714 / 200 (MHz) = 3.57 us Example (1024 pt window 341 pt FFT/window overlap): N = ( ) = 1706 ; Tmin = 1706 / 200 (MHz) = 8.53 us 21

22 Detection Using FMT 22
23 Signals with Amplitudes Greater than the Threshold Goal: Calculate what duration is required if the signal is 40 db above the mask (using 200 MHz SR) Worst case: signal at 854 ( ) The sum of the coefficients must reach 0.01 times the sum of all the coefficients must total; (20log(0.01)) = -40 db Window Rectangular: 11 samples Blackman Harris: 65 samples 23
24 Overlap Lowering the sample rate Lowering the sample rate from 200 MHz to 100 MHz yields twice as many points (682 total) Summing the coefficients to reach 0.01 times the sum of all the coefficients. Blackman Harris window: 100 MHz: 8 samples 200 MHz: 65 samples It takes twice as long to take the samples (5 ns vs. 10 ns) but takes the required signals down from 325 ns to 80 ns. 24
25 Overlap and SR 100% POI Spec vs. Offset for 1024 pt. Blackman-Harris Window Samp Rate (MHz) Span (MHz) Overlap (points) Duration 0 db offset (usec) Duration 6 db offset (usec) Duration for 12 db offset (usec) Duration for 20 db offset (usec) Duration for 40 db offset (usec) Duration for 60 db offset (usec) * 3.42 * 2.44 * 1.58 * 0.325* 0.035* * 3.42 * 2.12 * 1.04 * 0.120* 0.013* * 3.48 * 1.76 * 0.71 * 0.080* 0.010* * 4.66 * 2.22 * 0.88 * 0.100* 0.020* * 8.36 * 4.00 * 1.64 * 0.240* 0.040* 25
26 When Detection is All That is Needed 100% POI Spec vs. Offset for 1024 pt. Rectangular Window Samp Rate (MHz) Span (MHz) Overlap (points) Duration 0 db offset (usec) Duration 6 db offset (usec) Duration for 12 db offset (usec) Duration for 20 db offset (usec) Duration for 40 db offset (usec) Duration for 60 db offset (usec) * 3.42 * 1.29 * 0.515* 0.055* 0.010* * 3.42 * 1.71 * 0.69 * 0.073* 0.013* * 5.13 * 2.57 * 1.03 * 0.110* 0.020* * * 5.14 * 2.06 * 0.220* 0.040* * * * 4.12 * 0.440* 0.080* 26

27 Repetitive Pulses Consistently viewing smaller signals Input signal: Constant successive pulse stream Device Analyzers FFT: Smallest window 1024 pts 32 pt window Zero padding 27
28 Repetitive Pulses Understanding the use case Overlaying input with analyzer FFT. Can not be synchronized! Must be long enough string to eventually line-up! 28


29 Real-Time Displays Video Example Video Example Video Example Video Example 29


30 Frequency Mask Trigger (FMT) Build Mask from trace and add offsets if required Edit table or use mouse to drag the mask points to the desired location Various criteria for Trigger: Enter, Leave, Inside, Outside, Enter Leave, Leave Enter Upper, Lower or Both masks available Import or Export masks as required FMT Combined with 89600B VSA software for further analysis Video Example 30
 Correlation techniques are easier to accomplish Visualize data in multiple domains Typically more measurements Cataloged for reference Trade-offs:")
31 Using Post Processing for Deeper Analysis Advantages Mix and match FFT size and window size Use 99.99% overlap (view signal sample by sample) Correlation techniques are easier to accomplish Visualize data in multiple domains Typically more measurements Cataloged for reference Trade-offs: Acquisition limited Longer analysis time Using FMT More efficient capture Easier implementation 31

32 Performance X-Series Signal Analyzer Portfolio Oct B VSA software Premier signal analysis & troubleshooting Sep 06 PXA X-Series Drive your Evolution 3 Hz to 50 GHz Oct 09 CXA X-Series Master the Essentials 9 khz to 26.5 GHz Sep 07 EXA X-Series Balance the Challenges 10 Hz to 44 GHz Price MXA X-Series Accelerate in Wireless 10 Hz to 26.5 GHz MXE CISPR Compliant EMI Receiver 32
33 PXA with Real-Time Specifications Feature Frequency Range Sweep Real Time Analysis Bandwidth Gap Free FFT Processing rate ADC Resolution A/D Converter Sample Rate Min signal duration for 100% Probability of intercept (with full Amp Accy) Min detectable signal duration (StM > 60dB) 3Hz to 3.6/8.4/13.6/26.5/44/50GHz Swept & FFT 85MHz / 160MHz 292, FFT/s 14 bit 400 Msa/s (200MHz complex) 3.57ms >5ns (nominal) Window Length RBW range Filter Type 6 RBW selections per span Gaussian, Flattop, Blackman-Harris, Rectangular, Hanning, Kaiser 33
 provide the lowest noise floor, delivering significantly better performance")
34 Dynamic Range Lowest noise floor -157dBm/Hz at 10 GHz (radar & EW) PXA offers up to 75dB SFDR across 160 MHz bandwidth PXA s performance and low-noise path (LNP) provide the lowest noise floor, delivering significantly better performance 34


35 Using Software for Post Analysis VSA software, MATLAB, and SystemVue Using FMT to identify & immediately capture I/Q data for deeper analysis in VSA software Multiple displays such as phase or frequency vs. time Demodulation of >70 modulation types 35
36 Use FMT on PXA with 89600B VSA for Deeper Analysis Analysis Feature PXA +Real + Time + VSA Spectrum (Magnitude - Lin/Log) Power vs. Time (Lin/Log) Spectrogram, density, persistence (spectrum only) Spectrum (Complex - Lin/Log/Phase/Re/Im/Polar) Waveform (Complex - Lin/Log/Phase/Re/Im/Polar) AM / FM / PM demod (vs. time or vs. freq) Flexible Vector demod (2FSK thru 1024QAM) Standards-based demod: 2G, 3G, 4G, WLAN, etc. Time-Gating PDF, CCDF, PSD, AutoCorr, User Math, etc. Spectrogram, density, persistence (for any result) Waveform capture, playback, download, export. 36

37 Drive your Evolution with PXA Signal Analyzer Real-time Spectrum Analysis with the N9030A PXA Widest BW and Dynamic Range Scan 160MHz Real Time BW and up to 75dB Spur Free Dynamic Range Frequency Mask Trigger Combine FMT and low noise floor to detect signals as short as 3.57ms with 100% POI Analysis of Complex signals Seamless integration with VSA software Retain Full Swept-Tuned Performance Eliminate the need for dedicated instrument and upgrade existing PXA s 37
38 2013 Thank you! Know you ve got it
Real-Time Spectrum Analysis (RTSA) -Triggering, and Signal Capture/Playback for Agile and Elusive Signals. Keysight Technologies
 -Triggering, and Signal Capture/Playback for Agile and Elusive Signals. Keysight Technologies") Real-Time Spectrum Analysis (RTSA) -Triggering, and Signal Capture/Playback for Agile and Elusive Signals Keysight Technologies A brief history of Keysight Technologies 1939 1998: Hewlett-Packard years
Real-Time Spectrum Analysis (RTSA) -Triggering, and Signal Capture/Playback for Agile and Elusive Signals Keysight Technologies A brief history of Keysight Technologies 1939 1998: Hewlett-Packard years
Analyze Agile or Elusive Signals Using Real-Time Measurement and Triggering Ben Zarlingo, Agilent Technologies Inc.
 Analyze Agile or Elusive Signals Using Real-Time Measurement and Triggering Ben Zarlingo, Agilent Technologies Inc. This Webcast Agile & Elusive Signals Discovering Signals vs. Troubleshooting, Optimizing
Keysight Technologies Understanding and Applying Probability of Intercept in Real-time Spectrum Analysis. Application Note
 Keysight Technologies Understanding and Applying Probability of Intercept in Real-time Spectrum Analysis Application Note Introduction As today s wireless signals become more complex, the process of analyzing
Utilizzo del Time Domain per misure EMI
 Utilizzo del Time Domain per misure EMI Roberto Sacchi Measurement Expert Manager - Europe 7 Giugno 2017 Compliance EMI receiver requirements (CISPR 16-1-1 ) range 9 khz - 18 GHz: A normal +/- 2 db absolute
Analyze Agile or Elusive Signals Using Real-time Measurement and Triggering. Aerospace & Defense Symposium 2013 Agilent Technologies
 Analyze Agile or Elusive Signals Using Real-time Measurement and Triggering This Presentation Agile & Elusive Signals Discovering Signals vs. Troubleshooting, Optimizing Case Studies Dynamic signal environment-ism
RF Fundamentals Part 2 Spectral Analysis
 Spectral Analysis Dec 8, 2016 Kevin Nguyen Keysight Technologies Agenda Overview Theory of Operation Traditional Spectrum Analyzers Modern Signal Analyzers Specifications Features Wrap-up Page 2 Overview
Keysight Technologies Real-Time Spectrum Analyzer (RTSA) X-Series Signal Analyzers N9040B/N9030A/N9020A-RT1 & -RT2. Technical Overview
 X-Series Signal Analyzers N9040B/N9030A/N9020A-RT1 & -RT2. Technical Overview") Keysight Technologies Real-Time Spectrum Analyzer (RTSA) X-Series Signal Analyzers N9040B/N9030A/N9020A-RT1 & -RT2 Technical Overview Features Detect signals as short as 3.33 ns with 100% POI Scan with
Keysight Technologies Real-Time Spectrum Analyzer (RTSA) X-Series Signal Analyzers N9040B/N9030A/N9020A-RT1 & -RT2 Technical Overview Features Detect signals as short as 3.33 ns with 100% POI Scan with
Understanding New Pulse-analysis Techniques
 Understanding New Pulse-analysis Techniques Giuseppe Savoia Keysight Technologies Aerospace Defense Symposium Agenda Concept for Radar/Pulse signal analysis AD Symposium Page 2 Vector signal analyzers
EMC Training. Ing Angelo Cereser Mobile:
 EMC Training Ing Angelo Cereser angelo.cereser@microlease.com Mobile: 335 57 88 293 Dott Mirko Bombelli mirko.bombelli@microlease.com Mobile: 335 12 36 792 Agenda Introduzione alle misure EMI Terminologia;
Techniques for Characterizing Spurious Signals
 Techniques for Characterizing Spurious Signals October 21, 2014 Riadh Said Product Manager Microwave and Communications Division Keysight Technologies Our Goals today Review the sweep time equation to
Keysight Technologies N9051B Pulse Measurement Software X-Series Signal Analyzers. Technical Overview
 Keysight Technologies N9051B Pulse Measurement Software X-Series Signal Analyzers Technical Overview 02 Keysight N9051B Pulse Measurement Software X-Series Signal Analyzers - Technical Overview Features
Appnote - Realtime Spectrum Analyzer vs Spectrum Analyzer
 Appnote - Realtime Spectrum Analyzer vs Spectrum Analyzer Today the RF industry has to face more and more the open question, how to transport the data from my test device (DUT) to different receiver spots
RF Measurements You Didn't Know Your Oscilloscope Could Make
 RF Measurements You Didn't Know Your Oscilloscope Could Make January 21, 2015 Brad Frieden Product Manager Keysight Technologies Agenda RF Measurements using an oscilloscope (30 min) When to use an Oscilloscope
Advances in RF and Microwave Measurement Technology
 1 Advances in RF and Microwave Measurement Technology Chi Xu Certified LabVIEW Architect Certified TestStand Architect New Demands in Modern RF and Microwave Test In semiconductor and wireless, technologies
Multi-Signal, Multi-Format Analysis With Agilent VSA Software
 Multi-Signal, Multi-Format Analysis With Agilent 89600 VSA Software Ken Voelker Agilent Technologies Inc. April 2012 1 April, 25 2012 Agenda Introduction: New Measurement Challenges Multi-Measurements
Understanding Spectrum Analysis
 Understanding Spectrum Analysis Swept, FFT, and RTSA principles E & T Team September 2017 Operation principles of SPA architectures Agenda Part I Chasing dynamic and transient signals Probability of intercept
GET10B Radar Measurement Basics- Spectrum Analysis of Pulsed Signals. Copyright 2001 Agilent Technologies, Inc.
 GET10B Radar Measurement Basics- Spectrum Analysis of Pulsed Signals Copyright 2001 Agilent Technologies, Inc. Agenda: Power Measurements Module #1: Introduction Module #2: Power Measurements Module #3:
Understanding RF and Microwave Analysis Basics
 Understanding RF and Microwave Analysis Basics Kimberly Cassacia Product Line Brand Manager Keysight Technologies Agenda µw Analysis Basics Page 2 RF Signal Analyzer Overview & Basic Settings Overview
8 Hints for Better Spectrum Analysis. Application Note
 8 Hints for Better Spectrum Analysis Application Note 1286-1 The Spectrum Analyzer The spectrum analyzer, like an oscilloscope, is a basic tool used for observing signals. Where the oscilloscope provides
Advances in RF and Microwave Measurement Technology
 1 Advances in RF and Microwave Measurement Technology Rejwan Ali Marketing Engineer NI Africa and Oceania New Demands in Modern RF and Microwave Test In semiconductor and wireless, technologies such as
EMI Test Receivers: Past, Present and Future
 EM Test Receivers: Past, Present and Future Andy Coombes EMC Product Manager Rohde & Schwarz UK Ltd 9 th November 2016 ntroduction ı Andy Coombes EMC Product Manager ı 20 years experience in the field
Successful Modulation Analysis in 3 Steps. Ben Zarlingo Application Specialist Agilent Technologies Inc. January 22, 2014
 Successful Modulation Analysis in 3 Steps Ben Zarlingo Application Specialist Agilent Technologies Inc. January 22, 2014 Agilent Technologies, Inc. 2014 This Presentation Focus on Design, Validation, Troubleshooting
PXIe Contents SPECIFICATIONS. 14 GHz and 26.5 GHz Vector Signal Analyzer
 SPECIFICATIONS PXIe-5668 14 GHz and 26.5 GHz Vector Signal Analyzer These specifications apply to the PXIe-5668 (14 GHz) Vector Signal Analyzer and the PXIe-5668 (26.5 GHz) Vector Signal Analyzer with
8 Hints for Better Spectrum Analysis. Application Note
 8 Hints for Better Spectrum Analysis Application Note 1286-1 The Spectrum Analyzer The spectrum analyzer, like an oscilloscope, is a basic tool used for observing signals. Where the oscilloscope provides
Advanced RF Measurements You Didn t Know Your Oscilloscope Could Make. Brad Frieden Philip Gresock
 Advanced RF Measurements You Didn t Know Your Oscilloscope Could Make Brad Frieden Philip Gresock Agenda RF measurement challenges Oscilloscope platform overview Typical RF characteristics Bandwidth vs.
Keysight X-Series Signal Analyzers
 Keysight X-Series Signal Analyzers This manual provides documentation for the following Analyzers: PXA Signal Analyzer N9030A MXA Signal Analyzer N9020A Notice: This document contains references to Agilent.
Keysight Technologies Pulse Analysis X-Series Measurement App, Multi-Touch
 Keysight Technologies Pulse Analysis X-Series Measurement App, Multi-Touch N9067C Technical Overview Automatically synchronize to pulse modulated signals for radar and electronic warfare (EW) applications
3250 Series Spectrum Analyzer
 The most important thing we build is trust ADVANCED ELECTRONIC SOLUTIONS AVIATION SERVICES COMMUNICATIONS AND CONNECTIVITY MISSION SYSTEMS 3250 Series Spectrum Analyzer > Agenda Introduction
Understanding Low Phase Noise Signals. Presented by: Riadh Said Agilent Technologies, Inc.
 Understanding Low Phase Noise Signals Presented by: Riadh Said Agilent Technologies, Inc. Introduction Instabilities in the frequency or phase of a signal are caused by a number of different effects. Each
22 Marzo 2012 IFEMA, Madrid spain.ni.com/nidays.
 22 Marzo 2012 IFEMA, Madrid spain.ni.com/nidays www.infoplc.net The Art of Benchmarking Speed PXI Versus Rack-and-Stack Test Equipment Filippo Persia Systems Engineer Automated Test Mediterranean Region
2015 Interference 101. Robin Jackman Application Engineer
 2015 Interference 101 Robin Jackman Application Engineer Agenda What is Interference Introduction Definitions Spectrum Analyzer Concepts Concepts, Controls, Displays Making good measurements Measuring
TETRA Tx Test Solution
 Product Introduction TETRA Tx Test Solution Signal Analyzer Reference Specifications ETSI EN 300 394-1 V3.3.1(2015-04) / Part1: Radio ETSI TS 100 392-2 V3.6.1(2013-05) / Part2: Air Interface May. 2016
Introduction: The FFT emission measurement method
 Introduction: The FFT emission measurement method Tim Williams Elmac Services C o n s u l t a n c y a n d t r a i n i n g i n e l e c t r o m a g n e t i c c o m p a t i b i l i t y Wareham, Dorset, UK
Measurement of Digital Transmission Systems Operating under Section March 23, 2005
 Measurement of Digital Transmission Systems Operating under Section 15.247 March 23, 2005 Section 15.403(f) Digital Modulation Digital modulation is required for Digital Transmission Systems (DTS). Digital
DFS (Dynamic Frequency Selection) Introduction and Test Solution
 Introduction and Test Solution") DFS (Dynamic Frequency Selection) Introduction Sept. 2015 Present by Brian Chi Brian-tn_chi@keysight.com Keysight Technologies Agenda Introduction to DFS DFS Radar Profiles Definition DFS test procedure
DFS (Dynamic Frequency Selection) Introduction Sept. 2015 Present by Brian Chi Brian-tn_chi@keysight.com Keysight Technologies Agenda Introduction to DFS DFS Radar Profiles Definition DFS test procedure
Keysight X-Series Signal Analyzers
 Keysight X-Series Signal Analyzers This manual provides documentation for the following Analyzer: N9040B UXA Signal Analyzer UXA Specification Guide (Comprehensive Reference Data) Notices Keysight Technologies,
Pulsed S-Parameter Measurements using the ZVA network Analyzer
 Pulsed S-Parameter Measurements using the ZVA network Analyzer 1 Pulse Profile measurements ZVA Advanced Network Analyser 3 Motivation for Pulsed Measurements Typical Applications Avoid destruction of
Advances in RF and Microwave Measurement Technology
 1 Advances in RF and Microwave Measurement Technology Farris Alhorr Business Development Manager RF & Wireless Communication Farris.alhorr@ New Demands in Modern RF and Microwave Test In semiconductor
Agilent Vector Signal Analysis Basics. Application Note
 Agilent Vector Signal Analysis Basics Application Note Table of Contents Vector signal Analysis 3 VSA measurement advantages 4 VSA measurement concepts and theory of operation 6 Data windowing leakage
Keysight Technologies New Pulse Analysis Techniques for Radar and EW. Application Note
 Keysight Technologies New Pulse Analysis Techniques for Radar and EW Application Note Introduction Pulsed signals are widespread in radar and other EW applications, and they must be accurately measured
Federal Communications Commission Office of Engineering and Technology Laboratory Division
 April 9, 2013 Federal Communications Commission Office of Engineering and Technology Laboratory Division Guidance for Performing Compliance Measurements on Digital Transmission Systems (DTS) Operating
Testing Upstream and Downstream DOCSIS 3.1 Devices
 Testing Upstream and Downstream DOCSIS 3.1 Devices April 2015 Steve Hall DOCSIS 3.1 Business Development Manager Agenda 1. Decoding and demodulating a real downstream DOCSIS 3.1 signal and reporting key
Addressing the Challenges of Wideband Radar Signal Generation and Analysis. Marco Vivarelli Digital Sales Specialist
 Addressing the Challenges of Wideband Radar Signal Generation and Analysis Marco Vivarelli Digital Sales Specialist Agenda Challenges of Wideband Signal Generation Challenges of Wideband Signal Analysis
Reconfigurable 6 GHz Vector Signal Transceiver with I/Q Interface
 SPECIFICATIONS PXIe-5645 Reconfigurable 6 GHz Vector Signal Transceiver with I/Q Interface Contents Definitions...2 Conditions... 3 Frequency...4 Frequency Settling Time... 4 Internal Frequency Reference...
Essential Capabilities of EMI Receivers. Application Note
 Essential Capabilities of EMI Receivers Application Note Contents Introduction... 3 CISPR 16-1-1 Compliance... 3 MIL-STD-461 Compliance... 4 Important features not required by CISPR 16-1-1 or MIL-STD-461...
Keysight Technologies X-Series Signal Analyzers
 Keysight Technologies X-Series Signal Analyzers Make an Inspired Connection Engineering is all about connecting ideas and solving problems. This experience drives the X-Series signal analyzers: they are
Keysight Technologies Essential Capabilities of EMI Receivers. Application Note
 Keysight Technologies Essential Capabilities of EMI Receivers Application Note Contents Introduction... 3 CISPR 16-1-1 Compliance... 3 MIL-STD-461 Compliance... 4 Important features not required by CISPR
PXI LTE FDD and LTE TDD Measurement Suites Data Sheet
 PXI LTE FDD and LTE TDD Measurement Suites Data Sheet The most important thing we build is trust A production ready ATE solution for RF alignment and performance verification UE Tx output power Transmit
Real-Time Spectrum Analyzers RSA3408A
 Features & Benefits Trigger Tektronix Exclusive Frequency Mask Trigger Makes Easy Event-based Capture of Transient RF Signals by Triggering on Any Change in the Frequency Domain Capture All Input Signals
Agilent Back to Basics. Spectrum Analysis Back to Basics. Presented by: Michel Joussemet
 Agilent Back to Basics Spectrum Analysis Back to Basics Presented by: Michel Joussemet Aerospace and Defense Symposium 2007 EuMw 2007 Agilent Workshop Agenda Introduction Overview: What is Signal Analysis?
Debugging EMI Using a Digital Oscilloscope. Dave Rishavy Product Manager - Oscilloscopes
 Debugging EMI Using a Digital Oscilloscope Dave Rishavy Product Manager - Oscilloscopes 06/2009 Nov 2010 Fundamentals Scope Seminar of DSOs Signal Fidelity 1 1 1 Debugging EMI Using a Digital Oscilloscope
Keysight Technologies Measuring Radar Signals with Vector Signal Analyzers and Wideband Instruments
 Keysight Technologies Measuring Radar Signals with Vector Signal Analyzers and Wideband Instruments Application Note Part 4 02 Keysight Measuring Radar Signals with Vector Signal Analyzers and Wideband
Keysight X-Series Signal Analyzers
 Keysight X-Series Signal Analyzers This manual provides documentation for the following Analyzer: N9010B EXA Signal Analyzer EXA Specification Guide (Comprehensive Reference Data) Notices Keysight Technologies,
Pulsed VNA Measurements:
 Pulsed VNA Measurements: The Need to Null! January 21, 2004 presented by: Loren Betts Copyright 2004 Agilent Technologies, Inc. Agenda Pulsed RF Devices Pulsed Signal Domains VNA Spectral Nulling Measurement
Agilent X-Series Signal Analyzer
 Agilent X-Series Signal Analyzer This manual provides documentation for the following X-Series Analyzer: MXA Signal Analyzer N9020A Specifications Guide Agilent Technologies Notices Agilent Technologies,
PN9000 PULSED CARRIER MEASUREMENTS
 The specialist of Phase noise Measurements PN9000 PULSED CARRIER MEASUREMENTS Carrier frequency: 2.7 GHz - PRF: 5 khz Duty cycle: 1% Page 1 / 12 Introduction When measuring a pulse modulated signal the
Limitations And Accuracies Of Time And Frequency Domain Analysis Of Physical Layer Devices
 Limitations And Accuracies Of Time And Frequency Domain Analysis Of Physical Layer Devices Outline Short Overview Fundamental Differences between TDR & Instruments Calibration & Normalization Measurement
Agilent X-Series Signal Analyzer
 Agilent X-Series Signal Analyzer This manual provides documentation for the following X-Series Analyzer: EXA Signal Analyzer N9010A Specifications Guide Agilent Technologies Notices Agilent Technologies,
TRANSCOM Manufacturing & Education
 www.transcomwireless.com 1 G6 Vector Signal Generator Overview G6 Vector Signal Generator is a high performance vector signal generator. It can generate arbitrary wave signal, continuous wave signal, common
RSA5000. Series. Real-time Spectrum Analyzer RIGOL TECHNOLOGIES, INC.
 RSA5000 Series Real-time Spectrum Analyzer Ultra-Real technology Frequency: up to 6.5 GHz Displayed average noise level (DANL):
WSA5000. Real-Time Spectrum Analyzer (RTSA) 100 khz to 8 GHz / 18 GHz / 27 GHz. Product Brochure and Technical Datasheet Preliminary.
 100 khz to 8 GHz / 18 GHz / 27 GHz. Product Brochure and Technical Datasheet Preliminary.") Product Brochure and Technical Datasheet WSA5000 Real-Time Spectrum Analyzer (RTSA) 100 khz to 8 GHz / 18 GHz / 27 GHz Featuring Real-Time Bandwidth (RTBW) up to 100 MHz Probability of Intercept (POI)
Product Brochure and Technical Datasheet WSA5000 Real-Time Spectrum Analyzer (RTSA) 100 khz to 8 GHz / 18 GHz / 27 GHz Featuring Real-Time Bandwidth (RTBW) up to 100 MHz Probability of Intercept (POI)
Spectrum Analyzers Datasheet RSA5000 Series
 Spectrum Analyzers Datasheet RSA5000 Series Key features The RSA5000 Series replaces conventional high-performance signal analyzers, offering the measurement confidence and functionality you demand for
Advanced Radar Analysis
 Tools for Measuring Modern Radars APPLICATION NOTE Table of Contents Introduction..................................3 Pulse Generation Equipment Selection.............4 Pulse Measurement Equipment Selection...........5
Integration of Measurement Equipment in a Matlab Environment for the Example of Radar Chirps
 Integration of Measurement Equipment in a Matlab Environment for the Example of Radar Chirps Špiro Moškov RF and Wireless Application Engineer Agilent Technologies Page 1 Agenda Signal creation and instrument
CLOUDSDR RFSPACE #CONNECTED SOFTWARE DEFINED RADIO. final design might vary without notice
 CLOUDSDR #CONNECTED SOFTWARE DEFINED RADIO final design might vary without notice 1 - PRELIMINARY SPECIFICATIONS http://www.rfspace.com v0.1 RFSPACE CloudSDR CLOUDSDR INTRODUCTION The RFSPACE CloudSDR
Analog Arts SG985 SG884 SG834 SG814 Product Specifications [1]
![Analog Arts SG985 SG884 SG834 SG814 Product Specifications [1]](/thumbs/94/122371203.jpg "Analog Arts SG985 SG884 SG834 SG814 Product Specifications [1]") www.analogarts.com Analog Arts SG985 SG884 SG834 SG814 Product Specifications [1] 1. These models include: an oscilloscope, a spectrum analyzer, a data recorder, a frequency & phase meter, and an arbitrary
www.analogarts.com Analog Arts SG985 SG884 SG834 SG814 Product Specifications [1] 1. These models include: an oscilloscope, a spectrum analyzer, a data recorder, a frequency & phase meter, and an arbitrary
Introduction. In the frequency domain, complex signals are separated into their frequency components, and the level at each frequency is displayed
 SPECTRUM ANALYZER Introduction A spectrum analyzer measures the amplitude of an input signal versus frequency within the full frequency range of the instrument The spectrum analyzer is to the frequency
Measuring Frequency Settling Time for Synthesizers and Transmitters
 Products: FSE Measuring Frequency Settling Time for Synthesizers and Transmitters An FSE Spectrum Analyser equipped with the Vector Signal Analysis option (FSE-B7) can measure oscillator settling time
Introducing the Keysight RF PXIe Vector Signal Analyzer & Generator M9391A & M9381A. Updated: August 2015
 Introducing the Keysight RF PXIe Vector Signal Analyzer & Generator M9391A & M9381A Updated: August 2015 Agenda Page 2 M9391A PXIe vector signal generator M9381A PXIe vector signal analyzer M9380A PXIe
Real-Time Spectrum Analyzers RSA3303A RSA3308 WCA230A WCA280A
 Trigger, Capture, Analyze Radar, 3G or Other Time-varying RF Signals Get Fast Resolution to Complex Problems with Trigger, Capture and Analysis Tools See the frequency and amplitude of your RF signal change
RSA5000 Series. Real-time Spectrum Analyzer RIGOL TECHNOLOGIES, INC.
 RSA5000 Series Real-time Spectrum Analyzer Ultra-Real technology Frequency: up to 6.5 GHz Displayed average noise level (DANL):
Addressing the Challenges of Wideband Radar and SatCom Measurements
 2011 Agilent RF/uW Symposium Addressing the Challenges of Wideband Radar and SatCom Measurements Presented by: Giuseppe Savoia, Agilent Technologies Agenda Applications requiring broadband uw test equipment
Analog Arts SL987 SL957 SL937 SL917 Product Specifications [1]
![Analog Arts SL987 SL957 SL937 SL917 Product Specifications [1]](/thumbs/95/126095980.jpg "Analog Arts SL987 SL957 SL937 SL917 Product Specifications [1]") www.analogarts.com Analog Arts SL987 SL957 SL937 SL917 Product Specifications [1] 1. These models include: an oscilloscope, a spectrum analyzer, a data recorder, a frequency & phase meter, an arbitrary
www.analogarts.com Analog Arts SL987 SL957 SL937 SL917 Product Specifications [1] 1. These models include: an oscilloscope, a spectrum analyzer, a data recorder, a frequency & phase meter, an arbitrary
GSM Transmitter Modulation Quality Measurement Option
 Performs all required measurements for GSM transmitters Outputs multiple time mask parameters for process control analysis Obtains frequency error, rms phase error, and peak phase error with one command
From Digital to RF Debugging in the Time and Frequency Domain. Embedded Systems Conference 2015 May 6-7, 2015
 From Digital to RF Debugging in the Time and Frequency Domain Embedded Systems Conference 2015 May 6-7, 2015 Agenda In this seminar we ll discuss ı The challenges of debugging mixed domain embedded systems
Measuring Agile Signals and Dynamic Signal Environments. Application Note
 Measuring Agile Signals and Dynamic Signal Environments Application Note Table of Contents Introduction...3 Two Case Studies: Highlighting Tools and Techniques...4 Case Study #1: An Agile Radar Signal...4
Interference Analysis and Spectrum Monitor Seminar
 Interference Analysis and Spectrum Monitor Seminar Handheld RF & Microwave Instruments Andrew Benn Business Development Manager Agilent Technologies Wednesday 12 th October 2011 1 Agilent Technologies,
Agilent CSA Spectrum Analyzer
 Agilent CSA Spectrum Analyzer N1996A Exceptional performance... anytime, anywhere Frequency coverage Frequency range: 100 khz to 3 or 6 GHz Signal source: 10 MHz to 3 or 6 GHz Preamplifier to 3 or 6 GHz
Vector Signal Analyzer
 NI PXIe-5663, NI PXIe-5663E 10 MHz to 6.6 GHz frequency range 50 MHz instantaneous bandwidth (3 db) ±0.35 db typical flatness within 20 MHz bandwidth ±0.65 db typical amplitude accuracy
Analog Arts SF900 SF650 SF610 Product Specifications
 www.analogarts.com Analog Arts SF900 SF650 SF610 Product Specifications Analog Arts reserves the right to change, modify, add or delete portions of any one of its specifications at any time, without prior
PGT313 Digital Communication Technology. Lab 3. Quadrature Phase Shift Keying (QPSK) and 8-Phase Shift Keying (8-PSK)
 and 8-Phase Shift Keying (8-PSK)") PGT313 Digital Communication Technology Lab 3 Quadrature Phase Shift Keying (QPSK) and 8-Phase Shift Keying (8-PSK) Objectives i) To study the digitally modulated quadrature phase shift keying (QPSK) and
PGT313 Digital Communication Technology Lab 3 Quadrature Phase Shift Keying (QPSK) and 8-Phase Shift Keying (8-PSK) Objectives i) To study the digitally modulated quadrature phase shift keying (QPSK) and
Signal Detection with EM1 Receivers
 Signal Detection with EM1 Receivers Werner Schaefer Hewlett-Packard Company Santa Rosa Systems Division 1400 Fountaingrove Parkway Santa Rosa, CA 95403-1799, USA Abstract - Certain EM1 receiver settings,
Analog Arts SF990 SF880 SF830 Product Specifications
 1 www.analogarts.com Analog Arts SF990 SF880 SF830 Product Specifications Analog Arts reserves the right to change, modify, add or delete portions of any one of its specifications at any time, without
Keysight Technologies 89601B/BN-BHP FMCW Radar Analysis VSA Software
 Keysight Technologies 89601B/BN-BHP FMCW Radar Analysis 89600 VSA Software Technical Overview Analyze Frequency Modulated Continuous Wave (FMCW) radar signals used in automotive radar, industrial, surveillance,
Dive deep into interference analysis
 Dive deep into interference analysis Dive deep into interference analysis Contents 1. Introducing Narda Outstanding features 2. Basics IDA 2 3. IDA 2 presentation How IDA 2 is used: 1) Detect 2) Analyze
Time Matters How Power Meters Measure Fast Signals
 Time Matters How Power Meters Measure Fast Signals By Wolfgang Damm, Product Management Director, Wireless Telecom Group Power Measurements Modern wireless and cable transmission technologies, as well
Keysight Technologies PNA-X Series Microwave Network Analyzers
 Keysight Technologies PNA-X Series Microwave Network Analyzers Active-Device Characterization in Pulsed Operation Using the PNA-X Application Note Introduction Vector network analyzers (VNA) are the common
Antenna Measurements using Modulated Signals
 Antenna Measurements using Modulated Signals Roger Dygert MI Technologies, 1125 Satellite Boulevard, Suite 100 Suwanee, GA 30024-4629 Abstract Antenna test engineers are faced with testing increasingly
Timing Considerations Using FFT-based Measuring Receivers for EMI Compliance Measurements
 Timing Considerations Using FFT-based Measuring Receivers for EMI Compliance Measurements Jens Medler Rohde & Schwarz GmbH & Co. KG Abstract The use of FFT-based measuring receivers for EMI compliance
PXI WLAN Measurement Suite Data Sheet
 PXI WLAN Measurement Suite Data Sheet The most important thing we build is trust Bench-top R&D and production ready ATE RF performance verification tools Multi device parallel testing for higher production
Contents. Types 7. Export Controls 9. Definitions 11. Advantages of Swept versus Real-Time Spectrum Analyzers 13. Applications 15
 Contents Types 7 Export Controls 9 Definitions 11 Advantages of Swept versus Real-Time Spectrum Analyzers 13 Applications 15 Product Comparison Chart 19 Instrumentation Guide 21 References 41 SPONSORED
Measurement Guide and Programming Examples
 Measurement Guide and Programming Examples N9073A-1FP W-CDMA Measurement Application N9073A-2FP HSDPA/HSUPA Measurement Application For use with the Agilent N9020A MXA and N9010A EXA Signal Analyzers Manufacturing
Agilent 8360B/8360L Series Synthesized Swept Signal/CW Generators 10 MHz to 110 GHz
 Agilent 8360B/8360L Series Synthesized Swept Signal/CW Generators 10 MHz to 110 GHz ity. l i t a ers V. n isio c e r P. y t i l i ib Flex 2 Agilent 8360 Synthesized Swept Signal and CW Generator Family
S240. Real Time Spectrum Analysis Software Application. Product Brochure
 Product Brochure S240 Real Time Spectrum Analysis Software Application Featuring Clean, simple and user friendly graphical user interface (GUI) Three visualization modes Spectrogram, Persistence & Time
Spectrum Analyzer Training
 Spectrum Analyzer Training Roberto Sacchi Application Engineer roberto_sacchi@agilent.com Page 1 Agenda Introduction Overview: What is Signal Analysis? What Measurements are available? Theory of Operation
Spectrum Analyzers RSA6000 Series Datasheet
 Spectrum Analyzers RSA6000 Series Datasheet Key Features The RSA6000 Series gives you the functionality of a high-performance spectrum analyzer, wideband vector signal analyzer, and the unique trigger-capture-analyze
Contents. CALIBRATION PROCEDURE NI PXIe GHz and 14 GHz RF Vector Signal Analyzer
 CALIBRATION PROCEDURE NI PXIe-5665 3.6 GHz and 14 GHz RF Vector Signal Analyzer This document contains the verification procedures for the National Instruments PXIe-5665 (NI 5665) RF vector signal analyzer
Wide bandwidth measurements and Calibration
 Wide bandwidth measurements and Calibration Agenda Wide bandwidth measurement definitions The need for wide bandwidth measurements Types of wide bandwidth measurements Accurate measurements and system
Keysight Technologies
 Keysight Technologies Generating Signals Basic CW signal Block diagram Applications Analog Modulation Types of analog modulation Block diagram Applications Digital Modulation Overview of IQ modulation
PXI WiMAX Measurement Suite Data Sheet
 PXI WiMAX Measurement Suite Data Sheet The most important thing we build is trust Transmit power Spectral mask Occupied bandwidth EVM (all, data only, pilots only) Frequency error Gain imbalance, Skew