GIS and Remote Sensing
|
|
|
- Randall Barker
- 5 years ago
- Views:
Transcription
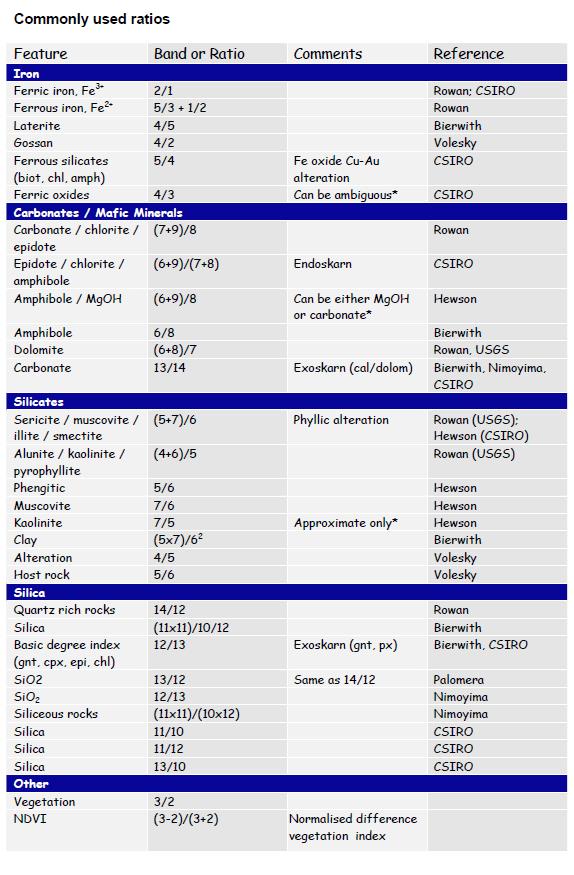
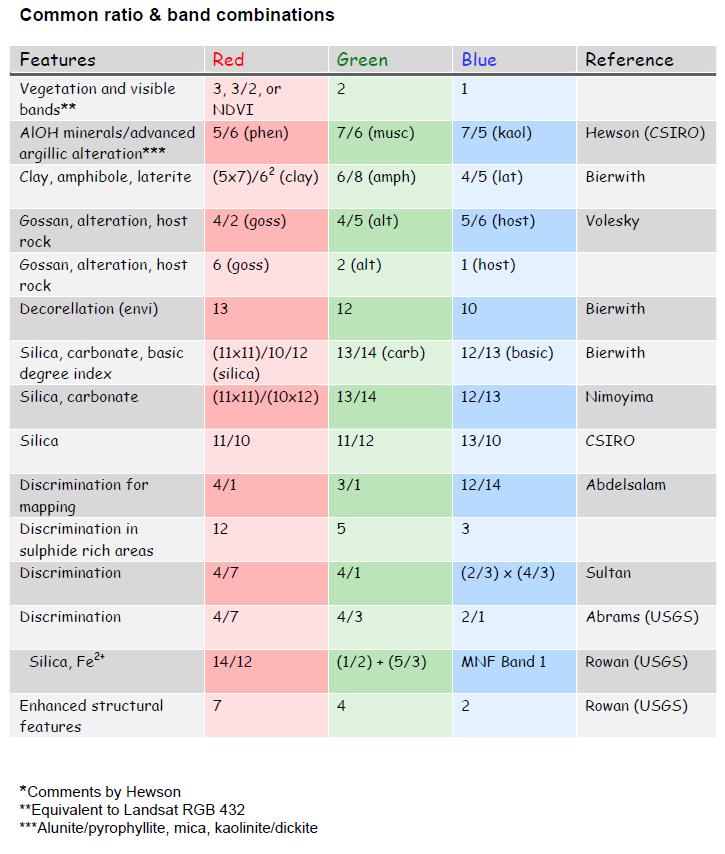
1 GE110 Fall 2008 Week 4 October 18, 2010 GIS and Remote Sensing Lab 2 LANDSAT 7 and ASTER In this lab, you will: 1. Process the LANDSAT 7 ETM+ image to emphasize the useful information a. Transformations (Optional) I. Band ratios II. Decorrelation Stretch III. PCA b. Pan-sharp image (Optional) 2. Process the ASTER image in ENVI a. Apply the georeference to L1A image b. Image stacking c. Transformaiton analysis 3. Way to save your image to Arcmap a. From Display window b. From Main Menu For LANDSAT: Band transformations: o Band transformation can reduce the effect of environment and highlight the spectral variations of minerals or your study target. The command band transformations are band ratios, Decorrelation Stretch, PCA transformation, MNF transformation etc. o The index and band ratio result can be saved as a separate file, so that you can later overlay it on top of your GIS layer. Please refer to the last section about saving your image. a. Band ratio o Click Transform/Band Ratios in the MAIN MENU to begin the band ratio function. You can process several band ratios at the same time. o The common used band ratios are listed in the handout on Monday. Please note: 1. Images (bands) need to have the same resolution before the band transformation. For example, Band 6 and band 8 cannot process with the other bands unless you resample them to the same resolution. 2. When you make the RGB image from the band ratios result and normal bands, you may
2 want to put the band ratio result in the RED color. It will stand out the target. b. Vegetation indices (optional) Click Spectral/vegetation analysis in the MAIN MENU to find the function you want to use. Please note: 1. You can also compute the vegetation index by yourself by using the Band Math function under the Basic Tools. Here are some basic vegetation indexes that you can use: NIR Red = RVI Ratio vegetation index Tucker 1979 (NIR - Red) (NIR + Red) = NDVI Normalized difference vegetation index Tucker 1979 c. PCA (Source: Click Transform/ Principal component to begin with. Click forward PC rotation -> compute new statistics and rotate. Select 6/6 Bands subset (Band 1-5 and 7). You can use different components to compose a RGB image. (ex: R/G/B = PC1/PC2/PC4) Please note: PCA is a good way to find the different rock/mineral on ground because this analysis can easily separate different surface materials/ different terrains from the image. However, these results (components) do not carry out material information directly. You need to have local information to tell what each component is related to. Pan Sharpening For the Landsat-7 image (as many other satellite image), you can use the pan-sharpening function to increase its color image resolution from 30 m to 15 m (as ASTER s resolution). If you do it, you need to decide the band combinations first. 1. To compute the Pan-Sharpening image, click the Image Sharpening under Transform in main menu, and either HSV or Color Normalized method 2. Select Input of color band from Available Bands list 3. Choose the Band Combination that you want to use in RGB band. 4. For the High resolution Input file, choose the Landsat-7 Band Change the resampling method to Bilinear and click the choose to define the output file path and file name. 6. Open the pan-sharpening image in the New Display 7. The image sharpening result might show different color with your original image. To match the color, we can use the Histogram matching under the Enhance function in your display toolbar. NOTE: This function will match the histogram between two

3 display, so you need to have at least two display images to use this function. For ASTER: 1. ASTER image has more band selection than LANDSAT image. However, the processing step is different than LANDSAT image. 2. If you need to order the ASTER image for your research propose, it might be a better choice to order L1B image since the processing is easier than L1A image. However, some software may ask L1A image as the input file format, so ask expert before ordering the image. 3. To open the ASTER data, open.hdf file in your computer. Apply the georeference to L1A image 1. It is not easy to directly read L1A image into ArcMap because its geometry haven t apply to the image itself. (You can directly read L1B image into ArcMap, but it is not easy to process the image under the ArcMap, and its location may away from the location it should be) 2. To apply the georeference to L1A image, click Basic Tools / Preprocessing / Data- Specific Utilities/ ASTER / Georeference Data 3. Because ASTER has three different resolutions, so we need to do it separately to process whole bands in a single image. First, we chose the VINR bands (the first one, 3/3 Bands) as input file. 4. Keep the projection as the UTM, and change the Datum to WGS 84 (you can also use
4 North America 1983), click ok. 5. Define the output filename in Registration Parameters window, and click ok to start the processing. 6. Repeat these steps for SWIR (the third one, 6/6 Bands) and TIR bands (The last one, 5/5 Bands). 7. After these processes, you should see three new files in the available bands list. Comparing with the original L1A data, These files has the geo information with in the image. If you want to do the band transformations, you need to stack these three file together! Otherwise you can stop here and display/save your image. Please note: you cannot orthorectify your image after georeference it. So if you want to orthorectify your data, do orthorectify instead of georeference. Image stacking 1. The propose of stack image is to resample these image to the same resolutions, also it will put all of the image under the same file, so it will be easier to do furthermore analyses such as band transformations. 2. To stack these layers together, click Basic Tools / Layer Stacking 3. Click import file to add these georeferenced files (3 files) into the list. Change the Pixel Size to 15m, and define the output file name, click Okay to start processing. 4. After processing, you should get a file in your band list that contains the entire bands from your original ASTER L1A image. Now you can start to do band combinations, band transformations Transformaiton analysis The transformation process is almost the same as LANDSAT image. Here are some common used band ratios and band combinations for ASTER image. (Source: ASTER mineral index Processing Manual, complied by Aleks Kalinowski and Simon Oliver, Geoscience Australia) You can download the PDF manual on the internet:
5
6
7 Way to save your image to ArcMap 1. There are two ways to save your image to the ArcMap for your project. You can either save it from the Display window, or from the Main Menu. 2. Tiff/Geotiff is a common format that you can use to import the image to ArcMap. 3. If you save your band combinations from display windows, you will preserve the image histogram but may lost the original data information 4. If you save your band combinations from Main Menu, you will need to adjust image color again in ArcMap, but you will preserve the original data information. 5. There is no best way to do it but depends on your need. If you want to do image profiling in ArcMap, you will need to original image information. If you need to display the color of image, it may be a good idea to save the adjusted image histogram.
Remote Sensing Instruction Laboratory
 Laboratory Session 217513 Geographic Information System and Remote Sensing - 1 - Remote Sensing Instruction Laboratory Assist.Prof.Dr. Weerakaset Suanpaga Department of Civil Engineering, Faculty of Engineering
IMAGE ANALYSIS TOOLBOX AND ENHANCED SATELLITE IMAGERY INTEGRATED INTO THE MAPPLACE By Ward E. Kilby 1, Karl Kliparchuk 2 and Andrew McIntosh 2
 IMAGE ANALYSIS TOOLBOX AND ENHANCED SATELLITE IMAGERY INTEGRATED INTO THE MAPPLACE By Ward E. Kilby 1, Karl Kliparchuk 2 and Andrew McIntosh 2 KEYWORDS: MapPlace, Landsat, ASTER, Image Analysis, Structural
Remote Sensing 4113 Lab 08: Filtering and Principal Components Mar. 28, 2018
 Remote Sensing 4113 Lab 08: Filtering and Principal Components Mar. 28, 2018 In this lab we will explore Filtering and Principal Components analysis. We will again use the Aster data of the Como Bluffs
Lesson 3: Working with Landsat Data
 Lesson 3: Working with Landsat Data Lesson Description The Landsat Program is the longest-running and most extensive collection of satellite imagery for Earth. These datasets are global in scale, continuously
Examining ASTER Imagery with the MapPlace Image Analysis Toolbox. A Tutorial Manual
 Examining ASTER Imagery with the MapPlace Image Analysis Toolbox A Tutorial Manual By W.E. Kilby and C.E. Kilby Cal Data Ltd Geoscience BC Report 2006-3 Contribution #GBC 015 British Columbia Ministry
Lab 3: Introduction to Image Analysis with ArcGIS 10
 Lab 3: Introduction to Image Analysis with ArcGIS 10 Peter E. Price TerraView 2010 Peter E. Price All rights reserved. Revised 03/2011. Revised for Geob 373 by BK Feb 7, 2017. V9 The information contained
366 Glossary. Popular method for scale drawings in a computer similar to GIS but without the necessity for spatial referencing CEP
 366 Glossary GISci Glossary ASCII ASTER American Standard Code for Information Interchange Advanced Spaceborne Thermal Emission and Reflection Radiometer Computer Aided Design Circular Error Probability
Downloading and formatting remote sensing imagery using GLOVIS
 Downloading and formatting remote sensing imagery using GLOVIS Students will become familiarized with the characteristics of LandSat, Aerial Photos, and ASTER medium resolution imagery through the USGS
Land Remote Sensing Lab 4: Classication and Change Detection Assigned: October 15, 2017 Due: October 27, Classication
 Name: Land Remote Sensing Lab 4: Classication and Change Detection Assigned: October 15, 2017 Due: October 27, 2017 In this lab, you will generate several gures. Please sensibly name these images, save
Files Used in this Tutorial
 Burn Indices Tutorial This tutorial shows how to create various burn index images from Landsat 8 imagery, using the May 2014 San Diego County wildfires as a case study. You will learn how to perform the
Comprehensive Application on Extraction of Mineral Alteration and Mapping from ETM+ Sensors and ASTER Sensors Data in Ethiopia
 Sensors & Transducers 2013 by IFSA http://www.sensorsportal.com Comprehensive Application on Extraction of Mineral Alteration and Mapping from ETM+ Sensors and ASTER Sensors Data in Ethiopia 1 Ming Tao,
Satellite image classification
 Satellite image classification EG2234 Earth Observation Image Classification Exercise 29 November & 6 December 2007 Introduction to the practical This practical, which runs over two weeks, is concerned
Image Fusion. Pan Sharpening. Pan Sharpening. Pan Sharpening: ENVI. Multi-spectral and PAN. Magsud Mehdiyev Geoinfomatics Center, AIT
 1 Image Fusion Sensor Merging Magsud Mehdiyev Geoinfomatics Center, AIT Image Fusion is a combination of two or more different images to form a new image by using certain algorithms. ( Pohl et al 1998)
LAB 2: Sampling & aliasing; quantization & false contouring
 CEE 615: Digital Image Processing Spring 2016 1 LAB 2: Sampling & aliasing; quantization & false contouring A. SAMPLING: Observe the effects of the sampling interval near the resolution limit. The goal
Lab 1 Introduction to ENVI
 Remote sensing for agricultural applications: principles and methods (2013-2014) Instructor: Prof. Tao Cheng (tcheng@njau.edu.cn) Nanjing Agricultural University Lab 1 Introduction to ENVI April 1 st,
8th ESA ADVANCED TRAINING COURSE ON LAND REMOTE SENSING
 Urban Mapping Practical Sebastian van der Linden, Akpona Okujeni, Franz Schug Humboldt Universität zu Berlin Instructions for practical Summary The Urban Mapping Practical introduces students to the work
LANDSAT-SPOT DIGITAL IMAGES INTEGRATION USING GEOSTATISTICAL COSIMULATION TECHNIQUES
 LANDSAT-SPOT DIGITAL IMAGES INTEGRATION USING GEOSTATISTICAL COSIMULATION TECHNIQUES J. Delgado a,*, A. Soares b, J. Carvalho b a Cartographical, Geodetical and Photogrammetric Engineering Dept., University
Application of GIS to Fast Track Planning and Monitoring of Development Agenda
 Application of GIS to Fast Track Planning and Monitoring of Development Agenda Radiometric, Atmospheric & Geometric Preprocessing of Optical Remote Sensing 13 17 June 2018 Outline 1. Why pre-process remotely
Lab 3: Image Enhancements I 65 pts Due > Canvas by 10pm
 Geo 448/548 Spring 2016 Lab 3: Image Enhancements I 65 pts Due > Canvas by 3/11 @ 10pm For this lab, you will learn different ways to calculate spectral vegetation indices (SVIs). These are one category
Software requirements * : Part I: 1 hr. Part III: 2 hrs.
 Title: Product Type: Developer: Target audience: Format: Software requirements * : Data: Estimated time to complete: Using MODIS to Analyze the Seasonal Growing Cycle of Crops Part I: Understand and locate
Planet Labs Inc 2017 Page 2
 SKYSAT IMAGERY PRODUCT SPECIFICATION: ORTHO SCENE LAST UPDATED JUNE 2017 SALES@PLANET.COM PLANET.COM Disclaimer This document is designed as a general guideline for customers interested in acquiring Planet
Part 1 Using GIS for Tsunami Disaster Assessment
 Tsunami_Hood_SG_June_2009 Learning Unit Student Guide Outline Name of Creator: Scott Hood Institution: Kennebec Valley Community College Email contact for more information: shood@kvcc.me.edu Title: Tsunami
v Introduction Images Import images in a variety of formats and register the images to a coordinate projection WMS Tutorials Time minutes
 v. 10.1 WMS 10.1 Tutorial Import images in a variety of formats and register the images to a coordinate projection Objectives Import various types of image files from different sources. Learn how to work
Basic Hyperspectral Analysis Tutorial
 Basic Hyperspectral Analysis Tutorial This tutorial introduces you to visualization and interactive analysis tools for working with hyperspectral data. In this tutorial, you will: Analyze spectral profiles
Remote Sensing. The following figure is grey scale display of SPOT Panchromatic without stretching.
 Remote Sensing Objectives This unit will briefly explain display of remote sensing image, geometric correction, spatial enhancement, spectral enhancement and classification of remote sensing image. At
A Little Spare Change
 A Little Spare Change Monitoring land-cover change by satellite by Introduction Problem Can city utility services use remote satellite data, processed with geographic information systems (GIS), to help
Module 11 Digital image processing
 Introduction Geo-Information Science Practical Manual Module 11 Digital image processing 11. INTRODUCTION 11-1 START THE PROGRAM ERDAS IMAGINE 11-2 PART 1: DISPLAYING AN IMAGE DATA FILE 11-3 Display of
Geomatica OrthoEngine Orthorectifying SPOT6 data
 Geomatica OrthoEngine Orthorectifying SPOT6 data On September 9, 2012, SPOT 6 was launched adding to the constellation of Earthimaging satellites designed to provide 1.5m high-resolution data. The architecture
Present and future of marine production in Boka Kotorska
 Present and future of marine production in Boka Kotorska First results from satellite remote sensing for the breeding areas of filter feeders in the Bay of Kotor INTRODUCTION Environmental monitoring is
Lab 6: Multispectral Image Processing Using Band Ratios
 Lab 6: Multispectral Image Processing Using Band Ratios due Dec. 11, 2017 Goals: 1. To learn about the spectral characteristics of vegetation and geologic materials. 2. To experiment with vegetation indices
Remote sensing image correction
 Remote sensing image correction Introductory readings remote sensing http://www.microimages.com/documentation/tutorials/introrse.pdf 1 Preprocessing Digital Image Processing of satellite images can be
Using Soil Productivity to Assess Agricultural Land Values in North Dakota
 Using Soil Productivity to Assess Agricultural Land Values in North Dakota STUDENT HANDOUT Overview Why is assigning a true and full value to agricultural land parcels important? Agricultural production
Application of GIS for earthquake hazard and risk assessment: Kathmandu, Nepal. Part 2: Data preparation GIS CASE STUDY
 GIS CASE STUDY Application of GIS for earthquake hazard and risk assessment: Kathmandu, Nepal Part 2: Data preparation Cees van Westen (E-mail : westen@itc.nl) Siefko Slob (E-mail: Slob@itc.nl) Lorena
ENVI Tutorial: Landsat TM and SPOT Data Fusion
 ENVI Tutorial: Landsat TM and SPOT Data Fusion Table of Contents OVERVIEW OF THIS TUTORIAL...2 DATA FUSION...3 Preparing Images...3 LONDON, UK, DATA FUSION EXAMPLE...4 Read and Display ER Mapper Images...4
" #$% ! " (!$% &') )" (* ) $'+,' (-./0 -./) 12' !$' 56 7' 8.%9'! :;<! =6 + C15+ "!D 5' )23,1 2"'1 )23,1 $/ E5! F1>' G!> '/ ! F1>' G!
 ) (* ) $'+,' (-./0 -./) 12' !$' 56 7' 8.%9'! :;<! =6 + C15+ !D 5' )23,1 2'1 )23,1 $/ E5! F1>' G!> '/ ! F1>' G!") ! " (!$% &') )" (* ) $'+,' (-./0 -./) 12' 34 34!$' 56 7' 8.%9'! :;? @'.A4!B C15+ "!D 34 )23,1 52' )23,1 2"'1 )23,1 5' )23,1 $/ E5! F1>' G!> '/ (BIL,BSQ,BIP)! F1>' G!> '/ (Raw,GIF,JPEG,TIFF)!1G
! " (!$% &') )" (* ) $'+,' (-./0 -./) 12' 34 34!$' 56 7' 8.%9'! :;? @'.A4!B C15+ "!D 34 )23,1 52' )23,1 2"'1 )23,1 5' )23,1 $/ E5! F1>' G!> '/ (BIL,BSQ,BIP)! F1>' G!> '/ (Raw,GIF,JPEG,TIFF)!1G
v WMS 10.0 Tutorial Introduction Images Read images in a variety of formats and register the images to a coordinate projection
 v. 10.0 WMS 10.0 Tutorial Read images in a variety of formats and register the images to a coordinate projection Objectives Read various types of image files from different sources. Learn how to work with
Software requirements * : Part I: 1 hr. Part III: 2 hrs.
 Title: Product Type: Developer: Target audience: Format: Software requirements * : Data: Estimated time to complete: Using MODIS to Analyze the Seasonal Growing Cycle of Crops Part I: Understand and locate
Hyperspectral Image Data
 CEE 615: Digital Image Processing Lab 11: Hyperspectral Noise p. 1 Hyperspectral Image Data Files needed for this exercise (all are standard ENVI files): Images: cup95eff.int &.hdr Spectral Library: jpl1.sli
A Digital Processing & Data Compilation Approach for Using Remotely Sensed Imagery to Identify Geological Lineaments In Hard-rock Terrains:
 A Digital Processing & Data Compilation Approach for Using Remotely Sensed Imagery to Identify Geological Lineaments In Hard-rock Terrains: An Application For Groundwater Exploration In Nicaragua Jill
MRLC 2001 IMAGE PREPROCESSING PROCEDURE
 MRLC 2001 IMAGE PREPROCESSING PROCEDURE The core dataset of the MRLC 2001 database consists of Landsat 7 ETM+ images. Image selection is based on vegetation greenness profiles defined by a multi-year normalized
TEMPORAL ANALYSIS OF MULTI EPOCH LANDSAT GEOCOVER IMAGES IN ZONGULDAK TESTFIELD
 TEMPORAL ANALYSIS OF MULTI EPOCH LANDSAT GEOCOVER IMAGES IN ZONGULDAK TESTFIELD Şahin, H. a*, Oruç, M. a, Büyüksalih, G. a a Zonguldak Karaelmas University, Zonguldak, Turkey - (sahin@karaelmas.edu.tr,
igett Cohort 2, June 2008 Learning Unit Student Guide Template Stream_Quality_Perkins_SG_February2009
 igett Cohort 2, June 2008 Learning Unit Student Guide Template Stream_Quality_Perkins_SG_February2009 Name of Creator: Reed Perkins Institution: Queens University of Charlotte Email contact for more information:
-f/d-b '') o, q&r{laniels, Advisor. 20rt. lmage Processing of Petrographic and SEM lmages. By James Gonsiewski. The Ohio State University
 o, q&r{laniels, Advisor. 20rt. lmage Processing of Petrographic and SEM lmages. By James Gonsiewski. The Ohio State University") lmage Processing of Petrographic and SEM lmages Senior Thesis Submitted in partial fulfillment of the requirements for the Bachelor of Science Degree At The Ohio State Universitv By By James Gonsiewski
lmage Processing of Petrographic and SEM lmages Senior Thesis Submitted in partial fulfillment of the requirements for the Bachelor of Science Degree At The Ohio State Universitv By By James Gonsiewski
Image interpretation and analysis
 Image interpretation and analysis Grundlagen Fernerkundung, Geo 123.1, FS 2014 Lecture 7a Rogier de Jong Michael Schaepman Why are snow, foam, and clouds white? Why are snow, foam, and clouds white? Today
GE 113 REMOTE SENSING. Topic 7. Image Enhancement
 GE 113 REMOTE SENSING Topic 7. Image Enhancement Lecturer: Engr. Jojene R. Santillan jrsantillan@carsu.edu.ph Division of Geodetic Engineering College of Engineering and Information Technology Caraga State
White Paper. Medium Resolution Images and Clutter From Landsat 7 Sources. Pierre Missud
 White Paper Medium Resolution Images and Clutter From Landsat 7 Sources Pierre Missud Medium Resolution Images and Clutter From Landsat7 Sources Page 2 of 5 Introduction Space technologies have long been
Lesson 9: Multitemporal Analysis
 Lesson 9: Multitemporal Analysis Lesson Description Multitemporal change analyses require the identification of features and measurement of their change through time. In this lesson, we will examine vegetation
Comparing of Landsat 8 and Sentinel 2A using Water Extraction Indexes over Volta River
 Journal of Geography and Geology; Vol. 10, No. 1; 2018 ISSN 1916-9779 E-ISSN 1916-9787 Published by Canadian Center of Science and Education Comparing of Landsat 8 and Sentinel 2A using Water Extraction
Background Objectives Study area Methods. Conclusions and Future Work Acknowledgements
 A DIGITAL PROCESSING AND DATA COMPILATION APPROACH FOR USING REMOTELY SENSED IMAGERY TO IDENTIFY GEOLOGICAL LINEAMENTS IN HARD-ROCK ROCK TERRAINS: AN APPLICATION FOR GROUNDWATER EXPLORATION IN NICARAGUA
Land Cover Analysis to Determine Areas of Clear-cut and Forest Cover in Olney, Montana. Geob 373 Remote Sensing. Dr Andreas Varhola, Kathry De Rego
 1 Land Cover Analysis to Determine Areas of Clear-cut and Forest Cover in Olney, Montana Geob 373 Remote Sensing Dr Andreas Varhola, Kathry De Rego Zhu an Lim (14292149) L2B 17 Apr 2016 2 Abstract Montana
Introduction to image processing for remote sensing: Practical examples
 Università degli studi di Roma Tor Vergata Corso di Telerilevamento e Diagnostica Elettromagnetica Anno accademico 2010/2011 Introduction to image processing for remote sensing: Practical examples Dr.
Image Change Tutorial
 Image Change Tutorial In this tutorial, you will use the Image Change workflow to compare two images of an area over Indonesia that was impacted by the December 26, 2004 tsunami. The first image is a before
An Introduction to Remote Sensing & GIS. Introduction
 An Introduction to Remote Sensing & GIS Introduction Remote sensing is the measurement of object properties on Earth s surface using data acquired from aircraft and satellites. It attempts to measure something
GIS Data Collection. Remote Sensing
 GIS Data Collection Remote Sensing Data Collection Remote sensing Introduction Concepts Spectral signatures Resolutions: spectral, spatial, temporal Digital image processing (classification) Other systems
TimeSync V3 User Manual. January Introduction
 TimeSync V3 User Manual January 2017 Introduction TimeSync is an application that allows researchers and managers to characterize and quantify disturbance and landscape change by facilitating plot-level
Digital Image Processing
 Digital Image Processing 1 Patrick Olomoshola, 2 Taiwo Samuel Afolayan 1,2 Surveying & Geoinformatic Department, Faculty of Environmental Sciences, Rufus Giwa Polytechnic, Owo. Nigeria Abstract: This paper
Google Earth Engine Image Pre-processing Tool: User guide
 Google Earth Engine Image Pre-processing Tool: Lukas Würsch, Kaspar Hurni, and Andreas Heinimann Centre for Development and Environment (CDE) University of Bern 2017 Introduction The image pre-processing
Blend Photos With Apply Image In Photoshop
 Blend Photos With Apply Image In Photoshop Written by Steve Patterson. In this Photoshop tutorial, we re going to learn how easy it is to blend photostogether using Photoshop s Apply Image command to give
GEOG432: Remote sensing Lab 3 Unsupervised classification
 GEOG432: Remote sensing Lab 3 Unsupervised classification Goal: This lab involves identifying land cover types by using agorithms to identify pixels with similar Digital Numbers (DN) and spectral signatures
Development of normalized vegetation, soil and water indices derived from satellite remote sensing data
 Development of normalized vegetation, soil and water indices derived from satellite remote sensing data Takeuchi, W. & Yasuoka, Y. IIS/UT, Japan E-mail: wataru@iis.u-tokyo.ac.jp Nov. 25th, 2004 ACRS2004
In late April of 1986 a nuclear accident damaged a reactor at the Chernobyl nuclear
 CHERNOBYL NUCLEAR POWER PLANT ACCIDENT Long Term Effects on Land Use Patterns Project Introduction: In late April of 1986 a nuclear accident damaged a reactor at the Chernobyl nuclear power plant in Ukraine.
ENVI Tutorial: Orthorectifying Aerial Photographs
 ENVI Tutorial: Orthorectifying Aerial Photographs Table of Contents OVERVIEW OF THIS TUTORIAL...2 ORTHORECTIFYING AERIAL PHOTOGRAPHS IN ENVI...2 Building the interior orientation...3 Building the exterior
Introduction. Mathematical Background Preparation using ENVI.
 Andrew Nordquist - @01078209 Investigating Automatic Registration and Mosaicking in ENVI 3 December 2007 Project Proposal for EES 5053 - Remote Sensing Class Introduction. Registering two images means
Improving Spatial Resolution Of Satellite Image Using Data Fusion Method
 Muhsin and Mashee Iraqi Journal of Science, December 0, Vol. 53, o. 4, Pp. 943-949 Improving Spatial Resolution Of Satellite Image Using Data Fusion Method Israa J. Muhsin & Foud,K. Mashee Remote Sensing
Destriping and Geometric Correction of an ASTER Level 1A Image
 Destriping and Geometric Correction of an ASTER Level 1A Image Rob van Ede February 2004 Utrecht University Faculty of GeoSciences Department of Physiscal Geography Supervisors: Prof. Dr. Steven de Jong
INCREASING THE DETAIL OF LAND USE CLASSIFICATION: THE IOWA 2002 LAND COVER PRODUCT INTRODUCTION
 INCREASING THE DETAIL OF LAND USE CLASSIFICATION: THE IOWA 2002 LAND COVER PRODUCT R. Peter Kollasch, Remote Sensing Analyst Iowa Geological Survey Iowa Department of Natural Resources 109 Trowbridge Hall
Exercise 4-1 Image Exploration
 Exercise 4-1 Image Exploration With this exercise, we begin an extensive exploration of remotely sensed imagery and image processing techniques. Because remotely sensed imagery is a common source of data
for Adobe Photoshop Tutorial Guide
 for Adobe Photoshop Tutorial Guide Geographic Imager 3.5 Tutorial Guide Copyright 2005 2012 Avenza Systems Inc. All rights reserved. Geographic Imager for Adobe Photoshop Tutorial Guide for Windows and
LAND SURFACE TEMPERATURE MONITORING THROUGH GIS TECHNOLOGY USING SATELLITE LANDSAT IMAGES
 Abstract LAND SURFACE TEMPERATURE MONITORING THROUGH GIS TECHNOLOGY USING SATELLITE LANDSAT IMAGES Aurelian Stelian HILA, Zoltán FERENCZ, Sorin Mihai CIMPEANU University of Agronomic Sciences and Veterinary
Image Registration Exercise ESPM 5295
 Background: We often digitize data from orthorectifed aerial photographs. These photographs have been processed to remove tilt and terrain errors to the level practical and required by the original contract.
Basic Digital Image Processing. The Structure of Digital Images. An Overview of Image Processing. Image Restoration: Line Drop-outs
 Basic Digital Image Processing A Basic Introduction to Digital Image Processing ~~~~~~~~~~ Rev. Ronald J. Wasowski, C.S.C. Associate Professor of Environmental Science University of Portland Portland,
Due Date: September 22
 Geography 309 Lab 1 Page 1 LAB 1: INTRODUCTION TO REMOTE SENSING Due Date: September 22 Objectives To familiarize yourself with: o remote sensing resources on the Internet o some remote sensing sensors
1. Start a bit about Linux
 GEOG432/632 Fall 2017 Lab 1 Display, Digital numbers and Histograms 1. Start a bit about Linux Login to the linux environment you already have in order to view this webpage Linux enables both a command
Using QuickBird Imagery in ESRI Software Products
 Using QuickBird Imagery in ESRI Software Products TABLE OF CONTENTS 1. Introduction...2 Purpose Scope Image Stretching Color Guns 2. Imagery Usage Instructions...4 ArcView 3.x...4 ArcGIS...7 i Using QuickBird
8. EDITING AND VIEWING COORDINATES, CREATING SCATTERGRAMS AND PRINCIPAL COMPONENTS ANALYSIS
 Editing and viewing coordinates, scattergrams and PCA 8. EDITING AND VIEWING COORDINATES, CREATING SCATTERGRAMS AND PRINCIPAL COMPONENTS ANALYSIS Aim: To introduce you to (i) how you can apply a geographical
Files Used in this Tutorial
 This tutorial shows how to create various burn index images from Landsat 8 imagery, using the May 2014 San Diego County wildfires as a case study. You will learn how to perform the following tasks: Create
 Table 1 Bedex Claims Data (as of March 23, 2010) Claim Name Tenure # Owner (100%) Area Expiry Date (hectares) Bedex 1 518684 B.K. Bowen* 448.8 27-Mar-10 Bedex 2 518685 B.K. Bowen 448.6 27-Mar-10 Bedex
Potential of ASTER and LANDSAT Images for Mapping Features in Western Desert
 522 Potential of ASTER and LANDSAT Images for Mapping Features in Western Desert Mahmoud El Nokrashy Osman Ali, Ibrahim Fathy Mohamed Shaker, Nasr Mohammady Saba Abstract: In Egypt, most of the topographic
Landsat 8 Pansharpen and Mosaic Geomatica 2015 Tutorial
 Landsat 8 Pansharpen and Mosaic Geomatica 2015 Tutorial On February 11, 2013, Landsat 8 was launched adding to the constellation of Earth imaging satellites. It is the seventh satellite to reach orbit
Semi-Automatic Classification Plugin Documentation
 Semi-Automatic Classification Plugin Documentation Release 5.3.2.1 Luca Congedo February 05, 2017 Contents I Introduction 1 II Plugin Installation 5 1 Installation in Windows 32 bit 9 1.1 QGIS download
EE/GP140-The Earth From Space- Winter 2008 Handout #16 Lab Exercise #3
 EE/GP140-The Earth From Space- Winter 2008 Handout #16 Lab Exercise #3 Topic 1: Color Combination. We will see how all colors can be produced by combining red, green, and blue in different proportions.
DATA FUSION AND TEXTURE-DIRECTION ANALYSES FOR URBAN STUDIES IN VIETNAM
 1 DATA FUSION AND TEXTURE-DIRECTION ANALYSES FOR URBAN STUDIES IN VIETNAM Tran Dong Binh 1, Weber Christiane 1, Serradj Aziz 1, Badariotti Dominique 2, Pham Van Cu 3 1. University of Louis Pasteur, Department
Multi-Resolution Analysis of MODIS and ASTER Satellite Data for Water Classification
 Corina Alecu, Simona Oancea National Meteorological Administration 97 Soseaua Bucuresti-Ploiesti, 013686, Sector 1, Bucharest Romania corina.alecu@meteo.inmh.ro Emily Bryant Dartmouth Flood Observatory,
29 th Annual Louisiana RS/GIS Workshop April 23, 2013 Cajundome Convention Center Lafayette, Louisiana
 Landsat Data Continuity Mission 29 th Annual Louisiana RS/GIS Workshop April 23, 2013 Cajundome Convention Center Lafayette, Louisiana http://landsat.usgs.gov/index.php# Landsat 5 Sets Guinness World Record
Evaluation of Sentinel-2 bands over the spectrum
 Evaluation of Sentinel-2 bands over the spectrum S.E. Hosseini Aria, M. Menenti, Geoscience and Remote sensing Department Delft University of Technology, Netherlands 1 outline ointroduction - Concept odata
Using Indexes to Detect the Environmental Changes of Hor Al-Dalmaj and Surrounding Areas in Central Sector of Mesopotamia Plain
 Using Indexes to Detect the Environmental Changes of Hor Al-Dalmaj and Surrounding Areas in Central Sector of Mesopotamia Plain Mousa Ahmed Remote Sensing Division, Department of Information Technology,
The techniques with ERDAS IMAGINE include:
 The techniques with ERDAS IMAGINE include: 1. Data correction - radiometric and geometric correction 2. Radiometric enhancement - enhancing images based on the values of individual pixels 3. Spatial enhancement
Remote Sensing Exam 2 Study Guide
 Remote Sensing Exam 2 Study Guide Resolution Analog to digital Instantaneous field of view (IFOV) f ( cone angle of optical system ) Everything in that area contributes to spectral response mixels Sampling
Grant Boxer Consultant Geologist March 10th 2014 (Updated Nov 2014)
") Grant Boxer Consultant Geologist March 10th 2014 (Updated Nov 2014) Work flow for Landsat 8 Landgate Data Selecting and processing basic data Importing into MapInfo Applications SLIP Portal WMS access
Grant Boxer Consultant Geologist March 10th 2014 (Updated Nov 2014) Work flow for Landsat 8 Landgate Data Selecting and processing basic data Importing into MapInfo Applications SLIP Portal WMS access
INTRODUCTION TO SNAP TOOLBOX
 INTRODUCTION TO SNAP TOOLBOX EXERCISE 1 (Exploring S2 data) Data: Sentinel-2A Level 1C: S2A_MSIL1C_20180303T170201_N0206_R069_T14QNG_20180303T221319.SAFE 1. Open file 1.1. File / Open Product 1.2. Browse
Viewing Landsat TM images with Adobe Photoshop
 Viewing Landsat TM images with Adobe Photoshop Reformatting images into GeoTIFF format Of the several formats in which Landsat TM data are available, only a few formats (primarily TIFF or GeoTIFF) can
Appendix 2: Worked example using GPS
 Appendix 2: Worked example using GPS This appendix will talk the reader through how to use a GPS, get data out of the unit and use that data in the expedition GIS. The specific example used is a simple
AUTOMATIC GENERATION OF CHANGE INFORMATION FOR MULTITEMPORAL, MULTISPECTRAL IMAGERY
 AUTOMATIC GENERATION OF CHANGE INFORMATION FOR MULTITEMPORAL, MULTISPECTRAL IMAGERY Morton J. Canty 1 and Allan A. Nielsen 2 1 Institute for Chemistry and Dynamics of the Geosphere, Forschungszentrum Jülich,
White paper brief IdahoView Imagery Services: LISA 1 Technical Report no. 2 Setup and Use Tutorial
 White paper brief IdahoView Imagery Services: LISA 1 Technical Report no. 2 Setup and Use Tutorial Keith T. Weber, GISP, GIS Director, Idaho State University, 921 S. 8th Ave., stop 8104, Pocatello, ID
Apply Colour Sequences to Enhance Filter Results. Operations. What Do I Need? Filter
 Apply Colour Sequences to Enhance Filter Results Operations What Do I Need? Filter Single band images from the SPOT and Landsat platforms can sometimes appear flat (i.e., they are low contrast images).
Geomatica OrthoEngine v10.2 Tutorial DEM Extraction of GeoEye-1 Data
 Geomatica OrthoEngine v10.2 Tutorial DEM Extraction of GeoEye-1 Data GeoEye 1, launched on September 06, 2008 is the highest resolution commercial earth imaging satellite available till date. GeoEye-1
The Landsat Legacy: Monitoring a Changing Earth. U.S. Department of the Interior U.S. Geological Survey
 The Landsat Legacy: Monitoring a Changing Earth U.S. Department of the Interior U.S. Geological Survey Tom Loveland March 17, 2001 Landsat Science Mission Change is occurring at rates unprecedented in
Satellite Imagery Characteristics, Uses and Delivery to GIS Systems. Wayne Middleton April 2014
 Satellite Imagery Characteristics, Uses and Delivery to GIS Systems Wayne Middleton April 2014 About Geoimage Founded in Brisbane 1988 Leading Independent company Specialists in satellite imagery and geospatial
Geometric Validation of Hyperion Data at Coleambally Irrigation Area
 Geometric Validation of Hyperion Data at Coleambally Irrigation Area Tim McVicar, Tom Van Niel, David Jupp CSIRO, Australia Jay Pearlman, and Pamela Barry TRW, USA Background RICE SOYBEANS The Coleambally
CRISM Data Users' Workshop Nili Fossae Data Processing Walkthrough
 CRISM Data Users' Workshop Nili Fossae Data Processing Walkthrough March 22, 2009 Frank Seelos and the CRISM Team Walkthrough / Take Home Exercise Blue Text: CAT/ENVI interface instructions Green Text: