|
|
|
- Emil Wright
- 5 years ago
- Views:
Transcription
1
2
3
4
5
6
7
8
9
10
11
12

13
14
15
16
17
18
19
20
21
22
23 Table 1 Bedex Claims Data (as of March 23, 2010) Claim Name Tenure # Owner (100%) Area Expiry Date (hectares) Bedex B.K. Bowen* Mar-10 Bedex B.K. Bowen Mar-10 Bedex B.K. Bowen Mar-10 Bedex B.K. Bowen Mar-10 Bedex B.K. Bowen Mar-10 Bedex B.K. Bowen Mar-10 Bedex B.K. Bowen Mar-10 Bedex B.K. Bowen Mar-10 Bedex B.K. Bowen Mar-10 Bedex B.K. Bowen Mar-10 Bedex B.K. Bowen Mar-10 Bedex B.K. Bowen Mar-10 Bedex B.K. Bowen Mar-10 Bedex B.K. Bowen Mar-10 Bedex B.K. Bowen Mar-10 Bedex B.K. Bowen Mar-10 Bedex B.K. Bowen Mar-10 Bedex B.K. Bowen Mar-10 * Client ID: Total Area: 6,902.80


24 ASTER ANALYSIS of the BEDEX 1-8 & Claims, British Columbia B. K. Bowen Prepared for: Prepared by: Ward E. Kilby, Pgeo. B.K. Bowen Cal Data Ltd. Surrey, Canada 18 December, 2009
25 Table of Contents INTRODUCTION...1 Summary...1 Area and Image...2 IMAGE ANALYSIS...4 Pre-analysis Processing (preprocessing)...4 Analysis...6 Natural Colour Image-...6 Masking-...6 Mineral Indices-...7 Crosta Analsyis-...8 Hyperspectral Analysis...8 SWIR SMACC-...9 Buddingtonite Evaluation...11 VNIR SMACC KML Display...18 CONCLUSIONS and RECOMENDATIONS...19 APPENDIX: Analysis results and data files...20
26 INTRODUCTION Summary Cal Data Ltd. was contracted by B.K. Bowen to acquire and analyze ASTER Multispectral imagery covering the BEDEX claim group in northern British Columbia. B.K. Bowen provided the claim descriptions and assessment report information. The required digital files were obtained through the BC government s MapPlace website. The required ASTER image was identified and downloaded from the MapPlace. In addition a search was conducted to confirm that the acquired ASTER image was the best available. Image analysis included converting the image from radiance to relative reflectance values through a process of atmospheric corrections. The image was orthorectified to the UTM Zone 9, WGS 84 projection. A variety of multispectral analysis procedures were applied to the image in an attempt to identify alteration minerals. ASTER, due to its limited number of bands, can not always provide definite mineral identifications. But in this case there were some very good examples of potentially important alteration minerals such as buddingtonite (assumed). The analysis concentrated on the BEDEX claims but some analyses were conducted over the whole ASTER image to provide a regional context. The results of the analysis are presented as image maps as well as in KML format which can be viewed with the Google Earth viewer. Some of the resultant images are provided in the appendix. During the orthorectification process a DEM is calculated from the ASTER image and is provided as a grid file. This DEM was used to generate perspective views of some analysis results. Cal Data Ltd. Dec 18, 2009 BEDEX Claim ASTER Analysis 1

27 Area and Image The BEDEX claims are located in northwestern British Columbia centred on geographic coordinate N W. The claim area is located in the south east quadrant of an ASTER image and the whole claim group is contained within the image. The whole image (approx. 60 x 60 km) was available at processed Level 1B through the MapPlace. The image information is contained in Figure 1. The claim boundaries and the outline of the ASTER image are shown in Figure 2. Figure 1. ASTER image metadata. 2 BEDEX Claims ASTER Analysis Cal Data Ltd. Dec 18, 2009
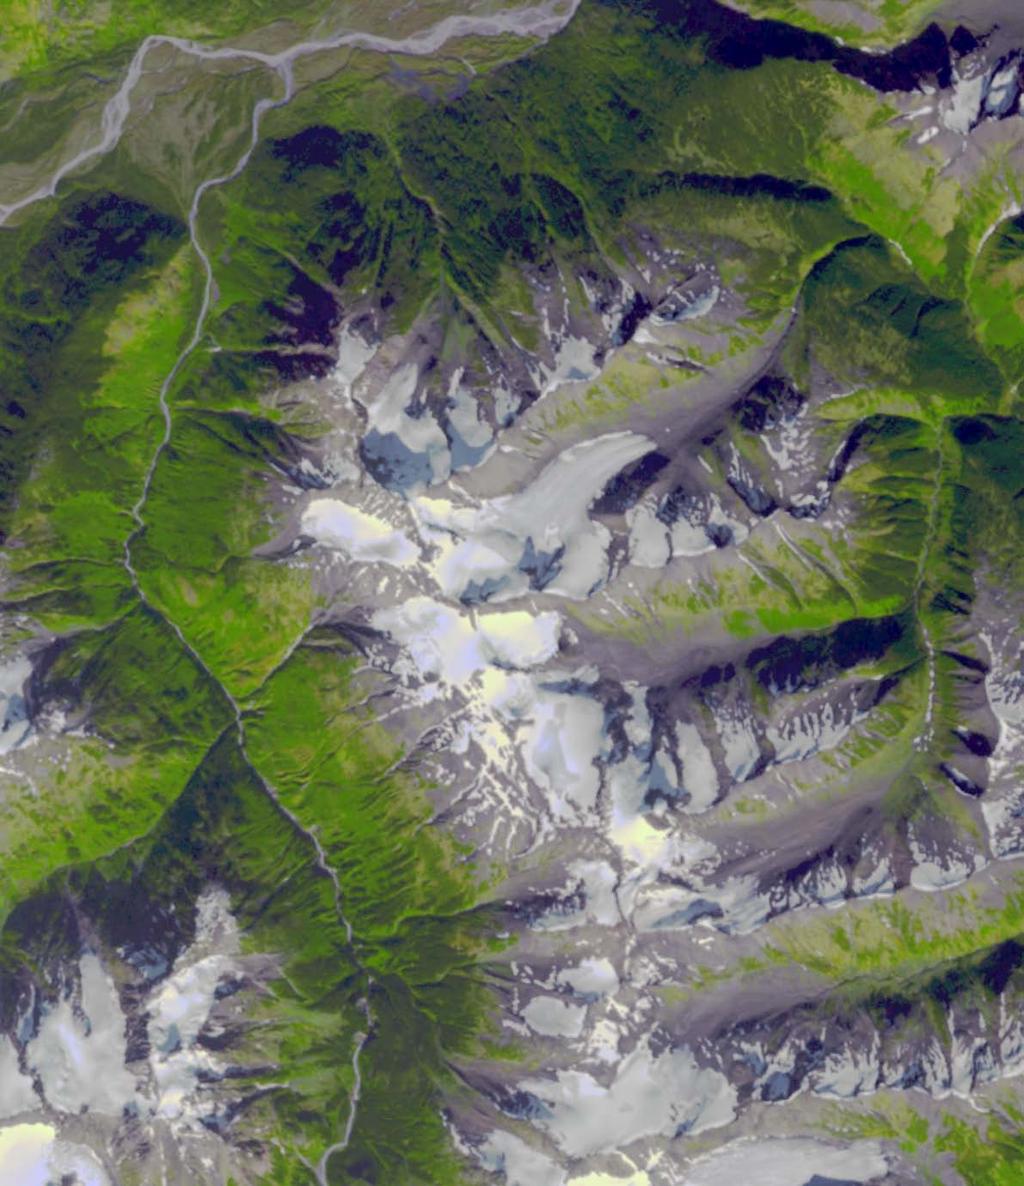
28 Figure 2. The near natural colour ASTER Image with property outline shown in red. Cal Data Ltd. Dec 18, 2009 BEDEX Claim ASTER Analysis 3
29 IMAGE ANALYSIS Pre-analysis Processing (preprocessing) Upon obtaining the raw ASTER image a number of preprocessing steps are required to transform the raw data values into relatively standard values. In the case of this study these standard values are relative reflectance. The relative reflectance spectrum of a mineral has the same shape as a true reflectance spectrum but the values may not be true. In most cases it is the shape of the spectra and the relative band values that are used in any analysis. The image pixels are also spatially adjusted to conform to the UTM map projection. Orthorectification is employed to compensate for the effects of topography in this spatial adjustment. Step 1- Cross Talk correction: due to a design flaw in the ASTER SWIR instrument there is some leakage of light between bands. This problem can be largely corrected by running a corrective routine on the raw data (CTIO.exe). Step 2- Orthorectification, gain and offset: The raw ASTER data is shipped in a format where the pixel values are simple DN (digital numbers). To convert these values to at sensor radiance specific gains and offsets must be applied. The ASTERdtm program makes these corrections at the same time that it orthorectifies the VNIR, SWIR and TIR image bands. As part of the orthorectification process a relative DEM is generated from the ASTER data to provide the basis of the orthorectification. The result of this step is orthorectified at sensor radiance data. The spatial accuracy of the orthorectification has not been evaluated but will be internally consistent and within 100 metres of true position. Step 3- Atmospheric correction was performed using specialized software called ACORN5 that compensates for the effects of atmospheric gases on the amount of light energy that penetrates and is reflected by the atmosphere. The original ASTER data is in the form of at sensor radiance which is a measure of the amount of light the satellite sensor receives from all sources. A significant amount of the light that the sensor sees is reflected from the atmosphere and never reached the ground surface. This light obviously provides no information about the ground features and should be removed. The atmosphere also absorbs or otherwise scatters some of the light reflected from the ground surface. This missing light at the sensor is calculated by knowing the incident light value and general atmospheric conditions. Water vapour has the largest effect on the ability of light to penetrate the atmosphere. The relative reflectance values obtained from this process provide a spectra shape similar to what would be obtained with a field spectrometer or in a laboratory setting. This processing is essential so that the various band measurements at a given pixel have standard relative values. Otherwise the standard ratios and band formula used to identify minerals or mineral groups would be of little value. Figure 3 contains a view of the input panel for this calculation and records the 4 BEDEX Claims ASTER Analysis Cal Data Ltd. Dec 18, 2009

30 values utilized. The elevation used was the average elevation of good rock exposure within the claim blocks. Step 4- The VNIR, SWIR and TIR bands were used during this study. These bands are collected by three different sensors on the space platform. The VNIR bands are 15 metres wide, the SWIR are 30 metres wide and the TIR are 90 metres wide. A single file, stack, is constructed to bring these two data sets together. During this process the SWIR and TIR bands are subsampled and converted to 15 metre pixels. It is this stack that is used in subsequent analysis where VNIR, SWIR and TIR bands are involved. The atmospherically corrected and orthorectified image files are available in ENVI *.BIL format in the appendix. Also included in the appendix is the digital elevation model. Figure 3. Input panel for the ACORN5 atmospheric correction process for the VNIR bands of this image. Cal Data Ltd. Dec 18, 2009 BEDEX Claim ASTER Analysis 5
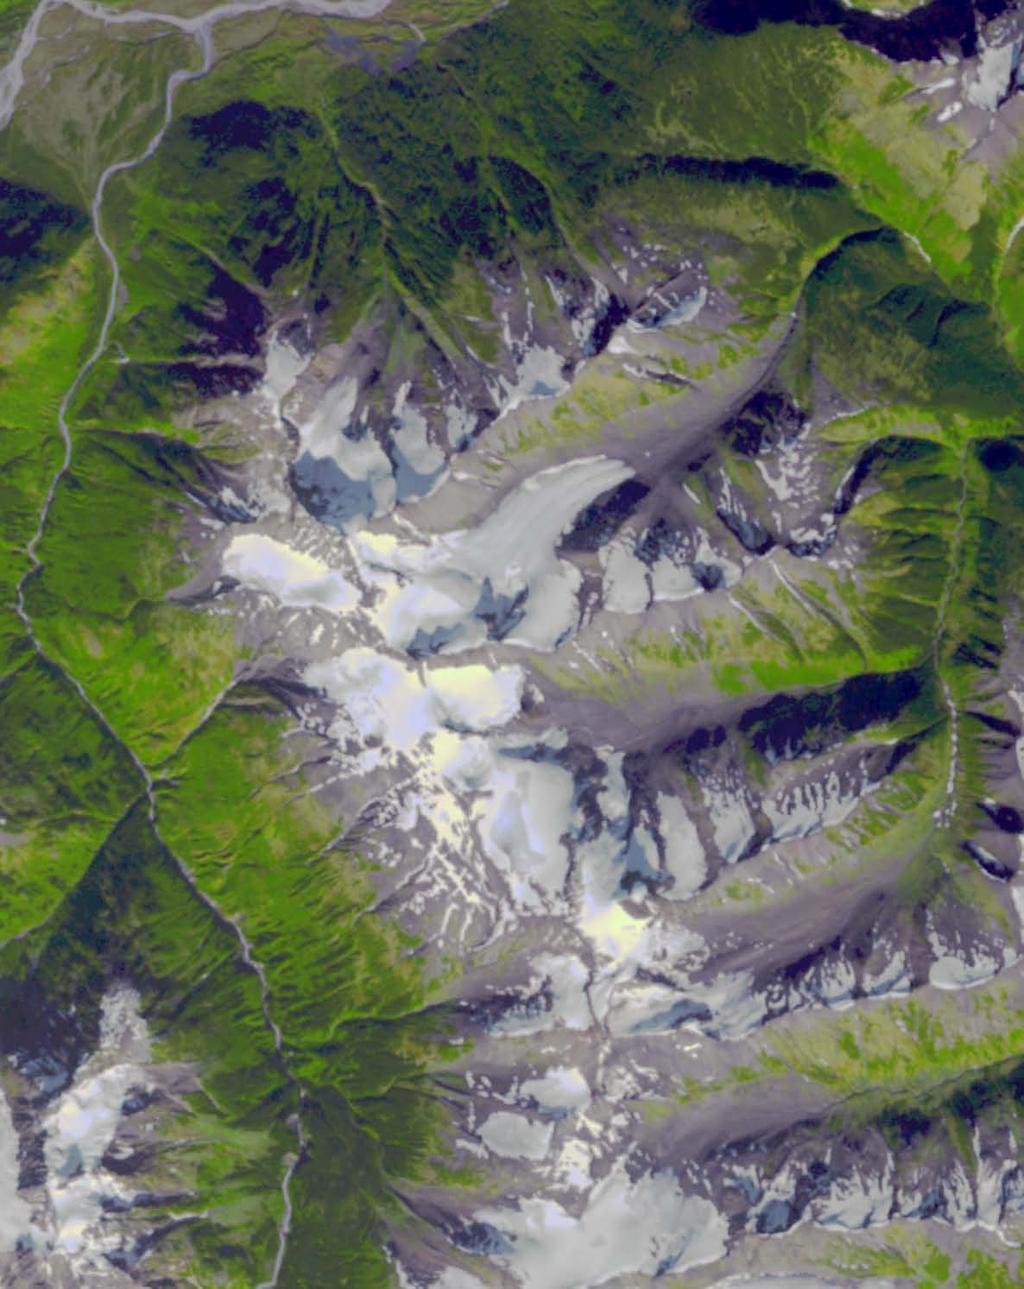
31 Analysis Natural Colour Image- The product generated from the corrected ASTER data is a near-natural colour image. ASTER does not sample the blue range of the electromagnetic spectrum so the resulting image is only an approximation to what one would see if viewing the natural scene. In this study the three VNIR bands were used to generate this view. These bands are combined in various combinations to produce the three primary colours of red, blue and green. The result is a close approximation to a natural colour scene. The image has 15 metre pixels and is available in the appendix as a GeoTiff (NaturalColourBRIGHT.TIF). Figure 2 displays the natural colour image. Masking- A small area of the whole ASTER image, encompassing the whole property, was outlined and used to construct a mask. In addition to masking out most of the ASTER image area masks were also constructed to remove vegetation, snow/ice, shadow and water so that spectral endmember identification was restricted to only rock exposures. Inclusion of pixels (spectra) unrelated to the purpose of the analysis only confuses the process. Figure 4 shows the position of the area defined by the mask relative to the whole ASTER image Figure 4. Outline of masked area is shown in red relative to the whole image. 6 BEDEX Claims ASTER Analysis Cal Data Ltd. Dec 18, 2009.
 were run for this image. This traditional multispectral analysis technique did not identify any obvious trends in claim areas.")

32 Mineral Indices- A number of ASTER band ratios and band combinations have been used by past workers in a variety of metallogenic provinces to map the distribution of potential alteration minerals in the search for economic minerals. A suite of these band combinations (28) were run for this image. This traditional multispectral analysis technique did not identify any obvious trends in claim areas. There are broad scale patterns across the whole image that may be related to geology but in general this analysis was not beneficial and was not evaluated further as other techniques provided more promising results. Figure 5. Example of a mineral ratio image. In this case band 2 over band 1, referred to as Ferric iron. The lighter areas are the highest ratio values or the closest match to the material being targeted. Cal Data Ltd. Dec 18, 2009 BEDEX Claim ASTER Analysis 7
33 Crosta Analsyis- Crosta analysis is another commonly employed technique used to examine multispectral imagery. It utilizes principal component analysis (PCA) of bands related to the mineral species being sought. This method was used in an attempt to map four mineral species; Alunite (1,3,5,7), Illite (1,3,5,6), Kaolinite+Smectite (1,4,6,9) and Kaolinite (1,4,6,7). Results of PCA are very dependent upon the area included in the analyses. A highly masked region covering the area of the claim group was used for this analysis. Examination of the results of this analysis provided some interesting trends and highlighted some interesting features but the more interesting results obtained from using hyperspectral techniques resulted in no detailed follow-up being performed on the Crosta results. If more promising results had not been obtained with other techniques this analysis method would have proven quite useful. Hyperspectral Analysis ASTER provides multispectral data but hyperspectral analysis tools can be used to examine the imagery to extract additional information to augment the multispectral analysis techniques. Spectral endmembers were extracted from the ASTER image using the SMACC (sequential maximum angle convex cone) endmember extraction procedure. The spectral endmember extraction process was performed only on the rock exposures in and around the claim group. The resulting endmembers were compared to spectra contained in the USGS spectral library as well as several of the John Hopkins University spectral libraries in an attempt to identify each spectrum. The ground location of each endmember was examined on the natural colour image to make sure the sample site was indeed on good rock exposure and not influenced by nearby snow/ice, vegetation or water. The SMACC process was conducted on the bands from the three sensors independently. The VNIR (bands 1-3) was used to identify iron minerals. The SWIR was used to look for alteration minerals such as clays (bands 4-9). The TIR (bands 10-14) is used to identify silicate minerals. The large ground sample distance (GSD) or pixel size of 90 metres will be of limited use but zones of silicification may be identified with these bands. The library spectra were collected in laboratories and the spectrum for each sample was sampled in great detail with many very narrow slices of the spectrum. ASTER on the other hand samples the spectrum over a few very broad ranges. The library spectra were resampled using the response curves for ASTER to generate ASTER spectral libraries to use in the comparison between image spectra and library spectra. Some common library spectra and their equivalent ASTER spectra are displayed in Figure 6. 8 BEDEX Claims ASTER Analysis Cal Data Ltd. Dec 18, 2009


34 Figure 6. The SWIR region spectra of selected potential alteration minerals that could be present within the claim group are shown above (from the USGS Spectral Library). Left panel contains detailed spectra and the right panel contains the spectra as seen with ASTER s 6 SWIR bands. The SMACC endmember extraction procedure identified 30 endmembers in the area immediately around the property. Examination of the endmember locations against the Natural Colour image eliminated all the spectra that were not derived from rock exposures. Many of the endmembers were from near the edge of water, ice or vegetation which would influence the spectrum and make it unreliable for consideration. Also any spectrum that was very different from any spectrum in the libraries was eliminated from further processing. SWIR SMACC- Five of the spectral endmembers identified for the SWIR bands were invalid as they sampled a part of the image edge that contained invalid values. Figure 7 illustrates the 9 endmembers that were tentatively associated with a mineral spectrum from one of the spectral libraries. Several of the endmembers were very similar and likely represented the same mineral. Table 1 contains the tentative mineral identification associated with each of the spectra in Figure 7. Cal Data Ltd. Dec 18, 2009 BEDEX Claim ASTER Analysis 9

35 Figure 9. The nine SWIR endmembers that were tentatively identified as minerals. 10 BEDEX Claims ASTER Analysis Cal Data Ltd. Dec 18, 2009
36 ENDMEMBER Endmember 6 Endmember 9 Endmember 12 Endmember 14 Endmember 16 Endmember 17 Endmember 22 Endmember 24 Endmember 29 MINERAL suspected Buddingtonite Calcite-Limestone Calcite-Limestone Dolomite Dolomite Buddingtonite Dolomite Muscovite-Illite Kaolinite-Smectite Table 1. Valid SWIR endmembers and suspected mineral identification. The possible presence of Buddingtonite in the claim area is very significant. Buddingtonite is an ammoniated feldspar that has been associated with significant gold deposits and is commonly used as a pathfinder alteration for the exploration of epithermal vein deposits. The tentative identification of such an important alteration mineral immediately shifted the focus of the analysis from trying to map some clay species to the mapping and verification of this mineral. The ASTER analysis project was limited in scope so the effort was focused on the most important finding of the study. In addition the iron staining had been recognized in the area and its mapping is addressed in the following section. Buddingtonite Evaluation The Buddingtonite (tentative) spectrum obtained from the ASTER image (Endmember 6) was compared to all the spectra contained in the USGS spectral library and Buddingtonite was the best fit. Figure 10 shows the comparisons of the Endmember 6 spectrum from the image and the two USGS library spectrum. In addition to visual comparison of the spectra a tool contained within ENVI performs a rigorous mathematical evaluation of the similarities between the library spectra and the image spectra. Figure 11 shows the results of the comparisons. The two library buddingtonite spectra are in the top twelve spectra with the best combined matching scores. A visual comparison of the ranked spectra is essential to determine if the mathematically derived rankings are the best. Figure 12 shows the visual comparisons of the image spectrum with the library matches for the top ranking choices and the two buddingtonite spectra. It is obvious that the two buddingtonite spectra are better matches than any of the other choices provided by the Spectral Analyst tool. Cal Data Ltd. Dec 18, 2009 BEDEX Claim ASTER Analysis 11

.")
37 Figure 10. Comparison on the ASTER obtained spectrum called Endmember 10 with the two Buddingtonite spectra contained in the USGS Spectral Library (resamped to ASTER band configuration). 12 BEDEX Claims ASTER Analysis Cal Data Ltd. Dec 18, 2009


38 Figure 11. Results of Spectral Analysis of Endmember 6. The top twelve USGS Spectral Library spectra matches are shown. Figure 12a. The four spectral matches with combined SAM and SFF totals better than Buddingtonite. ASTER image spectrum in red. Cal Data Ltd. Dec 18, 2009 BEDEX Claim ASTER Analysis 13


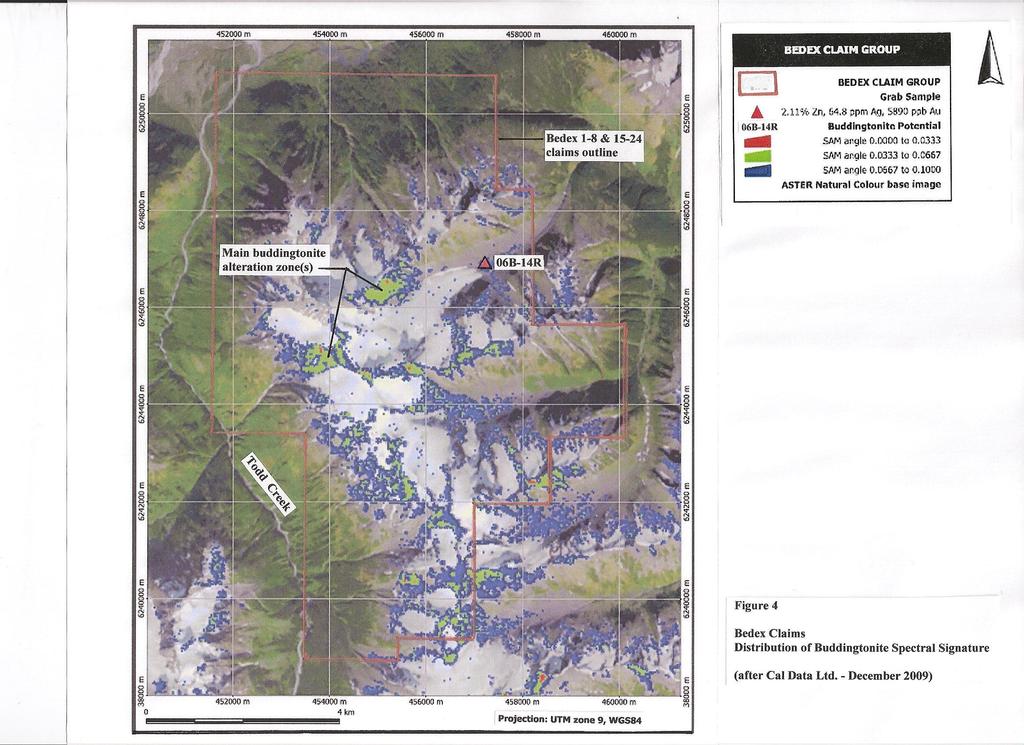
39 Figure 12b. The two Buddingtonite library spectra compared with the ASTER image spectrum. ASTER image spectrum is shown in red the library spectra in white. Figure 13 presents the distribution of this spectral feature in the claim area. The pixel dimensions in this figure are 15 metres on a side. The map presented in Figure 13 is contained in the appendix as a stand alone PDF. 14 BEDEX Claims ASTER Analysis Cal Data Ltd. Dec 18, 2009

40 Figure 13. Distribution of Buddingtonite spectral signature on the BEDEX Claim Group. Cal Data Ltd. Dec 18, 2009 BEDEX Claim ASTER Analysis 15


41 VNIR SMACC- The three ASTER bands from the VNIR portion of the electromagnetic spectrum were processed with the SMACC procedure in the area of the BEDEX Claims. The primary target of this portion of the analysis was to identify any iron bearing mineralization that could point to areas of interest. Several endmembers approximating goethite (limonite) were found though this analysis. These endmembers were not excellent matches for the goethite spectra contained in the spectral library, but on the assumption that they did represent a diluted version of the goethite spectrum one of the USGS spectra was used for the spectral mapping exercise. The spectrum labeled geothit1 Geothite WS222 was used. Figure 14 illustrates the shape of this spectrum along with the closest matches obtained from the SMACC analysis. The Geothite WS222 spectrum was used to examine the complete ASTER image and it provided a very positive area in the vicinity of the Iron Cap deposits in the Sulphurets area. This excellent match confirmed that the mapping process was providing accurate results. Within the claim area several good occurrences were identified and careful examination of the natural colour image confirmed the strong likelihood that limonitic material was present in these areas. Figure 15 illustrates the distribution of this spectrum in and around the claim area. The map is also provided in the appendix as a standalone PDF. Figure 14. Comparison of the UGSG Spectral Library spectrum for Goethite on the right and several SMACC derived endmembers from the BEDEX Claim area of the ASTER image. The identification of Goethite based on the VNIR bands is subject to including a number of other minerals so caution should be used with this distribution map. Areas with any red or green coding along with reasonably large areas of blue coding warrant investigation. 16 BEDEX Claims ASTER Analysis Cal Data Ltd. Dec 18, 2009

42 Figure 15. Distribution of the Goethite spectrum in the BEDEX Claim Group. Cal Data Ltd. Dec 18, 2009 BEDEX Claim ASTER Analysis 17
43 KML Display KML and KMZ files were created to provide the ability of the client to better visualize the results of the analysis. Two files are provided in the appendix. The A26.kml file was downloaded from the MapPlace and contains information served directly from the Ministry of Energy, Mines and Petroleum Resources website. This file was originally created by the author for a different project. The BEDEX Analysis.kmz file contains information generated during this analysis. Both files can be launched simply by double clicking on the file assuming a copy of Google Earth is available on the user s computer. No views of these files are presented in this report as the author does not currently have a commercial version of Google Earth. Any version of Google Earth can be used to view these files. There is a slight misalignment between Google Earth and the files provided in the BEDEX Analysis.kmz file. This misalignment is minor and can be adjusted by the user if desired. No attempt to make the two sets of data align was made as no accurate ground control points were available to determine which set should be adjusted. 18 BEDEX Claims ASTER Analysis Cal Data Ltd. Dec 18, 2009
44 CONCLUSIONS and RECOMENDATIONS An ASTER image that was collected on September 24, 2000 was obtained from the MapPlace ( and analyzed during this investigation. The image was corrected for cross-talk, an on-board instrument design issue, and atmospheric interference. Spatially, the image was orthorectified utilizing a DEM generated from bands 3 and 3B which provide a stereo pair. A number of multi and hyper spectral image analysis techniques were used to examine the image. The results of this processing are partially displayed in this report and the complete set of analysis results are contained in digital form in the appendix. Multispectral analysis techniques were used to investigate the image as well as hyperspectral techniques. The hyperspectral techniques provided the most detailed results and were used for the mapping of the identified mineral species. Two minerals (spectrum) were mapped across the property using SAM (Spectral Angle Mapper) procedure. What is believed to be Buddingtonite and Goethite were mapped using the SWIR and VNIR portions of the electromagnetic spectrum respectively. Buddingtonite is an ammoniated feldspar that is associated with hydrothermal systems and has been found in deposits such as Carlin. This mineral has a very distinct spectral signature and is often a target of such analysis as it indicates alteration due to fluids passing through organic rich material that are believed to have enhanced mineral mobilization capabilities. It must be remembered that these mineral identifications are based on remote sensing and have not been field verified. No absolute pronouncement of the actual minerals being mapped can be made without field verification. The occurrence of what is believed to be a large buddingtonite zone with peripheral iron bearing material up slope from a well mineralized float sample is a very positive indication that additional examination is required. Personnel communications with B.K. Bowen indicate that he has not visited any of the buddingtonite bearing areas. There are indications that similar alteration exists around the head of the cirque above the location where the mineralize float sample was collected. This whole area should be investigated. There are other locations within the claim group that contain buddingtonite and limonitic spectral signatures and these should also be investigated. This analysis was preliminary in nature and limited in scope. Only the most obvious significant spectra were mapped and described. There is potentially more information to be obtained from the ASTER image should resources and need warrant. The spatial accuracy of the ASTER derived information is suspect. It could be refined by comparison to the BC TRIM base map information. The TIR (Thermal Infrared) bands were not utilized in this analysis. These bands are useful in mapping silicate minerals. Cal Data Ltd. Dec 18, 2009 BEDEX Claim ASTER Analysis 19
45 APPENDIX: Analysis results and data files (on DVD) 1) A26_ASTER (ZIP): Original ASTER data as downloaded from MapPlace. 2) REF_STACK (ENVI IMG): A 14 band image containing the nadir spectral bands from the ASTER image. All bands are presented in 15 metre pixels and orthorectified. The VNIR and SWIR bands have been atmospherically corrected and the TIR bands have been thermally corrected. 3) DTM (GeoTIFF): Digital elevation model constructed from the ASTER image and used for the orthorectification. It is a relative rather than absolute DEM. 4) NaturalColourBRIGHT (GeoTIF): Pseudo natural colour image constructed from the ASTER image. Colours have been stretched to enhance shaded areas and rock differences. 5) NaturalColourBRIGHTmap (GeoTIF): Map of the natural colour image for the BEDEX claim area. 6) Buddingtonite (PDF): A property scale image map of the Buddingtonite distribution. 7) Geothite (PDF): A property scale image map of the Geothite distribution. 8) Natural (PDF): A property scale image map showing the natural colour image and location of mineralized float sample. 9) A26 (KML): A kml file as downloaded from the MapPlace containing BC Geological Survey data for the ASTER image area used in this study. Simply double click on the file to launch in Google Earth (GE must be present on machine). 10) BEDEX Analysis (KMZ): A kmz (zipped kml) file containing results from this analysis. Simply double click on the file to launch in Google Earth (GE must be present on machine). It can be loaded in combination with A26.kml to view all information together. 20 BEDEX Claims ASTER Analysis Cal Data Ltd. Dec 18, 2009
46
47
48
Basic Hyperspectral Analysis Tutorial
 Basic Hyperspectral Analysis Tutorial This tutorial introduces you to visualization and interactive analysis tools for working with hyperspectral data. In this tutorial, you will: Analyze spectral profiles
Examining ASTER Imagery with the MapPlace Image Analysis Toolbox. A Tutorial Manual
 Examining ASTER Imagery with the MapPlace Image Analysis Toolbox A Tutorial Manual By W.E. Kilby and C.E. Kilby Cal Data Ltd Geoscience BC Report 2006-3 Contribution #GBC 015 British Columbia Ministry
1. Theory of remote sensing and spectrum
 1. Theory of remote sensing and spectrum 7 August 2014 ONUMA Takumi Outline of Presentation Electromagnetic wave and wavelength Sensor type Spectrum Spatial resolution Spectral resolution Mineral mapping
HYPERSPECTRAL IMAGERY FOR SAFEGUARDS APPLICATIONS. International Atomic Energy Agency, Vienna, Austria
 HYPERSPECTRAL IMAGERY FOR SAFEGUARDS APPLICATIONS G. A. Borstad 1, Leslie N. Brown 1, Q.S. Bob Truong 2, R. Kelley, 3 G. Healey, 3 J.-P. Paquette, 3 K. Staenz 4, and R. Neville 4 1 Borstad Associates Ltd.,
IMAGE ANALYSIS TOOLBOX AND ENHANCED SATELLITE IMAGERY INTEGRATED INTO THE MAPPLACE By Ward E. Kilby 1, Karl Kliparchuk 2 and Andrew McIntosh 2
 IMAGE ANALYSIS TOOLBOX AND ENHANCED SATELLITE IMAGERY INTEGRATED INTO THE MAPPLACE By Ward E. Kilby 1, Karl Kliparchuk 2 and Andrew McIntosh 2 KEYWORDS: MapPlace, Landsat, ASTER, Image Analysis, Structural
Hyperspectral image processing and analysis
 Hyperspectral image processing and analysis Lecture 12 www.utsa.edu/lrsg/teaching/ees5083/l12-hyper.ppt Multi- vs. Hyper- Hyper-: Narrow bands ( 20 nm in resolution or FWHM) and continuous measurements.
Lab 6: Multispectral Image Processing Using Band Ratios
 Lab 6: Multispectral Image Processing Using Band Ratios due Dec. 11, 2017 Goals: 1. To learn about the spectral characteristics of vegetation and geologic materials. 2. To experiment with vegetation indices
Ground Truth for Calibrating Optical Imagery to Reflectance
 Visual Information Solutions Ground Truth for Calibrating Optical Imagery to Reflectance The by: Thomas Harris Whitepaper Introduction: Atmospheric Effects on Optical Imagery Remote sensing of the Earth
NEC s EO Sensors and Data Applications
 NEC s EO Sensors and Data Applications Second Singapore Space Symposium 30 September, 2015 Nanyang Technological University, Singapore Shimpei Kondo Space Technologies Department, Space System Division,
Comprehensive Application on Extraction of Mineral Alteration and Mapping from ETM+ Sensors and ASTER Sensors Data in Ethiopia
 Sensors & Transducers 2013 by IFSA http://www.sensorsportal.com Comprehensive Application on Extraction of Mineral Alteration and Mapping from ETM+ Sensors and ASTER Sensors Data in Ethiopia 1 Ming Tao,
Remote sensing image correction
 Remote sensing image correction Introductory readings remote sensing http://www.microimages.com/documentation/tutorials/introrse.pdf 1 Preprocessing Digital Image Processing of satellite images can be
Remote Sensing 4113 Lab 08: Filtering and Principal Components Mar. 28, 2018
 Remote Sensing 4113 Lab 08: Filtering and Principal Components Mar. 28, 2018 In this lab we will explore Filtering and Principal Components analysis. We will again use the Aster data of the Como Bluffs
Geology, Exploration, and WorldView-3 SWIR Kumar Navulur, PhD
 Geology, Exploration, and WorldView-3 SWIR Kumar Navulur, PhD Mt Everest Digital Elevation Model 0.5 m WorldView 2 2m False Color IR Drape DigitalGlobe Proprietary. DigitalGlobe. All rights reserved. Agenda
Textbook, Chapter 15 Textbook, Chapter 10 (only 10.6)
") AGOG 484/584/ APLN 551 Fall 2018 Concept definition Applications Instruments and platforms Techniques to process hyperspectral data A problem of mixed pixels and spectral unmixing Reading Textbook, Chapter
AGOG 484/584/ APLN 551 Fall 2018 Concept definition Applications Instruments and platforms Techniques to process hyperspectral data A problem of mixed pixels and spectral unmixing Reading Textbook, Chapter
Lesson 3: Working with Landsat Data
 Lesson 3: Working with Landsat Data Lesson Description The Landsat Program is the longest-running and most extensive collection of satellite imagery for Earth. These datasets are global in scale, continuously
ENVI Tutorial: Hyperspectral Signatures and Spectral Resolution
 ENVI Tutorial: Hyperspectral Signatures and Spectral Resolution Table of Contents OVERVIEW OF THIS TUTORIAL... 2 SPECTRAL RESOLUTION... 3 Spectral Modeling and Resolution... 4 CASE HISTORY: CUPRITE, NEVADA,
Geology/Geography 4113 Remote Sensing Lab 06: AVIRIS Spectra of Goldfield, NV March 7, 2018
 Geology/Geography 4113 Remote Sensing Lab 06: AVIRIS Spectra of Goldfield, NV March 7, 2018 We will use the image processing package ENVI to examine AVIRIS hyperspectral data of the Goldfield, NV mining
APPLICATION OF HYPERSPECTRAL REMOTE SENSING IN TARGET DETECTION AND MAPPING USING FIELDSPEC ASD IN UDAYGIRI (M.P.)
") 1 International Journal of Advance Research, IJOAR.org Volume 1, Issue 3, March 2013, Online: APPLICATION OF HYPERSPECTRAL REMOTE SENSING IN TARGET DETECTION AND MAPPING USING FIELDSPEC ASD IN UDAYGIRI
1 International Journal of Advance Research, IJOAR.org Volume 1, Issue 3, March 2013, Online: APPLICATION OF HYPERSPECTRAL REMOTE SENSING IN TARGET DETECTION AND MAPPING USING FIELDSPEC ASD IN UDAYGIRI
CanImage. (Landsat 7 Orthoimages at the 1: Scale) Standards and Specifications Edition 1.0
 Standards and Specifications Edition 1.0") CanImage (Landsat 7 Orthoimages at the 1:50 000 Scale) Standards and Specifications Edition 1.0 Centre for Topographic Information Customer Support Group 2144 King Street West, Suite 010 Sherbrooke, QC
CanImage (Landsat 7 Orthoimages at the 1:50 000 Scale) Standards and Specifications Edition 1.0 Centre for Topographic Information Customer Support Group 2144 King Street West, Suite 010 Sherbrooke, QC
CHARACTERISTICS OF REMOTELY SENSED IMAGERY. Radiometric Resolution
 CHARACTERISTICS OF REMOTELY SENSED IMAGERY Radiometric Resolution There are a number of ways in which images can differ. One set of important differences relate to the various resolutions that images express.
An Introduction to Remote Sensing & GIS. Introduction
 An Introduction to Remote Sensing & GIS Introduction Remote sensing is the measurement of object properties on Earth s surface using data acquired from aircraft and satellites. It attempts to measure something
Spotlight on Hyperspectral
 Spotlight on Hyperspectral From analyzing eelgrass beds in the Pacific Northwest to identifying pathfinder minerals for geological exploration, hyperspectral imagery and analysis is proving its worth for
Planet Labs Inc 2017 Page 2
 SKYSAT IMAGERY PRODUCT SPECIFICATION: ORTHO SCENE LAST UPDATED JUNE 2017 SALES@PLANET.COM PLANET.COM Disclaimer This document is designed as a general guideline for customers interested in acquiring Planet
Downloading and formatting remote sensing imagery using GLOVIS
 Downloading and formatting remote sensing imagery using GLOVIS Students will become familiarized with the characteristics of LandSat, Aerial Photos, and ASTER medium resolution imagery through the USGS
ASTER GDEM Readme File ASTER GDEM Version 1
 I. Introduction ASTER GDEM Readme File ASTER GDEM Version 1 The Advanced Spaceborne Thermal Emission and Reflection Radiometer (ASTER) Global Digital Elevation Model (GDEM) was developed jointly by the
Satellite monitoring of a large tailings storage facility
 ABSTRACT Satellite monitoring of a large tailings storage facility Benjamin Schmidt, Matt Malgesini Golder Associates Inc., USA Jim Turner PhotoSat Ltd, Canada Jeff Reinson Goldcorp Inc., Canada Minera
Remote Sensing for Rangeland Applications
 Remote Sensing for Rangeland Applications Jay Angerer Ecological Training June 16, 2012 Remote Sensing The term "remote sensing," first used in the United States in the 1950s by Ms. Evelyn Pruitt of the
Atmospheric interactions; Aerial Photography; Imaging systems; Intro to Spectroscopy Week #3: September 12, 2018
 GEOL 1460/2461 Ramsey Introduction/Advanced Remote Sensing Fall, 2018 Atmospheric interactions; Aerial Photography; Imaging systems; Intro to Spectroscopy Week #3: September 12, 2018 I. Quick Review from
Background Objectives Study area Methods. Conclusions and Future Work Acknowledgements
 A DIGITAL PROCESSING AND DATA COMPILATION APPROACH FOR USING REMOTELY SENSED IMAGERY TO IDENTIFY GEOLOGICAL LINEAMENTS IN HARD-ROCK ROCK TERRAINS: AN APPLICATION FOR GROUNDWATER EXPLORATION IN NICARAGUA
Hyperspectral Imagery: A New Tool For Wetlands Monitoring/Analyses
 WRP Technical Note WG-SW-2.3 ~- Hyperspectral Imagery: A New Tool For Wetlands Monitoring/Analyses PURPOSE: This technical note demribea the spectral and spatial characteristics of hyperspectral data and
GeoBase Raw Imagery Data Product Specifications. Edition
 GeoBase Raw Imagery 2005-2010 Data Product Specifications Edition 1.0 2009-10-01 Government of Canada Natural Resources Canada Centre for Topographic Information 2144 King Street West, suite 010 Sherbrooke,
Image Band Transformations
 Image Band Transformations Content Band math Band ratios Vegetation Index Tasseled Cap Transform Principal Component Analysis (PCA) Decorrelation Stretch Image Band Transformation Purposes Image band transforms
How to Access Imagery and Carry Out Remote Sensing Analysis Using Landsat Data in a Browser
 How to Access Imagery and Carry Out Remote Sensing Analysis Using Landsat Data in a Browser Including Introduction to Remote Sensing Concepts Based on: igett Remote Sensing Concept Modules and GeoTech
Trial of Digital Filter Photography for Alteration Mineral Detection in the Hachimantai Area, NE JAPAN
 Trial of Digital Filter Photography for Alteration Mineral Detection in the Area, E JAPA Trial of Digital Filter Photography for Alteration Mineral Detection in the Area, E JAPA Myint Soe a, Tateishi Ryutaro
366 Glossary. Popular method for scale drawings in a computer similar to GIS but without the necessity for spatial referencing CEP
 366 Glossary GISci Glossary ASCII ASTER American Standard Code for Information Interchange Advanced Spaceborne Thermal Emission and Reflection Radiometer Computer Aided Design Circular Error Probability
PRELIMINARY EXPERIMENT OF SIMPLE FIELD SPECTROSCOPY BY USING FILTERED COMMERCIAL DIGITAL CAMERA
 Proceedings of the 8th Asian Geothermal Symposium, December 9-10, 2008 PRELIMINARY EXPERIMENT OF SIMPLE FIELD SPECTROSCOPY BY USING FILTERED COMMERCIAL DIGITAL CAMERA Isao TAKASHIMA 1, MYINT SOE 1, Daizo
Processing Aster Data for Atmospheric Correction Geomatica 2014 Tutorial
 The Advanced Spaceborne Thermal Emission and Reflection Radiometer (ASTER) sensor is part of five sensor systems on board Terra. Terra is a satellite that was launched on December 18, 1999 at Vandenberg
Hyperspectral Image Data
 CEE 615: Digital Image Processing Lab 11: Hyperspectral Noise p. 1 Hyperspectral Image Data Files needed for this exercise (all are standard ENVI files): Images: cup95eff.int &.hdr Spectral Library: jpl1.sli
Ge111A Remote Sensing and GIS Lecture
 Ge111A Remote Sensing and GIS Lecture Remote Sensing - many different geophysical data sets. We concentrate on the following: Imagery (optical and radar) Topography Geographical Information Systems (GIS)
White Paper. Medium Resolution Images and Clutter From Landsat 7 Sources. Pierre Missud
 White Paper Medium Resolution Images and Clutter From Landsat 7 Sources Pierre Missud Medium Resolution Images and Clutter From Landsat7 Sources Page 2 of 5 Introduction Space technologies have long been
Title pseudo-hyperspectral image synthesi. Author(s) Hoang, Nguyen Tien; Koike, Katsuaki.
 Hoang, Nguyen Tien; Koike, Katsuaki.") Title Hyperspectral transformation from E pseudo-hyperspectral image synthesi Author(s) Hoang, Nguyen Tien; Koike, Katsuaki International Archives of the Photo Citation and Spatial Information Sciences
Title Hyperspectral transformation from E pseudo-hyperspectral image synthesi Author(s) Hoang, Nguyen Tien; Koike, Katsuaki International Archives of the Photo Citation and Spatial Information Sciences
Chapter 7 GIS AND REMOTE SENSING APPLICATIONS
 GIS AND REMOTE SENSING APPLICATIONS 7.1 Introduction Remote sensing (RS) is the science and it works as an art to some extent. The decade of the 1990 s was revolutionary in terms of the introduction of
MOVING FROM PIXELS TO PRODUCTS
 TRUE COLOR RGB MOSAIC, OSAKA, JAPAN MOVING FROM PIXELS TO PRODUCTS and data to insight AUTOMATED STRUCTURE IDENTIFICATION, OSAKA, JAPAN Table of Contents Moving from Pixels to Products 3 Doubling the Spectral
Introduction of Satellite Remote Sensing
 Introduction of Satellite Remote Sensing Spatial Resolution (Pixel size) Spectral Resolution (Bands) Resolutions of Remote Sensing 1. Spatial (what area and how detailed) 2. Spectral (what colors bands)
Evaluation of FLAASH atmospheric correction. Note. Note no SAMBA/10/12. Authors. Øystein Rudjord and Øivind Due Trier
 Evaluation of FLAASH atmospheric correction Note Note no Authors SAMBA/10/12 Øystein Rudjord and Øivind Due Trier Date 16 February 2012 Norsk Regnesentral Norsk Regnesentral (Norwegian Computing Center,
Designing a Remote Sensing Project. Many factors to consider: here lumped into 12 sections hold on!! first some basic concepts
 Designing a Remote Sensing Project Many factors to consider: here lumped into 12 sections hold on!! first some basic concepts DVC Geography 160 Introduction to Remote Sensing J. Ellis DigitalGlobe (2006)
GIS and Remote Sensing
 GE110 Fall 2008 Week 4 October 18, 2010 GIS and Remote Sensing Lab 2 LANDSAT 7 and ASTER In this lab, you will: 1. Process the LANDSAT 7 ETM+ image to emphasize the useful information a. Transformations
University of Texas at San Antonio EES 5053 Term Project CORRELATION BETWEEN NDVI AND SURFACE TEMPERATURES USING LANDSAT ETM + IMAGERY NEWFEL MAZARI
 University of Texas at San Antonio EES 5053 Term Project CORRELATION BETWEEN NDVI AND SURFACE TEMPERATURES USING LANDSAT ETM + IMAGERY NEWFEL MAZARI Introduction and Objectives The present study is a correlation
Texture characterization in DIRSIG
 Rochester Institute of Technology RIT Scholar Works Theses Thesis/Dissertation Collections 2001 Texture characterization in DIRSIG Christy Burtner Follow this and additional works at: http://scholarworks.rit.edu/theses
IKONOS High Resolution Multispectral Scanner Sensor Characteristics
 High Spatial Resolution and Hyperspectral Scanners IKONOS High Resolution Multispectral Scanner Sensor Characteristics Launch Date View Angle Orbit 24 September 1999 Vandenberg Air Force Base, California,
Remote Sensing and GIS
 Remote Sensing and GIS Atmosphere Reflected radiation, e.g. Visible Emitted radiation, e.g. Infrared Backscattered radiation, e.g. Radar (λ) Visible TIR Radar & Microwave 11/9/2017 Geo327G/386G, U Texas,
NORMALIZING ASTER DATA USING MODIS PRODUCTS FOR LAND COVER CLASSIFICATION
 NORMALIZING ASTER DATA USING MODIS PRODUCTS FOR LAND COVER CLASSIFICATION F. Gao a, b, *, J. G. Masek a a Biospheric Sciences Branch, NASA Goddard Space Flight Center, Greenbelt, MD 20771, USA b Earth
Satellite Remote Sensing: Earth System Observations
 Satellite Remote Sensing: Earth System Observations Land surface Water Atmosphere Climate Ecosystems 1 EOS (Earth Observing System) Develop an understanding of the total Earth system, and the effects of
Hyperspectral Remote Sensing
 Agribusiness Paesaggio & Ambiente -- 7 (2003) n. Hyperspectral Remote Sensing A New Tool in Soil Degradation Monitoring BEATA HEJMANOWSKA - EWA GLOWIENKA Hyperspectral Remote Sensing - A New Tool in Soil
Ge111A Remote Sensing and GIS Lecture
 Ge111A Remote Sensing and GIS Lecture Remote Sensing - many different geophysical data sets. We concentrate on : Imagery (optical, infrared and radar) Topography Geographical Information Systems (GIS)
remote sensing? What are the remote sensing principles behind these Definition
 Introduction to remote sensing: Content (1/2) Definition: photogrammetry and remote sensing (PRS) Radiation sources: solar radiation (passive optical RS) earth emission (passive microwave or thermal infrared
The studies began when the Tiros satellites (1960) provided man s first synoptic view of the Earth s weather systems.
 provided man s first synoptic view of the Earth s weather systems.") Remote sensing of the Earth from orbital altitudes was recognized in the mid-1960 s as a potential technique for obtaining information important for the effective use and conservation of natural resources.
Remote sensing of the Earth from orbital altitudes was recognized in the mid-1960 s as a potential technique for obtaining information important for the effective use and conservation of natural resources.
746A27 Remote Sensing and GIS. Multi spectral, thermal and hyper spectral sensing and usage
 746A27 Remote Sensing and GIS Lecture 3 Multi spectral, thermal and hyper spectral sensing and usage Chandan Roy Guest Lecturer Department of Computer and Information Science Linköping University Multi
Baldwin and Mobile Counties, AL Orthoimagery Project Report. Submitted: March 23, 2016
 2015 Orthoimagery Project Report Submitted: Prepared by: Quantum Spatial, Inc 523 Wellington Way, Suite 375 Lexington, KY 40503 859-277-8700 Page i of iii Contents Project Report 1. Summary / Scope...
PLANET IMAGERY PRODUCT SPECIFICATIONS PLANET.COM
 PLANET IMAGERY PRODUCT SPECIFICATIONS SUPPORT@PLANET.COM PLANET.COM LAST UPDATED JANUARY 2018 TABLE OF CONTENTS LIST OF FIGURES 3 LIST OF TABLES 4 GLOSSARY 5 1. OVERVIEW OF DOCUMENT 7 1.1 Company Overview
Specialists in Satellite Imagery and Geospatial Solutions. Satellite Imagery a valuable tool for the Mining Industry
 Specialists in Satellite Imagery and Geospatial Solutions Satellite Imagery a valuable tool for the Mining Industry Satellites Deciding which is the best satellite imagery for your application? Geoimage
Spatial Analyst is an extension in ArcGIS specially designed for working with raster data.
 Spatial Analyst is an extension in ArcGIS specially designed for working with raster data. 1 Do you remember the difference between vector and raster data in GIS? 2 In Lesson 2 you learned about the difference
Using Freely Available. Remote Sensing to Create a More Powerful GIS
 Using Freely Available Government Data and Remote Sensing to Create a More Powerful GIS All rights reserved. ENVI, E3De, IAS, and IDL are trademarks of Exelis, Inc. All other marks are the property of
Monitoring agricultural plantations with remote sensing imagery
 MPRA Munich Personal RePEc Archive Monitoring agricultural plantations with remote sensing imagery Camelia Slave and Anca Rotman University of Agronomic Sciences and Veterinary Medicine - Bucharest Romania,
Introduction to Remote Sensing Fundamentals of Satellite Remote Sensing. Mads Olander Rasmussen
 Introduction to Remote Sensing Fundamentals of Satellite Remote Sensing Mads Olander Rasmussen (mora@dhi-gras.com) 01. Introduction to Remote Sensing DHI What is remote sensing? the art, science, and technology
Introduction to image processing for remote sensing: Practical examples
 Università degli studi di Roma Tor Vergata Corso di Telerilevamento e Diagnostica Elettromagnetica Anno accademico 2010/2011 Introduction to image processing for remote sensing: Practical examples Dr.
TEMPORAL ANALYSIS OF MULTI EPOCH LANDSAT GEOCOVER IMAGES IN ZONGULDAK TESTFIELD
 TEMPORAL ANALYSIS OF MULTI EPOCH LANDSAT GEOCOVER IMAGES IN ZONGULDAK TESTFIELD Şahin, H. a*, Oruç, M. a, Büyüksalih, G. a a Zonguldak Karaelmas University, Zonguldak, Turkey - (sahin@karaelmas.edu.tr,
Remote Sensing Part 3 Examples & Applications
 Remote Sensing Part 3 Examples & Applications Review: Spectral Signatures Review: Spectral Resolution Review: Computer Display of Remote Sensing Images Individual bands of satellite data are mapped to
Remote Sensing Platforms
 Types of Platforms Lighter-than-air Remote Sensing Platforms Free floating balloons Restricted by atmospheric conditions Used to acquire meteorological/atmospheric data Blimps/dirigibles Major role - news
Application of Satellite Image Processing to Earth Resistivity Map
 Application of Satellite Image Processing to Earth Resistivity Map KWANCHAI NORSANGSRI and THANATCHAI KULWORAWANICHPONG Power System Research Unit School of Electrical Engineering Suranaree University
29 th Annual Louisiana RS/GIS Workshop April 23, 2013 Cajundome Convention Center Lafayette, Louisiana
 Landsat Data Continuity Mission 29 th Annual Louisiana RS/GIS Workshop April 23, 2013 Cajundome Convention Center Lafayette, Louisiana http://landsat.usgs.gov/index.php# Landsat 5 Sets Guinness World Record
9/12/2011. Training Course Remote Sensing Basic Theory & Image Processing Methods September 2011
 Training Course Remote Sensing Basic Theory & Image Processing Methods 19 23 September 2011 Popular Remote Sensing Sensors & their Selection Michiel Damen (September 2011) damen@itc.nl 1 Overview Low resolution
ENVI Tutorial: Orthorectifying Aerial Photographs
 ENVI Tutorial: Orthorectifying Aerial Photographs Table of Contents OVERVIEW OF THIS TUTORIAL...2 ORTHORECTIFYING AERIAL PHOTOGRAPHS IN ENVI...2 Building the interior orientation...3 Building the exterior
IEEE GEOSCIENCE AND REMOTE SENSING LETTERS, VOL. 3, NO. 1, JANUARY Chein-I Chang, Senior Member, IEEE, and Antonio Plaza, Member, IEEE
 IEEE GEOSCIENCE AND REMOTE SENSING LETTERS, VOL. 3, NO. 1, JANUARY 2006 63 A Fast Iterative Algorithm for Implementation of Pixel Purity Index Chein-I Chang, Senior Member, IEEE, Antonio Plaza, Member,
(Presented by Jeppesen) Summary
 Summary") International Civil Aviation Organization SAM/IG/6-IP/06 South American Regional Office 24/09/10 Sixth Workshop/Meeting of the SAM Implementation Group (SAM/IG/6) - Regional Project RLA/06/901 Lima, Peru,
International Civil Aviation Organization SAM/IG/6-IP/06 South American Regional Office 24/09/10 Sixth Workshop/Meeting of the SAM Implementation Group (SAM/IG/6) - Regional Project RLA/06/901 Lima, Peru,
Assessment of Spatiotemporal Changes in Vegetation Cover using NDVI in The Dangs District, Gujarat
 Assessment of Spatiotemporal Changes in Vegetation Cover using NDVI in The Dangs District, Gujarat Using SAGA GIS and Quantum GIS Tutorial ID: IGET_CT_003 This tutorial has been developed by BVIEER as
INTRODUCTORY REMOTE SENSING. Geob 373
 INTRODUCTORY REMOTE SENSING Geob 373 Landsat 7 15 m image highlighting the geology of Oman http://www.satimagingcorp.com/gallery-landsat.html ASTER 15 m SWIR image, Escondida Mine, Chile http://www.satimagingcorp.com/satellite-sensors/aster.html
Sentinel-2 Products and Algorithms
 Sentinel-2 Products and Algorithms Ferran Gascon (Sentinel-2 Data Quality Manager) Workshop Preparations for Sentinel 2 in Europe, Oslo 26 November 2014 Sentinel-2 Mission Mission Overview Products and
Update on Landsat Program and Landsat Data Continuity Mission
 Update on Landsat Program and Landsat Data Continuity Mission Dr. Jeffrey Masek LDCM Deputy Project Scientist NASA GSFC, Code 923 November 21, 2002 Draft LDCM Implementation Phase RFP Overview Page 1 Celebrate!
PLANET IMAGERY PRODUCT SPECIFICATION: PLANETSCOPE & RAPIDEYE
 PLANET IMAGERY PRODUCT SPECIFICATION: PLANETSCOPE & RAPIDEYE LAST UPDATED OCTOBER 2016 SALES@PLANET.COM PLANET.COM Table of Contents LIST OF FIGURES 3 LIST OF TABLES 3 GLOSSARY 5 1. OVERVIEW OF DOCUMENT
REMOTE SENSING. Topic 10 Fundamentals of Digital Multispectral Remote Sensing MULTISPECTRAL SCANNERS MULTISPECTRAL SCANNERS
 REMOTE SENSING Topic 10 Fundamentals of Digital Multispectral Remote Sensing Chapter 5: Lillesand and Keifer Chapter 6: Avery and Berlin MULTISPECTRAL SCANNERS Record EMR in a number of discrete portions
Introduction to Remote Sensing
 Introduction to Remote Sensing Spatial, spectral, temporal resolutions Image display alternatives Vegetation Indices Image classifications Image change detections Accuracy assessment Satellites & Air-Photos
RADIOMETRIC CALIBRATION
 1 RADIOMETRIC CALIBRATION Lecture 10 Digital Image Data 2 Digital data are matrices of digital numbers (DNs) There is one layer (or matrix) for each satellite band Each DN corresponds to one pixel 3 Digital
Land Remote Sensing Lab 4: Classication and Change Detection Assigned: October 15, 2017 Due: October 27, Classication
 Name: Land Remote Sensing Lab 4: Classication and Change Detection Assigned: October 15, 2017 Due: October 27, 2017 In this lab, you will generate several gures. Please sensibly name these images, save
Enhancement of Multispectral Images and Vegetation Indices
 Enhancement of Multispectral Images and Vegetation Indices ERDAS Imagine 2016 Description: We will use ERDAS Imagine with multispectral images to learn how an image can be enhanced for better interpretation.
GE 113 REMOTE SENSING. Topic 7. Image Enhancement
 GE 113 REMOTE SENSING Topic 7. Image Enhancement Lecturer: Engr. Jojene R. Santillan jrsantillan@carsu.edu.ph Division of Geodetic Engineering College of Engineering and Information Technology Caraga State
Remote Sensing Instruction Laboratory
 Laboratory Session 217513 Geographic Information System and Remote Sensing - 1 - Remote Sensing Instruction Laboratory Assist.Prof.Dr. Weerakaset Suanpaga Department of Civil Engineering, Faculty of Engineering
1. What values did you use for bands 2, 3 & 4? Populate the table below. Compile the relevant data for the additional bands in the data below:
 Graham Emde GEOG3200: Remote Sensing Lab # 3: Atmospheric Correction Introduction: This lab teachs how to use INDRISI to correct for atmospheric haze in remotely sensed imagery. There are three models
Blacksburg, VA July 24 th 30 th, 2010 Remote Sensing Page 1. A condensed overview. For our purposes
 A condensed overview George McLeod Prepared by: With support from: NSF DUE-0903270 in partnership with: Geospatial Technician Education Through Virginia s Community Colleges (GTEVCC) The art and science
Application of GIS to Fast Track Planning and Monitoring of Development Agenda
 Application of GIS to Fast Track Planning and Monitoring of Development Agenda Radiometric, Atmospheric & Geometric Preprocessing of Optical Remote Sensing 13 17 June 2018 Outline 1. Why pre-process remotely
Comparing of Landsat 8 and Sentinel 2A using Water Extraction Indexes over Volta River
 Journal of Geography and Geology; Vol. 10, No. 1; 2018 ISSN 1916-9779 E-ISSN 1916-9787 Published by Canadian Center of Science and Education Comparing of Landsat 8 and Sentinel 2A using Water Extraction
BV NNET User manual. V0.2 (Draft) Rémi Lecerf, Marie Weiss
 Rémi Lecerf, Marie Weiss") BV NNET User manual V0.2 (Draft) Rémi Lecerf, Marie Weiss 1. Introduction... 2 2. Installation... 2 3. Prerequisites... 2 3.1. Image file format... 2 3.2. Retrieving atmospheric data... 3 3.2.1. Using
BV NNET User manual V0.2 (Draft) Rémi Lecerf, Marie Weiss 1. Introduction... 2 2. Installation... 2 3. Prerequisites... 2 3.1. Image file format... 2 3.2. Retrieving atmospheric data... 3 3.2.1. Using
GIS Data Collection. Remote Sensing
 GIS Data Collection Remote Sensing Data Collection Remote sensing Introduction Concepts Spectral signatures Resolutions: spectral, spatial, temporal Digital image processing (classification) Other systems
Grant Boxer Consultant Geologist March 10th 2014 (Updated Nov 2014)
") Grant Boxer Consultant Geologist March 10th 2014 (Updated Nov 2014) Work flow for Landsat 8 Landgate Data Selecting and processing basic data Importing into MapInfo Applications SLIP Portal WMS access
Grant Boxer Consultant Geologist March 10th 2014 (Updated Nov 2014) Work flow for Landsat 8 Landgate Data Selecting and processing basic data Importing into MapInfo Applications SLIP Portal WMS access
An Introduction to Geomatics. Prepared by: Dr. Maher A. El-Hallaq خاص بطلبة مساق مقدمة في علم. Associate Professor of Surveying IUG
 An Introduction to Geomatics خاص بطلبة مساق مقدمة في علم الجيوماتكس Prepared by: Dr. Maher A. El-Hallaq Associate Professor of Surveying IUG 1 Airborne Imagery Dr. Maher A. El-Hallaq Associate Professor
Destriping and Geometric Correction of an ASTER Level 1A Image
 Destriping and Geometric Correction of an ASTER Level 1A Image Rob van Ede February 2004 Utrecht University Faculty of GeoSciences Department of Physiscal Geography Supervisors: Prof. Dr. Steven de Jong
Satellite Imagery Characteristics, Uses and Delivery to GIS Systems. Wayne Middleton April 2014
 Satellite Imagery Characteristics, Uses and Delivery to GIS Systems Wayne Middleton April 2014 About Geoimage Founded in Brisbane 1988 Leading Independent company Specialists in satellite imagery and geospatial
ENVI Classic Tutorial: Spectral Angle Mapper (SAM) and Spectral Information Divergence (SID) Classification 2
 and Spectral Information Divergence (SID) Classification 2") ENVI Classic Tutorial: Spectral Angle Mapper (SAM) and Spectral Information Divergence (SID) Classification Spectral Angle Mapper (SAM) and Spectral Information Divergence (SID) Classification 2 Files
ENVI Classic Tutorial: Spectral Angle Mapper (SAM) and Spectral Information Divergence (SID) Classification Spectral Angle Mapper (SAM) and Spectral Information Divergence (SID) Classification 2 Files
On the use of water color missions for lakes in 2021
 Lakes and Climate: The Role of Remote Sensing June 01-02, 2017 On the use of water color missions for lakes in 2021 Cédric G. Fichot Department of Earth and Environment 1 Overview 1. Past and still-ongoing
The studies began when the Tiros satellites (1960) provided man s first synoptic view of the Earth s weather systems.
 provided man s first synoptic view of the Earth s weather systems.") Remote sensing of the Earth from orbital altitudes was recognized in the mid-1960 s as a potential technique for obtaining information important for the effective use and conservation of natural resources.
Remote sensing of the Earth from orbital altitudes was recognized in the mid-1960 s as a potential technique for obtaining information important for the effective use and conservation of natural resources.