Geometric Validation of Hyperion Data at Coleambally Irrigation Area
|
|
|
- Sarah Beverley Hall
- 5 years ago
- Views:
Transcription

1 Geometric Validation of Hyperion Data at Coleambally Irrigation Area Tim McVicar, Tom Van Niel, David Jupp CSIRO, Australia Jay Pearlman, and Pamela Barry TRW, USA

 and well maintained,")

2 Background RICE SOYBEANS The Coleambally Irrigation Area (CIA) is approximately 95,000 hectares in size, and comprises over 500 farms. Fields are large (up to 70 hectares) and well maintained, making them ideal for instrument validation. The principal summer crops grown at the CIA are rice, corn, and soybeans, while winter crops include wheat, barely, oats, and canola. CORN
 land validation core site.")
3 Background The CIA falls completely within two Landsat scenes (Path 92 Row 84, and Path 93 Row 84) allowing for an 8 day repeat cycle for the acquisition of both LANDSAT and EO-1 imagery. The nearby Uardry is a NASA Earth Observing System (EOS) land validation core site. Radiosonde and visibility data are acquired by the Australian Bureau of Meteorology at Wagga Wagga.


4 Datasets / Landsat ETM+ 19 Landsat ETM+ images were acquired over the summer growing season (October 2000 May 2001)

.")
5 Datasets / Hyperion Seventeen EO-1 acquisitions over the summer growing season (December 2000 May 2001). Eight of these were clear (green). Two more were partly clear (blue). The other seven are cloudy (grey).
 Survey -Chemistry -Biomass -Chlorophyll Meter -Field Survey GIS-based -DGPS ground-based measurements -DGPS roads/ road intersections -Paddock (field) boundaries -Rice bay boundaries Green")
6 Satellite-based -EO-1 (ALI, Hyperion) -TERRA (Aster, MODIS) -Landsat ETM+ Coleambally Datasets Airborne -Hymap -Photography Ground-based -ASD Spectra -GER Spectra -LAI -Albedo -Photography -Producer (land use) Survey -Chemistry -Biomass -Chlorophyll Meter -Field Survey GIS-based -DGPS ground-based measurements -DGPS roads/ road intersections -Paddock (field) boundaries -Rice bay boundaries Green = Clear Blue = Partly Clear Grey = Cloudy
.")
7 Datasets / Reference Aerial Photography High resolution (2m) digital aerial photographs acquired January 2001 used for creating positionally accurate field and rice bay GIS datasets. Over 466km of linear road network and 129 well-defined points digitised with a Differential Global Positioning System (DGPS). These datasets can be used for geo-referencing Hyperion time series

8 Datasets / Producer Survey Land use information within the focus Hyperion acquisition boundary of the CIA is being collected. Information about crop type, variety, and management practices are linked to individual paddocks within the GIS. Also, Coleambally Irrigation Limited (CIL), have provided water use information by farm. This database provides the validation of remotely sensed site characteristics for this study %DUH*URXQG &RUQ 5LFH &RUQ &URSW\SH5LFH 9DULHW\$PDURR 3UHYLRXV&URS6R\EHDQV +DUYHVWGDWH$SU )HUWLOLVHU$SSOLFDWLRQ8UHD6HS 5LFH 6R\EHDQV
 and biomass. Twenty-three of these same locations were measured with a chlorophyll meter (SPAD-502) in the field on 03 January 2001.")
9 Datasets / Plant Samples Rice Samples Rice samples were collected in association with both the 24 December 2000 and 02 January 2001 E0-1 overpasses. In both cases, 38 1m 2 samples were analysed for nitrogen (N) and biomass. Twenty-three of these same locations were measured with a chlorophyll meter (SPAD-502) in the field on 03 January Other Samples Some other crop plant samples were collected in association with the 19 February 2001 EO-1 overpass, including sorghum, soybean, corn, and sunflower. Three common rice weed samples were collected in association with 07 March 2001 EO-1 overpass and ASD spectra collection.

10 Datasets / Ground Spectral Measurements Spectral measurements were made in situ to the 03 February 2001, and the 07 March 2001 EO-1 overpasses with an ASD spectroradiometer. Rice, soybean, soil, and bright stubble targets were measured both days. Mean reflectance of the targets is shown below for the 03 February collection.


11 Ground-based Spectral Data Spectral measurements were made February 3, 2001, and March 7, 2001 during EO-1 overpasses with an ASD spectrometer. Data taken 2/3/01: Liang, Kaul and Van Niel reflectivity Rice Av 1-3 Rice Av 4-6 Soy av 4-6 Soy av 8-10 soil av soil av wavelength (nm)
12 Geo-Correction

13 Geocorrection Issues A one step process must address both: S V Geocorrection of VNIR and SWIR images Overlay of VNIR and SWIR images
14 Methods / Geo-correction Data acquired by Hyperion over the CIA from both the VNIR and SWIR arrays were geometrically assessed for three dates: 02 Jan 2001; 03 Feb 2001; and 07 Mar Hence, six Hyperion images are used in this study (VNIR and SWIR for each of the three). GCPs collected in each of the six Hyperion images and a highresolution digital aerial photography mosaic allowed the input Hyperion images to be geocorrected to a map base. Prior to fitting a transitive chain polynomial, outlier GCPs were identified and redefined. The order of the best polynomial was decided upon by using General Cross Validation and Predictive Error statistics. An affine (or linear) polynomial was selected.
15 Methods / Geo-correction For each EO-1 data acquisition event, the two images (VNIR and SWIR) were geocorrected using two methods: Firstly, we used the transitive ties, the basis of MOSMOD, to modify the input GCPs to provide geometric control through the stack of images (termed MOSMOD registration), and secondly we geometrically corrected two arrays independently to the map (termed MAP registration) Additionally, four generic shifts were applied to the SWIR image to geometrically match the SWIR image to the VNIR image. The SWIR image was shifted to the VNIR image by linearly interpolating across track. A constant 1 pixel shift was applied to the SWIR array in the along track direction. For example, to 1 and 1 shift means the SWIR image was shifted to the VNIR image by 0.25 lines at pixel 1 (the western edge of the array) and by 1 line at pixel 256 (the eastern edge of the array). The line shift between the end pixels (across track) was linearly interpolated. A constant 1 pixel shift was applied to the SWIR array in the line (along track) direction.
16 Results / Geo-correction Overall Statistics Total RMS residuals internal to the stack of input images(mosmod): X = m Y = m Polynomial from each of the 6 Hyperion images to base Aerial Photos: Average RMSx error = m, Standard deviation = m Average RMSy error = m, Standard deviation = m (Both slightly larger than 1/3 rd of the original 30 m pixel size) Supports the affine transitive polynomial coefficients, developed using MOSMOD
17 Results / Geo-correction 15 Hyperion Image Combination Statistics: Average RMSx error = m, Standard deviation = m Average RMSy error = m, Standard deviation = m Between any pair of Hyperion images, the error in the x (or pixel) direction is less than the error in the y (or line) direction. It is likely that optical alignment differences account for x-shift, and the VNIR-SWIR readout difference causes the y-shift.

18 Results / Geo-correction X s = X-stretch; Y s = Y-stretch γ = Earth rotation skew θ = Rotation of satellite track
19 X s and Y s Results MOSMOD Results: Results / Geo-correction Avg X s = m (SD 0.005m) and Avg Y s = m (SD 0.007m) TRW On-Orbit Results (Barry pers, comm.) : Avg X s = m (SD 0.25m) and Avg Y s = m (SD 0.73m)

20 VNIR/SWIR Spatial Structure defined from difference image calculated as band 57 minus band 78 Raw Data Merged then Registered to 1 and 1 Merged then Registered MOSMOD Registration Severe Edge Effects Best of the Shift then Register transformations still some edge effects mid scene Best results attained by registering VNIR and SWIR to map independently - still some localized edge effects and requires twice as many GCP s Results suggest that VNIR/SWIR shift is non-linear
21 Conclusions Geo-correction of VNIR and SWIR images independently provides best results. Results indicate that VNIR/SWIR shift is not linear However, a 0.25 to 1 cross track linear interpolation, and 1 offset along track provides a close approximation of the VNIR/SWIR offset. Independent geo-correction requires a full set of GCP s for both VNIR and SWIR, whereas shift then register transformation only requires one set of GCPs. The difference in methodologies for registration matching is ultimately a cost-benefit analysis of the user and will depend on the spatiotemporal data construct of the application.
22 Preliminary Analysis

23
24
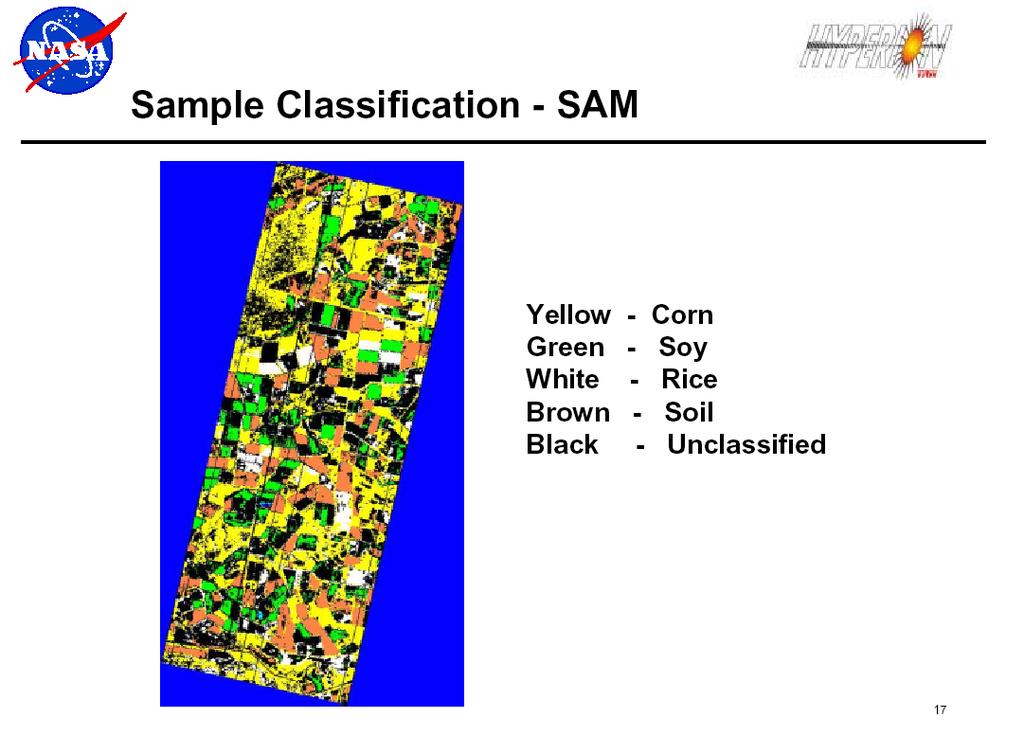
25 Temporal Sequence of Hyperion Images Coleambally Irrigation Area A B C D E SOIL CORN RICE SOY SOIL Day 001 Day 033 Day 065 Day 072 Julian calendar day of 2001
26 Courtesy: Jay Pearlman, TRW


27 Coleambally Chlorophyll Indices from Hyperion 24 Dec Jan Feb Feb Mar Mar 2001 Chl-a index value 2000/2001 growing season; Chl-a index = R 800 /R 635
28
29
30

31 Coleambally Irrigation Area (CIA) Summary of Activities CIA is located in the east-west overlap of two EO-1 paths, allowing for an 8-day repeat cycle For time series analysis accurate geolocation of both VNIR and SWIR arrays is required Within a growing season (4 months) crop variables change dramatically (e.g. rice LAI_max = 10) Time series of EO-1 data (Hyperion L1A, ALI) and L7 ETM are currently being established (GEO-CORR and AT-COR) for CIA Extensive ground based, including GIS, D-GPS harvested and meteorological data, are available for the 2000/2001 and 2001/2002 summer (Southern Hemisphere) growing seasons
32
33 X s and Y s Results MOSMOD Results: Results / Geo-correction Avg X s = m (SD 0.005m) and Avg Y s = m (SD 0.007m) TRW On-Orbit Results (Barry pers, comm.) : Avg X s = m (SD 0.25m) and Avg Y s = m (SD 0.73m) VNIR and SWIR γ and θ Results VNIR Avg θ = (SD ) and Avg γ = (SD ) SWIR Avg θ = (SD ) and Avg γ = (SD )
34 VNIR/SWIR Shifts - Cross Track Differences
35 VNIR/SWIR Shifts - Along Track Differences
36
37

38 CIA Study Area - Paddocks 32 and 33

39 Coleambally Irrigation Area Overview Large farms Irrigated and level modern management practices Variability among Farms in their Management Philosophy
40 Hyperion Data - Comments Level 1 data: nm and nm Bands 9-57 and ; SWIR is West of VNIR and rotated CCW by one pixel Band Center(nm) FWHM(nm) SWIR VNIR S V
41 Methods / Geo-correction Data acquired by Hyperion over the CIA from both the VNIR and SWIR arrays were geometrically assessed for three dates: 02 Jan 2001; 03 Feb 2001; and 07 Mar Hence, six Hyperion images are used in this study (VNIR and SWIR for each of the three). GCPs collected in each of the six Hyperion images and a highresolution digital aerial photography mosaic (which meets both the US National Map Accuracy Standards and the National Mapping Council of Australia mapping standards) allowed the input Hyperion images to be geocorrected to a map base. Prior to fitting a transitive chain polynomial, outlier GCPs were identified and redefined. The order of the best polynomial was decided upon by using General Cross Validation and Predictive Error statistics. An affine (or linear) polynomial was selected.


42 VNIR/SWIR Spatial Structure defined from difference image calculated as band 57 minus band 78 Raw Data Merged then Registered 0 to 1 and 1 Merged then Registered to 1.25 and 1 Merged then Registered to 1 and 1 Merged then Registered Regression Merged then Registered ENVI Registration MOSMOD Registration False Colour Composite Radiance (W m -2 sr -1 µm -1 ) 07 March 2001 cwl: band 57 = nm; band78 = nm


 07 March 2001 cwl: band 57 =")
43 VNIR/SWIR Spatial Structure defined from difference image of Coleambally band 57 minus band 78 Raw Data Merged then Registered 0 to 1 and 1 Merged then Registered to 1.25 and 1 Merged to 1 and 1 Merged then Registered then Registered Regression Merged then Registered ENVI Registration MOSMOD Registration False Colour Composite Radiance (W m -2 sr -1 µm -1 ) 07 March 2001 cwl: band 57 = nm; band78 = nm
Bisun Datt, Tim R. McVicar, Tom G. Van Niel, David L. B. Jupp, Associate Member, IEEE, and Jay S. Pearlman, Senior Member, IEEE
 1246 IEEE TRANSACTIONS ON GEOSCIENCE AND REMOTE SENSING, VOL. 41, NO. 6, JUNE 2003 Preprocessing EO-1 Hyperion Hyperspectral Data to Support the Application of Agricultural Indexes Bisun Datt, Tim R. McVicar,
An Introduction to Remote Sensing & GIS. Introduction
 An Introduction to Remote Sensing & GIS Introduction Remote sensing is the measurement of object properties on Earth s surface using data acquired from aircraft and satellites. It attempts to measure something
High Resolution Multi-spectral Imagery
 High Resolution Multi-spectral Imagery Jim Baily, AirAgronomics AIRAGRONOMICS Having been involved in broadacre agriculture until 2000 I perceived a need for a high resolution remote sensing service to
Airborne hyperspectral data over Chikusei
 SPACE APPLICATION LABORATORY, THE UNIVERSITY OF TOKYO Airborne hyperspectral data over Chikusei Naoto Yokoya and Akira Iwasaki E-mail: {yokoya, aiwasaki}@sal.rcast.u-tokyo.ac.jp May 27, 2016 ABSTRACT Airborne
NASA Missions and Products: Update. Garik Gutman, LCLUC Program Manager NASA Headquarters Washington, DC
 NASA Missions and Products: Update Garik Gutman, LCLUC Program Manager NASA Headquarters Washington, DC 1 JPSS-2 (NOAA) SLI-TBD Formulation in 2015 RBI OMPS-Limb [[TSIS-2]] [[TCTE]] Land Monitoring at
remote sensing? What are the remote sensing principles behind these Definition
 Introduction to remote sensing: Content (1/2) Definition: photogrammetry and remote sensing (PRS) Radiation sources: solar radiation (passive optical RS) earth emission (passive microwave or thermal infrared
Introduction of Satellite Remote Sensing
 Introduction of Satellite Remote Sensing Spatial Resolution (Pixel size) Spectral Resolution (Bands) Resolutions of Remote Sensing 1. Spatial (what area and how detailed) 2. Spectral (what colors bands)
Using Freely Available. Remote Sensing to Create a More Powerful GIS
 Using Freely Available Government Data and Remote Sensing to Create a More Powerful GIS All rights reserved. ENVI, E3De, IAS, and IDL are trademarks of Exelis, Inc. All other marks are the property of
The studies began when the Tiros satellites (1960) provided man s first synoptic view of the Earth s weather systems.
 provided man s first synoptic view of the Earth s weather systems.") Remote sensing of the Earth from orbital altitudes was recognized in the mid-1960 s as a potential technique for obtaining information important for the effective use and conservation of natural resources.
Remote sensing of the Earth from orbital altitudes was recognized in the mid-1960 s as a potential technique for obtaining information important for the effective use and conservation of natural resources.
Present and future of marine production in Boka Kotorska
 Present and future of marine production in Boka Kotorska First results from satellite remote sensing for the breeding areas of filter feeders in the Bay of Kotor INTRODUCTION Environmental monitoring is
Satellite Remote Sensing: Earth System Observations
 Satellite Remote Sensing: Earth System Observations Land surface Water Atmosphere Climate Ecosystems 1 EOS (Earth Observing System) Develop an understanding of the total Earth system, and the effects of
ASTER GDEM Readme File ASTER GDEM Version 1
 I. Introduction ASTER GDEM Readme File ASTER GDEM Version 1 The Advanced Spaceborne Thermal Emission and Reflection Radiometer (ASTER) Global Digital Elevation Model (GDEM) was developed jointly by the
APCAS/10/21 April 2010 ASIA AND PACIFIC COMMISSION ON AGRICULTURAL STATISTICS TWENTY-THIRD SESSION. Siem Reap, Cambodia, April 2010
 APCAS/10/21 April 2010 Agenda Item 8 ASIA AND PACIFIC COMMISSION ON AGRICULTURAL STATISTICS TWENTY-THIRD SESSION Siem Reap, Cambodia, 26-30 April 2010 The Use of Remote Sensing for Area Estimation by Robert
HYPERSPECTRAL IMAGERY FOR SAFEGUARDS APPLICATIONS. International Atomic Energy Agency, Vienna, Austria
 HYPERSPECTRAL IMAGERY FOR SAFEGUARDS APPLICATIONS G. A. Borstad 1, Leslie N. Brown 1, Q.S. Bob Truong 2, R. Kelley, 3 G. Healey, 3 J.-P. Paquette, 3 K. Staenz 4, and R. Neville 4 1 Borstad Associates Ltd.,
Remote Sensing. The following figure is grey scale display of SPOT Panchromatic without stretching.
 Remote Sensing Objectives This unit will briefly explain display of remote sensing image, geometric correction, spatial enhancement, spectral enhancement and classification of remote sensing image. At
PLANET SURFACE REFLECTANCE PRODUCT
 PLANET SURFACE REFLECTANCE PRODUCT FEBRUARY 2018 SUPPORT@PLANET.COM PLANET.COM VERSION 1.0 TABLE OF CONTENTS 3 Product Description 3 Atmospheric Correction Methodology 5 Product Limitations 6 Product Assessment
The studies began when the Tiros satellites (1960) provided man s first synoptic view of the Earth s weather systems.
 provided man s first synoptic view of the Earth s weather systems.") Remote sensing of the Earth from orbital altitudes was recognized in the mid-1960 s as a potential technique for obtaining information important for the effective use and conservation of natural resources.
Remote sensing of the Earth from orbital altitudes was recognized in the mid-1960 s as a potential technique for obtaining information important for the effective use and conservation of natural resources.
NON-PHOTOGRAPHIC SYSTEMS: Multispectral Scanners Medium and coarse resolution sensor comparisons: Landsat, SPOT, AVHRR and MODIS
 NON-PHOTOGRAPHIC SYSTEMS: Multispectral Scanners Medium and coarse resolution sensor comparisons: Landsat, SPOT, AVHRR and MODIS CLASSIFICATION OF NONPHOTOGRAPHIC REMOTE SENSORS PASSIVE ACTIVE DIGITAL
Title pseudo-hyperspectral image synthesi. Author(s) Hoang, Nguyen Tien; Koike, Katsuaki.
 Hoang, Nguyen Tien; Koike, Katsuaki.") Title Hyperspectral transformation from E pseudo-hyperspectral image synthesi Author(s) Hoang, Nguyen Tien; Koike, Katsuaki International Archives of the Photo Citation and Spatial Information Sciences
Title Hyperspectral transformation from E pseudo-hyperspectral image synthesi Author(s) Hoang, Nguyen Tien; Koike, Katsuaki International Archives of the Photo Citation and Spatial Information Sciences
CHARACTERISTICS OF REMOTELY SENSED IMAGERY. Radiometric Resolution
 CHARACTERISTICS OF REMOTELY SENSED IMAGERY Radiometric Resolution There are a number of ways in which images can differ. One set of important differences relate to the various resolutions that images express.
Grant Boxer Consultant Geologist March 10th 2014 (Updated Nov 2014)
") Grant Boxer Consultant Geologist March 10th 2014 (Updated Nov 2014) Work flow for Landsat 8 Landgate Data Selecting and processing basic data Importing into MapInfo Applications SLIP Portal WMS access
Grant Boxer Consultant Geologist March 10th 2014 (Updated Nov 2014) Work flow for Landsat 8 Landgate Data Selecting and processing basic data Importing into MapInfo Applications SLIP Portal WMS access
Application of GIS to Fast Track Planning and Monitoring of Development Agenda
 Application of GIS to Fast Track Planning and Monitoring of Development Agenda Radiometric, Atmospheric & Geometric Preprocessing of Optical Remote Sensing 13 17 June 2018 Outline 1. Why pre-process remotely
Crop and Irrigation Water Management Using High-resolution Airborne Remote Sensing
 Crop and Irrigation Water Management Using High-resolution Airborne Remote Sensing Christopher M. U. Neale and Hari Jayanthi Dept. of Biological and Irrigation Eng. Utah State University & James L.Wright
Module 3 Introduction to GIS. Lecture 8 GIS data acquisition
 Module 3 Introduction to GIS Lecture 8 GIS data acquisition GIS workflow Data acquisition (geospatial data input) GPS Remote sensing (satellites, UAV s) LiDAR Digitized maps Attribute Data Management Data
NORMALIZING ASTER DATA USING MODIS PRODUCTS FOR LAND COVER CLASSIFICATION
 NORMALIZING ASTER DATA USING MODIS PRODUCTS FOR LAND COVER CLASSIFICATION F. Gao a, b, *, J. G. Masek a a Biospheric Sciences Branch, NASA Goddard Space Flight Center, Greenbelt, MD 20771, USA b Earth
Aral Sea profile Selection of area 24 February April May 1998
 250 km Aral Sea profile 1960 1960 1985 1986 1987 1988 1989 1990 1991 1992 1993 1994 1995 1996 1997 1998 2010? Selection of area Area of interest Kzyl-Orda Dried seabed 185 km Syrdarya river Aral Sea Salt
Discussion around Hyperion Data
 Discussion around Hyperion Data David L B Jupp April/May 2001 Introduction Now that Hyperion data are here and being used, there are many things that need to be discussed and many experiences that can
Sensor resolutions from space: the tension between temporal, spectral, spatial and swath. David Bruce UniSA and ISU
 Sensor resolutions from space: the tension between temporal, spectral, spatial and swath David Bruce UniSA and ISU 1 Presentation aims 1. Briefly summarize the different types of satellite image resolutions
APPLICATION OF HYPERSPECTRAL REMOTE SENSING IN TARGET DETECTION AND MAPPING USING FIELDSPEC ASD IN UDAYGIRI (M.P.)
") 1 International Journal of Advance Research, IJOAR.org Volume 1, Issue 3, March 2013, Online: APPLICATION OF HYPERSPECTRAL REMOTE SENSING IN TARGET DETECTION AND MAPPING USING FIELDSPEC ASD IN UDAYGIRI
1 International Journal of Advance Research, IJOAR.org Volume 1, Issue 3, March 2013, Online: APPLICATION OF HYPERSPECTRAL REMOTE SENSING IN TARGET DETECTION AND MAPPING USING FIELDSPEC ASD IN UDAYGIRI
Introduction to Remote Sensing
 Introduction to Remote Sensing Spatial, spectral, temporal resolutions Image display alternatives Vegetation Indices Image classifications Image change detections Accuracy assessment Satellites & Air-Photos
TEMPORAL ANALYSIS OF MULTI EPOCH LANDSAT GEOCOVER IMAGES IN ZONGULDAK TESTFIELD
 TEMPORAL ANALYSIS OF MULTI EPOCH LANDSAT GEOCOVER IMAGES IN ZONGULDAK TESTFIELD Şahin, H. a*, Oruç, M. a, Büyüksalih, G. a a Zonguldak Karaelmas University, Zonguldak, Turkey - (sahin@karaelmas.edu.tr,
Image transformations
 Image transformations Digital Numbers may be composed of three elements: Atmospheric interference (e.g. haze) ATCOR Illumination (angle of reflection) - transforms Albedo (surface cover) Image transformations
Lecture 6: Multispectral Earth Resource Satellites. The University at Albany Fall 2018 Geography and Planning
 Lecture 6: Multispectral Earth Resource Satellites The University at Albany Fall 2018 Geography and Planning Outline SPOT program and other moderate resolution systems High resolution satellite systems
Spectral Signatures. Vegetation. 40 Soil. Water WAVELENGTH (microns)
") Spectral Signatures % REFLECTANCE VISIBLE NEAR INFRARED Vegetation Soil Water.5. WAVELENGTH (microns). Spectral Reflectance of Urban Materials 5 Parking Lot 5 (5=5%) Reflectance 5 5 5 5 5 Wavelength (nm)
Spectral Signatures % REFLECTANCE VISIBLE NEAR INFRARED Vegetation Soil Water.5. WAVELENGTH (microns). Spectral Reflectance of Urban Materials 5 Parking Lot 5 (5=5%) Reflectance 5 5 5 5 5 Wavelength (nm)
Evaluation of FLAASH atmospheric correction. Note. Note no SAMBA/10/12. Authors. Øystein Rudjord and Øivind Due Trier
 Evaluation of FLAASH atmospheric correction Note Note no Authors SAMBA/10/12 Øystein Rudjord and Øivind Due Trier Date 16 February 2012 Norsk Regnesentral Norsk Regnesentral (Norwegian Computing Center,
Railroad Valley Playa for use in vicarious calibration of large footprint sensors
 Railroad Valley Playa for use in vicarious calibration of large footprint sensors K. Thome, J. Czapla-Myers, S. Biggar Remote Sensing Group Optical Sciences Center University of Arizona Introduction P
(Presented by Jeppesen) Summary
 Summary") International Civil Aviation Organization SAM/IG/6-IP/06 South American Regional Office 24/09/10 Sixth Workshop/Meeting of the SAM Implementation Group (SAM/IG/6) - Regional Project RLA/06/901 Lima, Peru,
International Civil Aviation Organization SAM/IG/6-IP/06 South American Regional Office 24/09/10 Sixth Workshop/Meeting of the SAM Implementation Group (SAM/IG/6) - Regional Project RLA/06/901 Lima, Peru,
[GEOMETRIC CORRECTION, ORTHORECTIFICATION AND MOSAICKING]
![[GEOMETRIC CORRECTION, ORTHORECTIFICATION AND MOSAICKING]](/thumbs/78/78211997.jpg "[GEOMETRIC CORRECTION, ORTHORECTIFICATION AND MOSAICKING]") 2013 Ogis-geoInfo Inc. IBEABUCHI NKEMAKOLAM.J [GEOMETRIC CORRECTION, ORTHORECTIFICATION AND MOSAICKING] [Type the abstract of the document here. The abstract is typically a short summary of the contents
2013 Ogis-geoInfo Inc. IBEABUCHI NKEMAKOLAM.J [GEOMETRIC CORRECTION, ORTHORECTIFICATION AND MOSAICKING] [Type the abstract of the document here. The abstract is typically a short summary of the contents
REMOTE SENSING. Topic 10 Fundamentals of Digital Multispectral Remote Sensing MULTISPECTRAL SCANNERS MULTISPECTRAL SCANNERS
 REMOTE SENSING Topic 10 Fundamentals of Digital Multispectral Remote Sensing Chapter 5: Lillesand and Keifer Chapter 6: Avery and Berlin MULTISPECTRAL SCANNERS Record EMR in a number of discrete portions
9/12/2011. Training Course Remote Sensing Basic Theory & Image Processing Methods September 2011
 Training Course Remote Sensing Basic Theory & Image Processing Methods 19 23 September 2011 Popular Remote Sensing Sensors & their Selection Michiel Damen (September 2011) damen@itc.nl 1 Overview Low resolution
Using IRS Products to Recover 7ETM + Defective Images
 American Journal of Applied Sciences 5 (6): 618-625, 2008 ISSN 1546-9239 2008 Science Publications Using IRS Products to Recover 7ETM + Defective Images 1 Mobasheri Mohammad Reza and 2 Sadeghi Naeini Ali
LANDSAT 8 Level 1 Product Performance
 Réf: IDEAS-TN-10-CyclicReport LANDSAT 8 Level 1 Product Performance Cyclic Report Month/Year: May 2015 Date: 25/05/2015 Issue/Rev:1/0 1. Scope of this document On May 30, 2013, data from the Landsat 8
Geometric Quality Assessment of CBERS-2. Julio d Alge Ricardo Cartaxo Guaraci Erthal
 Geometric Quality Assessment of CBERS-2 Julio d Alge Ricardo Cartaxo Guaraci Erthal Contents Monitoring CBERS-2 scene centers Satellite orbit control Band-to-band registration accuracy Detection and control
IKONOS High Resolution Multispectral Scanner Sensor Characteristics
 High Spatial Resolution and Hyperspectral Scanners IKONOS High Resolution Multispectral Scanner Sensor Characteristics Launch Date View Angle Orbit 24 September 1999 Vandenberg Air Force Base, California,
Chapter 5. Preprocessing in remote sensing
 Chapter 5. Preprocessing in remote sensing 5.1 Introduction Remote sensing images from spaceborne sensors with resolutions from 1 km to < 1 m become more and more available at reasonable costs. For some
Remote sensing image correction
 Remote sensing image correction Introductory readings remote sensing http://www.microimages.com/documentation/tutorials/introrse.pdf 1 Preprocessing Digital Image Processing of satellite images can be
ACRESUPDATE. September 2002 ISSUE GEOSCIENCE AUSTRALIA FEATURES. News for the Australian remote sensing industry. Monitoring pastures from space 3
 GEOSCIENCE AUSTRALIA September 2002 ISSUE 26 ACRESUPDATE News for the Australian remote sensing industry FEATURES Monitoring pastures from space 3 Remote sensing research at Coleambally Irrigation Area
The availability of cloud free Landsat TM and ETM+ land observations and implications for global Landsat data production
 14475 The availability of cloud free Landsat TM and ETM+ land observations and implications for global Landsat data production *V. Kovalskyy, D. Roy (South Dakota State University) SUMMARY The NASA funded
9/12/2011. Training Course Remote Sensing Basic Theory & Image Processing Methods September 2011
 Training Course Remote Sensing Basic Theory & Image Processing Methods 19 23 September 2011 Introduction to Remote Sensing Michiel Damen (September 2011) damen@itc.nl 1 Overview Some definitions Remote
INTERNATIONAL JOURNAL OF ENVIRONMENTAL SCIENCES Volume 6, No 5, Copyright by the authors - Licensee IPA- Under Creative Commons license 3.
 INTERNATIONAL JOURNAL OF ENVIRONMENTAL SCIENCES Volume 6, No 5, 2016 Copyright by the authors - Licensee IPA- Under Creative Commons license 3.0 Research article ISSN 0976 4402 Normalised difference water
JECAM/SEN2AGRI CROSS SITES
 JECAM/SEN2AGRI CROSS SITES BENCHMARKING FOR CROP TYPE JECAM Annual Science Meeting 16-17 November 2015 Brussels, Belgium Sen2-Agri QR Meeting -ESRIN -October 30, 2015 CROP-TYPE PRODUCT Delivered as soon
Image Fusion. Pan Sharpening. Pan Sharpening. Pan Sharpening: ENVI. Multi-spectral and PAN. Magsud Mehdiyev Geoinfomatics Center, AIT
 1 Image Fusion Sensor Merging Magsud Mehdiyev Geoinfomatics Center, AIT Image Fusion is a combination of two or more different images to form a new image by using certain algorithms. ( Pohl et al 1998)
Landsat 8, Level 1 Product Performance Cyclic Report July 2016
 Landsat 8, Level 1 Product Performance Cyclic Report July 2016 Author(s) : Sébastien Saunier (IDEAS+, Telespazio VEGA) Amy Northrop (IDEAS+, Telespazio VEGA) IDEAS+-VEG-OQC-REP-2647 Issue July 2016 1 September
An Introduction to Geomatics. Prepared by: Dr. Maher A. El-Hallaq خاص بطلبة مساق مقدمة في علم. Associate Professor of Surveying IUG
 An Introduction to Geomatics خاص بطلبة مساق مقدمة في علم الجيوماتكس Prepared by: Dr. Maher A. El-Hallaq Associate Professor of Surveying IUG 1 Airborne Imagery Dr. Maher A. El-Hallaq Associate Professor
366 Glossary. Popular method for scale drawings in a computer similar to GIS but without the necessity for spatial referencing CEP
 366 Glossary GISci Glossary ASCII ASTER American Standard Code for Information Interchange Advanced Spaceborne Thermal Emission and Reflection Radiometer Computer Aided Design Circular Error Probability
SUGAR_GIS. From a user perspective. Provides spatial distribution of a wide range of sugarcane production data in an easy to use and sensitive way.
 SUGAR_GIS From a user perspective What is Sugar_GIS? A web-based, decision support tool. Provides spatial distribution of a wide range of sugarcane production data in an easy to use and sensitive way.
Urban Classification of Metro Manila for Seismic Risk Assessment using Satellite Images
 Urban Classification of Metro Manila for Seismic Risk Assessment using Satellite Images Fumio YAMAZAKI/ yamazaki@edm.bosai.go.jp Hajime MITOMI/ mitomi@edm.bosai.go.jp Yalkun YUSUF/ yalkun@edm.bosai.go.jp
Global hot spot monitoring with Landsat 8 and Sentinel-2. Soushi Kato Atsushi Oda Ryosuke Nakamura (AIST)
") Global hot spot monitoring with Landsat 8 and Sentinel-2 Soushi Kato Atsushi Oda Ryosuke Nakamura (AIST) Motivation for Detecting Hot Spots Hotspot detection using satellite data To monitor wildfire and
Global hot spot monitoring with Landsat 8 and Sentinel-2 Soushi Kato Atsushi Oda Ryosuke Nakamura (AIST) Motivation for Detecting Hot Spots Hotspot detection using satellite data To monitor wildfire and
Preparing for the exploitation of Sentinel-2 data for agriculture monitoring. JACQUES Damien, DEFOURNY Pierre UCL-Geomatics Lab 2 octobre 2013
 Preparing for the exploitation of Sentinel-2 data for agriculture monitoring JACQUES Damien, DEFOURNY Pierre UCL-Geomatics Lab 2 octobre 2013 Agriculture monitoring, why? - Growing speculation on food
Feedback on Level-1 data from CCI projects
 Feedback on Level-1 data from CCI projects R. Hollmann, Cloud_cci Background Following this years CMUG meeting & Science Leader discussion on Level 1 CCI projects ingest a lot of level 1 satellite data
Remote Sensing Data Sources Outlook
 Remote Sensing Data Sources Outlook Dr Arnold Dekker Earth Observation Informatics FSP UN Big Data for Official Statistics Abu Dhabi 20-22 nd October 2015 EARTH OBSERVATION INFORMATICS FUTURE SCIENCE PLATFORM
Remote Sensing Platforms
 Types of Platforms Lighter-than-air Remote Sensing Platforms Free floating balloons Restricted by atmospheric conditions Used to acquire meteorological/atmospheric data Blimps/dirigibles Major role - news
CanImage. (Landsat 7 Orthoimages at the 1: Scale) Standards and Specifications Edition 1.0
 Standards and Specifications Edition 1.0") CanImage (Landsat 7 Orthoimages at the 1:50 000 Scale) Standards and Specifications Edition 1.0 Centre for Topographic Information Customer Support Group 2144 King Street West, Suite 010 Sherbrooke, QC
CanImage (Landsat 7 Orthoimages at the 1:50 000 Scale) Standards and Specifications Edition 1.0 Centre for Topographic Information Customer Support Group 2144 King Street West, Suite 010 Sherbrooke, QC
Relationship Between Landsat 8 Spectral Reflectance and Chlorophyll-a in Grand Lake, Oklahoma
 Relationship Between Landsat 8 Spectral Reflectance and Chlorophyll-a in Grand Lake, Oklahoma Presented by: Abu Mansaray Research Team Dr. Andrew Dzialowski (PI), Oklahoma State University Dr. Scott Stoodley
ASSESSMENT OF HAIL DAMAGE TO CROPS USING SATELLITE IMAGERY AND HAND HELD HYPERSPECTRAL DATA
 Abstract ASSESSMENT OF HAIL DAMAGE TO CROPS USING SATELLITE IMAGERY AND HAND HELD HYPERSPECTRAL DATA 1 Owen Chandler, 2 Frank Young, and 2 Armando Apan 1 Freemans Toowoomba Suite 1 382 Ruthven Street,
Example of Analysis of Yield or Landsat Data Based on Assessing the Consistently Lowest 20 Percent by Using
 GIS Ag Maps www.gisagmaps.com Example of Analysis of Yield or Landsat Data Based on Assessing the Consistently Lowest 20 Percent by Using Soil Darkness, Flow Accumulation, Convex Areas, and Sinks Two aspects
BV NNET User manual. V0.2 (Draft) Rémi Lecerf, Marie Weiss
 Rémi Lecerf, Marie Weiss") BV NNET User manual V0.2 (Draft) Rémi Lecerf, Marie Weiss 1. Introduction... 2 2. Installation... 2 3. Prerequisites... 2 3.1. Image file format... 2 3.2. Retrieving atmospheric data... 3 3.2.1. Using
BV NNET User manual V0.2 (Draft) Rémi Lecerf, Marie Weiss 1. Introduction... 2 2. Installation... 2 3. Prerequisites... 2 3.1. Image file format... 2 3.2. Retrieving atmospheric data... 3 3.2.1. Using
Multi-Resolution Analysis of MODIS and ASTER Satellite Data for Water Classification
 Corina Alecu, Simona Oancea National Meteorological Administration 97 Soseaua Bucuresti-Ploiesti, 013686, Sector 1, Bucharest Romania corina.alecu@meteo.inmh.ro Emily Bryant Dartmouth Flood Observatory,
ASTER and USGS EROS Emergency Imaging for Hurricane Disasters
 ASTER and USGS EROS Emergency Imaging for Hurricane Disasters By Kenneth A. Duda and Michael Abrams Satellite images have been extremely useful in a variety of emergency response activities, including
Govt. Engineering College Jhalawar Model Question Paper Subject- Remote Sensing & GIS
 Govt. Engineering College Jhalawar Model Question Paper Subject- Remote Sensing & GIS Time: Max. Marks: Q1. What is remote Sensing? Explain the basic components of a Remote Sensing system. Q2. What is
ROLE OF SATELLITE DATA APPLICATION IN CADASTRAL MAP AND DIGITIZATION OF LAND RECORDS DR.T. RAVISANKAR GROUP HEAD (LRUMG) RSAA/NRSC/ISRO /DOS HYDERABAD
 RSAA/NRSC/ISRO /DOS HYDERABAD") ROLE OF SATELLITE DATA APPLICATION IN CADASTRAL MAP AND DIGITIZATION OF LAND RECORDS DR.T. RAVISANKAR GROUP HEAD (LRUMG) RSAA/NRSC/ISRO /DOS HYDERABAD WORKSHOP on Best Practices under National Land Records
ROLE OF SATELLITE DATA APPLICATION IN CADASTRAL MAP AND DIGITIZATION OF LAND RECORDS DR.T. RAVISANKAR GROUP HEAD (LRUMG) RSAA/NRSC/ISRO /DOS HYDERABAD WORKSHOP on Best Practices under National Land Records
On the use of water color missions for lakes in 2021
 Lakes and Climate: The Role of Remote Sensing June 01-02, 2017 On the use of water color missions for lakes in 2021 Cédric G. Fichot Department of Earth and Environment 1 Overview 1. Past and still-ongoing
CHAPTER 7: Multispectral Remote Sensing
 CHAPTER 7: Multispectral Remote Sensing REFERENCE: Remote Sensing of the Environment John R. Jensen (2007) Second Edition Pearson Prentice Hall Overview of How Digital Remotely Sensed Data are Transformed
Ground Truth for Calibrating Optical Imagery to Reflectance
 Visual Information Solutions Ground Truth for Calibrating Optical Imagery to Reflectance The by: Thomas Harris Whitepaper Introduction: Atmospheric Effects on Optical Imagery Remote sensing of the Earth
Remote Sensing Platforms
 Remote Sensing Platforms Remote Sensing Platforms - Introduction Allow observer and/or sensor to be above the target/phenomena of interest Two primary categories Aircraft Spacecraft Each type offers different
Summary. Introduction. Remote Sensing Basics. Selecting a Remote Sensing Product
 K. Dalsted, J.F. Paris, D.E. Clay, S.A. Clay, C.L. Reese, and J. Chang SSMG-40 Selecting the Appropriate Satellite Remote Sensing Product for Precision Farming Summary Given the large number of satellite
typical spectral signatures of photosynthetically active and non-photosynthetically active vegetation (Beeri et al., 2007)
") typical spectral signatures of photosynthetically active and non-photosynthetically active vegetation (Beeri et al., 2007) Xie, Y. et al. J Plant Ecol 2008 1:9-23; doi:10.1093/jpe/rtm005 Copyright restrictions
typical spectral signatures of photosynthetically active and non-photosynthetically active vegetation (Beeri et al., 2007) Xie, Y. et al. J Plant Ecol 2008 1:9-23; doi:10.1093/jpe/rtm005 Copyright restrictions
Evaluation of Sentinel-2 bands over the spectrum
 Evaluation of Sentinel-2 bands over the spectrum S.E. Hosseini Aria, M. Menenti, Geoscience and Remote sensing Department Delft University of Technology, Netherlands 1 outline ointroduction - Concept odata
Remote sensing in archaeology from optical to lidar. Krištof Oštir ModeLTER Scientific Research Centre of the Slovenian Academy of Sciences and Arts
 Remote sensing in archaeology from optical to lidar Krištof Oštir ModeLTER Scientific Research Centre of the Slovenian Academy of Sciences and Arts Introduction Optical remote sensing Systems Search for
Abstract Quickbird Vs Aerial photos in identifying man-made objects
 Abstract Quickbird Vs Aerial s in identifying man-made objects Abdullah Mah abdullah.mah@aramco.com Remote Sensing Group, emap Division Integrated Solutions Services Department (ISSD) Saudi Aramco, Dhahran
Update on Landsat Program and Landsat Data Continuity Mission
 Update on Landsat Program and Landsat Data Continuity Mission Dr. Jeffrey Masek LDCM Deputy Project Scientist NASA GSFC, Code 923 November 21, 2002 Draft LDCM Implementation Phase RFP Overview Page 1 Celebrate!
Potential of ASTER and LANDSAT Images for Mapping Features in Western Desert
 522 Potential of ASTER and LANDSAT Images for Mapping Features in Western Desert Mahmoud El Nokrashy Osman Ali, Ibrahim Fathy Mohamed Shaker, Nasr Mohammady Saba Abstract: In Egypt, most of the topographic
Image Registration Issues for Change Detection Studies
 Image Registration Issues for Change Detection Studies Steven A. Israel Roger A. Carman University of Otago Department of Surveying PO Box 56 Dunedin New Zealand israel@spheroid.otago.ac.nz Michael R.
Satellite data processing and analysis: Examples and practical considerations
 Satellite data processing and analysis: Examples and practical considerations Dániel Kristóf Ottó Petrik, Róbert Pataki, András Kolesár International LCLUC Regional Science Meeting in Central Europe Sopron,
Land Cover Analysis to Determine Areas of Clear-cut and Forest Cover in Olney, Montana. Geob 373 Remote Sensing. Dr Andreas Varhola, Kathry De Rego
 1 Land Cover Analysis to Determine Areas of Clear-cut and Forest Cover in Olney, Montana Geob 373 Remote Sensing Dr Andreas Varhola, Kathry De Rego Zhu an Lim (14292149) L2B 17 Apr 2016 2 Abstract Montana
Monitoring of Mosul Reservoir Using Remote Sensing Techniques For the Period After ISIS Attack in 9 June Muthanna Mohammed Abdulhameed AL Bayati
 For the Period After ISIS Attack in 9 June 2014 Lecture: University of Technology Baghdad- Building and Construction Dept 1- Introduction The Mosul Dam is the fourth largest dam in the Middle East,(1)established
How Farmer Can Utilize Drone Mapping?
 Presented at the FIG Working Week 2017, May 29 - June 2, 2017 in Helsinki, Finland How Farmer Can Utilize Drone Mapping? National Land Survey of Finland Finnish Geospatial Research Institute Roope Näsi,
Remote Sensing and GIS
 Remote Sensing and GIS Atmosphere Reflected radiation, e.g. Visible Emitted radiation, e.g. Infrared Backscattered radiation, e.g. Radar (λ) Visible TIR Radar & Microwave 11/9/2017 Geo327G/386G, U Texas,
FUSION User Workshop
 FUSION User Workshop FUSION High Resolution Land Monitoring by Fusion of Optical and Infrared Data Normal temperature applications such as agricultural monitoring Lilit Kocharyan, RapidEye AG Gefördert
Remote Sensing of the Environment An Earth Resource Perspective John R. Jensen Second Edition
 Remote Sensing of the Environment An Earth Resource Perspective John R. Jensen Second Edition Pearson Education Limited Edinburgh Gate Harlow Essex CM20 2JE England and Associated Companies throughout
Remote Sensing for Rangeland Applications
 Remote Sensing for Rangeland Applications Jay Angerer Ecological Training June 16, 2012 Remote Sensing The term "remote sensing," first used in the United States in the 1950s by Ms. Evelyn Pruitt of the
2017 REMOTE SENSING EVENT TRAINING STRATEGIES 2016 SCIENCE OLYMPIAD COACHING ACADEMY CENTERVILLE, OH
 2017 REMOTE SENSING EVENT TRAINING STRATEGIES 2016 SCIENCE OLYMPIAD COACHING ACADEMY CENTERVILLE, OH This presentation was prepared using draft rules. There may be some changes in the final copy of the
1. Theory of remote sensing and spectrum
 1. Theory of remote sensing and spectrum 7 August 2014 ONUMA Takumi Outline of Presentation Electromagnetic wave and wavelength Sensor type Spectrum Spatial resolution Spectral resolution Mineral mapping
Geo/SAT 2 INTRODUCTION TO REMOTE SENSING
 Geo/SAT 2 INTRODUCTION TO REMOTE SENSING Paul R. Baumann, Professor Emeritus State University of New York College at Oneonta Oneonta, New York 13820 USA COPYRIGHT 2008 Paul R. Baumann Introduction Remote
STRIPING NOISE REMOVAL OF IMAGES ACQUIRED BY CBERS 2 CCD CAMERA SENSOR
 STRIPING NOISE REMOVAL OF IMAGES ACQUIRED BY CBERS 2 CCD CAMERA SENSOR a E. Amraei a, M. R. Mobasheri b MSc. Electrical Engineering department, Khavaran Higher Education Institute, erfan.amraei7175@gmail.com
University of Texas at San Antonio EES 5053 Term Project CORRELATION BETWEEN NDVI AND SURFACE TEMPERATURES USING LANDSAT ETM + IMAGERY NEWFEL MAZARI
 University of Texas at San Antonio EES 5053 Term Project CORRELATION BETWEEN NDVI AND SURFACE TEMPERATURES USING LANDSAT ETM + IMAGERY NEWFEL MAZARI Introduction and Objectives The present study is a correlation
MOVING FROM PIXELS TO PRODUCTS
 TRUE COLOR RGB MOSAIC, OSAKA, JAPAN MOVING FROM PIXELS TO PRODUCTS and data to insight AUTOMATED STRUCTURE IDENTIFICATION, OSAKA, JAPAN Table of Contents Moving from Pixels to Products 3 Doubling the Spectral
GEO/EVS 425/525 Unit 9 Aerial Photograph and Satellite Image Rectification
 GEO/EVS 425/525 Unit 9 Aerial Photograph and Satellite Image Rectification You have seen satellite imagery earlier in this course, and you have been looking at aerial photography for several years. You
New Evaluation Techniques of Hyperspectral Data
 New Evaluation Techniques of Hyperspectral Data Veronika KOZMA-BOGNÁR Georgikon Faculty, University of Pannonia Keszthely, H-8360, Hungary and József BERKE Basic and Technical Sciences Institute, Dennis
Atmospheric interactions; Aerial Photography; Imaging systems; Intro to Spectroscopy Week #3: September 12, 2018
 GEOL 1460/2461 Ramsey Introduction/Advanced Remote Sensing Fall, 2018 Atmospheric interactions; Aerial Photography; Imaging systems; Intro to Spectroscopy Week #3: September 12, 2018 I. Quick Review from