Visual Data Mining of Remote Sensing Data
|
|
|
- Christina Houston
- 5 years ago
- Views:
Transcription
1 Visual Data Mining of Remote Sensing Data Jürgen Symanzik*, Utah State University, Logan, UT * sunfs.math..math.usu.edu WWW: usu.edu/~ /~symanzik with Louise Griffith, Rob Gillies, Di Cook, Jim Majure, Nicholas Lewin-Koh, Noel Cressie, Sigbert Klinke
2 Visual Data Mining Definitions Software Techniques Contents Examples Live Demos
3 Data Mining Ed Wegman: Data Mining is Exploratory Data Analysis with Little or No Human Interaction using Computationally Feasible Techniques, i.e., the Attempt to find Interesting Structure unknown a priori
4 Visual Data Mining (1) Working Definition: Find structure (cluster, unusual observations) in large and not necessarily homogeneous data sets based on human perception using graphical methods and user interaction Goal or expected outcome of exploration usually unknown in advance
5 Visual Data Mining (2) First uses of the term: Cox, Eick,, Wills, Brachman (1997): Visual Data Mining: Recognizing Telephone Calling Fraud, Data Mining and Knowledge Discovery, Vol.. 1, pp Inselberg (1998): Visual Data Mining with Parallel Coordinates, Computational Statistics, Vol.. 13(1), pp
6 Software: XGobi/GGobi GGobi Swayne,, Cook and Buja Interactive environment for exploring multivariate data *Linked views allow linked brushing * Univariate, Bivariate and Multivariate views of the data *Grand tour *Wide variety of methods *Open source *Free Caveats *XGobi only on UNIX and Linux platforms *GGobi also available for PCs but not yet fully developed
7 Software: ArcView ESRI TM Desktop GIS with wide Range of Viewing and Data Manipulation Functions Editing Features Query Operations Map Display Interactive Interface High Level Internal Scripting Language
8 Software: ExplorN/CrystalVision Wegman, Luo,, Carr Interactive environment for exploring multivariate data (similar to XGobi/GGobi GGobi) *Advanced Parallel Coordinates Displays *3D Surfaces *Stereoscopic Displays Caveats *ExplorN only on SGI platforms *CrystalVision available for PCs but not yet fully developed *No interface to GIS software


9 Tools: Linked Brushing XGobi ArcView

10 ExplorN Tools: Parallel Coordinate Plots

11 Tools: Scatterplot Matrix & Density Plot ExplorN
12 Tools: Grand Tour Continuous random sequence of projections from n dimensions into 2 (or more) dimensions.
13 Examples Historical Examples Vermont/New Hampshire:» Quarry, Water, Clouds Atlanta» City, Forest California (Imperial Valley)» Fields North Africa» Desert
14 Stat Graphics & Remote Sensing Buja,, McDonald, Michalak, Stuetzle (1991) & McDonald, Willis (1987): Confluence of 2 Rivers Klein, Moreira (1994): Agricultural Region in Brazil Scott (1986): Agricultural Scene on 5 Days Salch,, Scott (1997): 3 Groups of Farm Crops Carr (1991): Nevada Test Site
15 ArcView/XGobi XGobi/XploReXploRe & Remote Sensing Symanzik, Majure,, Cook (1996, 1997) Cook, Majure,, Symanzik, Cressie (1996) Symanzik, Cook, Klinke, Lewin (1998) Symanzik, Griffiths, Gillies (2000)
16 The Vermont/New Hampshire Data Landsat Thematic Mapper (TM) data 6 Spectral Bands Outstanding Water Body is Connecticut River


17 VT/NH: Field/Quarry/Water


18 Field/Quarry/Clouds??


19 Water = Water??
20 The Atlanta Data NOAA-14 Satellite (National Oceanic and Atmospheric Administration) AVHRR Sensor (Advanced Very High Resolution Radiometer) Band 1: Red Band 2: Near Infrared Band 3: Mid Infrared Band 4: Long Infrared Band 5: (Very) Long Infrared (Advanced Very High Resolution Radiometer): Data from NASA s Project Atlanta 18 Days from Jan 1997 to Dec 1997 Resolution: 1 km x 1 km per Pixel Main Study Area: 70 km x 46 km
21 Some Definitions Normalized Difference Vegetation Index: NDVI = Band 2 Band2 + Band1 Band1 NDVI ~ 0.8 for Highly Vegetated Surfaces NDVI ~ 0.1 for Bare Soil Surface Radiant Temperature T 0 : Band 4 Surface Moisture Availability M 0
, = 0.2, = 0.4, = 0.6, = 0.8, and = 1.")
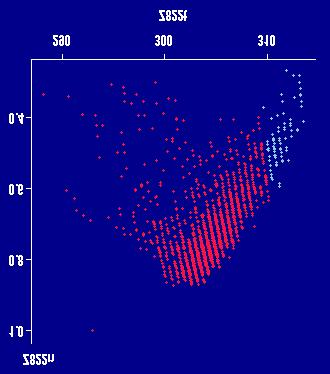
22 An Example NS001-TMS derived T o -NDVI scatterplot (gray spectral scaling) at a 5 meter spatial resolution for a 7 x 3 km area of the Mahantango Watershed, Pennsylvania. 18 July 1990, 1145 LST. Isopleths representing moisture availability index, M o are overlaid with the legend, ο = 0.0 ( warm edge), = 0.2, = 0.4, = 0.6, = 0.8, and = 1.0 (cold edge).


23 The Main Study Area
24 NDVI vs Surface Temperature


25 Two Months December August


26 December The City August
27 August Clouds in August

28 Reclassification December Linked December August


29 2 Pixels of Interest December Linked December August
30 The Imperial Valley/CA Data Landsat-4 Thematic Mapper (TM) Data December 12, Spectral Bands 124 Fields with known Crop Information

31 Ground Truth


32 Unclassified Pixels?


33 Alfalfa x 2
34 Live Demo GGobi CrystalVision

35 Result CrystalVision
36 Overall Conclusion Visual approach effective to see unexpected structure in data. Combination of different techniques most effective. Can be used for almost all types of RS data.
37 Future Work (1) Enhance new software (GGobi( GGobi, CrystalVision) to operate in a linked environment with GIS software. Allow access to data bases.
 ) for visualization and visual data")
38 Future Work (2) Use 3D environment (CAVE, MiniCAVE) ) for visualization and visual data mining.
39 Contact Jürgen Symanzik sunfs.math..math.usu.edu Website usu.edu/~ /~symanzik
Visual Data Mining and the MiniCAVE Jürgen Symanzik Utah State University, Logan, UT
 Visual Data Mining and the MiniCAVE Jürgen Symanzik Utah State University, Logan, UT *e-mail: symanzik@sunfs.math.usu.edu WWW: http://www.math.usu.edu/~symanzik Contents Visual Data Mining Software & Tools
APCAS/10/21 April 2010 ASIA AND PACIFIC COMMISSION ON AGRICULTURAL STATISTICS TWENTY-THIRD SESSION. Siem Reap, Cambodia, April 2010
 APCAS/10/21 April 2010 Agenda Item 8 ASIA AND PACIFIC COMMISSION ON AGRICULTURAL STATISTICS TWENTY-THIRD SESSION Siem Reap, Cambodia, 26-30 April 2010 The Use of Remote Sensing for Area Estimation by Robert
An Introduction to Remote Sensing & GIS. Introduction
 An Introduction to Remote Sensing & GIS Introduction Remote sensing is the measurement of object properties on Earth s surface using data acquired from aircraft and satellites. It attempts to measure something
Spectral Signatures. Vegetation. 40 Soil. Water WAVELENGTH (microns)
") Spectral Signatures % REFLECTANCE VISIBLE NEAR INFRARED Vegetation Soil Water.5. WAVELENGTH (microns). Spectral Reflectance of Urban Materials 5 Parking Lot 5 (5=5%) Reflectance 5 5 5 5 5 Wavelength (nm)
Spectral Signatures % REFLECTANCE VISIBLE NEAR INFRARED Vegetation Soil Water.5. WAVELENGTH (microns). Spectral Reflectance of Urban Materials 5 Parking Lot 5 (5=5%) Reflectance 5 5 5 5 5 Wavelength (nm)
Satellite Remote Sensing: Earth System Observations
 Satellite Remote Sensing: Earth System Observations Land surface Water Atmosphere Climate Ecosystems 1 EOS (Earth Observing System) Develop an understanding of the total Earth system, and the effects of
9/12/2011. Training Course Remote Sensing Basic Theory & Image Processing Methods September 2011
 Training Course Remote Sensing Basic Theory & Image Processing Methods 19 23 September 2011 Popular Remote Sensing Sensors & their Selection Michiel Damen (September 2011) damen@itc.nl 1 Overview Low resolution
Satellite Imagery and Remote Sensing. DeeDee Whitaker SW Guilford High EES & Chemistry
 Satellite Imagery and Remote Sensing DeeDee Whitaker SW Guilford High EES & Chemistry whitakd@gcsnc.com Outline What is remote sensing? How does remote sensing work? What role does the electromagnetic
Remote Sensing for Rangeland Applications
 Remote Sensing for Rangeland Applications Jay Angerer Ecological Training June 16, 2012 Remote Sensing The term "remote sensing," first used in the United States in the 1950s by Ms. Evelyn Pruitt of the
Introduction to Remote Sensing
 Introduction to Remote Sensing Spatial, spectral, temporal resolutions Image display alternatives Vegetation Indices Image classifications Image change detections Accuracy assessment Satellites & Air-Photos
Lecture 13: Remotely Sensed Geospatial Data
 Lecture 13: Remotely Sensed Geospatial Data A. The Electromagnetic Spectrum: The electromagnetic spectrum (Figure 1) indicates the different forms of radiation (or simply stated light) emitted by nature.
Urban Classification of Metro Manila for Seismic Risk Assessment using Satellite Images
 Urban Classification of Metro Manila for Seismic Risk Assessment using Satellite Images Fumio YAMAZAKI/ yamazaki@edm.bosai.go.jp Hajime MITOMI/ mitomi@edm.bosai.go.jp Yalkun YUSUF/ yalkun@edm.bosai.go.jp
MULTISPECTRAL IMAGE PROCESSING I
 TM1 TM2 337 TM3 TM4 TM5 TM6 Dr. Robert A. Schowengerdt TM7 Landsat Thematic Mapper (TM) multispectral images of desert and agriculture near Yuma, Arizona MULTISPECTRAL IMAGE PROCESSING I SENSORS Multispectral
NON-PHOTOGRAPHIC SYSTEMS: Multispectral Scanners Medium and coarse resolution sensor comparisons: Landsat, SPOT, AVHRR and MODIS
 NON-PHOTOGRAPHIC SYSTEMS: Multispectral Scanners Medium and coarse resolution sensor comparisons: Landsat, SPOT, AVHRR and MODIS CLASSIFICATION OF NONPHOTOGRAPHIC REMOTE SENSORS PASSIVE ACTIVE DIGITAL
Module 11 Digital image processing
 Introduction Geo-Information Science Practical Manual Module 11 Digital image processing 11. INTRODUCTION 11-1 START THE PROGRAM ERDAS IMAGINE 11-2 PART 1: DISPLAYING AN IMAGE DATA FILE 11-3 Display of
NORMALIZING ASTER DATA USING MODIS PRODUCTS FOR LAND COVER CLASSIFICATION
 NORMALIZING ASTER DATA USING MODIS PRODUCTS FOR LAND COVER CLASSIFICATION F. Gao a, b, *, J. G. Masek a a Biospheric Sciences Branch, NASA Goddard Space Flight Center, Greenbelt, MD 20771, USA b Earth
Introduction. Introduction. Introduction. Introduction. Introduction
 Identifying habitat change and conservation threats with satellite imagery Extinction crisis Volker Radeloff Department of Forest Ecology and Management Extinction crisis Extinction crisis Conservationists
What we can see from space; and how to link it to data and statistics
 What we can see from space; and how to link it to data and statistics Mohammed Said 1, Shem Kifugo 1, Madelene Ostwald 2, Gert Nyberg 3, and Lance Robinson 1 1 International Livestock Research Institute,
University of Texas at San Antonio EES 5053 Term Project CORRELATION BETWEEN NDVI AND SURFACE TEMPERATURES USING LANDSAT ETM + IMAGERY NEWFEL MAZARI
 University of Texas at San Antonio EES 5053 Term Project CORRELATION BETWEEN NDVI AND SURFACE TEMPERATURES USING LANDSAT ETM + IMAGERY NEWFEL MAZARI Introduction and Objectives The present study is a correlation
Southern Africa Fire Network overview
 Southern Africa Fire Network overview - 2017 Estimation of live fuel moisture content Implementation of Dr Marta Yebra s FMC algorithm Currently running om MODIS MCD 43 c6 Applied on Sentinel 2 and
Overview of how remote sensing is used by the wildland fire community.
 Overview of how remote sensing is used by the wildland fire community. Presented to the ASEN 6210 Remote Sensing Seminar on 2/18/04 by: Jeff Baranyi ESRI Denver Reported by Gary Fager. Images are from
Image transformations
 Image transformations Digital Numbers may be composed of three elements: Atmospheric interference (e.g. haze) ATCOR Illumination (angle of reflection) - transforms Albedo (surface cover) Image transformations
CHARACTERISTICS OF REMOTELY SENSED IMAGERY. Spatial Resolution
 CHARACTERISTICS OF REMOTELY SENSED IMAGERY Spatial Resolution There are a number of ways in which images can differ. One set of important differences relate to the various resolutions that images express.
Seasonal Progression of the Normalized Difference Vegetation Index (NDVI)
") Seasonal Progression of the Normalized Difference Vegetation Index (NDVI) For this exercise you will be using a series of six SPOT 4 images to look at the phenological cycle of a crop. The images are SPOT
Seasonal Progression of the Normalized Difference Vegetation Index (NDVI) For this exercise you will be using a series of six SPOT 4 images to look at the phenological cycle of a crop. The images are SPOT
Interpreting land surface features. SWAC module 3
 Interpreting land surface features SWAC module 3 Interpreting land surface features SWAC module 3 Different kinds of image Panchromatic image True-color image False-color image EMR : NASA Echo the bat
Introduction of Satellite Remote Sensing
 Introduction of Satellite Remote Sensing Spatial Resolution (Pixel size) Spectral Resolution (Bands) Resolutions of Remote Sensing 1. Spatial (what area and how detailed) 2. Spectral (what colors bands)
The techniques with ERDAS IMAGINE include:
 The techniques with ERDAS IMAGINE include: 1. Data correction - radiometric and geometric correction 2. Radiometric enhancement - enhancing images based on the values of individual pixels 3. Spatial enhancement
REMOTE SENSING. Topic 10 Fundamentals of Digital Multispectral Remote Sensing MULTISPECTRAL SCANNERS MULTISPECTRAL SCANNERS
 REMOTE SENSING Topic 10 Fundamentals of Digital Multispectral Remote Sensing Chapter 5: Lillesand and Keifer Chapter 6: Avery and Berlin MULTISPECTRAL SCANNERS Record EMR in a number of discrete portions
Sommersemester Prof. Dr. Christoph Kleinn Institut für Waldinventur und Waldwachstum Arbeitsbereich Fernerkundung und Waldinventur.
 Basics of Remote Sensing Some literature references Franklin, SE 2001 Remote Sensing for Sustainable Forest Management Lewis Publishers 407p Lillesand, Kiefer 2000 Remote Sensing and Image Interpretation
Land Cover Type Changes Related to. Oil and Natural Gas Drill Sites in a. Selected Area of Williams County, ND
 Land Cover Type Changes Related to Oil and Natural Gas Drill Sites in a Selected Area of Williams County, ND FR 3262/5262 Lab Section 2 By: Andrew Kernan Tyler Kaebisch Introduction: In recent years, there
Remote Sensing. The following figure is grey scale display of SPOT Panchromatic without stretching.
 Remote Sensing Objectives This unit will briefly explain display of remote sensing image, geometric correction, spatial enhancement, spectral enhancement and classification of remote sensing image. At
GEOG432: Remote sensing Lab 3 Unsupervised classification
 GEOG432: Remote sensing Lab 3 Unsupervised classification Goal: This lab involves identifying land cover types by using agorithms to identify pixels with similar Digital Numbers (DN) and spectral signatures
RGB colours: Display onscreen = RGB
 RGB colours: http://www.colorspire.com/rgb-color-wheel/ Display onscreen = RGB DIGITAL DATA and DISPLAY Myth: Most satellite images are not photos Photographs are also 'images', but digital images are
Keywords: Agriculture, Olive Trees, Supervised Classification, Landsat TM, QuickBird, Remote Sensing.
 Classification of agricultural fields by using Landsat TM and QuickBird sensors. The case study of olive trees in Lesvos island. Christos Vasilakos, University of the Aegean, Department of Environmental
TEMPORAL ANALYSIS OF MULTI EPOCH LANDSAT GEOCOVER IMAGES IN ZONGULDAK TESTFIELD
 TEMPORAL ANALYSIS OF MULTI EPOCH LANDSAT GEOCOVER IMAGES IN ZONGULDAK TESTFIELD Şahin, H. a*, Oruç, M. a, Büyüksalih, G. a a Zonguldak Karaelmas University, Zonguldak, Turkey - (sahin@karaelmas.edu.tr,
GE 113 REMOTE SENSING
 GE 113 REMOTE SENSING Topic 8. Image Classification and Accuracy Assessment Lecturer: Engr. Jojene R. Santillan jrsantillan@carsu.edu.ph Division of Geodetic Engineering College of Engineering and Information
366 Glossary. Popular method for scale drawings in a computer similar to GIS but without the necessity for spatial referencing CEP
 366 Glossary GISci Glossary ASCII ASTER American Standard Code for Information Interchange Advanced Spaceborne Thermal Emission and Reflection Radiometer Computer Aided Design Circular Error Probability
Crop and Irrigation Water Management Using High-resolution Airborne Remote Sensing
 Crop and Irrigation Water Management Using High-resolution Airborne Remote Sensing Christopher M. U. Neale and Hari Jayanthi Dept. of Biological and Irrigation Eng. Utah State University & James L.Wright
Mapping Open Water Bodies with Optical Remote Sensing
 Mapping Open Water Bodies with Optical Remote Sensing M. O Donnell 1,2 and E. Podest 1 1.Jet Propulsion Laboratory, California Institute of Technology 2 Alliance Gertz-Ressler High School, Los Angeles,
How to Access Imagery and Carry Out Remote Sensing Analysis Using Landsat Data in a Browser
 How to Access Imagery and Carry Out Remote Sensing Analysis Using Landsat Data in a Browser Including Introduction to Remote Sensing Concepts Based on: igett Remote Sensing Concept Modules and GeoTech
GEOG432: Remote sensing Lab 3 Unsupervised classification
 GEOG432: Remote sensing Lab 3 Unsupervised classification Goal: This lab involves identifying land cover types by using agorithms to identify pixels with similar Digital Numbers (DN) and spectral signatures
REMOTE SENSING FOR FLOOD HAZARD STUDIES.
 REMOTE SENSING FOR FLOOD HAZARD STUDIES. OPTICAL SENSORS. 1 DRS. NANETTE C. KINGMA 1 Optical Remote Sensing for flood hazard studies. 2 2 Floods & use of remote sensing. Floods often leaves its imprint
Remote sensing in archaeology from optical to lidar. Krištof Oštir ModeLTER Scientific Research Centre of the Slovenian Academy of Sciences and Arts
 Remote sensing in archaeology from optical to lidar Krištof Oštir ModeLTER Scientific Research Centre of the Slovenian Academy of Sciences and Arts Introduction Optical remote sensing Systems Search for
An Analysis of Aerial Imagery and Yield Data Collection as Management Tools in Rice Production
 RICE CULTURE An Analysis of Aerial Imagery and Yield Data Collection as Management Tools in Rice Production C.W. Jayroe, W.H. Baker, and W.H. Robertson ABSTRACT Early estimates of yield and correcting
MULTISPECTRAL CHANGE DETECTION AND INTERPRETATION USING SELECTIVE PRINCIPAL COMPONENTS AND THE TASSELED CAP TRANSFORMATION
 MULTSPECTRAL CHANGE DETECTON AND NTERPRETATON USNG SELECTVE PRNCPAL COMPONENTS AND THE TASSELED CAP TRANSFORMATON Abstract Temporal change is typically observed in all six reflective LANDSAT bands. The
Land Cover Analysis to Determine Areas of Clear-cut and Forest Cover in Olney, Montana. Geob 373 Remote Sensing. Dr Andreas Varhola, Kathry De Rego
 1 Land Cover Analysis to Determine Areas of Clear-cut and Forest Cover in Olney, Montana Geob 373 Remote Sensing Dr Andreas Varhola, Kathry De Rego Zhu an Lim (14292149) L2B 17 Apr 2016 2 Abstract Montana
Sources of Geographic Information
 Sources of Geographic Information Data properties: Spatial data, i.e. data that are associated with geographic locations Data format: digital (analog data for traditional paper maps) Data Inputs: sampled
746A27 Remote Sensing and GIS. Multi spectral, thermal and hyper spectral sensing and usage
 746A27 Remote Sensing and GIS Lecture 3 Multi spectral, thermal and hyper spectral sensing and usage Chandan Roy Guest Lecturer Department of Computer and Information Science Linköping University Multi
White Paper. Medium Resolution Images and Clutter From Landsat 7 Sources. Pierre Missud
 White Paper Medium Resolution Images and Clutter From Landsat 7 Sources Pierre Missud Medium Resolution Images and Clutter From Landsat7 Sources Page 2 of 5 Introduction Space technologies have long been
Introduction to Remote Sensing
 Introduction to Remote Sensing Outline Remote Sensing Defined Resolution Electromagnetic Energy (EMR) Types Interpretation Applications Remote Sensing Defined Remote Sensing is: The art and science of
Lecture 6: Multispectral Earth Resource Satellites. The University at Albany Fall 2018 Geography and Planning
 Lecture 6: Multispectral Earth Resource Satellites The University at Albany Fall 2018 Geography and Planning Outline SPOT program and other moderate resolution systems High resolution satellite systems
GIS Data Collection. Remote Sensing
 GIS Data Collection Remote Sensing Data Collection Remote sensing Introduction Concepts Spectral signatures Resolutions: spectral, spatial, temporal Digital image processing (classification) Other systems
Introduction to Remote Sensing Fundamentals of Satellite Remote Sensing. Mads Olander Rasmussen
 Introduction to Remote Sensing Fundamentals of Satellite Remote Sensing Mads Olander Rasmussen (mora@dhi-gras.com) 01. Introduction to Remote Sensing DHI What is remote sensing? the art, science, and technology
Application of Satellite Image Processing to Earth Resistivity Map
 Application of Satellite Image Processing to Earth Resistivity Map KWANCHAI NORSANGSRI and THANATCHAI KULWORAWANICHPONG Power System Research Unit School of Electrical Engineering Suranaree University
Statistical Analysis of SPOT HRV/PA Data
 Statistical Analysis of SPOT HRV/PA Data Masatoshi MORl and Keinosuke GOTOR t Department of Management Engineering, Kinki University, Iizuka 82, Japan t Department of Civil Engineering, Nagasaki University,
Introduction to Remote Sensing Part 1
 Introduction to Remote Sensing Part 1 A Primer on Electromagnetic Radiation Digital, Multi-Spectral Imagery The 4 Resolutions Displaying Images Corrections and Enhancements Passive vs. Active Sensors Radar
The USGEO Satellite Needs process provides the firstever whole-of-government approach to identifying desired satellite products across the civilian
 Observations (USGEO) Satellite Needs Identifying Federal Satellite User Needs Glenn Bethel / USDA SNWG Co-Chair The USGEO Satellite Needs process provides the firstever whole-of-government approach to
NASA Missions and Products: Update. Garik Gutman, LCLUC Program Manager NASA Headquarters Washington, DC
 NASA Missions and Products: Update Garik Gutman, LCLUC Program Manager NASA Headquarters Washington, DC 1 JPSS-2 (NOAA) SLI-TBD Formulation in 2015 RBI OMPS-Limb [[TSIS-2]] [[TCTE]] Land Monitoring at
Outline for today. Geography 411/611 Remote sensing: Principles and Applications. Remote sensing: RS for biogeochemical cycles
 Geography 411/611 Remote sensing: Principles and Applications Thomas Albright, Associate Professor Laboratory for Conservation Biogeography, Department of Geography & Program in Ecology, Evolution, & Conservation
SEA GRASS MAPPING FROM SATELLITE DATA
 JSPS National Coordinators Meeting, Coastal Marine Science 19 20 May 2008 Melaka SEA GRASS MAPPING FROM SATELLITE DATA Mohd Ibrahim Seeni Mohd, Nurul Hazrina Idris, Samsudin Ahmad 1. Introduction PRESENTATION
Geo/SAT 2 INTRODUCTION TO REMOTE SENSING
 Geo/SAT 2 INTRODUCTION TO REMOTE SENSING Paul R. Baumann, Professor Emeritus State University of New York College at Oneonta Oneonta, New York 13820 USA COPYRIGHT 2008 Paul R. Baumann Introduction Remote
Geo/SAT 2 MAP MAKING IN THE INFORMATION AGE
 Geo/SAT 2 MAP MAKING IN THE INFORMATION AGE Professor Paul R. Baumann Department of Geography State University of New York College at Oneonta Oneonta, New York 13820 USA COPYRIGHT 2008 Paul R. Baumann
8th ESA ADVANCED TRAINING COURSE ON LAND REMOTE SENSING
 Urban Mapping Practical Sebastian van der Linden, Akpona Okujeni, Franz Schug Humboldt Universität zu Berlin Instructions for practical Summary The Urban Mapping Practical introduces students to the work
IKONOS High Resolution Multispectral Scanner Sensor Characteristics
 High Spatial Resolution and Hyperspectral Scanners IKONOS High Resolution Multispectral Scanner Sensor Characteristics Launch Date View Angle Orbit 24 September 1999 Vandenberg Air Force Base, California,
2017 REMOTE SENSING EVENT TRAINING STRATEGIES 2016 SCIENCE OLYMPIAD COACHING ACADEMY CENTERVILLE, OH
 2017 REMOTE SENSING EVENT TRAINING STRATEGIES 2016 SCIENCE OLYMPIAD COACHING ACADEMY CENTERVILLE, OH This presentation was prepared using draft rules. There may be some changes in the final copy of the
Satellite data processing and analysis: Examples and practical considerations
 Satellite data processing and analysis: Examples and practical considerations Dániel Kristóf Ottó Petrik, Róbert Pataki, András Kolesár International LCLUC Regional Science Meeting in Central Europe Sopron,
Land cover change methods. Ned Horning
 Land cover change methods Ned Horning Version: 1.0 Creation Date: 2004-01-01 Revision Date: 2004-01-01 License: This document is licensed under a Creative Commons Attribution-Share Alike 3.0 Unported License.
M. Ellen Dean and Roger M. Hoffer Department of Forestry and Natural Resources. Purdue University, West Lafayette, Indiana
 Evaluation of Thematic Mapper Data and Computer-aided Analysis Techniques for Mapping Forest Cover M. Ellen Dean and Roger M. Hoffer Department of Forestry and Natural Resources Laboratory for Applications
EVALUATION OF THE EXTENSION AND DEGRADATION OF MANGROVE AREAS IN SERGIPE STATE WITH REMOTE SENSING DATA
 EVALUATION OF THE EXTENSION AND DEGRADATION OF MANGROVE ABSTRACT AREAS IN SERGIPE STATE WITH REMOTE SENSING DATA Myrian M. Abdon Ernesto G.M.Vieira Carmem R.S. Espindola Alberto W. Setzer Instituto de
Fundamentals of Remote Sensing
 Climate Variability, Hydrology, and Flooding Fundamentals of Remote Sensing May 19-22, 2015 GEO-Latin American & Caribbean Water Cycle Capacity Building Workshop Cartagena, Colombia 1 Objective To provide
Enhancement of Multispectral Images and Vegetation Indices
 Enhancement of Multispectral Images and Vegetation Indices ERDAS Imagine 2016 Description: We will use ERDAS Imagine with multispectral images to learn how an image can be enhanced for better interpretation.
Introduction to image processing for remote sensing: Practical examples
 Università degli studi di Roma Tor Vergata Corso di Telerilevamento e Diagnostica Elettromagnetica Anno accademico 2010/2011 Introduction to image processing for remote sensing: Practical examples Dr.
REMOTE SENSING INTERPRETATION
 REMOTE SENSING INTERPRETATION Jan Clevers Centre for Geo-Information - WU Remote Sensing --> RS Sensor at a distance EARTH OBSERVATION EM energy Earth RS is a tool; one of the sources of information! 1
First Exam: Thurs., Sept 28
 8 Geographers Tools: Gathering Information Prof. Anthony Grande Hunter College Geography Lecture design, content and presentation AFG 0917. Individual images and illustrations may be subject to prior copyright.
First Exam. Geographers Tools: Gathering Information. Photographs and Imagery. SPIN 2 Image of Downtown Atlanta, GA 1995 REMOTE SENSING 9/19/2016
 First Exam Geographers Tools: Gathering Information Prof. Anthony Grande Hunter College Geography Lecture design, content and presentation AFG 0616. Individual images and illustrations may be subject to
A map says to you, 'Read me carefully, follow me closely, doubt me not.' It says, 'I am the Earth in the palm of your hand. Without me, you are alone
 A map says to you, 'Read me carefully, follow me closely, doubt me not.' It says, 'I am the Earth in the palm of your hand. Without me, you are alone and lost. Beryl Markham (West With the Night, 1946
AVHRR/3 Operational Calibration
 AVHRR/3 Operational Calibration Jörg Ackermann, Remote Sensing and Products Division 1 Workshop`Radiometric Calibration for European Missions, 30/31 Aug. 2017`,Frascati (EUM/RSP/VWG/17/936014) AVHRR/3
Remote Sensing Part 3 Examples & Applications
 Remote Sensing Part 3 Examples & Applications Review: Spectral Signatures Review: Spectral Resolution Review: Computer Display of Remote Sensing Images Individual bands of satellite data are mapped to
Center for Advanced Land Management Information Technologies (CALMIT), School of Natural Resources, University of Nebraska-Lincoln
, School of Natural Resources, University of Nebraska-Lincoln") Geoffrey M. Henebry, Andrés Viña, and Anatoly A. Gitelson Center for Advanced Land Management Information Technologies (CALMIT), School of Natural Resources, University of Nebraska-Lincoln Introduction
Geoffrey M. Henebry, Andrés Viña, and Anatoly A. Gitelson Center for Advanced Land Management Information Technologies (CALMIT), School of Natural Resources, University of Nebraska-Lincoln Introduction
The studies began when the Tiros satellites (1960) provided man s first synoptic view of the Earth s weather systems.
 provided man s first synoptic view of the Earth s weather systems.") Remote sensing of the Earth from orbital altitudes was recognized in the mid-1960 s as a potential technique for obtaining information important for the effective use and conservation of natural resources.
Remote sensing of the Earth from orbital altitudes was recognized in the mid-1960 s as a potential technique for obtaining information important for the effective use and conservation of natural resources.
Remote Sensing Phenology. Bradley Reed Principal Scientist USGS National Center for Earth Resources Observation and Science Sioux Falls, SD
 Remote Sensing Phenology Bradley Reed Principal Scientist USGS National Center for Earth Resources Observation and Science Sioux Falls, SD Remote Sensing Phenology Potential to provide wall-to-wall phenology
Geo/SAT 2 TROPICAL WET REALMS OF CENTRAL AFRICA, PART II
 Geo/SAT 2 TROPICAL WET REALMS OF CENTRAL AFRICA, PART II Paul R. Baumann Professor of Geography (Emeritus) State University of New York College at Oneonta Oneonta, New York 13820 USA COPYRIGHT 2009 Paul
Introduction to Remote Sensing
 Introduction to Remote Sensing Daniel McInerney Urban Institute Ireland, University College Dublin, Richview Campus, Clonskeagh Drive, Dublin 14. 16th June 2009 Presentation Outline 1 2 Spaceborne Sensors
Lecture Notes Prepared by Prof. J. Francis Spring Remote Sensing Instruments
 Lecture Notes Prepared by Prof. J. Francis Spring 2005 Remote Sensing Instruments Material from Remote Sensing Instrumentation in Weather Satellites: Systems, Data, and Environmental Applications by Rao,
SEN3APP Stakeholder Workshop, Helsinki Yrjö Rauste/VTT Kaj Andersson/VTT Eija Parmes/VTT
 Optical Products from Sentinel-2 and Suomi- NPP/VIIRS SEN3APP Stakeholder Workshop, Helsinki 19.11.2015 Yrjö Rauste/VTT Kaj Andersson/VTT Eija Parmes/VTT Structure of Presentation High-resolution data
to Geospatial Technologies
 What s in a Pixel? A Primer for Remote Sensing What s in a Pixel Development UNH Cooperative Extension Geospatial Technologies Training Center Shane Bradt UConn Cooperative Extension Geospatial Technology
Using Freely Available. Remote Sensing to Create a More Powerful GIS
 Using Freely Available Government Data and Remote Sensing to Create a More Powerful GIS All rights reserved. ENVI, E3De, IAS, and IDL are trademarks of Exelis, Inc. All other marks are the property of
Remote Sensing. Measuring an object from a distance. For GIS, that means using photographic or satellite images to gather spatial data
 Remote Sensing Measuring an object from a distance For GIS, that means using photographic or satellite images to gather spatial data Remote Sensing measures electromagnetic energy reflected or emitted
In late April of 1986 a nuclear accident damaged a reactor at the Chernobyl nuclear
 CHERNOBYL NUCLEAR POWER PLANT ACCIDENT Long Term Effects on Land Use Patterns Project Introduction: In late April of 1986 a nuclear accident damaged a reactor at the Chernobyl nuclear power plant in Ukraine.
Precision Remote Sensing and Image Processing for Precision Agriculture (PA)
") Precision Remote Sensing and Image Processing for Precision Agriculture (PA) Dr. Jack F. Paris Presented to Colorado State University, Fort Collins, CO October 20, 2005 Speaker s Current Activities: Consultant
Precision Remote Sensing and Image Processing for Precision Agriculture (PA) Dr. Jack F. Paris Presented to Colorado State University, Fort Collins, CO October 20, 2005 Speaker s Current Activities: Consultant
The (False) Color World
 Color World") There s more to the world than meets the eye In this activity, your group will explore: The Value of False Color Images Different Types of Color Images The Use of Contextual Clues for Feature Identification
There s more to the world than meets the eye In this activity, your group will explore: The Value of False Color Images Different Types of Color Images The Use of Contextual Clues for Feature Identification
The studies began when the Tiros satellites (1960) provided man s first synoptic view of the Earth s weather systems.
 provided man s first synoptic view of the Earth s weather systems.") Remote sensing of the Earth from orbital altitudes was recognized in the mid-1960 s as a potential technique for obtaining information important for the effective use and conservation of natural resources.
Remote sensing of the Earth from orbital altitudes was recognized in the mid-1960 s as a potential technique for obtaining information important for the effective use and conservation of natural resources.
Passive Microwave Sensors LIDAR Remote Sensing Laser Altimetry. 28 April 2003
 Passive Microwave Sensors LIDAR Remote Sensing Laser Altimetry 28 April 2003 Outline Passive Microwave Radiometry Rayleigh-Jeans approximation Brightness temperature Emissivity and dielectric constant
Green/Blue Metrics Meeting June 20, 2017 Summary
 Short round table introductions of participants Paul Villenueve, Carleton, Co-lead Green/Blue, Matilda van den Bosch, UBC, Co-lead Green/Blue Dan Crouse, UNB Lorien Nesbitt, UBC Audrey Smargiassi, Uof
Preparing for the exploitation of Sentinel-2 data for agriculture monitoring. JACQUES Damien, DEFOURNY Pierre UCL-Geomatics Lab 2 octobre 2013
 Preparing for the exploitation of Sentinel-2 data for agriculture monitoring JACQUES Damien, DEFOURNY Pierre UCL-Geomatics Lab 2 octobre 2013 Agriculture monitoring, why? - Growing speculation on food
Summary. Introduction. Remote Sensing Basics. Selecting a Remote Sensing Product
 K. Dalsted, J.F. Paris, D.E. Clay, S.A. Clay, C.L. Reese, and J. Chang SSMG-40 Selecting the Appropriate Satellite Remote Sensing Product for Precision Farming Summary Given the large number of satellite
Textural analysis of coca plantations using 1-meter-resolution remotely-sensed data
 UNODC Workshop, 25-28 November, Bogota, Colombia 1 Textural analysis of coca plantations using 1-meter-resolution remotely-sensed data Workshop on Measurement of Cultivation and Production of Coca Leaves
SMEX05 Multispectral Radiometer Data: Iowa
 Notice to Data Users: The documentation for this data set was provided solely by the Principal Investigator(s) and was not further developed, thoroughly reviewed, or edited by NSIDC. Thus, support for
Mod. 2 p. 1. Prof. Dr. Christoph Kleinn Institut für Waldinventur und Waldwachstum Arbeitsbereich Fernerkundung und Waldinventur
 Histograms of gray values for TM bands 1-7 for the example image - Band 4 and 5 show more differentiation than the others (contrast=the ratio of brightest to darkest areas of a landscape). - Judging from
VALIDATION OF THE CLOUD AND CLOUD SHADOW ASSESSMENT SYSTEM FOR LANDSAT IMAGERY (CASA-L VERSION 1.3)
") GDA Corp. VALIDATION OF THE CLOUD AND CLOUD SHADOW ASSESSMENT SYSTEM FOR LANDSAT IMAGERY (-L VERSION 1.3) GDA Corp. has developed an innovative system for Cloud And cloud Shadow Assessment () in Landsat
GDA Corp. VALIDATION OF THE CLOUD AND CLOUD SHADOW ASSESSMENT SYSTEM FOR LANDSAT IMAGERY (-L VERSION 1.3) GDA Corp. has developed an innovative system for Cloud And cloud Shadow Assessment () in Landsat
What is Remote Sensing? Contents. Image Fusion in Remote Sensing. 1. Optical imagery in remote sensing. Electromagnetic Spectrum
 Contents Image Fusion in Remote Sensing Optical imagery in remote sensing Image fusion in remote sensing New development on image fusion Linhai Jing Applications Feb. 17, 2011 2 1. Optical imagery in remote