Dual-FL Operation Manual (30 Nov 2012) Dual-FL. Operation Manual.
|
|
|
- Eleanor Pearson
- 5 years ago
- Views:
Transcription
1
2


3 Dual-FL Operation Manual i
4 Copyright 2012 by HORIBA Instruments Incorporated. All rights reserved. No part of this work may be reproduced, stored, in a retrieval system, or transmitted in any form by any means, including electronic or mechanical, photocopying and recording, without prior written permission from HORIBA Instruments Incorporated. Requests for permission should be requested in writing. Origin is a registered trademark of OriginLab Corporation. Alconox is a registered trademark of Alconox, Inc. Ludox is a registered trademark of W.R. Grace and Co. Teflon is a registered trademark of E.I. du Pont de Nemours and Company. Windows is a trademark of Microsoft Corporation. Information in this manual is subject to change without notice, and does not represent a commitment on the part of the vendor. November 2012 Part Number J ii
5 Table of Contents 0: Introduction About the Dual-FL Chapter overview Disclaimer Safety summary Risks of ultraviolet exposure Additional risks of xenon lamps CE compliance statement : Spectroscopy and the Dual-FL Introduction Overview of analysis of samples Flowchart for typical Dual-FL EEM experiments : Requirements & Installation Safety-training requirements Surface requirements Environmental requirements Electrical requirements Unpacking and Installation Software emulation : System Description Introduction Basic theory of operation Optical layout : System Operation Introduction Power switch Turning on the system Validating system performance : Data-Acquisition Introduction to Dual-FL software Experiment Menu button Previous Experiment Menu button Auto Run Previous Experiment button IFE button Rayleigh Masking button Normalize button Run JY Batch Experiments button Switch menu between HJY Software Application and Origin Pro button Quinine Sulfate Units button Profile Tool button Rescale Y button : Various Experiment Types Introduction Absorbance spectra Two-dimensional emission spectra Three-dimensional emission spectra Kinetics spectra Single-point spectra Running an unknown sample : Troubleshooting Troubleshooting table Using diagnostic spectra iii
6 Further assistance : Data-Optimization Introduction Filtering Dilution and concentration ph Temperature Cuvette : Maintenance Introduction Lamp replacement : Components & Accessories Itemized list of Dual-FL accessories FL-1013 Liquid Nitrogen Dewar Assembly Sample cells F Fiber Optic Mount and 1950 Fiber Optic Bundles FL Four-Position Thermostatted Cell Holder FL Dual-Position Thermostatted Cell Holder FL Single-Position Thermostatted Cell Holder J1933 Solid Sample Holder OFR 150-W Xenon Lamp FL Injector Port F-3030 Temperature Bath : Technical Specifications Introduction Absorbance Fluorescence Instrument Minimum host-computer requirements Software : Glossary : Bibliography : Compliance Information Declaration of Conformity Supplementary Information : Index iv
7 0: Introduction About the Dual-FL Introduction The Dual-FL is a self-contained, fully automated spectrofluorometer system. Data output is viewed on a PC, while printouts may be obtained via an optional plotter or printer. All Dual-FL functions are under the control of Dual-FL spectroscopy software. The main parts of the Dual-FL spectrofluorometer systems are: State-of-the-art optical components A personal computer Dual-FL for Windows, the driving software. This manual explains how to operate and maintain a Dual-FL spectrofluorometer. The manual also describes measurements and tests essential to obtain accurate data. For a complete discussion of Dual-FL software, refer to the Dual-FL User s Guide (especially regarding software installation) and the on-line help for Origin, which accompany the system. Note: Keep this and the other reference manuals near the system. 0-1
8 Chapter overview 1: Spectroscopy and the Dual- FL Introduction Introduction to fluorescence and absorption spectroscopy, as well as kinetic analysis, using the Dual-FL. 2: Requirements & Installation Power and environmental requirements; select the best spot for the instrument. 3: System Description How the Dual-FL works. 4: System Operation Operation of the spectrofluorometer system, and calibration instructions. 5: Data-Acquisition How to use the special Dual-FL software buttons to acquire and plot data; how to determine peaks in an unknown sample. 6: Instrumental and Spectral Correction 7: Post-Acquisition EEM Analysis How to correct for inhomogeneities in the optical path and sample. How to perform data-analysis on an excitation-emission matrix data-set. 8: Data-Optimization Hints for improving the signal-to-noise ratio, instructions for obtaining corrected data, and other information useful for optimizing data and ensuring reproducibility. 9: Maintenance Routine maintenance procedures such as replacing the lamp. 10: Components & Accessories Accessories available for the Dual-FL, and how to use them. 11: Technical Specifications Instrument specifications and computer requirements. 12: Glossary Some useful technical terms related to fluorescence and absorption spectroscopy. 13: Bibliography Other important sources of information. 14: Declaration of Conformity 15: Index 0-2
9 Disclaimer Introduction By setting up or starting to use any HORIBA Instruments Incorporated product, you are accepting the following terms: You are responsible for understanding the information contained in this document. You should not rely on this information as absolute or all-encompassing; there may be local issues (in your environment) not addressed in this document that you may need to address, and there may be issues or procedures discussed that may not apply to your situation. If you do not follow the instructions or procedures contained in this document, you are responsible for yourself and your actions and all resulting consequences. If you rely on the information contained in this document, you are responsible for: Adhering to safety procedures Following all precautions Referring to additional safety documentation, such as Material Safety Data Sheets (MSDS), when advised As a condition of purchase, you agree to use safe operating procedures in the use of all products supplied by HORIBA Instruments Incorporated, including those specified in the MSDS provided with any chemicals and all warning and cautionary notices, and to use all safety devices and guards when operating equipment. You agree to indemnify and hold HORIBA Instruments Incorporated harmless from any liability or obligation arising from your use or misuse of any such products, including, without limitation, to persons injured directly or indirectly in connection with your use or operation of the products. The foregoing indemnification shall in no event be deemed to have expanded HORIBA Instruments Incorporated s liability for the products. HORIBA Instruments Incorporated products are not intended for any general cosmetic, drug, food, or household application, but may be used for analytical measurements or research in these fields. A condition of HORIBA Instruments Incorporated s acceptance of a purchase order is that only qualified individuals, trained and familiar with procedures suitable for the products ordered, will handle them. Training and maintenance procedures may be purchased from HORIBA Instruments Incorporated at an additional cost. HORIBA Instruments Incorporated cannot be held responsible for actions your employer or contractor may take without proper training. Due to HORIBA Instruments Incorporated s efforts to continuously improve our products, all specifications, dimensions, internal workings, and operating procedures are subject to change without notice. All specifications and measurements are approximate, based on a standard configuration; results may vary with the application and environment. Any software manufactured by HORIBA Instruments Incorporated is also under constant development and subject to change without notice. Any warranties and remedies with respect to our products are limited to those provided in writing as to a particular product. In no event shall HORIBA Instruments Incorpo- 0-3
10 Introduction rated be held liable for any special, incidental, indirect or consequential damages of any kind, or any damages whatsoever resulting from loss of use, loss of data, or loss of profits, arising out of or in connection with our products or the use or possession thereof. HORIBA Instruments Incorporated is also in no event liable for damages on any theory of liability arising out of, or in connection with, the use or performance of our hardware or software, regardless of whether you have been advised of the possibility of damage. 0-4
11 Safety summary Introduction The following general safety precautions must be observed during all phases of operation of this instrument. Failure to comply with these precautions or with specific warnings elsewhere in this manual violates safety standards of design, manufacture and intended use of instrument. HORIBA Instruments Incorporated assumes no liability for the customer s failure to comply with these requirements. Certain symbols are used throughout the text for special conditions when operating the instruments: A WARNING notice denotes a hazard. It calls attention to an operating procedure, practice, or similar that, if incorrectly performed or adhered to, Warning: could result in personal injury or death. Do not proceed beyond a WARNING notice until the indicated conditions are fully understood and met. HORIBA Instruments Incorporated is not responsible for damage arising out of improper use of the equipment. Caution: Caution: A CAUTION notice denotes a hazard. It calls attention to an operating procedure, practice, or similar that, if incorrectly performed or adhered to, could result in damage to the product. Do not proceed beyond a CAUTION notice until the indicated conditions are fully understood and met. HORIBA Instruments Incorporated is not responsible for damage arising out of improper use of the equipment. Ultraviolet light! Wear protective goggles, fullface shield, skin-protection clothing, and UVblocking gloves. Do not stare into light. Caution: Intense ultraviolet, visible, or infrared light! Wear light-protective goggles, full-face shield, skinprotection clothing, and light-blocking gloves. Do not stare into light. Caution: Extreme cold! Cryogenic materials must always be handled with care. Wear protective goggles, fullface shield, skin-protection clothing, and insulated gloves. 0-5


12 Caution: Introduction Explosion hazard! Wear explosion-proof goggles, full-face shield, skin-protection clothing, and protective gloves. Caution: Risk of electric shock! This symbol warns the user that un-insulated voltage within the unit may have sufficient magnitude to cause electric shock. Caution: Danger to fingers! This symbol warns the user that the equipment is heavy, and can crush or injure the hand if precautions are not taken. Caution: This symbol cautions the user that excessive humidity, if present, can damage certain equipment. Caution: Hot! This symbol warns the user that hot equipment may be present, and could create a risk of fire or burns. Read this manual before using or servicing the instrument. Wear protective gloves. Wear appropriate safety goggles to protect the eyes. 0-6
13 Wear an appropriate face-shield to protect the face. Introduction Note: General information is given concerning operation of the equipment. 0-7
14 Risks of ultraviolet exposure Introduction Caution: This instrument is used in conjunction with ultraviolet light. Exposure to these radiations, even reflected or diffused, can result in serious, and sometimes irreversible, eye and skin injuries. Overexposure to ultraviolet rays threatens human health by causing: Immediate painful sunburn Skin cancer Eye damage Immune-system suppression Premature aging Do not aim the UV light at anyone. Do not look directly into the light. Always wear protective goggles, full-face shield and skin protection clothing and gloves when using the light source. Light is subdivided into visible light, ranging from 400 nm (violet) to 700 nm (red); longer infrared, above red or > 700nm, also called heat; and shorter ultraviolet radiation (UVR), below violet or < 400nm. UVR is further subdivided into UV-A or near-uv ( nm), also called black (invisible) light; UV-B or mid-uv ( nm), which is more skin penetrating; and UV-C or far-uv (< 290 nm). Health effects of exposure to UV light are familiar to anyone who has had sunburn. However, the UV light level around some UV equipment greatly exceeds the level found in nature. Acute (short-term) effects include redness or ulceration of the skin. At high levels of exposure, these burns can be serious. For chronic exposures, there is also a cumulative risk of harm. This risk depends upon the amount of exposure during your lifetime. The long-term risks for large cumulative exposure include premature aging of the skin, wrinkles and, most seriously, skin cancer and cataract. Damage to vision is likely following exposure to high-intensity UV radiation. In adults, more than 99% of UV radiation is absorbed by the anterior structures of the eye. UVR can contribute to the development of age-related cataract, pterygium, photodermatitis, and cancer of the skin around the eye. It may also contribute to age-related macular degeneration. Like the skin, the covering of the eye or the cornea, is epithelial tissue. The danger to the eye is enhanced by the fact that light can enter from all angles around the eye and not only in the direction of vision. This is especially true while working in a dark environment, as the pupil is wide open. The lens can also be damaged, but because the cornea acts as a filter, the chances are re- 0-8
15 Introduction duced. This should not lessen the concern over lens damage however, because cataracts are the direct result of lens damage. Burns to the eyes are usually more painful and serious than a burn to the skin. Make sure your eye protection is appropriate for this work. NORMAL EYEGLASSES OR CONTACTS OFFER VERY LIMITED PROTECTION! Training Caution: UV exposures are not immediately felt. The user may not realize the hazard until it is too late and the damage is done. For the use of UV sources, new users must be trained by another member of the laboratory who, in the opinion of the member of staff in charge of the department, is sufficiently competent to give instruction on the correct procedure. Newly trained users should be overseen for some time by a competent person. 0-9
16 Additional risks of xenon lamps Introduction Among the dangers associated with xenon lamps are: Burns caused by contact with a hot xenon lamp. Fire ignited by hot xenon lamp. Warning: Xenon lamps are dangerous. Please read the following precautions. Interaction of other nearby chemicals with intense ultraviolet, visible, or infrared radiation. Damage caused to apparatus placed close to the xenon lamp. Explosion or mechanical failure of the xenon lamp. Visible radiation Any very bright visible light source will cause a human aversion response: we either blink or turn our head away. Although we may see a retinal afterimage (which can last for several minutes), the aversion response time (about 0.25 seconds) normally protects our vision. This aversion response should be trusted and obeyed. NEVER STARE AT ANY BRIGHT LIGHT-SOURCE FOR AN EXTENDED PERIOD. Overriding the aversion response by forcing yourself to look at a bright light-source may result in permanent injury to the retina. This type of injury can occur during a single prolonged exposure. Excessive exposure to visible light can result in skin and eye damage. Visible light sources that are not bright enough to cause retinal burns are not necessarily safe to view for an extended period. In fact, any sufficiently bright visible light source viewed for an extended period will eventually cause degradation of both night and color vision. Appropriate protective filters are needed for any light source that causes viewing discomfort when viewed for an extended period of time. For these reasons, prolonged viewing of bright light sources should be limited by the use of appropriate filters. The blue-light wavelengths ( nm) present a unique hazard to the retina by causing photochemical effects similar to those found in UV-radiation exposure. Infrared radiation Infrared (or heat) radiation is defined as having a wavelength between 780 nm and 1 mm. Specific biological effectiveness bands have been defined by the CIE (Commission Internationale de l Eclairage or International Commission on Illumination) as follows: IR-A (near IR) ( nm) IR-B (mid IR) ( nm) IR-C (far IR) (3000 nm 1 mm) 0-10
17 Introduction The skin and eyes absorb infrared radiation (IR) as heat. Workers normally notice excessive exposure through heat sensation and pain. Infrared radiation in the IR-A that enters the human eye will reach (and can be focused upon) the sensitive cells of the retina. For high irradiance sources in the IR-A, the retina is the part of the eye that is at risk. For sources in the IR-B and IR-C, both the skin and the cornea may be at risk from flash burns. In addition, the heat deposited in the cornea may be conducted to the lens of the eye. This heating of the lens is believed to be the cause of so called glassblowers cataracts because the heat transfer may cause clouding of the lens. Retinal IR Hazards (780 to 1400 nm): possible retinal lesions from acute high irradiance exposures to small dimension sources. Lens IR Hazards (1400 to 1900 nm): possible cataract induction from chronic lower irradiance exposures. Corneal IR Hazards (1900 nm to 1 mm): possible flashburns from acute high irradiance exposures. Who is likely to be injured? The user and anyone exposed to the radiation or xenon lamp shards as a result of faulty procedures. Injuries may be slight to severe. 0-11
18 CE compliance statement Introduction The Dual-FL spectrofluorometer is tested for compliance with both the EMC Directive 2004/108/EEC and the Low Voltage Directive for Safety 2006/95/EEC, and bears the international CE mark as indication of this compliance. HORIBA Instruments Incorporated guarantees the product line s CE compliance only when original HORIBA Instruments Incorporated supplied parts are used. Chapter 14 herein provides a table of all CE Compliance tests and standards used to qualify this product. 0-12
19 Spectroscopy and the Dual-FL 1 : Spectroscopy and the Dual- FL Introduction The Dual-FL spectrometer combines both fluorescence and absorbance measurements simultaneously with matching optical bandpass resolution. Simultaneous acquisition can be very important for accurate spectral analysis of photoluminescent materials and solutions. The main advantages the Dual-FL provides for simultaneous fluorescence and absorbance analysis include: Absorbance spectral information can be used to immediately correct the fluorescence spectrum for the inner-filter-effects (IFEs) involving both the excitation lightabsorption and fluorescence reabsorption in the sample cuvette; Simultaneous acquisition under the same bandpass resolution eases true matching of spectral features required for accurate inner-filter-effect correction; Simultaneous measurement allows monitoring of photobleaching of materials, which may be very sensitive to UV wavelengths of the exciting light used to measure the absorbance and excite fluorescence; Excitation and absorbance wavelengths are scanned from low-energy to highenergy (red to UV) to reduce the exposure of the sample to UV and hence photobleaching; Absorbance data provide additional and often vital concentration-dependent information on non-fluorescent compounds in the fluorophore sample; IFE correction often greatly reduces analysis and sample-preparation time, and increases accuracy by eliminating error-prone dilution procedures and their recordkeeping. 1-1
20 Spectroscopy and the Dual-FL Overview of analysis of samples Spectral correction: Wavelength-dependent detector response Because most quantitative studies rely on comparison to traceable spectral and concentration standard samples, the spectral-correction of the EEM is of prime concern. A typical EEM scans the sample across the excitation wavelengths from about nm, and across the emission wavelengths from nm. Bandpass and resolution are typically (and fixed in the Dual-FL to) 5 nm. To account for variations in the excitation beam s intensity, a reference detector, R, collects a small fraction of the excitation beam, and the emission detector s output, S, is ratioed to the reference detector signal (S/R). However, the instrument s optical responsivity is not ideal throughout the wavelengthrange of the experiment, so a series of instrumental spectral correction-factors must be used to obtain reproducible ideal spectra that are traceable to established, calibrated spectral standard samples, detectors, and light sources. Dark-current signals must be subtracted, respectively, from both the S and R detector signals. The S and R detectors signals must also be respectively multiplied by the excitation (X correct ) and emission (M correct ) spectral correction factors. It follows that the final signal plotted as a function of wavelength in an EEM involves both the corrected reference signal, R c, R c R dark X correct and the corrected emission-detector signal, S c, S c S dark M correct The final fluorescence signal recorded is thus S c /R c for both the sample to be evaluated and for a representative reference or blank sample as discussed below. Simultaneous to the EEM, the sample s spectral transmittance and absorbance properties can be recorded with the Dual-FL. From the Beer-Lambert law, absorbance defined as Abs = εcl, where ε is the extinction coefficient, c is the concentration and l is the pathlength of the sample cell. Within the Dual-FL, the transmission detector signal, A c = A dark signal, is used to calculate the Abs and transmittance (T) values. The transmission detector s signal, A c, is also corrected for the excitation-source intensity measured using the reference detector signal (R c ) formulated above as A c /R c = I 0 from a representative blank or reference sample and I = A c /R c from the sample to be evaluated as per below. For measurements of solutions, the blank or reference sample is usually the solvent without any luminescent material. The transmission, percent transmission and absorbance values Abs λ at a given wavelength λ are calculated as follows: 1-2
21 Spectroscopy and the Dual-FL T λ I I 0 % T λ 100 Abs = log(t) I I 0 EEM spectral correction: blank-subtraction, Rayleighmasking and Raman scattering The current practice for EEMs involves measuring the excitation and emission scanranges, which includes their overlap regions. These overlap regions manifest in intense signals from the scattered photons from the monochromatic excitation source in the emission detector s response. These lines are caused by both the first- (and second-) order Rayleigh-scattering features consistent with the well-known grating equation. Additionally another spectral feature, associated water samples, is the water Raman scattering line. The Raman scattering line is related to the Rayleigh scattering line by a constant energy shift of 3382 cm 1 for water. Raman lines can also be seen for other solvents or materials at other energy levels (wavelengths). EEM data are usually processed to remove both the Rayleigh and Raman scattering features systematically. The Dual- FL software package can remove both artifacts. Subtraction of the blank EEM from the sample EEM effectively removes the Raman scatter line. Applying a Rayleigh-masking algorithm based on the excitation and emission spectral bandwidth nullifies the signal intensities for both the first- and second-order Rayleigh lines. EEM spectral correction: primary and secondary innerfilter effects Common, recommended practice is to correct the EEM data for inner-filter effects (IFE) using the parallel absorbance measurements from the sample and blank as mentioned above. One obvious criterion for accurate IFE is the requirement for the concentration of the sample to fall within the linear Beer-Lambert region for the absorbance spectral region associated with the EEM. The IFE algorithms used in Dual-FL involve measuring the absorbance spectrum of the sample for the overlapping range of both the excitation and emission spectra to correct for both the primary and secondary IFEs. The basic IFE algorithm employed in the Dual-FL software requires use of conventional 1 1 cm path-length cuvettes. The equation below is applied to each excitation-emission wavelength coordinate of the EEM: A b s Ex Ab sem 10 2 F ideal Fobs. where F ideal is the ideal fluorescence-signal spectrum expected in the absence of IFE, F obs is the observed fluorescence signal, and Abs Ex and Abs Em are the measured absorbance values at the respective excitation and emission wavelength-coordinates. A number of advanced algorithms described in the literature can also account for variations of the optical geometrical parameters of the cuvette path-length, beam- or slit- 1-3
22 Spectroscopy and the Dual-FL width, and positioning/shifting of the cuvette relative to the excitation and emission beam paths. However, the fixed optical geometry of the Dual-FL lends itself to the simple solution above because neither the slit-widths that determine the beam geometry, nor the path-lengths or overlap volume of the absorbance and emission paths are user-adjustable. Moreover, IFE corrections are generally only important when the absorbance values exceed 0.05 in a 1 cm path-length, so there is generally little information to be gained in the EEM from either an extended or shortened path-length cell. The fixed geometry of the Dual-FL further lends the use of the instrument to support valid intra- and inter-laboratory comparisons by eliminating variances in the chief parameters of absorbance and emission path-length. The fixed optical geometry also makes accurate and reproducible spectral correction easy as well as easy validation of such with standard traceable samples. EEM spectral correction: intensity standardization to quinine-sulfate-unit equivalents and water-raman scattering intensity Whereas the absorbance spectral response of the Dual-FL with respect to sample concentration is generally invariant over the lifetime of the instrument, the fluorescencedetection path is subject to changes in the excitation source s intensity and detector response that should be routinely monitored with standard samples and experimental conditions. Moreover, to ease comparison with other instruments and studies, such standardization is conventional and recommended practice. Most commonly the throughput response of a fluorometer including the Dual-FL is measured by evaluating the water-raman scattering intensity under standard conditions of 350 nm excitation and 397 nm emission at 5 nm bandpass for a fixed time interval. 1-4
23 Requirements & Installation 2: Requirements & Installation Safety-training requirements Every user of the Dual-FL must know general and specific safety procedures before operating the instrument. For example, proper training includes (but is not limited to): Understanding the risks of exposure to ultraviolet, visible, and infrared light, and how to avoid unsafe exposures to these types of radiation Handling xenon-lamp bulbs, and their dangers Safe handling for all chemicals and other samples used in the instrument Safety-training may be purchased from HORIBA Scientific. Contact your HORIBA Scientific representative or the HORIBA Scientific Service Department for details. 2-1
24 Surface requirements Requirements & Installation A sturdy table- or bench-top Surface must hold 90 kg (200 lbs.). Surface should be about (69 cm 183 cm) to hold spectrofluorometer, computer, and accessories comfortably. Overhead clearance should be at least 36" (91 cm). 2-2
25 Environmental requirements Temperature F (15 30 C) Maximum temperature fluctuation ± 2 C Ambient relative humidity < 75% Requirements & Installation Caution: Excessive humidity can damage the optics. Low dust levels No special ventilation Caution: For adequate cooling, do not cover, block, or obstruct the vents on the left side and underside of the instrument. 2-3

26 Electrical requirements Requirements & Installation The Dual-FL operates from universal AC single-phase input power over the range of 85 to 250 V AC with a line frequency of 50 to 60 Hz. This AC input power is applied to a two-pole fusing power entry module located on the side of the instrument. This module incorporates two 5 20 mm IEC approved, 4.0 A, 250 V, Time Delay fuses (Cooper Bussman part number GDC-4A or equivalent) to protect against line disturbances or anomalies outside the system s normal operating range. Have enough outlets available for: Host computer (PC) Monitor Optional printer Dual-FL Caution: HORIBA Instruments Incorporated is not liable for damage from line surges and voltage fluctuations. A surge protector is strongly recommended for minor power fluctuations. For more severe voltage variations, use a generator or uninterruptible power supply. Improper line voltages can damage the equipment severely. Warning: The Dual-FL is equipped with a threeconductor power cord that is connected to the system frame (earth) ground. This ground provides a return path for fault current from equipment malfunction or external faults. For all instruments, ground continuity is required for safe operation. Any discontinuity in the ground line can make the instrument unsafe for use. Do not operate this system from an ungrounded source. Note: HORIBA Scientific recommends connecting the host computer, monitor, and printer to a single surge-protector, to make start-up more convenient, and to conserve AC outlets. Connect the Dual-FL to a separate line, if possible, to isolate the xenonlamp power supply inside the Dual-FL. 2-4
27 Unpacking and installation Introduction Requirements & Installation The Dual-FL spectrofluorometer system is delivered in a single packing carton. If a host computer (PC) is ordered as a part of the system, the PC is delivered in a few clearly labeled boxes. All accessories, cables, software, and manuals ordered with the system are included with the delivery. Examine the shipping boxes carefully. Any evidence of damage should be noted on the delivery receipt and signed by representatives of the receiving and carrier companies. Once a location has been chosen, unpack and assemble the equipment as described below. To avoid excessive moving and handling, the equipment should be unpacked as close as possible to the selected location. Note: Many public carriers will not recognize a claim for concealed damage if it is reported later than 15 days after delivery. In case of a claim, inspection by an agent of the carrier is required. For this reason, the original packing material should be retained as evidence of alleged mishandling or abuse. While HORIBA Instruments Incorporated assumes no responsibility for damage occurring during transit, the company will make every effort to aid and advise. Dual-FL carton contents Caution: The spectrofluorometer system is a delicate instrument. Mishandling may seriously damage its components. Quantity Item Part number 1 Dual-FL 1 USB cable J Dual-FL Operation Manual J Set of Allen wrenches (Allen keys) Single-cell sample-holder Power cord (110 V) (220 V) Dual-FL software package 2-5

28 Directions 1 Unpack and set up the Dual-FL. a Carefully open the Dual-FL shipping carton. b c Requirements & Installation Remove the foam-injected top piece and any other shipping restraints in the carton. With assistance, carefully lift the instrument from the carton, and rest it on the side of the laboratory bench where the system will stay. Caution: Watch your fingers! d e f g h i j Place the instrument in its permanent location. Level the spectrofluorometer. Adjust the four leveling feet on the bottom of the instrument. Inspect for previously hidden damage. Notify the carrier and HORIBA Scientific if any is found. Check the packing list to verify that all components and accessories are present. Plug one end of the power cord into the proper receptacle on the left side (while facing the unit) of the spectrofluorometer. Plug one end of the USB cable into the USB receptacle. With an optional trigger accessory, plug one end of the trigger cable into the TRIGGER IN connector on the Dual-FL. Allow the unconnected ends of the cables to dangle freely; they will be connected in later steps. 2-6
29 2 Set up the computer. Requirements & Installation The information gathered by the spectrofluorometer system is displayed and controlled through the host PC via Dual-FL software. The host PC may be purchased from HORIBA Scientific or another supplier. a Set up the host PC reasonably close to the Dual-FL system. The limitation is the length of the USB cable. The recommended location for the PC is just to the right of the spectrofluorometer, but other positions are possible. b Follow the instructions for the host PC to set up the computer system, including the CPU, monitor, keyboard, mouse, speakers, printers, etc. 3 Connect the Dual-FL to the computer. a b Attach the free end of the USB cable to a USB receptacle on the host computer. With all devices OFF, plug the power cords from the monitor, host computer, Dual-FL, and the printer into properly grounded receptacles. c Install any accessories that arrived with the system, using the instructions that accompany the accessories. See Chapter 10 for a detailed list of accessories. 4 Install the Dual-FL software. The spectrofluorometer system is controlled by Dual-FL spectroscopy software operating within the Windows environment. If the computer and software were purchased from HORIBA Scientific, the software installation is complete. If the computer is not from HORIBA Scientific, perform the installation. Contact a HORIBA Scientific Sales Representative for recommended specifications for a suitable host computer. Before the Dual-FL software can be installed, however, Windows must be installed already and operating properly. Refer to the Windows manual that came with the computer for installation instructions. The Dual-FL software is supplied on one DVD. Follow the Dual-FL User s Guide for details on installation. Note: Be sure to agree to the terms of the software license before using the software. A USB dongle is supplied with Dual-FL software. This dongle (license) must be connected to the host PC before the Dual-FL software will operate. 2-7
30 Requirements & Installation Users outside of the USA: Users outside of the USA receive a softkey device that connects to the printer port of the host computer for software security. The softkey should be left in place on the host computer at all times. Note: Copying, disassembly, or removal of the softkey is illegal. 2-8
31 Software emulation Requirements & Installation Emulating the Dual-FL software means letting the host computer act as though the Dual-FL is properly connected, even if it isn t. 1 Disconnect the communications cable from the host computer to the Dual-FL. Note: Be sure the Dual-FL USB key is inserted into a free USB port on the host computer. Without the key, the Dual-FL software will not run properly, even in emulation mode. 2 Double-click the software icon to start the Dual-FL software. The instrument initializes, then the Dual-FL main window appears. If there are any difficulties, see the troubleshooting chapter. 3 Click the Experiment Menu button. The System Initialization Process window appears: 2-9

32 Requirements & Installation 4 Choose the Emulate buttons for all components, then click the Next>> button. The Dual-FL Main Experiment Menu opens: 5 Choose an experiment type by clicking one of the four buttons. The Dual-FL Experiment Type window appears (if that experiment has subtypes): 2-10
33 6 Choose a sub-type of experiment, and click the Next >> button. Requirements & Installation The Dual-FL Experiment Setup window appears: Dual-FL software is now emulating the instrument. 2-11
34 Requirements & Installation 2-12
35 Sample ple Dual-FL Operation Manual (30 Nov 2012) 3 : System Description System Description Warning: Do not open the instrument without proper training, appropriate protection, and having read this operation manual. The instrument contains dangerous voltages, ultraviolet, visible, and infrared radiation, and fragile lightsources. In addition, tampering with the optical components can irreversibly damage them. A spectrofluorometer is an analytical instrument used to measure and record the fluorescence of a sample. While recording the fluorescence, the excitation, emission, or both wavelengths may be scanned. With additional accessories, variation of signal with time, temperature, concentration, polarization, or other variables may be monitored. Introduction To measure absorbance, light is shone into the sample, and how much the signal is diminished by traveling through the sample is measured by the detector. Basic theory of operation R channel: Reference excitation-beam intensity collected Monochrom ator A channel: Intensity collected straight through sample Excitation beam Schematic of the Dual-FL S channel: Spectrograph CCD; fluorescence collected 90 from excitation beam A continuous source of light shines onto an excitation monochromator, which selects a band of wavelengths. This monochromatic excitation light is mostly directed onto a 3-1
36 System Description sample, which emits luminescence; a small portion of the excitation light shines onto a reference detector, to use as a normalization for excitation-lamp variations. At rightangles to the excitation beam, the sample s luminescence is directed into a multichannel CCD detector, which reports a fluorescence spectrum. Colinear with the beam, the sample s luminescence is also directed into a single-channel detector. The signals from the detectors are reported to a system controller and host computer, where the data can be manipulated and presented, using special software. 3-2


37 Optical layout System Description Illuminator (xenon arc-lamp, 1) The continuous light source is a 150-W ozone-free xenon arc-lamp. Light from the lamp is collected by a diamondturned elliptical mirror, and then focused on the entrance slit of the excitation monochromator. The lamp housing is separated from the excitation monochromator by a quartz window. This vents heat out of the instrument, and protects against the unlikely occurrence of lamp failure. CW Xe arc lamp 3-3

.")
38 Monochromator (2) The Dual-FL contains a monochromator for selection of the excitation beam. System Description Gratings The essential part of a monochromator is a reflection grating. A grating disperses the incident light by means of its vertical grooves. A Excitation monochromator spectrum is obtained by rotating the gratings, and recording the intensity values at each wavelength. The gratings in the Aqualog contain 1200 grooves mm 1, and are blazed at 250 nm (excitation). Blazing is etching the grooves at a particular angle, to optimize the grating s reflectivity in a particular spectral region. The wavelengths selected are optimal for excitation in the UV and visible. The grating is coated with MgF 2 for protection against oxidation. The system uses a direct drive for the grating, to scan the spectrum at up to 500 nm s 1, with accuracy better than 1.0 nm. Slits The entrance and exit ports of the monochromator have fixed slits set to 5 nm bandpass. The bandpass is determined by the dispersion of the monochromator: bandpass (in nm) = slit width (in mm) dispersion (in nm mm 1 ) Grating The dispersion of the Dual-FL monochromator is 4.25 nm mm 1 for gratings with 1200 grooves mm 1 at 540 nm. Shutters An excitation shutter, standard on the Dual-FL, is located just after the excitation monochromator s exit slit. The shutter protects samples from photobleaching or photodegradation from prolonged exposure to the light source. Dual-FL software controls the shutter, and can set the shutter to automatic or photobleach modes. Caution: Operation of the instrument when the excitation shutter is disabled may expose the user to excessive light. Wear light-blocking goggles or face-shield, and lightblocking clothing and gloves. 3-4

39 Sample compartment (3) A toroidal mirror focuses the beam from the excitation monochromator on the sample. Just before the sample compartment, about 8% of this excitation light is split off, using a beam-splitter, to the reference photodiode. Fluorescence from the sample is then collected at right-angles to the beam, and directed to the multichannel CCD detector. System Description The sample compartment accommodates various optional accessories, as well as fiber-optic bundles to take the excitation beam to a remote sample, and return the emission beam to the detectors. See Chapter 10 for a list of accessories. Sample compartment To insert or remove a sample platform, 1 If a multiple-sample turret is installed, shut off the system. 2 Remove the four screws on the front of the sample platform. 3 Slide out the old platform. 4 Slide in the new platform. 5 If the platform has a rotatable turret or magnetic stirrer, slide the 15-pin connector gently and securely onto the 15-pin receptacle in the sample compartment. 6 Re-attach the four screws on the front of the sample platform. Detectors (4) Each Dual-FL contains three detectors: 3-5


40 Reference detector (4a) System Description The reference detector (mentioned above) monitors the xenon lamp, in order to correct for wavelength- and time-dependent output of the lamp. This detector is a UVenhanced silicon photodiode, which is just before the sample compartment. It requires no external bias, and has good response from nm. Absorption signal detector (4b) The standard absorption signal detector is also a UV-enhanced silicon photodiode, which is after the sample perpendicular to the excitation beam. It requires no external bias, and has good response from nm. Fluorescence detector (4c) At right-angles to the excitation-beam direction is a multichannel CCD detector, to record a full spectrum of luminescence from the sample. The reference and signal detectors have correction-factor files run for them, to correct for wavelength dependencies of each optical component. The files are created at HORIBA Scientific for every instrument, and are automatically applied to data through Dual-FL software. See Chapter 6 for more details. Electronics and controllers (5) The front bottom of the Dual-FL houses the electronics for running the lamp, instrument, scans, and measurements. 3-6

41 System Description Computer system and software (not on diagram) Not shown on the schematic is the host computer with Dual-FL software. The technical specifications chapter lists the computer requirements. An optional printer or network card is useful for printing. Dual-FL software for Windows controls all interaction with the spectrofluorometer. For information on Dual-FL software, see the Dual-FL Software User s Guide and the on-line help files within Dual-FL software. 3-7
42 System Description 3-8

43 4: System Operation Introduction System Operation This chapter explains how to turn on the Dual-FL system, check its calibration, and, if necessary, recalibrate the monochromators. While doing these procedures, how to define a scan, run a scan, and optimize system settings to obtain the best results are explained. Power switch The power switch is located on the lower left-hand side of the instrument. When switched on, the xenon lamp arcs initially, and the Dual-FL turns on, runs through selfdiagnostics, then starts the xenon lamp. Note: Each time the xenon lamp is ignited adds one more hour to lamp use. HORIBA Scientific suggests leaving the lamp on during brief periods of inactivity. 4-1
44 Turning on the system System Operation 1 Turn on the Dual- FL. Turn the power switch to the ON (1) position. 2 Turn on all peripheral devices for the host PC. Peripherals include any printers or plotters. 3 Start the host computer. a Switch on the host computer. b c Click the Dual-FL icon on the Windows desktop. Warning: When the xenon lamp is ignited, a large voltage is applied across the lamp. Therefore, never operate the lamp with the cover removed. An extremely rare occurrence is the explosion of the xenon lamp upon ignition. Therefore, take care in case tiny lamp shards exit the ventilation fans. The instrument initializes, then the Dual-FL window appears. If there are any difficulties, see the troubleshooting chapter. Let the Dual-FL warm up for 30 minutes before proceeding to validation tests. 4-2

45 Validating system performance Introduction System Operation Upon installation and as part of occasional maintenance checks, examine the performance of the Dual-FL. In the Dual-FL software, there are six validation tests to be performed. HORIBA Scientific recommends running these validation tests every three months. The Dual-FL is an autocalibrating spectrofluorometer. This means the system initializes its monochromators drives, locates the home position of the each drive, and assigns a wavelength value to this position from a calibration file. For the calibration checks detailed here, a single-sample mount or automated sample changer should be the only sample-compartment accessories used. The scans shown herein are examples. A Performance Test Report for your new instrument is included with the documentation. Use the Performance Test Report to validate the spectral shape and relative intensity taken during the calibration checks. Note: HORIBA Instruments Incorporated is not responsible for customer errors in calibration. To be sure that your instrument is properly calibrated, call Service for assistance. We can arrange a visit and calibrate your instrument for a fee. 4-3
46 System Operation Absorbance/excitation wavelength accuracy validation This validation check examines the accuracy of the wavelengths scanned using the xenon lamp and absorbance detector, using the Starna RM sample. 1 Start the Dual-FL software. 2 In the Dual-FL main window, choose Collect. A drop-down menu appears. 3 Choose Validation Tests. Another drop-down menu appears. 4 Choose Abs/Ex Wavelength Accuracy. Note: The Quinine Sulfate standard kit, RM-06HLKI-R, is available from Starna Cells, Inc., 5950 Traffic Way, Atascadero, CA 93422; phone: ; ; website is If the instrument has not initialized, initialization occurs. The validation experiment automatically loads with some of the fields grayed out: 4-4
47 System Operation 5 Click the Run button. A message telling you to insert the blank appears: 6 Insert the K 2 Cr 2 O 7 blank with the frosted side toward the front of the instrument, and the clear sides toward the left and right of the instrument. This allows a clear optical path. Optical path Clear side Frosted side Clear side Frosted side Clear side 4-5
 column, there should be all P s (passes). System Operation 9 If the test shows all Pass values, continue to the next test.")
48 7 Close the samplecompartment lid, and click the OK button. The Experiment Status window opens. The validation scan runs. The Project name window appears: 8 Click the Cancel button. A table of the validation test appears. In the D(Y2) column, there should be all P s (passes). System Operation 9 If the test shows all Pass values, continue to the next test. If there are failures, please call the HORIBA Scientific Service Department. 4-6
49 Absorption-accuracy validation System Operation This validation check examines the accuracy of the absorption function of the Dual-FL. Use the absorption standard SRM 935a available from NIST. Note: The absorbance calibration standard kit, RM-06HLKI-R, is available from Starna Cells, Inc., 5950 Traffic Way, Atascadero, CA 93422; phone: ; ; website is 1 In the Dual-FL main window, choose Collect. A drop-down menu appears. 2 Choose Validation Tests. Another drop-down menu appears. 3 Choose Abs Photometric Accuracy (NIST SRM 935a). The validation experiment automatically loads with some of the fields grayed out: 4-7
50 System Operation 4 Click the Run button. A message telling you to insert the blank appears: 5 Insert the K 2 Cr 2 O 7 blank with the frosted side toward the front of the instrument, and the clear sides toward the left and right of the instrument. This allows a clear optical path. Optical path Clear side Frosted side Clear side Frosted side Clear side 4-8
 column, there should be all P s (passes). System Operation 8 If the test shows all Pass values, continue to the next test.")
51 6 Close the samplecompartment lid, and click the OK button. The Experiment Status window opens. The validation scan runs. The Project name window appears: 7 Click the Cancel button. A table of the validation test appears. In the F(Y) column, there should be all P s (passes). System Operation 8 If the test shows all Pass values, continue to the next test. If there are failures, please call the HORIBA Scientific Service Department. 4-9
52 System Operation Water-Raman-peak signal-to-noise and emission calibration validation This validation check examines the wavelength calibration of the CCD detector. It is an emission scan of the Raman-scatter band of water performed in right-angle mode. The water sample should be research-quality, triple-distilled or de-ionized water. Note: Avoid glass or acrylic cuvettes: they may exhibit UV fluorescence or filtering effects. HPLC-grade (18-MΩ spec.) or equivalent water is suggested for the Raman scan. HORIBA Scientific recommends the Starna sealed water-raman sample. Impure samples of water will cause elevated background levels as well as distorted spectra with (perhaps) some unwelcome peaks. Use a 4-mL quartz cuvette. Note: The water Raman sampleis available from Starna Cells, Inc., 5950 Traffic Way, Atascadero, CA 93422; phone: ; ; website is 1 Insert the water sample into the sample compartment. With an automated sample changer, note the position number in which the sample cell is placed. 2 Close the lid of the sample chamber. 3 In the Dual-FL main window, choose Collect. A drop-down menu appears. 4-10

53 4 Choose Validation Tests. Another drop-down menu appears. 5 Choose Water Raman SNR and Emission Calibration. System Operation The validation experiment automatically loads with some of the fields grayed out: 6 Click the Run button. A message telling you to insert the sample appears. 7 Place the Starna water sample in the special sample holder, and mount the sample holder in the sample compartment. 4-11
 is affected by lamp age and alignment, slit settings, and sample purity.")
54 8 Close the sample-compartment lid, and click the OK button. The Experiment Status window opens. The validation scan runs. The Project name window appears: 9 Click the Cancel button. A plot of the validation test appears: System Operation Note: Observed throughput (and hence peak intensity) is affected by lamp age and alignment, slit settings, and sample purity. As the xenon lamp ages, the throughput of the system will decline slowly. Therefore, low water-raman peak intensity may indicate a need to replace the xenon lamp. 10 If the test shows a Pass value, continue to the next test. If the plot displays fail, please call the HORIBA Scientific Service Department. 4-12
55 Fluorescence correction validation with NIST SRM 2941 sample System Operation This validation check examines the accuracy of the fluorescence correction file of the Dual-FL. Use the fluorescence standards (SRM 2941, SRM 2942, and SRM 2943) available from NIST. Note: Fluorescence standards (SRM 2941, SRM 2942, and SRM 2943) are available from National Institute for Standards and Technology (NIST), phone: ; website is 1 In the Dual-FL main window, choose Collect. A drop-down menu appears. 2 Choose Validation Tests. Another drop-down menu appears. 3 Choose Fluorescence Correction (NIST SRM 2941). The validation experiment automatically loads with some of the fields grayed out: 4-13
56 System Operation 4 Click the Run button. A message telling you to insert the blank appears: 5 Insert the 2941 standard with the frosted side toward the front of the instrument (for fluorescence), and the clear sides toward the left and right of the instrument (for absorption). Clear side Clear side Frosted side 4-14
57 6 Close the samplecompartment lid, and click the OK button. The Experiment Status window opens. The validation scan runs. The Project name window appears: 7 Click the Cancel button. A plot of the validation test appears: System Operation 8 If the test shows a Pass value, continue to the next test. If the plot displays fail, please call the HORIBA Scientific Service Department. 4-15
58 Fluorescence correction validation with NIST SRM 2942 sample System Operation This validation check examines the accuracy of the fluorescence correction file of the Dual-FL. 1 In the Dual-FL main window, choose Collect. A drop-down menu appears. 2 Choose Validation Tests. Another drop-down menu appears. 3 Choose Fluorescence Correction (NIST SRM 2942). The validation experiment automatically loads with some of the fields grayed out: 4-16
59 System Operation 4 Click the Run button. A message telling you to insert the blank appears: 5 Insert the 2942 standard with the frosted side toward the front of the instrument (for fluorescence), and the clear sides toward the left and right of the instrument (for absorption). Clear side Clear side Frosted side 4-17
60 6 Close the samplecompartment lid, and click the OK button. The Experiment Status window opens. The validation scan runs. The Project name window appears: 7 Click the Cancel button. A plot of the validation test appears: System Operation 8 If the test shows a Passed value, continue to the next test. If the plot displays fail, please call the HORIBA Scientific Service Department. 4-18
61 Fluorescence correction validation with NIST SRM 2943 sample System Operation This validation check examines the accuracy of the fluorescence correction file of the Dual-FL. 1 In the Dual-FL main window, choose Collect. A drop-down menu appears. 2 Choose Validation Tests. Another drop-down menu appears. 3 Choose Fluorescence Correction (NIST SRM 2943). The validation experiment automatically loads with some of the fields grayed out: 4-19
62 System Operation 4 Click the Run button. A message telling you to insert the blank appears: 5 Insert the 2943 standard with the frosted side toward the front of the instrument (for fluorescence), and the clear sides toward the left and right of the instrument (for absorption). Clear side Clear side Frosted side 4-20

63 6 Close the samplecompartment lid, and click the OK button. The Experiment Status window opens. The validation scan runs. The Project name window appears: 7 Click the Cancel button. A plot of the validation test appears: System Operation 8 If the test shows a Passed value, the Dual-FL is calibrated properly. If the plot displays fail, please call the HORIBA Scientific Service Department. 4-21
64 Calculation of water-raman signal-to-noise ratio System Operation Introduction The water-raman test is a good measure of relative sensitivity between different instruments, if the experimental conditions used to compare the systems are the same. Unfortunately, there are different ways of handling the data, all of which are valid but which will give quite different values. Therefore, it is important not only to know how the water-raman S/N values are measured, but also how the data were treated. The water-raman S/N test method combines a value for system sensitivity (a signal) with a value for system noise (no signal) to show the overall performance of the instrument. Definitions At HORIBA Scientific, we define the S/N ratio of the Dual-FL as the difference of peak and background signals, divided by the root-mean-square of the background signal: S N S peak N S background rms, background Dual-FL S/N method Explicitly, the peak signal (S peak ) is evaluated for a 5 nm interval centered at 397 nm, the background (S background ) is evaluated for a 5 nm integral centered at 450 nm, and the RMS noise of the background (N rms ) is evaluated for the 5 nm integral centered at 450 nm. The experimental conditions include monitoring a 30 s integration time of the dark and sample CCD signals; the former subtracted from the latter to emulate standard experimental conditions and remove any fixed-pattern noise on the CCD not related to the sample s actual light scattering. The CCD-bin interval is 0.82 nm/pixel bin. The signal is interpolated to 0.5 nm interval steps from nm. The measurement is performed at room temperature (25 C). Notes on validation HORIBA Scientific recommends monitoring the number of hours of xenon-lamp use, via the hour meter. The lamp is rated for h, but if the Raman intensity starts to drop below 40%, you may wish to change the lamp sooner. 4-22
65 5: Data-Acquisition Introduction to Dual-FL software Data-Acquisition This chapter presents an introduction to special buttons used in the Dual-FL software to record and present data with the Dual-FL. These buttons, located in Dual-FL s main window, are: Previous Experiment Setup Run JY Batch Experiments Profile Tool Experiment Menu Rayleigh Masking QSU 3D Zoom Auto Run Previous Experiment Rescale Y Switch Menu between HJY software application and Origin Std. IFE Normalize For a detailed description of these Dual-FL routines, see the Dual-FL User s Guide and on-line help. In addition, methods for determining best excitation and emission wavelengths are presented, in case these wavelengths are unknown for the sample. 5-1
66 Experiment Menu button Introduction Data-Acquisition The Experiment Menu button chooses an overall type of experiment to run, such as an emission scan, an absorbance scan, kinetics run, etc., based on the instrument and connected accessories, such as a temperature bath, integrating sphere, etc. Only those scans that can be run using the available hardware configuration are active; scans that cannot be taken are grayed out. Calibration scans for the Dual-FL use default parameters: Excitation monochromator: Spectra/Excitation scan Emission monochromator: Spectra/Emission scan Blank files Blank files are recorded as *.blank. When scanning, you can choose to record only a blank, record only the sample, record a sample and a blank, or process a sample from a previously-saved blank. Record Blank Only Is there a blank involved? Record Sample and Blank/Collect Blank Record Sample Only Record Sample and Blank/Blank from File Types of experiments Following are types of Dual-FL experiments available in the Dual-FL Main Experiment Menu: 5-2
67 Data-Acquisition Spectra Absorbance 2D emission 3D Excitation-emission matrix (EEM) EEM + absorbance simultaneously Kinetics Absorbance Emission Emission + absorbance simultaneously Single-point Method 1 To choose an experiment type, click the Experiment Menu button : The Dual-FL Main Experiment Menu appears: 2 Choose an experiment type. The Dual-FL Experiment Type window appears (if there are subtypes of experiment): 3 Choose a subtype of experiment, and click the Next >> button. The Dual-FL Experiment Setup window appears, customized for that experiment: 5-3
68 Data-Acquisition 4 Click the File field, and enter a new file name or select a previously saved file. 5 In the Dual-FL Experiment Options area, verify that experimental parameters are correct. 6 Insert the sample into the sample compartment, and close the sample compartment s cover. 7 Click the Run button. If you do not have an automatic sample-changer, a prompt appears to insert the blank or sample. 8 Click the OK button when you 5-4
69 Data-Acquisition have inserted the blank or sample and closed the cover. The collected spectrum is displayed on the Intermediate Display screen. After all data are recorded, the Intermediate Display vanishes. For a new project, the Project Name window appears: 9 Enter a name for the entire project, or browse for an existing project name with the Browse button, then click the OK button. All data are moved to Origin s graph window for post-processing. 5-5
70 Previous Experiment Setup button Data-Acquisition The Previous Experiment Setup button resets the experiment to the previous experiment used, with minor modifications to the hardware possible. 1 After an experiment is loaded, click the Previous Experiment Setup button Note: The Previous Experiment Setup button is active only after an experiment already has been loaded. in the main toolbar: The last experiment used or loaded appears in the Aqualog Experiment Setup window: 5-6
71 Data-Acquisition 2 Modify the experiment s parameters as required. 3 Click the Run button to run the experiment. 5-7
72 Auto Run Previous Experiment button Data-Acquisition The Auto Run Previous Experiment button reruns the last experiment loaded without modifications. Note: The Auto Run Previous Experiment button is active only after an experiment has already been loaded and run. 1 Click the Auto Run Previous Experiment button. The Intermediate Display appears, and the experiment starts: When the experiment is complete, the data appear in a new Origin graph window: 5-8

73 IFE button The IFE button processes data and accounts for the inner-filter effect. Data-Acquisition Note: This button only works with waterfall plots. 1 With an active set of raw data open, click the IFE button in the main toolbar. The host computer compensates for the inner-filter effect. This calculation may take some time. A new tab called Processed Graph: IFE appears in the graph area: 5-9
74 Rayleigh Masking button The Rayleigh Masking button automatically masks Rayleigh scattering lines that appear in the data. Data-Acquisition Note: This button only works with waterfall plots. 1 With an active set of raw data open, click the Rayleigh Masking button The JY Rayleigh Masking User Input window appears. 2 Click the OK button. The host computer compensates for the innerfilter effect. This calculation may take some time. in the main toolbar. A new tab called Processed Graph: RM appears in the graph area: 5-10
75 Data-Acquisition 5-11
76 Normalize button Data-Acquisition The Normalize button automatically normalizes the active data to intensities between 0 and 1. Note: HORIBA Scientific recommends that you normalize your data as the last step in processing. Perform inner-filter effect compensation and Rayleigh masking before normalization. This button only works with waterfall plots. 1 With an active set of data open, click the Normalize button in the main toolbar. The HJY_normalize window appears. 2 Click the OK button. 5-12
77 Data-Acquisition The host computer compensates for the inner-filter effect. This calculation may take some time. A new tab called Processed Graph: NRM appears in the graph area: You can also examine a contour plot of the data: The contour plot may be easier to understand visually. 5-13
78 Run JY Batch Experiments button Data-Acquisition The Run JY Batch Experiments button runs a series of automated experiments, including adjustable repeats and delays between experiments. 1 Click the Run JY Batch Experiments button. The Setup batch experiments window appears. 2 Get the experiment files to create a batch job, or load a previous batch job. a b c Load a previously created batch job using the Load button, or browse for experiment files (.xml format) using the Browse for experiment files to >> Add button. Add each desired experiment file to the Execution List. Reorder or remove the files as necessary using the Delete button, the Up button, and the Down button. d Add comments about the batch file in the Comments field. e Save the new batch job in the correct path, in the File Name field, and click the Save button. The file is saved in a.jyb format. 3 Set up each experiment in the batch job. 5-14

79 a b Select an experiment from the Execution List. Data-Acquisition In the Total Repeats: field, enter the number of times that experiment should be repeated. c In the Delay before executing: field, enter the number of seconds to wait before executing. d In the Delay between each repeat list: field, enter the number of seconds to wait before repeating the experiment. 4 Set up an outer loop in the batch job, if desired. a b In the Total Repeats: field, enter the number of times to run the batch job. In the Delay before first: field, enter the number of seconds to wait before starting the batch job. c In the Delay between each: field, enter the number of seconds to wait before rerunning the batch job. 5 Click the Run button to start the batch job. The batch job executes. 5-15
80 Switch menu between HJY Software Application and Origin Pro button Data-Acquisition The Switch menu between HJY Software Application and Origin Pro. button switches the menus at the top of the main Dual-FL window between Dual-FL and Origin functions. This allows the user to tap the power more fully of Origin software. 1 Click the Switch menu between HJY Software Application and Origin Pro button. The menus at the top of the Dual-FL window change. 2 Click the Switch menu between HJY Software Application and Origin Pro button again to return to the original menu functions. 5-16
81 Quinine Sulfate Units button Data-Acquisition Introduction Used together with the Quinine Sulfate standard kit (calibrated for 5 nm bandpass) available from Starna, this function provides a standardized intensity for fluorescence measurements and EEMs. Note: The Quinine Sulfate standard kit, RM-06HLKI-R, is available from Starna Cells, Inc., 5950 Traffic Way, Atascadero, CA 93422; phone: ; ; website is Method 1 In the main toolbar, click the Quinine Sulfate Units button. The Experiment Setup window appears: 5-17
82 Data-Acquisition 2 Enter the same experimental parameters as for the corresponding EEM that has been run. Click the Run button. A message telling you to insert the blank appears. 3 In the sample compartment, insert the Quinine Sulfate blank from the Standard Kit. 4 Close the sample-compartment lid. 5 Click the OK button. The Experiment Status window appears, and the scan starts. A message telling you to insert the sample appears. 6 In the sample compartment, insert the Quinine Sulfate sample. 7 Close the sample-compartment lid. 8 Click the OK button. The scan completes, and the Project Name window appears. 9 Provide a name for the project, and click the OK button. A table showing the Quinine Sulfate units appears: 5-18
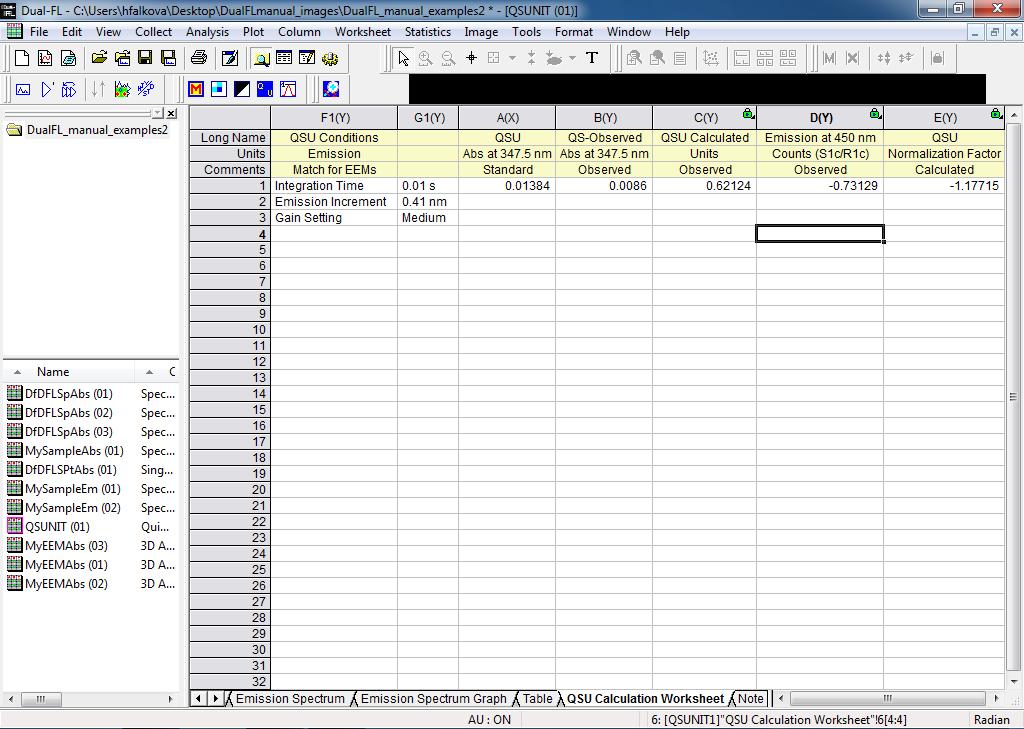
83 Data-Acquisition 5-19
84 Profile Tool button Introduction This function provides a user-specified two-dimensional profile of an EEM. Data-Acquisition Method 1 With an EEM open, in the main toolbar, click the Profile Tool button. 2 Move the boundaries of the red box to examine different cross-sections of the EEM, or click the Input Values button. 3 Use the Input Values window to enter manually the values of the cross-section. 4 Click the Create Report button. A report appears: 5-20
85 Data-Acquisition 5-21
86 Data-Acquisition Rescale Y button Introduction When a graph is open, this button rescales the y-axis on a graph to fit the data on-scale. Method 1 With a graph open, in the main toolbar, click the Rescale Y button. The graph gets rescaled. 5-22
87 6: Various Experiment Types Introduction Various Experiment Types This chapter explains how to run the most common types of experiments, using the Dual-FL instrument and software: Absorbance spectra Two-dimensional emission spectra Three-dimensional emission spectra (EEM) Kinetics spectra Single-point spectra The chapter also explains what to do when you are examining an unknown sample. 6-1
88 Various Experiment Types Absorbance spectra 1 If you have an automatic sample-changer, place the blank and sample in the sample-changer. If you have a single-position sample-holder, place the blank in the sample compartment. 2 Close the cover of the sample compartment. 3 In the main window, click the Experiment Menu button. The Dual-FL Main Experiment Menu opens. 4 Click the Spectra button. The Aqualog Experiment Type window opens. 5 Click Absorbance, then click the Next >> button. The Dual-FL Experiment Setup window appears: 6-2
89 Various Experiment Types 6 Set the experimental parameters. 7 Click the Run button. If you have no automatic sample-changer, a prompt to insert the blank appears. 8 Insert the blank and close the cover of the sample compartment. 9 Click the OK button. The Intermediate Display appears and the scan starts: 6-3
90 Various Experiment Types If you have no automatic sample changer, a prompt to insert the sample appears. 10 Insert the sample and close the cover of the sample compartment. 11 Click the OK button. The Intermediate Display re-appears and the scan continues. When the scan is complete, the Project name window appears. 12 Enter a name for the project and click the 6-4

91 Various Experiment Types OK button, or, if you enter no name, click the Cancel button. The absorption and transmission spectra appear: 13 Double-click on the spectrum to see it better in a separate window for editing. 6-5
92 Various Experiment Types Two-dimensional emission spectra 1 If you have an automatic sample-changer, place the blank and sample in the sample-changer. If you have a single-position sample-holder, place the blank in the sample compartment. 2 Close the cover of the sample compartment. 3 In the main window, click the Experiment Menu button. The Dual-FL Main Experiment Menu opens. 4 Click the Spectra button. The Dual-FL Experiment Type window opens. 5 Click Emission, then click the Next >> button. The Dual-FL Experiment Setup window appears: 6-6
93 Various Experiment Types 6 Set the experimental parameters. a To change the gain, in the CCD Gain drop-down menu, and choose the desired gain. b To change the pixel-binning, click the Increment drop-down menu and choose the amount of binning. 7 Click the Run button when all parameters are set. The Experiment Status window appears. If you have no automatic sample-changer, a prompt to insert the blank appears. 8 Insert the blank, close the sample-compartment cover, and click the OK button. The scan continues. If you have no automatic samplechanger, a prompt to insert the sample appears. 6-7


94 Various Experiment Types 9 Insert the sample close the samplecompartment cover, and click the OK button. The Intermediate Display appears: When the scan is complete, the emission spectrum appears. The dip on the spectrum is the Rayleigh-band absorbance. In the legend, you can see the excitation wavelength, absorbance, and transmission provided: Excitation wavelength, absorbance, and % transmission Rayleigh band 6-8
95 Various Experiment Types Three-dimensional emission spectra 1 If you have an automatic sample-changer, place the blank and sample in the sample-changer. If you have a single-position sample-holder, place the blank in the sample compartment. 2 Close the cover of the sample compartment. 3 In the main window, click the Experiment Menu button. The Dual-FL Main Experiment Menu opens. 4 Click the 3D button. The Dual-FL Experiment Type window opens. 5 Click EEM 3D + Absorbance, then click the Next >> button. The Dual-FL Experiment Setup window appears: 6-9
96 Various Experiment Types 6 Set the experimental parameters. a To change the gain, in the CCD Gain drop-down menu, and choose the desired gain. b To change the pixel-binning, click the Increment drop-down menu. 7 Click the Run button when all parameters are set. The Experiment Status window appears. If you have no automatic sample-changer, a prompt to insert the blank appears. 8 Insert the blank, close the sample-compartment cover, and click the OK button. The scan continues. If you have no automatic samplechanger, a prompt to insert the sample appears. 6-10
97 Various Experiment Types 9 Insert the sample, close the samplecompartment cover, and click the OK button. The Intermediate Display appears. When the scan is complete, the emission spectrum appears. The dip in the spectra is the Rayleigh-band absorbance. 6-11
98 Various Experiment Types 10 Click the Abs Spectra Graphs tab to see the absorption spectrum: Click the button to find the Sample - Blank Contour Plot tab. Click the Sample - Blank Contour Plot tab to see a contour plot: 6-12
99 Various Experiment Types 11 Return to the waterfall plot. In the toolbar, click the IFE button to remove inner-filter effects. (This calculation may take some time.) Note: The IFE button only works with Sample-Blank waterfall plots from 3D emission + absorbance experiments. 12 In the toolbar, click the Rayleigh Masking button to remove Rayleigh lines. Note: The Rayleigh Masking button only works with waterfall plots. The JY Rayleigh Masking User Input window appears. 13 Click the OK button. Computer calculation may take some time. The masked spectral plot appears: 6-13

100 Various Experiment Types 14 In the toolbar, click the Normalize button to normalize the plot. The HJY_normalize window appears: 15 Click the OK button. Computer calculation may take some time. The normalized waterfall plot appears: 6-14
101 Various Experiment Types 16 Click the appropriate tab to see the contour plot, which may be easier to interpret visually: 17 To examine profiles across the plot, in the toolbar click the Profile button. Reminder messages appear. 6-15
102 18 Click the OK button. Various Experiment Types 19 Move the boundaries of the red box to examine different cross-sections of the EEM, or click the Input Values button. 20 Use the Input Values window to enter manually the values of the cross-section. 21 Click the Create Report button. A report appears: 6-16
103 Various Experiment Types 6-17

104 Kinetics spectra Various Experiment Types This shows an example using quinine sulfate solution. 1 If you have an automatic sample-changer, place the blank and sample in the sample-changer. If you have a single-position sample-holder, place the blank in the sample compartment. 2 Close the cover of the sample compartment. 3 In the main window, click the Experiment Menu button. The Dual-FL Main Experiment Menu opens. 4 Click the Kinetics button. The Dual-FL Experiment Type window opens. 5 Choose the subtype of experiment, then click the Next >> button. The Dual-FL Experiment Setup window appears: 6-18

105 Various Experiment Types 6 Set the experimental parameters, including Integration Time, Interval, Excitation Wavelength, Increment, and CCD Gain. Note: For Kinetics experiments with the CCD, and the Interval Time is < 2 s, the Integration and Interval Times must be equal. For Kinetics experiments with the CCD, and the Interval Time 2 s, the Interval Time may differ from the Integration Time. However, the Interval Time still must be equal to or greater than the Integration Time. 7 When all parameters are set, click the Run button. The Experiment Status window appears. If you do not have an automatic changer, an Experiment Paused prompt to insert the blank (considered time = 0) appears: 6-19


106 8 Insert the blank, close the sample-compartment lid, and click the OK button. The scan continues. If you do not have an automatic changer, an Experiment Paused prompt to insert the sample appears. 9 Insert the sample, close the samplecompartment lid, and click the OK button. The Project name window appears when the scan in complete. 10 Provide a name for the Origin project file, then click the OK button. The final plot appears: Various Experiment Types 11 Choose the Abs and Trans Graphs tab to view the absorbance and transmission spectra. 6-20
107 Single-point spectra This shows an example measuring quinine sulfate solution. Various Experiment Types Note: Single-point spectra only use absorption mode. 1 If you have an automatic sample-changer, place the blank and sample in the sample-changer. If you have a single-position sample-holder, place the blank in the sample compartment. 2 Close the cover of the sample compartment. 3 In the main window, click the Experiment Menu button. The Dual-FL Main Experiment Menu opens. 4 Click the Single Point button. The Dual-FL Experiment Setup window appears: 6-21
, click the Add button to add it to the Wavelength list, and repeat (then add")


108 Various Experiment Types 5 Set the experimental parameters. a In the Wavelengths area, enter a wavelength (here we add 249), click the Add button to add it to the Wavelength list, and repeat (then add 347, and click the Add button) for more wavelengths at which to record absorbance. b In the Samples area, create a list of samples to measure by clicking the Add button. The Add Sample Types window appears. Set the Number of Standards (here we enter 2) and Number of Unknowns (here we enter 2), then click the OK button. The Samples table is updated. In the new list of samples, enter concentrations and other labels. (Here, in the second Standard row, we enter 1, for 1 QSU.) 6 Click the Run button. The software prompts you with the Experiment Paused window. In this case, the software asks for a Blank because a Blank is the first item in the Samples table. 6-22

109 Various Experiment Types 7 Put the blank in the sample compartment, close the lid of the sample compartment, and click the OK button. The instrument runs through the list of samples sequentially, and prompts for the next sample, in this case, a Standard. Below is a typical single-point Intermediate Display. 8 Insert that sample, close the lid, and click the OK button. When all the samples have been scanned, the Project name window appears. 9 Give a name to the project, then click the OK button. The final plot appears: 6-23

, Intercept of the line, and Intercept sd (standard deviation): In the Unknown chart the")
110 Various Experiment Types Note also, in the tabs at the bottom, a worksheet called Single Point Std. In this worksheet you find the Abs and Concentration columns. Here the model concentration is calculated; the linear regression provides the Slope of the line, Slope sd (standard deviation), Intercept of the line, and Intercept sd (standard deviation): In the Unknown chart the unknown concentrations are calculated from the standard at matching wavelengths. 6-24
111 Running an unknown sample Various Experiment Types Often a researcher will scan a sample whose spectral characteristics are unknown. For optimal spectra, the optimal excitation and emission wavelengths must be found. The optimal excitation wavelength is the wavelength that creates the most intense emission spectrum for a given sample. For many samples, the optimum wavelengths are known. For a sample whose wavelength positions are unknown, the user must determine these wavelengths to obtain the best possible results. The traditional method consists of running an emission scan to find the peak emission value. Then an excitation scan is run using the determined peak emission value. In the Dual-FL, HORIBA Scientific has made this process much easier: perform a full threedimensional absorbance scan, which includes all peaks. 1 If you have an automatic sample-changer, place the blank and sample in the sample-changer. If you have a single-position sample-holder, place the blank in the sample compartment. 2 Close the cover of the sample compartment. 3 In the main window, click the Experiment Menu button. The Dual-FL Main Experiment Menu opens. 4 Click the 3D button. The Dual-FL Experiment Type window opens. 6-25
112 5 Click EEM 3D + Absorbance, then click the Next >> button. Various Experiment Types The Dual-FL Experiment Setup window appears: 6 Set the experimental parameters. a To change the gain, in the CCD Gain drop-down menu, and choose the desired gain. b To change the pixel-binning, click the Increment drop-down menu. 7 Click the Run button when all parameters are set. The Experiment Status window appears. 6-26
113 Various Experiment Types If you have no automatic sample-changer, a prompt to insert the blank appears. 8 Insert the blank, close the sample-compartment cover, and click the OK button. The scan continues. If you have no automatic sample-changer, a prompt to insert the sample appears. 9 Insert the sample close the sample-compartment cover, and click the OK button. The Intermediate Display appears. When the scan is complete, the emission spectrum appears. The dip in the spectra is the Rayleigh-band absorbance. 6-27
114 Various Experiment Types 10 Click the Abs Spectra Graphs tab to see the absorption spectrum: Click the button to find the Sample - Blank Contour Plot tab. Click the Sample - Blank Contour Plot tab to see a contour plot: 6-28
115 Various Experiment Types 11 Return to the waterfall plot. In the toolbar, click the IFE button to remove inner-filter effects. (This calculation may take some time.) Note: The IFE button only works with waterfall plots. 6-29
116 Various Experiment Types 12 In the toolbar, click the Rayleigh Masking button to remove Rayleigh lines. Note: The Rayleigh Masking button only works with waterfall plots. The JY Rayleigh Masking User Input window appears. 13 Click the OK button. Computer calculation may take some time. The masked spectral plot appears: 14 In the toolbar, click the Normalize button to normalize the plot. The HJY_normalize window appears: 6-30
117 15 Click the OK button. Various Experiment Types Computer calculation may take some time. The normalized waterfall plot appears: 16 Click the appropriate tab to see the contour plot, which may be easier to interpret visually: 6-31

118 17 To examine profiles across the plot, in the toolbar click the Profile button. Reminder messages appear. 18 Click the OK button. Various Experiment Types 19 Move the boundaries of the red box to examine different cross-sections of the EEM, or click the Input Values button. 20 Use the Input Values window to enter manually the values of the cross-section. 21 Click the Create Report button. A report appears: 6-32
119 Various Experiment Types 6-33
120 Various Experiment Types 6-34
121 7: Troubleshooting Troubleshooting The Dual-FL system has been designed to operate reliably and predictably. If there is a problem, examine the chart below, and try the steps on the following pages. Problem Possible Cause Remedy Light is not reaching the sample. Signal intensity is low. Signal intensity is at least 10 times lower than normal. Signal intensity reaches (maximum). Monochromator is miscalibrated. Sample turret is not in correct position. CW lamp is not aligned. Shutter(s) is(are) not completely open. Lamp power-supply is set to the wrong current rating. Lamp is too old. Shutter(s) closed. Not enough signal at the detector. Monochromators are set to wrong wavelength. Check and recalibrate monochromator. Using Dual-FL software, set the position and open the cover to verify the position. Align the lamp. Open the shutter(s) in Real Time Control. Call the Service Department. Replace lamp. (150-W lamp has lamp lifetime h.) Open all shutters in Real Time Control. Increase the CCD gain in the dropdown menu in the Experiment Setup window; increase the integration time; increase the number of accumulations. Select appropriate wavelength based on excitation and emission of sample. Detectors are saturated. (Signal detector is linear to counts. Reference detector saturates at 200 μa.) Sample is too concentrated. Dilute sample by a factor of 10 or 100 and retry experiment. Optical density effects and self-absorption. CCD detector is saturated. Sample is too concentrated. Dilute sample by a factor of 10 or 100 and retry experiment. Sample is too concentrated. Dilute sample by a factor of 10 or 100 and retry experiment. Shorten integration time. Reduce CCD gain. Check 7-1
122 Troubleshooting that the absorbance is linear with concentration. No signal. Lamp is not on. Bad lamp: change xenon lamp. No sample is in sample compartment. CCD detector has failed. Place sample in the sample compartment. Call Service Department. Erratic signal. Lamp unstable. Let lamp warm up 20 min before use Replace lamp Replace power supply Check electronics board(s). Light leaks. Check dark value to determine. Sample has particles that scatter light irregularly. Temperature of instrument outside of specified operation range Filter sample, or let particles settle before running scan. Large off-scale peak at twice the excitation wavelength. Stray light in emission scan (also see example in this chapter). Corrected excitation spectrum curves upward ~ nm. Noisy spectrum with magnetic stirrer. Communication problems between Second-order effects from the instrument. Dirty cuvette. Solid-sample holder in sample compartment. Dark count is divided by low reference signal. Stirring speed is too fast. Stirring bar is too large; light beam is striking it. USB cable is improperly connected. Use Rayleigh-masking tool to eliminate 2 nd -order peak. Clean the cuvette as described in Chapter 8. Rotate the holder to prevent direct scatter from entering the emission spectrograph. Use Dark Offset checkbox; retry scan. Use slower stirring speed. Use a smaller stirring bar (available from Bel-Art Products, Pequannock, NJ). Check USB cable s connection. 7-2
123 computer and instrument. Hardware Init. Error appears. Sample turret is not operating. Data file does not exist or file read error message appears. Validation test fails. Small discontinuity in absorption data at ~410 nm. Problem with the USB port on the host computer. Broken IR sensor in monochromator. Software is not enabled. USB cable is connected improperly. User is not logged into Windows XP as administrator or power user. Problem with the sample. Filter-wheel is not moving properly. Troubleshooting Change the USB cable to a new port; restart the host computer. Replace IR sensor: Call Service Department. Check status. Check USB cable s connection. Log into Windows XP as administrator and or power user, and restart Aqualog software Confirm that the correct standard is inserted with the proper orientation; confirm that the standard cuvette is clean. Call Service Department. 7-3

124 Further assistance... Troubleshooting Read all software and accessory manuals before contacting the Service Department. Often the manuals show the problem s cause and a method of solution. Technical support is available for both hardware and software troubleshooting. Before contacting the service department, however, complete the following steps. 1 If this is the first time the problem has occurred, try turning off the system and accessories. After a cool-down period, turn everything back on. 2 Make sure all accessories are properly configured, and turned on as needed. 3 Following the instructions in Chapter 4, System Operation, run the verification tests to make sure the system is properly calibrated. Print the spectrum or table for each and note the peak intensities. 4 Check this chapter to see if the problem is discussed. 5 Try to duplicate the problem and write down the steps required to do so. The service engineers will try to do the same with a test system. Depending on the problem, a service visit may not be required. 6 If an error dialog box appears in the Dual-FL software, write down the exact error displayed. 7 In the Dual-FL software, in the Dual-FL main window s toolbar, choose Help: A drop-down menu appears. 8 Under Help, choose About Dual-FL... This opens the About Dual-FL window: 7-4


125 The version of the software (both Dual-FL and Origin ) is listed here. Troubleshooting 9 Click the View System Info button. The Installed Components window appears, displaying all the software required for Dual-FL software. 10 Record the information by clicking the: Save To File... button, which saves the information to a file; Zip Info button, which compresses the information while saving it; Print Info button, which prints out the software information. 11 Click the OK button to close the Installed Components window. 12 Click the OK button to close the About Dual-FL window. 13 Write down the software s version numbers, along with the purchase dates, model numbers, 7-5

126 Troubleshooting system configuration, and serial numbers of the instrument and its accessories. 14 Determine the SpectrAcq firmware version: a Open the Experiment Setup window. b Click the RTC button to enter the Real Time Control. The Real Time Control appears: 7-6
127 Troubleshooting c Click the Detectors icon. 7-7

128 Troubleshooting d e f Click the Advanced button. The Multichannel Detector Advanced Parameters window appears. Write down the Device Id field. Click the OK button to close the window. If the problem persists or is unlisted, call the Service Department at (877)


 for detailed information on nitric acid. 4 Clean the cuvettes in the cleaning solution with a test-tube brush.")
129 8: Optimizing Data Optimizing Data Spectra can be enhanced by optimization of data-acquisition. This chapter lists some methods of optimizing sample preparation, spectrofluorometer setup, and data correction to get higher-quality data. Cuvette preparation 1 Empty all contents from the cuvettes. 2 Fully immerse and soak the cuvettes for 24 h in 50% aqueous nitric acid. This cleans the cuvettes inner and outer surfaces. 3 Rinse with de-ionized water. Note: Clean the sample cells thoroughly before use to minimize background contributions. Warning: Nitric acid is a dangerous substance. When using nitric acid, wear safety goggles, face shield, and acidresistant gloves. Certain compounds, such as glycerol, can form explosive materials when mixed with nitric acid. Refer to the Materials Safety Data Sheet (MSDS) for detailed information on nitric acid. 4 Clean the cuvettes in the cleaning solution with a test-tube brush. Use Alconox or equivalent detergent as a cleaning solution. 5 Rinse the cuvettes with de-ionized water. 6 Soak the cuvettes in concentrated nitric acid. 7 Rinse them with de-ionized water before use. Caution: Soaking the cuvettes for a long period causes etching of the cuvette surface, which results in light-scattering from the cuvettes. 8-1
130 Sample preparation Optimizing Data Caution: Always read the Materials Safety Data Sheet before using a sample or reagent. The typical fluorescence or phosphorescence sample is a solution analyzed in a standard cuvette. The cuvette itself may contain materials that fluoresce. To prevent interference, HORIBA Scientific recommends using non-fluorescing fused-silica cuvettes that have been cleaned as described above. Small-volume samples If only a small sample-volume is available, and the intensity of the fluorescence signal is sufficient, dilute the sample and analyze it in a 4-mL cuvette. Correct absorbance readings require 1 cm path-length cells; reduced-volume cells are not supported. Innerfilter corrections also require 1 cm path-length cells. Solid samples Solid samples usually are mounted in the 1933 Solid Sample Holder, with the fluorescence collected from the front surface of the sample. The mounting method depends on the form of the sample. See the section on Highly opaque samples for more information on sample arrangement in the sample compartment. Thin films and cell monolayers on coverslips can be placed in the holder directly. Minerals, crystals, vitamins, paint chips, phosphors, and similar samples usually are ground into a homogeneous powder. The powder is packed into the depression of the Solid Sample Holder (see next page for diagram). For very fine powder, or powder that resists packing (and therefore Note: Avoid thick coverslips, because the excitation beam may not hit the sample directly with a thick coverslip. Microscope coverslips are useful, except that they are not quartz, and do not transmit UV light. falls out when the holder is put into its vertical position), the powder can be held in place with a thin quartz coverslip, or blended with potassium bromide for better cohesion. A single small crystal or odd-shaped solid sample (e.g., contact lens, paper) can be mounted with tape along its edges to the Solid Sample Holder. Be sure that the excitation beam directly hits the sample. To keep the excitation beam focused on the sample, it may be necessary to remove or change the thickness of the metal spacers separating the clip from the block. 8-2

131 Dissolved solids Solid samples, such as crystals, sometimes are dissolved in a solvent and analyzed in solution. Solvents, however, may contain organic impurities that fluoresce and mask the signal of interest. Therefore, use highquality, HPLC-grade solvents. If background fluorescence persists, recrystallize the sample to eliminate organic impurities, and then dissolve it in an appropriate solvent for analysis. Biological samples Optimizing Data Solidsample holder For reproducible results, some samples may require additional treatment. For example, proteins, cell membranes, and cells in solution need constant stirring to prevent Remove or change these metal spacers. settling. Other samples are temperature-sensitive and must be heated or cooled to ensure reproducibility in emission signals. 8-3

132 Excitation Emission monochromator Dual-FL Operation Manual (30 Nov 2012) Running a scan on a sample Precautions with the Solid- Sample Holder Avoid placing the front face of the sample so that the excitation beam is reflected directly into the emission monochromator. If the sample is rotated at 45 from excitation, this may occur, increasing interference from stray light. Instead, set up the sample with a 30 or 60 -angle to the excitation, preventing the excitation beam from entering the emission slits. The photograph at right illustrates how a 60 -angle to the excitation keeps the incoming excitation light away from the emission monochromator s entrance. Optimizing Data Excitation monochromator 60 Emission Note: The focal point of the excitation beam must be on the sample itself. Keep signal within detector s linear region Be sure that the signal remains within the detector s linear region, so that the CCD does not saturate. 8-4
133 Improving the signal-to-noise ratio Optimizing Data Because of various hardware or software conditions, occasionally it is necessary to optimize the results of an experiment. The quality of acquired data is determined largely by the signal-to-noise ratio (S/N). This is true especially for weakly fluorescing samples with low quantum yields. The signal-to-noise ratio can be improved by: Using the appropriate integration time, Summing together more accumulations, Changing the sample s concentration Binning more pixels together Increasing the gain on the CCD The sections that follow discuss the alternatives for improving the S/N ratio and the advantages and disadvantages of each. 8-5
134 Determining the optimum integration time Optimizing Data The length of time during which photons are counted and averaged for each data point is referred to as the integration time. An unwanted portion of this signal comes from noise and dark counts (distortion inherent in the signal detector and its electronics when high voltage is applied). By increasing the integration time, the signal is averaged longer, resulting in a better S/N. This ratio is enhanced by a factor of t 1/2, where t is the multiplicative increase in integration time. For example, doubling the integration time from 1 s to 2 s increases the S/N by over 40%, as shown below: For an integration time of 1 second, For an integration time of 2 seconds, S / N 1/ 2 t S / N 1/ 2 t 1 1 1/ 2 2 1/ or approximately 42%. Because S/N determines the noise level in a spectrum, use of the appropriate integration time is important for high-quality results. To discover the appropriate integration time: 1 Find the maximum fluorescence intensity by acquiring a preliminary scan, using an integration time of 0.1 s and a bandpass of 5 nm. 2 From this preliminary scan, note the maximum intensity, and select the appropriate integration time from the table below. Signal intensity (counts per second) Estimated integration time (seconds) 100 to to to to Note: This table is only a guide. The optimum integration time for other measurements, such as time-base, polarization, phosphorescence lifetimes, and anisotropy, may be different. Set integration time through Experiment Setup for a specific experiment, or Real Time Control to view the effects of different integration times on a spectrum. See the Dual- FL on-line help to learn more about setting the integration time. 8-6
135 Scanning a fluorescent sample multiple times Optimizing Data Scanning a sample more than once, and averaging the scans together, enhances the S/N. In general, the S/N improves by n 1/2, where n is the number of scans. To scan a sample multiple times, 1 Open the Experiment Setup window. 2 Specify the number of scans in the Accumulations field. See Dual-FL on-line help for detailed instructions regarding the data-entry fields. 8-7

136 Using the appropriate wavelength increment Optimizing Data The increment in a wavelength scan is the spacing, in nm, between adjacent data points. The spacing between the data points affects the resolution of the spectrum, and total time for acquisition. Consider the required resolution, time needed, and concerns about sample photobleaching. Most samples under fluorescence analysis display relatively broad-band emissions with a Lorentzian distribution, so they do not require a tiny increment. In Dual-FL software, increments are measured in pixels, with a conversion to nm. A first try might be 0.82 nm increment. After acquiring the initial spectrum, examine the results. If two adjacent peaks are not resolved (i.e., separated) satisfactorily, reduce the increment to 0.41 nm. If the spectrum is described by an excessive number of data points, increase the increment, to save time and lamp exposure. A scan taken, using an increment of 0.41 nm, with a peak at full-width at half-maximum (FWHM) of 40 nm, should be characterized with a 1.64-nm increment instead. For time-based scans, the increment is the spacing in s or ms between data points. Here, the consideration is the necessary time-resolution. The time increment dictates the total time per data point and for the scan in general. Set this value to resolve any changes in the luminescence of samples as they react or degrade. Time increments often range from s. You can change the increment using the Increment drop-down menu in the Experiment Setup window. 8-8

137 9: Maintenance Maintenance Introduction The Dual-FL requires little maintenance. To remove dust and fingerprints, wipe the outside panels with a clean, damp cloth. The lamp is the only component that must be replaced routinely. Regular examination of the xenon-lamp scan and water Raman spectrum serves as early indicators of the system s integrity. See Chapter 3 for these tests. Lamp replacement When to replace the lamp Obtaining good spectral results depends on the xenon lamp. The Dual-FL keeps track of lamp usage automatically. After 1000 h of use, a Lamp hours warning notice appears on the host computer s monitor after you initialize the Dual-FL: Click the OK button to acknowledge the message. Replacing the lamp within the recommended time may prevent a catastrophic failure. Each time the lamp is turned on constitutes one full hour of use. Therefore, HORIBA Scientific suggests leaving the lamp on during brief periods of inactivity. Parts and tools required The replacement xenon lamp is packed in the manufacturer s box. Read all instructions and precautions before removing the lamp from the protective cover, and inserting it into the Dual-FL. Phillips screwdriver 3/32 Allen key 7/64 Allen key 1/8 Allen key 9/64 Allen key Warning: Do not remove the protective cover from the replacement lamp until instructed to do so. 9-1
 while handling lamp leads. Lethal high voltages may exist.")
138 Maintenance Hazards Xenon-arc lamps are an explosion hazard. Wear explosionproof face-shield and protective clothing when opening the lamp housing and handling the lamp. Disconnect the lamp power supply from the AC power line (mains) while handling lamp leads. Lethal high voltages may exist. The lamp remains extremely hot for approximately one hour after it has been turned off. Do not touch the lamp or the metal unit until the lamp has cooled. Never look directly at the xenon arc or its reflection. Intense radiation can permanently damage eyes. Do not touch the focusing lens, back-scatter mirror, or the surface of the lamp. Fingerprints will be burned onto these surfaces when the lamp is ignited. Changing the lamp 1 Switch off and prepare the Dual-FL. a Be sure that the Dual-FL and the host computer are turned off, and that the lamp has completely cooled. b Remove the AC (mains) power cord from the Dual-FL. c Disconnect the USB cable, power cord, and any other cables attached to the spectrofluorometer. 2 Gently remove the sample mount from the front of the Dual-FL. The standard Dual- FL front is held via a friction fit, with no screws to remove. Some accessories require removal of 4 screws. Some sample mounts also have a 15-pin connector at the inside end for automated accessories. 9-2


139 3 Remove the lamp cover. a With an Allen key, remove the three screws from inside the left wall of the sample compartment. Maintenance b With the Allen key, remove the three screws from inside the right wall of the sample compartment. c Pull the left half of the chassis cover to the left. d Pull the right half of the chassis cover to the right. 9-3
140 There should be a gap wide enough to completely expose the lamp housing: Rear view of Dual-FL Lamp housing Maintenance Gap 4 Remove lamp housing. a Disconnect the fan cable. b Loosen the four spring-loaded screws on the lamp housing. 9-4
141 c Remove the cover of the lamp housing. Maintenance d Tilt the instrument upward enough to remove the bolt from underneath the chassis. e Loosen the bolt. With an Allen key, remove the two locking screws from the baseplate. Remove the bolt. 9-5

142 f Lift the lamp mount up, then out of the instrument. Maintenance Be aware of the two alignment pins that fix the underside of the mount to the instrument. The lamp is held in place by spring tension and the height adjustment on top of the lamp. The anode and cathode connections are attached to the lamp via thumbnuts on top and bottom of the lamp. Warning: Wear protective gloves whenever handling xenon bulbs. 5 Prepare the replacement lamp. a Place the new xenon bulb (still in its protective cover) nearby. b Open the new bulb s protective cover. Keep this cover handy for later. 6 Remove the old xenon lamp. a Loosen the top and bottom thumbnuts on the lamp electrodes. Remove the nuts and washers. There are two washers for each thumbnut. 9-6
143 b With an Allen key, loosen the left screw on the retainer bracket. Maintenance c Raise the retainer to free the bulb. d Lift bulb out. Caution: Improper connections to the lamp severely affect lamp performance and affect the power supply. Carefully note the anode and cathode connections to the lamp. The anode (+) is on top; the cathode ( ) is on the bottom. The nipple on the lamp s glass envelope marks the anode (+) side. 9-7
 in a safe place. 9 Install the new lamp.")

144 Maintenance 7 Place the old lamp in the protective cover from the new lamp. 8 Put the old lamp (inside the protective cover) in a safe place. 9 Install the new lamp. a Write down the serial number of the lamp, found etched on the anode end of the bulb: Warning: Do not touch any portion of the lamp except the metal cathode and anode. Serial number b Insert the bulb with anode at the top, pointy electrode upward, and the nipple towards the left (out of the optical path). Anode ( ) Nipple Blunt electrode Pointy electrode Cathode (+) 9-8


145 Maintenance c Drop retainer into position. Note: Keep the nipple facing left, out of the optical path. d Tighten retaining screw with Allen key. e Place each cable connector between two washers, thread onto correct electrode, and affix with thumbscrew. Tighten the thumbscrew by hand. Electrode cable this way Note: Keep the electrode cables pointed to the right, and the nipple to the left. Nipple this way Electrode cable this way 9-9


146 f Line up pins on underside of lamp mount with holes in baseplate. Replace lamp mount in instrument. Maintenance Note: Be sure the lamp mount is completely flat against the baseplate. The electrode cable should be underneath the cover. 9-10
147 g Replace the two locking screws. Maintenance h Tilt the instrument back far enough to replace the hex bolt underneath the chassis. Note: Don t tighten the bolt yet! i Re-install the cover. 9-11

 to the Dual-FL.")
148 j Hand-tighten the four spring-loaded screws. Maintenance k Reconnect the fan cable. 10 Reconnect all cables (power, communications, accessories, etc.) to the Dual-FL. Note: Do not replace the Dual-FL covers until the lamp is correctly adjusted. 9-12


149 11 Reset the hour-meter. Maintenance Caution: Intense ultraviolet, visible, or infrared light may be present, so wear eye- and skin-protection, such as lightprotective goggles and light-blocking clothing. a b With the chassis still removed, turn on the Dual-FL. Insert a fluorescence sample with a known emission peak in the sample compartment, and close the sample-compartment lid. c d Note: This example uses Rhodamine 6. You may choose another sample, whose peaks and signal may vary. Let the lamp warm up for at least 30 min. In the Windows Start menu, choose All Programs, then Jobin Yvon, then Utilities, then Lamp Reset. The Dual-FL Configuration window appears: 9-13


150 Maintenance e f Click the Reset Lamp button. The Lamp Info window appears. Enter the new bulb s serial number that you noted down previously, then click the OK button. The Lamp Info window closes, and the Dual-FL Configuration window resets its values. 9-14
151 Maintenance g Click the OK button to finish. The Dual-FL Configuration window closes. 12 Adjust the new xenon lamp. a Start the Dual-FL software. b c In the main window, choose Collect\Advanced Setup\System ReInitialization. The Dual-FL initializes, then the Dual-FL Main Experiment Menu appears. Choose Spectra. d The Dual-FL Experiment Type window appears. Click Emission, then click the Next >> button. The Experiment Setup window appears: 9-15
152 Maintenance e Click the RTC button to open the Real Time Control: f In the Double Spectrometer area, enter the excitation wavelength appropriate for your sample in the Position field. In this example, we will excite the rhodamine 6 at 550 nm, so we enter 550 nm. 9-16
153 g Choose the Dual-FL V... tab to adjust the emission detector s parameters: Maintenance h i j k Set the Bin to 8, to shorten the integration time. Click the Apply button. Activate the Continuous checkbox to take data continuously. Set the Shutter Mode slide-switch to Open. l Click the Run button to start the scan. The instrument starts scanning. m Just below the graph area, click the button to expand the plot: 9-17


154 Maintenance n On the back of the lamp housing, insert an Allen key to loosen two internal set screws: Loosen the left internal screw. Loosen the right internal screw. o Note: These screws must be loosened, otherwise the bulb is not adjustable. Adjust the xenon lamp s height using a 5/64 Allen key. While turning the key, watch the signal intensity on the Real Time Control display, and try to maximize the signal. 9-18


155 p Adjust the xenon lamp s centering using a 5/64 Allen key: While turning the key, watch the signal on the Real Time Control display, and try to maximize the signal. Maintenance q Adjust the xenon lamp s focus using a 5/64 Allen key. While turning the key, watch the signal on the Real Time Control display, and try to maximize the signal. r When optimized, click the Cancel button, turn off the instrument, tighten the internal set screws on the housing, and unplug all external cables. Tighten the left internal screw. Tighten the right internal screw. 9-19

156 13 Finish closing the instrument. a Let the lamp and instrument cool at least 20 min, then raise the chassis enough to tighten the bolt underneath. This locks the alignment of the new bulb. Maintenance b Slide the left and right covers closed. c Reconnect all cables (power, communications, accessories, etc.) to the Dual-FL. 9-20
157 Components & Accessories 10: Components & Accessories Accessories for the Dual-FL can be added to obtain optimum results for a variety of applications. The following list represents all the accessories and components, in alphabetical order, available for the Dual-FL spectrofluorometers. A brief description of each is included. Like the list presented below, the descriptions that follow are alphabetized, except where logical order dictates otherwise. For additional information or product literature on any of these items, contact your local Sales Representative. 10-1
158 Itemized list of Dual-FL accessories Components & Accessories Item Model Page Assembly, liquid-nitrogen Dewar FL Cell, HPLC flow J Cell, quartz Cell, sample Fiber-optic mount F Fiber-optic bundles Holder, four-position variable temp. control w/ magnetic FL stirrer Holder, dual-position variable temp. control w/ magnetic FL stirrer Holder, single-position variable temp. control w/ magnetic FL stirrer Holder, solid-sample J Lamp, xenon replacement, 150-W 1905-OFR Port, injector FL Temperature bath F
 to preserve the fragile triplet state.")
159 Components & Accessories FL-1013 Liquid Nitrogen Dewar Assembly Caution: Refer to your Material Safety Data Sheet (MSDS) for information on the hazards of cryogenic materials such as liquid nitrogen. For phosphorescence or delayed fluorescence measurements, samples are often frozen at liquid-nitrogen temperature (77 K) to preserve the fragile triplet state. The sample is placed in the quartz cell and slowly immersed in the liquid-nitrogen-filled Dewar flask. The white Teflon cone in the bottom of the Dewar flask keeps the quartz sample-tube centered in the Dewar flask. The Teflon cover on the top of the Dewar flask holds any excess liquid nitrogen that bubbled out of the assembly. A pedestal holds the Dewar flask in the sampling module. A special stove-pipe sample cover replaces the standard sample lid, so that liquid nitrogen can be added to the Dewar flask as needed. The Dewar flask holds liquid nitrogen for at least 30 min with minimal outside condensation and bubbling. Included in the FL-1013 Liquid Nitrogen Dewar Assembly, the Dewar flask can be purchased as a spare. The bottom portion, which sits directly in the light path, is constructed of fused silica. Note: If condensation appears on the outside of the Dewar flask, it must be reevacuated. FL-1013 Liquid Nitrogen Dewar Assembly. 10-3

160 Sample cells J1955 HPLC Flow Cell With a sample capacity of 20 μl, this non-fluorescing fused silica cell is ideal for on-line monitoring of fluorescent samples. The cell maintains high sensitivity because it has a large aperture for collecting the excitation light to the sample and fluorescence emission from the sample. The flat sides allow maximum throughput while keeping the scattering of the incident radiation to a minimum. The cell fits in a standard cell holder. Components & Accessories 1925 Quartz Cuvette With a 4-mL volume, this cell measures 10 mm 10 mm in cross-section, and comes with a Teflon stopper to contain volatile liquids Sample Cell This 2-mL to 4-mL non-fluorescing fused silica cell, can accept a magnetic stirrer, has a 10-mm path length, and includes a white Teflon cap that prevents sample evaporation. 10-4
 allows remote sensing.")

161 Components & Accessories F Fiber-Optic Mount and 1950 Fiber-Optic Bundles Now you can study marine environments, skin and hair, or other large samples in situ! For those users who want to examine samples unable to be inserted into the sample compartment, the F Fiber Optic Mount (plus fiber-optic bundles) allows remote sensing. The F couples to the sample compartment; light is focused from the excitation monochromator onto the fiber-optic bundle, and then directed to the sample. Emission from the sample is directed back through the bundle and into the front-face collection port in the sample compartment. Randomized fiber-optic bundles (#1950) ranging in length from 1 meter to 5 meters are available. Contact your local Sales Representative for details. F Fiber Optic Mount (above) and 1950 fiber-optic bundle (below). Caution: Intense ultraviolet, visible, or infrared light may be present when the sample compartment is open. Do not aim fiber-optic bundles onto the skin or eyes. Use extreme caution with the fiber-optic probes. 10-5

162 FL Four-Position Thermostatted Cell Holder FL Four-Position Thermostatted Cell Holder. Components & Accessories The FL Four-Position Thermostatted Cell Holder keeps a sample at a constant temperature from 20 C to +80 C. The temperature is maintained by an ethyleneglycol water mixture pumped through from an external circulating temperature bath (not included). The holder also includes a magnetic stirrer, for mixing turbid or viscous samples. Also required is the FM-2003 Sample Compartment Accessory. Caution: Refer to your Material Safety Data Sheet (MSDS) for information on the hazards of an ethylene-glycol water mixture. Installation 1 Remove the sample-compartment gap-bed. 2 Position the FL gap-bed drawer. 3 Tighten with four screws. 4 Attach the ¼ tubing to the brass inlets on the bottom of the holder. Caution: Failure to clamp these hoses securely may result in flooding and damage to the optics and electronics of the instrument. 10-6
163 Components & Accessories Use 1 Place the sample in a 10 mm 10 mm cuvette and insert a magnetic stirring bar. The stirring bar is available from Bel-Art Products, Pequannock, NJ. 2 Place a cuvette in each holder. Note: While the four-position model maintains the temperature of all four samples, only one sample is mixed at a time. 3 Allow the samples to reach the desired temperature. 4 Turn on the magnetic stirrer. 5 Select the appropriate mixing speed. The speed at which the sample should be mixed depends on the viscosity of the sample. Note: Selecting too high a speed may create a vortex, which could affect the reproducibility of the measurement. 6 Run your experiment as usual. 7 Place the next cuvette in the sample position by lifting up the knob and rotating the holder. Be sure to press down, to lock the cuvette into the proper position. 10-7

164 FL Dual-Position Thermostatted Cell Holder FL Dual-Position Thermostatted Cell Holder. Components & Accessories The FL Dual-Position Thermostatted Cell Holder keeps a sample at a constant temperature from 20 C to +80 C. The temperature is maintained by an ethyleneglycol water mixture pumped through from an external circulating temperature bath (not included). The holder also includes a magnetic stirrer, enabling mixing of turbid or viscous samples. Also required is the FM-2003 Sample Compartment Accessory. Caution: Refer to your Material Safety Data Sheet (MSDS) for information on the hazards of an ethylene-glycol water mixture. Installation 1 Remove the present holder from the posts. 2 Replace with the FL Tighten the two thumbscrews. 4 Attach the ¼ tubing to the brass inlets on the bottom of the holder. Caution: Failure to clamp these hoses securely may result in flooding and damage to the optics and electronics of the instrument. 10-8
165 Components & Accessories Use 1 Place your sample in a 10 mm 10 mm cuvette and insert a magnetic stirring bar. The stirring bar is available from Bel-Art Products, Pequannock, NJ 2 Place a cuvette in each holder. Note: While the two-position model maintains the temperature of both samples, only one sample is mixed at a time. 3 Allow the sample to reach the desired temperature. 4 Turn on the magnetic stirrer. 5 Select the appropriate speed. The speed at which the sample should be mixed depends on the viscosity of the sample. Note: Selecting too high a speed may create a vortex, which could affect the reproducibility of the measurement. 6 Run your experiment as usual. 10-9
.")
166 Components & Accessories FL Single-Position Thermostatted Cell Holder The FL Single-Position Thermostatted Cell Holder keeps a sample at a constant temperature from 20 C to +80 C. The temperature is maintained by an ethyleneglycol water mixture pumped through from an external circulating temperature bath (not included). The holder also includes a magnetic stirrer, enabling mixing of turbid or viscous samples. Also required is the FM-2003 Sample Compartment Accessory. Caution: Refer to your Material Safety Data Sheet (MSDS) for information on the hazards of an ethyleneglycol water mixture. Installation 1 Remove the present holder from the posts. 2 Replace with the FL Tighten the two thumbscrews. 4 Attach the ¼ tubing to the brass inlets on the bottom of the holder. Caution: Failure to clamp these hoses securely may result in flooding and damage to the optics and electronics of the instrument
167 Components & Accessories Use 1 Place your sample in a 10 mm 10 mm cuvette and insert a magnetic stirring bar. The stirring bar is available from Bel-Art Products, Pequannock, NJ 2 Place the cuvette in the holder. 3 Allow the sample to reach the desired temperature. 4 Turn on the magnetic stirrer. 5 Select the appropriate speed. The speed at which the sample should be mixed depends on the viscosity of the sample. Note: Selecting too high a speed may create a vortex, which could affect the reproducibility of the measurement. 6 Run your experiment as usual

168 J1933 Solid Sample Holder Components & Accessories The J1933 Solid Sample Holder is designed for samples such as thin films, powders, pellets, microscope slides, and fibers. The holder consists of a base with a dial indicating angle of rotation, upon which a bracket, a spring clip, and a sample block rest. Installation 1 Remove the present holder. 2 Position the base on the posts. 3 Tighten the two thumbscrews. For pellets, crystals, creams, gels, powders, and similar materials: 1 Fill the well of the block. 2 Place a quartz coverslip or Teflon film over the well. J1933 Solid Sample Holder (with sample block nearby). Caution: Always read the Material Safety Data Sheet (MSDS) to understand the hazards of handling your sample. This holds the sample in place when vertically positioned. 3 Carefully insert the block between the bracket and spring clip, so that the sample is angled approximately 60 to the excitation light. This prevents reflections from entering the emission monochromator, and lets the fluorescence emission to be measured with minimal interference from scattered light
169 Components & Accessories For samples such as thin films, microscope slides, fibers, or other materials: 1 Place the material on the block on the side opposite that of the well. Caution: Always read the Material Safety Data Sheet (MSDS) to understand the hazards of handling your sample. 2 Carefully insert the block between the bracket and spring clip, so that the sample is angled approximately 60 to the excitation light. This prevents reflections from entering the emission monochromator, and lets the fluorescence emission to be measured with minimal interference from scattered light

170 1905-OFR 150-W Xenon Lamp Components & Accessories The 1905-OFR 150-W xenon lamp delivers light from 240 nm to 850 nm for sample excitation. The lamp has an approximate life of 1500 hours, and is ozone-free. Caution: This lamp emits intense light and heat, and contains xenon gas under pressure. Understand all safety precautions before handling or using this xenon-arc lamp

171 FL Injector Port Components & Accessories For the study of reaction kinetics, such as Ca 2+ measurements, the FL Injector Port is ideal. This accessory allows additions of small volumes via a syringe or pipette to the sample cell without removing the lid of the sample compartment. With the injector in place, a lock-tight seal is achieved, prevented both light and air from reaching the sample. The Injector Port will accommodate most pipettes and syringes, with an injection-hole diameter of (3.2 mm). A cap is included to cover the port when not in use. Caution: Always read the Material Safety Data Sheet (MSDS) to understand the hazards of handling your sample

172 F-3030 Temperature Bath For studies of samples whose properties are temperature-dependent, use the F-3030 Temperature Bath. The controller circulates fluids externally, with tubes leading to the sample chamber. The temperature range is from 25 C to +150 C. Sensor and all cables are included with the F The Temperature Bath is available in a 110-V and 220-V version. Components & Accessories Warning: Refer to your Material Safety Data Sheet (MSDS) for information on the hazards of an ethylene-glycol water mixture. This instrument uses high-temperature fluids, which can cause severe burns
173 11: Technical Specifications Introduction Each Dual-FL system consists of: An excitation source An excitation monochromator A sampling module with reference detector An absorption detector An emission spectrograph with CCD. Technical Specifications Each system is controlled by an IBM-PC-compatible computer, and may include a printer for hard-copy documentation. The details and specifications for each component of the Dual-FL spectrometer follow. 11-1
174 Spectrofluorometer system Excitation source Excitation source Lamp stability Optics 150-W xenon, continuous output, ozone-free lamp 1% per hour Sample compartment Sample module Reference detector Fluorescence Technical Specifications All-reflective, for focusing at all wavelengths and precise imaging for microsamples. The sample module also has a removable gap-bed assembly for sampling accessory replacement. Calibrated photodiode for excitation reference correction from nm. Dispersion VS nm mm 1 Double monochromator 6.7 nm mm 1 Monochromator Double-grating excitation monochromator. Aberration-corrected with holographic gratings at f/2.6. All-reflective optics, using 1200-grooves/mm gratings: Bandpass 5 nm Maximum scan speed 500 nm s 1 Accuracy ±1 nm Step Size fixed at nm Grating Excitation 250 nm blaze ( nm optical range) Detector Spectrograph with thermoelectrically-cooled CCD, resolution = 0.42 nm/pixel, readout time = 4 ms. Sensitivity Excitation and emission shutters Integration time Slit width Absorbance Scanning range Bandpass Double-distilled, de-ionized, ICP-grade water-raman scan :1 signal-to-noise ratio at 397 nm, 5-nm bandpass, 30 s integration time, background noise first standard deviation at 450 nm. Computer-controlled s 5 nm bandpass nm (optical) (mechanical) 5 nm 11-2
175 Slew speed Up to 500 nm s 1 Optical system Detector Wavelength range Wavelength accuracy Photometric accuracy Stabilized single-beam, f/3 optics Si photodiode Technical Specifications nm, with automatic order-filter switching ±1 nm ±0.01 A from 0 to 2 A Photometric stability <0.002 A h 1 Photometric repeatability ±0.002 A from 0 to 1 A Stray light in absorbance path Total system Dimensions (instrument) <1% at 230 nm 24½ wide 15 high 17¼ deep 62.2 cm wide 38.1 cm high 43.8 cm long Height needed to open sample-compartment lid: 24¼ ; 61.6 cm Dimensions (sample compartment only) Weight Ambient temperature range Maximum relative humidity Power Fuses 5.5 wide 7 high 7 long 14.0 cm wide 17.8 cm high 17.8 cm long 72 lbs (33 kg) C F 75% Universal AC single-phase input power; V AC; line frequency Hz. Two 5 20 mm IEC approved, 4.0 A, 250 V, Time Delay fuses (Cooper Bussman part number GDC-4A or equivalent) 11-3
176 Minimum host-computer requirements Software Technical Specifications Windows 2000, Windows XP Pro, Windows Vista, or Windows 7 (in 32-bit compatibility mode) Hardware Supports Windows 2000, Windows XP Pro, Windows Vista, or Windows 7 (in 32-bit compatibility mode) 1 GB RAM 1 GB hard-disk space One DVD-ROM drive One available USB port for USB hardware key Video resolution of at least Note: Additional ports may be required to control accessories such as the temperature bath, etc. Software Dual-FL software for data-acquisition and manipulation through the Windows environment. 11-4
177 12: Glossary Glossary Absorption Transition, when a photon enters a molecule, from the ground state to the excited singlet state. This process typically occurs in ~10 15 s. Absorbance The extent of light absorption by a substance. Absorbance, A = log T, where T is the transmittance of the sample. Absorbance is also synonymous with optical density, OD. Absorbance can be calculated using the Beer-Lambert Law: A = εcl = OD = log T ε = extinction coefficient (M 1 cm 1 ) C = sample concentration (M) l = path length (cm). Acquisition modes (R, S, I channels) Bandpass Bandpass filter Bioluminescence The logical input channels used on the spectrofluorometer to input collected signal from the detectors present on the system. The detectors are assigned as: the reference detector connected to channel R, the emission connected to channel S, and the absorption connected to channel I. The wavelength range of light passing through the excitation and emission spectrometers. The wider the bandpass, the higher the signal intensity. Bandpass is fixed at 5 nm in the Aqualog. Optical element that selectively transmits a narrow range of optical wavelengths. Emission of light originating from a chemical reaction in a living organism. Blank subtraction Blaze wavelength Chemiluminescence Concentration determination The removal of the spectral response of the solvent (and sample container) from the sample s spectral response. To accomplish this, an identical scan is run on the solvent just before running the actual sample. Proper use of a blank can remove solvent luminescence artifacts, scattering events, and any artifacts from the sample cuvette or container. Wavelength at which a grating is optimized for efficiency. Generally, the gratings are efficient to ⅔ before the blaze wavelength to twice the blaze wavelength. The excitation and emission gratings are blazed in the UV and visible respectively. Emission of light originating from a chemical reaction. A function of the Single Point type of scan that calculates an unknown sample s concentration. The user runs known samples and enters the 12-1
178 concentration in order to calibrate the routine. Then an assay may be completed with the measurements based on concentration. Glossary Corrected emission scan Corrected excitation scan Correction factors Cut-on filter Cut-off filter Dark offset Datafile Disinfection By- Products (DBPs) Dispersion An emission scan that has been corrected for the wavelength response of the emission monochromator and the signal detector. To obtain a corrected emission scan, an emission spectrum is multiplied by the appropriate emission correction-factor file. A set of emission correction factors is supplied with the instrument and stored under the name mcorrect.spc. An excitation scan corrected for the wavelength-characteristics of the xenon lamp, the aging of the xenon lamp, and the gratings in the excitation spectrometer. To obtain a first-order correction of the excitation scan, the emission detector signal is ratioed to the reference signal after the dark current and detector wavelength-response factors are applied for S c and R c (i.e., S c /R c ). This provides correction for the lamp and emission and excitation-monochromator spectral responses. To obtain a completely correct scan, the excitation correction factors (xcorrect.spc) is included. Compensates for the wavelength-dependent components of the system, like the xenon lamp, gratings, and signal detector. Emission and excitation correction-factor files are included with the software and are titled xcorrect.spc and mcorrect.spc. Xcorrect.spc and mcorrect.spc are applied automatically in the Dual-FL software. Optical component that passes light of a higher wavelength. Optical component that passes light of a lower wavelength. The software correction used to subtract dark counts (or dark signal) on a detector from a spectral acquisition. This feature is implemented automatically in Dual-FL software. A file used to store spectral data, constant-wavelength analysis data, or other recorded data. In Aqualog software, the most common datafile is the Origin project (.opj). This is the file-type that contains spectra acquired from a scan run from the Experiment Setup menu (e.g., Absorbance, 2D emission scan, kinetics scan, single-point, etc.). Chemical, organic and inorganic substances that can form during a reaction of a disinfectant (usually chlorine) with natural organic matter dissolved in the water (primarily humc and fulvic acids). Common DBPs are trihalomethanes and haloacetic acids. The range of wavelengths of light across the field of view of the entrance and exit apertures. Dispersion depends on the focal length of the monochromator, the groove density of the optics, and the f-number (speed) of the monochromator. Dispersion is usually expressed in na- 12-2
179 nometers of spectral coverage per millimeters of slit width (nm/mm). Glossary Emission scan Energy transfer Excitation/emission matrix (EEM) Excitation monochromator Excitation scan Excited state (S1) Experiment file Shows the spectral distribution of light emitted by the sample. During an emission scan, the excitation monochromator remains at a fixed wavelength while the emission detector scans a selected region. The transfer of the excited energy from a donor to an acceptor. The transfer occurs without the appearance of a photon and is primarily a result of dipole-dipole interactions between the donor and acceptor. A three-dimensional plot showing the total luminescence from a sample across all useful wavelengths. Total luminescence spectroscopy is devoted to measurements of these EEMs for various materials. See also: Total Luminescence Spectroscopy The monochromator, located between the xenon lamp and the sample compartment, used to isolate discrete wavelength components of the excitation beam. This beam is directed to the sample, during which the excitation monochromator may be used to scan the excitation spectrum from a sample. The excitation monochromator on the Dual-FL is a 0.10-m double monochromator with slit apertures at the entrance, intermediate and exit. An excitation shutter is located directly after the excitation exit slit to protect the sample from photobleaching between measurements. The reference detector automatically looks at a fraction of the light exiting the excitation monochromator to correct for the lamp for all Dual-FL experiments. Shows the spectral distribution of light absorbed by the sample corresponding to fluorescent components of the sample. To acquire an excitation scan, the excitation monochromator scans a selected spectral region while the emission detection remains at a fixed wavelength region. In the Dual-FL, 2D excitation spectral profiles must be extracted from the EEM data set using the 2D profile tool. The energy level to which an electron in the ground level of a molecule is raised after the absorption of a photon of a particular wavelength. Subsequently, fluorescence occurs, if the molecule returns to the ground state via a radiative transfer from the S 1 state to the ground state. A file that contains specific information on the experimental setup for an acquisition defined in Experiment Setup. This file is saved with a default *.xml extension. In addition to basic scan parameters, this file saves system defaults and some accessory settings for the acquisition. Each acquisition type in the Dual-FL Experiment Menu has its own default experiment file (e.g., DfltEm1.xml is the default emission-scan definition). Use experiment files to archive scan settings for acquisitions that are performed routinely. 12-3
180 Extrinsic fluorescence Inherent fluorescence of probes used to study non-fluorescent molecules. Glossary Filter Fluorescence Fluorescence lifetime (τ) Fluorophore (fluorescent probe) Front-face detection Grating Ground state (S0) High-pass filter Increment Inner-filter effect An optical element that is used to select certain wavelengths of light. Types of filters include high-pass, low-pass, bandpass, and neutral density. The emission of light during the transition of electrons from the excited singlet state to the ground state from molecules originally excited by the absorption of light. Fluorescence typically occurs within ~10 9 seconds. The average length of time that a molecule remains in the excited state before returning to the ground state. A molecule or compound that has a known fluorescence response. These probes have various sensitive areas depending on the peak excitation and emission wavelengths and their fluorescence lifetimes. Fluorophores are used to provide information on concentration, size, shape, and binding, in a particular medium. Good fluorophores are stable over wide ph and temperature ranges as well as resistance to photobleaching. A mode of detection in which fluorescence is collected off the front surface of the sample. Front-face detection usually is selected for samples such as powders, thin films, pellets, cells on a cover-slip, and solids. Optical element in the monochromator, consisting of finely scribed grooves that disperse polychromatic light into its component spectra. The lowest energy level in a molecule. For fluorescence to occur, a molecule absorbs a photon of light, thereby exciting it to the S 1 level. A fluorescence emission occurs during a transition from an excited state S 1 to the ground state S 0. Optical component that passes light of a higher wavelength. The spacing between adjacent measurement points in an acquisition. Typically, increments take the form of wavelength (nm) or time (s or ms). The absorption of the excitation beam or fluorescence emission from a concentrated sample by components in the sample. Note there are Primary and Secondary inner-filter-effects (IFEs). IFEs reduce the signal intensity from the sample creating artifacts in the spectra. For this reason, we recommend using concentrations of <0.05 OD in a 1-cmpathlength cell. The IFE tool can automatically correct most samples for IFE. IFE correction requires the sample concentration be in the linear Beer-Lambert region. 12-4
181 Integration time Glossary The amount of time that each data point is collected from the detector(s), specified in seconds. Longer integration times can help improve the signal-to-noise ratio for a measurement, while shorter integration times reduce the amount of time required for a scan and prevent saturation of the fluorescence detector. Choose integration times to optimize the signal-to-noise ratio. Internal conversion Intersystem crossing Intrinsic fluorescence Jabłonski (energy) diagram Laser Linearity Low-pass filter Luminescence MCD shutter Mercury lamp Mirror-image rule Molar extinction coefficient (ε) Electronic transitions within an excited molecule that do not result in emission. Also called a non-radiative transition, this usually involves changes in vibrational levels. The electronic transition from the excited singlet state to the excited triplet state before returning to the ground state. This transition involves a change of spin that is quantum-mechanically forbidden, giving a much longer timescale than fluorescence. This transition causes phosphorescence on the timescale of microseconds to seconds. The natural fluorescent properties of molecules. A diagram that illustrates various energy levels and electronic transitions available in a particular molecule. Possible paths for fluorescence, phosphorescence, and non-radiative transfers are shown on this diagram, along with the various vibrational sub-levels available around each energy level. A monochromatic light source that provides high excitation intensity. The word laser is an acronym: Light amplification by stimulated emission of radiation. Signal response; the desired response from a light detector is a linear relationship. For example, when detector response is linear, if the light intensity doubles, the detected signal also doubles. See Spectral Calibration. Optical component that passes light of a lower wavelength. The emission of light from matter excited from a variety of processes, resulting in an electronic transition within the molecule to a lower energy state. See also: Bioluminescence, Chemiluminesence, Fluorescence. Multi-channel device shutter. Light source that emits discrete, narrow lines as opposed to a continuum. A mercury lamp can be used to check the monochromator s calibration. When the emission profile appears to be the mirror image of the absorption spectrum. The absorptivity of a particular substance, in M 1 cm
182 Monochromator The component in a spectrofluorometer that is scanned to provide the excitation spectra. Monochromators are chosen for stray-light rejection, resolution, and throughput. Glossary Neutral-density filter Optical density Optical-density effects (Inner-filter effect) Parallel Factor Analysis (PARAFAC) Phosphorescence Photobleaching An optical element that absorbs a significant fraction of the incident light. These filters usually are characterized by their optical density, on a logarithmic scale. For example, a filter with OD = 1 transmits 10% of the incident light. Ideally, these filters absorb all wavelengths equally. See also Absorbance. A synonym of absorbance. See Absorbance. Fluorescence intensities are proportional to the concentration over a limited range of optical densities. High optical densities can distort the emission spectra as well as the apparent intensities. See also Innerfilter effect. A multi-way canonical decomposition-analysis method. The emission of light or other electromagnetic radiation during the transition of electrons from the triplet state to the ground state. Phosphorescence is generally red-shifted relative to fluorescence and occurs within ~10 6 to ~1 second. To enhance phosphorescence, samples often are frozen at liquid-nitrogen temperature (77 K). The reduction in fluorescence from a photosensitive sample overly exposed to excitation light. Not all samples photobleach, but if so, take care to keep the sample out of room light. The Aqualog scans rapidly and from low energy to high energy to minimize photobleaching. Principle Component Analysis (PCA) Quantum yield (Fluorescence quantum yield) Quenching Quinine Sulfate Unit (QSU) Uses an orthogonal transformation to convert a set of observations of possibly correlated variables into a set of values of uncorrelated variables called principle components. The efficiency of the absorption of a photon to be emitted (fluoresced). Quantum yields typically are expressed as percents. The fluorescence quantum yield is the percentage of photons absorbed that actually leads to fluorescence. This number is reduced by scattering, quenching, internal conversion, and non-radiative effects, along with several other specialized processes. Reduction in the fluorescence intensity of a sample by a variety of chemical or environmental influences. Quenching may be static, dynamic, or collisional in nature. The fluorescence intensity of 1 part per million (1.26 M) quinine sulfate dissolved in 0.1 M HClO 4, when excited at nm and its emission measured at 450 nm for a prescribed set of bandpass and integra- 12-6
183 tion time conditions. Glossary Raman scattering Rayleigh scattering Real Time Control Reference detector Resolution Right-angle detection Sample changer (automated) Saturation Scatter Signal channel Scattering caused by vibrational and rotational transitions of molecular atomic bonds. Raman bands generally appear red-shifted relative to the incident electromagnetic radiation. The primary characteristic of Raman scatter is that the difference in energy between the Raman peak and the incident radiation is constant in energy units (cm 1 ) for a given molecular bond s vibrational mode. Light scattering from particles whose dimensions are much smaller than the wavelength of incident light. Rayleigh-scattered light is of the same energy as the incident light. The scattered radiation s intensity is inversely proportional to the 4 th power of the wavelength of incident radiation. The Dual-FL software application that gives the user full control of the system in real-time, in order to optimize the system setup for a particular measurement. Use Real Time Control to find the optimal slit widths for sample measurements, or to check that the excitation beam is striking the sample properly. The detector used to monitor the output of the xenon lamp. A silicon photodiode with enhanced-uv response is used for the Aqualog, and is connected to input channel R. In the Dual-FL, both the absorbance and fluorescence emission detection-paths are automatically corrected by dividing by the reference-detector signal. The ability to separate two closely spaced peaks. Resolution can be improved by decreasing the bandpass and the increment (step size). Collection of fluorescence at 90 to the incident radiation. Right-angle detection typically is selected for dilute and clear solutions. An automated accessory that automatically positions up to four cuvettes held in the sample compartment. Use this accessory to run up to four samples at one time for a small assay, or to run blanks with the samples simultaneously. Automated sample changers are thermostatted and possess magnetic stirrers. The effect of having too much signal incident on a particular detector. Saturated detectors give erroneous results, and do not show any response for small changes in signal. The Dual-FL CCD saturation (16 bits resolution) is at counts per integration-time interval. A combination of Raman, Rayleigh, and Rayleigh-Tyndall scattering, which can distort fluorescence spectra with respect to intensities and wavelengths. See: Acquisition modes. 12-7
184 Signal-to-noise ratio (S/N) The measurement of the signal observed divided by the noise component seen in that signal. Generally, the better the S/N is, the better the measurement is. Glossary Single Point Singlet state Spectral calibration Spectral correction Spectral response Spectrofluorometer Stokes shift The Dual-FL scan-type designed for performing single-point absorbance only measurements at discrete wavelength pairs. The data are acquired as single points at a user-defined set of excitation-emission wavelength pairs for a user-defined number of samples. These data are displayed in either spreadsheet format, or in a plot. The spin-paired ground or excited state. The process of absorption generally produces the first excited singlet state, which takes time to fluoresce, and may undergo intersystem crossing to form a triplet state. The accuracy of a monochromator with respect to its wavelength alignment. This is a measure of the monochromator being at the correct wavelength when it is set there. Monochromators are traditionally calibrated using line-spectra sources, such as mercury lamps. The Dual-FL automatically checks its calibration via validation tests. The removal of the wavelength sensitivity of detectors, optics, sources, and backgrounds from the spectrum taken on a sample. All corrections are applied automatically with Dual-FL software. When spectral correction has been properly performed, the true theoretical spectra from a sample should be all that remains. Spectral correction is accomplished with a variety of options on HORIBA Scientific spectrofluorometers. Excitation and emission correction-factor files are provided to remove the wavelength-sensitivity of detectors and their optics. The reference detector is present to remove the lamp and excitation optics response. Blank-subtraction and dark-offset are used to remove background levels and responses. All detectors have a higher sensitivity to some wavelengths than to others. The spectral response of a detector is often expressed graphically in a plot of responsivity versus wavelength. An analytical instrument used to measure the fluorescence properties of a molecule or substance. The device consists of at least two monochromators, a source, a sample compartment and detection electronics. The instruments may be scanned on the excitation, emission or both to provide insight on the characteristics of the sample being studied. Newer spectrofluorometers provide many more automated options, including polarization, temperature, titer plates, pressure, and many more. Today, these instruments are computer-controlled, allowing easy control of assays and complex experiments. Generally, the energy-difference between the absorption peak of lowest energy and the fluorescence peak of maximum energy. 12-8
185 Technical spectrum Glossary A spectrum acquired on research instrumentation with instrumental bias remaining in the measurement. This spectrum must undergo proper spectral correction in order to match the theoretical spectrum. HORIBA Scientific spectrofluorometers offer various methods for such correction, including spectral correction, dark offset, blank subtraction, and others. Temperature scan Throughput Time-based scan Total luminescence spectroscopy (TLS) Transmission Triplet state (T1) Tyndall scattering Vibrational states A Kinetics scan-definition that consists of a particular scan made across a user-defined temperature range. This scan may be used to monitor a sample s temperature response, or, more specifically, to perform a melting curve for a sample. Temperature scans require an automated bath compatible with Aqualog software to be attached to the spectrofluorometer system along with a thermostattable sample mount. The amount of light that passes through the spectrofluorometer for a particular measurement. The throughput usually is measured as the counts per second measured on the water Raman band at 350-nm excitation with 5-nm bandpass. As bandpass increases, so does the throughput. Like bandpass, throughput has an inverse relationship with resolution. When the throughput is increased, the resolution decreases. Scan type in which the sample signal is monitored as a function of time, while both the excitation and the emission spectrometers remain at fixed wavelengths. Time-based data are used to monitor enzyme kinetics, dual-wavelength measurements, and determine reaction-rate constants. Spectroscopy devoted to monitoring changes to the entire excitation/emission matrix of luminescence on a sample. This discipline is best applied to fast kinetics measurements of samples during reactions, temperature curves, or changes in other parameters. Light that passes through a sample without being absorbed, scattered, or reflected. Transmission is usually measured as a percentage of the incident light at a certain wavelength. The spin-paired ground or excited state formed from the excited singlet state, in which electrons are unpaired. The triplet state gives rise to phosphorescence. Scatter that occurs from small particles in colloidal suspensions. Sublevels within an electronic energy level resulting from various types of motion of the atoms in a molecule. Transition between these states at a particular energy level does not involve a large change in energy, and typically is a non-radiative transition. In larger electronic transitions such as fluorescence, a molecule drops from the lowest vibrational level of the excited state to the highest vibrational level of the ground state. This emission is termed the Stokes shift between the S
186 and ground states. Glossary Xenon lamp Xenon-lamp scan Lamp that produces a continuum of light from the ultraviolet to the near-infrared for sample excitation. A profile of the lamp output as a function of wavelength. The lamp scan is acquired using the reference detector while scanning the excitation spectrometer. The maximum xenon-lamp peak at 467 nm can be used to determine proper calibration of the excitation spectrometer
187 13: Bibliography Bibliography P.M. Bayley and R.E. Dale, Spectroscopy and the Dynamics of Molecular Biological Systems, Academic Press, London, R.S. Becker, Theory and Interpretation of Fluorescence and Phosphorescence, Wiley- Interscience, New York, I.B. Berlman, Handbook of Fluorescence Spectra in Aromatic Molecules, 2nd ed., Vols. I & II, Academic Press, New York, C.R. Cantor and P.R. Schimmel, Biophysical Chemistry: Techniques for the Study of Biological Structure and Function, Vols. 1 & 2, W.H. Freeman, New York, 1980 & M. Chalfie and S. Kain, Green Fluorescent Protein: Properties, Applications, and Protocols (Methods of Biochemical Analysis), 2 nd ed., Jossey-Bass, New York, R.F. Chen, et al., Biochemical Fluorescence: Concepts, Vol. I & II, 1964 & R.M. Cory, and D. M. McKnight, Fluorescence spectroscopy reveals ubiquitous presence of oxidized and reduced quinones in dissolved organic matter, Environ. Sci. Technol. 39, (2005)., et al., Effect of instrument-specific response on the analysis of fulvic acid fluorescence spectra, Limnol. Oceanogr.: Methods 8, (2010). J.N. Demas, Excited State Lifetime Measurements, Academic Press, New York, P.C. DeRose and U. Resch-Genger, Recommendations for Fluorescence Instrument Qualification: The New ASTM Standard Guide, Anal. Chem., 82, (2010)., et al., Qualification of a fluorescence spectrometer for measuring true fluorescence spectra, Rev. Sci. Instr. 78, (2007). E. Gratton, D.M. Jameson, and R.D. Hall, Multifrequency Phase and Modulation Fluorometry, Ann. Rev. Biophys. Bioeng. 13, (1984). Q. Gu and J.E. Kenny, Improvement of Inner Filter Effect Correction Based on Determination of Effective Geometric Parameters Using a Conventional Fluorimeter, Anal. Chem. 81, (2009). G.G. Guilbault, ed., Fluorescence Theory, Instrumentation and Practice, Marcel Dekker, New York, 1967., Practical Fluorescence: Theory, Methods and Techniques, 2 nd ed., Marcel Dekker, 1990., Molecular Fluorescence Spectroscopy, Anal. Chem. 8, (1977). D.M. Hercules, ed., Fluorescence and Phosphorescence Analysis, Wiley-Interscience, New York, Henderson, et al., Fluorescence as a potential monitoring tool for recycled water systems: A review, Water Research 43, 863 (2010). Holbrook, et al., Excitation emission matrix fluorescence spectroscopy for natural organic matter characterization: A quantitative evaluation of calibration and spectral correction procedures, Appl. Spectroscopy 60(7), 791(2006). 13-1
188 Bibliography Hudson, et al., Fluorescence analysis of dissolved organic matter in natural, waste and polluted waters A, Review. River. Res. Applic. 23, (2007). J.D. Ingle and S.R. Courch, Spectrochemical Analysis, Prentice-Hall, Englewood Cliffs, NJ, F.H. Johnson, The Luminescence of Biological Systems, Amer. Assoc. Adv. Sci., Washington, D.C., S.V. Konev, Fluorescence and Phosphorescence of Proteins and Nucleic Acids, Plenum Press, New York, M.A. Konstantinova-Schlezinger, ed. Fluorometric Analysis, Davis Publishing Co., New York, J. R. Lakowicz, Principles of Fluorescence Spectroscopy, 3 rd ed., Springer, New York, 2006., ed., Topics in Fluorescence Spectroscopy, Vols. 1 5, Plenum Press, New York, , Badri P. Melinal, Enrico Gratton, Recent Developments in Frequency- Domain Fluorometry, Anal. Instr., 14 (314), (1985)., S. Soper, and R. Thompson, Advances in Fluorescence Sensing Technology IV, SPIE Proc. Series, Vol (1999). T. Larsson, M. Wedborg, and D. Turner, Correction of inner-filter effect in fluorescence excitation-emission matrix spectrometry using Raman scatter, Anal. Chim. Acta, 583, (2007). B. C. MacDonald, S. J. Lvin, and H. Patterson, Correction of fluorescence inner filter effects and the partitioning of pyrene to dissolved organic carbon, Anal. Chim. Acta, 338, 155 (1997). W.T. Mason, ed., Fluorescent and Luminescent Probes for Biological Activity: A Practical Guide to Technology for Quantitative Real-Time Analysis, 2 nd ed., Academic Press Harcourt Brace & Co., W.H. Melhuish and M. Zander, Nomenclature, Symbols, Units and Their Usage in Spectrochemical Analysis VI: Molecular Luminescence Spectroscopy, Pure App. Chem., 53, 1953 (1981). J.N. Miller, ed., Standardization & Fluorescence Spectrometry: Techniques in Visible and Ultraviolet Spectrometry, Vol. 2, Chapman and Hall, Murphy, et al., The measurement of dissolved organic matter fluorescence in aquatic environments: An interlaboratory comparison, Environ. Sci. Technol. (in press) (2010). W.G. Richards and P.R. Scott, Structure and Spectra of Molecules, John Wiley & Sons, A. Schillen, et al., Luminescence of Organic Substances, Hellwege Verlag, Berlin, S.G. Schulman, ed., Molecular Luminescence Spectroscopy: Methods and Applications, Vols. 1 3, Wiley-Interscience, New York, A. Sharma and S. Schulman, Introduction to Fluorescence Spectroscopy, Wiley Interscience, New York,
189 Bibliography D.A. Skoog, F.J. Holler, and T.A. Nieman, Principles of Instrumental Analysis, 5 th ed., Brooks Cole, New York, C. A. Stedmon, S. Markager, and R. Bro, Tracing dissolved organic matter in aquatic environments using a new approach to fluorescence spectroscopy, Mar. Chem. 82, (2003)., Characterizing dissolved organic matter fluorescence with parallel factor analysis: a tutorial, Limnol. Oceanogr.: Methods 6, (2008). N.J. Turro, V. Ramamurthy, and J.C. Scaiano, Modern Molecular Photochemistry of Organic Molecules, University Science Books, New York, K. Van Dyke, Bioluminescence and Chemiluminescence: Instruments and Applications, Vol. 1, CRC Press, Boca Raton, FL, T. Vo-Dinh, Room Temperature Phosphorimetry for Chemical Analysis, Wiley- Interscience, New York, I.M. Warner and L.B. McGown, ed., Advances in Multidimensional Luminescence, Vols. 1 & 2, JAI Press, Greenwich, CT, E.L. Wehry, ed., Modern Fluorescence Spectroscopy, Vol. 1 4, Plenum Press, New York, C.E. White and R.J. Argauer, Fluorescence Analysis: A Practical Approach, Marcel Dekker, New York, J.D. Winefordner, S.G. Schulman, and T.C. O Haver, Luminescence Spectrometry in Analytical Chemistry, Wiley-Interscience, New York, In addition, the following journals may prove useful: Analytical Chemistry Biophysics and Biochemistry Journal of Fluorescence Nanotechnology Letters 13-3
190 Bibliography 13-4
191 Compliance Information 14 : Compliance Information Declaration of Conformity Manufacturer: Address: Product Name: Aqualog Model #: HORIBA Instruments Incorporated 3880 Park Avenue Edison, NJ USA Aqualog Aqualog-UV Dual-FL Conforms to the following Standards: Safety: EN : 2001 EMC: EN : 2006 (Emissions & Immunity) Supplementary Information The product herewith complies with the requirements of the Low Voltage Directive 2006/95/EEC and the EMC Directive 2004/108/EC. The CE marking has been affixed on the device according to Article 8 of the EMC Directive 2004/108/EC. The technical file and documentation are on file with HORIBA Instruments Incorporated. Sal Atzeni Vice-President, Retail Engineering, and CTO HORIBA Scientific Edison, NJ USA December 10,
192 Applicable CE Compliance Tests and Standards Test Standards Emissions, Radiated/Conducted EN : 2006 Radiated Immunity EN : 2006 Conducted Immunity EN : 2006 Electrical Fast Transients EN : 2006 Electrostatic Discharge EN : 2006 Voltage Interruptions EN : 2006 Surge Immunity EN : 2006 Magnetic Field Immunity EN : 2006 Harmonics EN : 2006 Flicker EN : 2008 Safety EN : 2001 Compliance Information 14-2
193 15: Index Key to the entries: Times New Roman font... subject or keyword Arial font... command, menu choice, or data-entry field Arial Condensed Bold font... dialog box Courier New font... file name or extension button , pin connector , OFR D button , 6-25 A About Dual-FL window About Dual-FL Abs and Trans Graphs tab Abs Photometric Accuracy (NIST SRM 935a) Abs Spectra Graphs tab , 6-28 Abs/Ex Wavelength Accuracy Absorbance absorbance scan , 6-1, 6-2 Accumulations field Add button Add Sample Types window Advanced button Alconox All Programs Allen key 2-5, 9-1, 9-3, 9-5, 9-7, 9-9, Index Apply button Auto Run Previous Experiment button. 5-8 B bandpass , 8-6, 11-2 batch job Beer-Lambert law Bin field biological samples *.blank blank , 6-7, 6-10 Blank blank files blazing Browse button Browse for experiment files to >> Add button C cables , 2-9, 7-2 3, 9-2, 9-12, Cancel button.. 4-6, 4-9, 4-12, 4-15, 4-18, 4-21, 5-18, 6-5, 6-20, 6-23, 9-19, caution notice CCD detector. 3-2, 3-5 6, 4-10, 7-1 2, 8-4 5, CCD Gain drop-down menu 6-7, 6-10, 6-19, 6-26 CE compliance CE Compliance Tests and Standards Collect , 4-7, 4-10, 4-13, 4-16, 4-19 Comments field Continuous checkbox correction-factor files coverslips Create Report button , 6-16, 6-32 cuvettes 1-4, 4-10, 7-2, 8-1 2, 10-7, 10-9, D danger to fingers notice
194 Aqualog Operation Manual rev. C (8 Aug 2012) dark current Dark Offset checkbox Declaration of Conformity de-ionized water , 8-1, 9-13 Delay before executing field Delay before first field Delay between each field Delay between each repeat list field Delete button detector , 3-2, 3-6, 7-1, 8-4, 11-1 Detectors icon Device Id field Dewar flask dimensions disclaimer dispersion , 11-2 dissolved solids Double Spectrometer area Down button Dual-FL Configuration window Dual-FL Experiment Options area Dual-FL Experiment Setup window 2-11, 5-3, 5-6, 6-2, 6-6, 6-9, 6-18, 6-21, 6-26 Dual-FL Experiment Type window. 2-10, 5-3, 6-2, 6-6, 6-9, 6-18, 6-25, 9-15 Dual-FL icon , 4-2 Dual-FL Main Experiment Menu. 2-10, 5-2 3, 6-2, 6-6, 6-9, 6-18, 6-21, 6-25, 9-14 Dual-FL main window , 4-2, 4-4, 4-7, 4-10, 4-13, 4-16, 4-19, 5-16, 7-4 Dual-FL software.. 0-1, 2-5, 2-7, 2-9, 2-11, 3-4, 3-6 7, 4-3 4, 5-1, 7-1, 7-3 5, 8-6 8, 9-14, 11-4 Dual-FL V... tab Dual-Position Thermostatted Cell Holder10-8 DVD E EEM 1-2 6, 5-3, 5-18, 5-20, 6-1, 6-9, 6-16, 6-26, 6-32 EEM 3D + Absorbance , 6-26 electric shock notice electrical requirements electronics , 7-2 elliptical mirror Emission 2D , 9-15 emission scan , 6-25 Introduction Emulate button emulation environmental requirements ethylene glycol , 10-8, excessive humidity notice Execution List , 5-15 excitation scan Excitation Wavelength excitation-emission map Experiment Menu button 2-9, 5-2 3, 6-2, 6-6, 6-9, 6-18, 6-21, 6-25 Experiment Paused window , 6-22 Experiment Setup window , 7-1, 7-6, 8-6 8, 9-15 Experiment Status window. 4-6, 4-9, 4-12, 4-15, 4-18, 4-21, 5-18, 6-7, 6-10, 6-19, 6-26 explosion notice extinction coefficient extreme cold notice F F F face-shield notice fiber-optic bundle Fiber Optic Mount File field File Name field filter-wheel FL FL FL FL FL flow chart Fluorescence Correction (NIST SRM 2941) Fluorescence Correction (NIST SRM 2942) Fluorescence Correction (NIST SRM 2943) FM , 10-8, Four-Position Thermostatted Cell Holder 10-6 fused silica fuses ,
195 Aqualog Operation Manual rev. C (8 Aug 2012) G grating , 11-2 H help Help highly opaque samples HJY_normalize window , 6-14, 6-30 host computer.. 0-1, 2-4 5, 2-7 9, 3-2, 3-7, 4-2, , 5-13, 7-3, 9-1 2, 11-1, 11-4 hot equipment notice hour-meter HPLC Flow Cell I IFE , 1-4, 1-5 IFE button , 6-13, 6-29 Increment drop-down menu. 6-7, 6-10, 6-19, 6-26, 8-8 Injector Port inner-filter effect , , 5-13, 6-13, 6-29, 8-2 Input Values button , 6-32 Input Values window , 6-16, 6-32 Installed Components window integrating sphere integration time , 11-2 Integration Time intense light notice Intercept Intercept sd Intermediate Display screen.. 5-5, 5-8, 6-3 4, 6-8, 6-11, 6-27 Interval IR sensor J J J J , J J J Introduction J J J J Jobin Yvon JY Rayleigh Masking User Input window , 6-13, 6-30.jyb K K 2 Cr 2 O 7 blank , 4-8 Kinetics button kinetics run , 6-1, 6-18, L Lamp hours warning notice lamp housing , Lamp Info window lamp replacement Lamp Reset leveling feet liquid nitrogen Liquid Nitrogen Dewar Assembly Load button Lorentzian distribution M magnetic stirrer , 10-4, maintenance Material Safety Data Sheets maximum temperature fluctuation M correct MgF monochromator 3-1, 3-3 5, 4-1, 4-3, 5-2, 7-1, 7-3, 8-4, 9-6, 10-5, , monolayers MSDS N Next >> button 2-11, 5-3, 6-2, 6-6, 6-9, 6-18, 6-26, 9-15 Next>> button
196 Aqualog Operation Manual rev. C (8 Aug 2012) NIST , 4-13 nitric acid Normalize button , 6-14, 6-30 Number of Standards Number of Unknowns Introduction Quinine Sulfate sample quinine sulfate solution , 6-21 Quinine Sulfate standard kit quinine sulfate unit Quinine Sulfate Units button O OK button 4-6, 4-9, 4-12, 4-15, 4-18, 4-21, 5-5, 5-10, 5-12, 5-18, 6-3 5, 6-7 8, , , 6-16, 6-20, , 6-27, , 7-5, 7-8, 9-1, 9-14 Open optical layout Origin , 5-5, 5-8, 5-16, 7-5 P Performance Test Report Phillips screwdriver photobleaching , 3-4, 8-8 photodiode , 11-2, 11-3 pixel-binning , 6-10, 6-26, 8-5 Position field potassium bromide powder , power cord , 9-2 power supply , 9-2 power switch Previous Experiment Setup button Print Info button Processed Graph IFE tab Processed Graph NRM tab Processed Graph RM Profile button , 6-32 Profile Tool button Project name window 4-6, 4-9, 4-12, 4-15, 4-18, 4-21, 5-5, 5-18, 6-4, 6-20, 6-23 protective gloves notice Q QSU quantum yields Quartz Cuvette quartz window Quinine Sulfate blank R R Raman scattering Rayleigh scattering Rayleigh masking Rayleigh Masking button , 6-13, 6-30, 7-2 R c Read this manual notice Real Time Control.. 7-1, 7-6, 8-6, 9-15, reference detector1-2 3, 3-2, 3-5 6, 7-1, 11-1 relative humidity , 11-3 Rescale Y button Reset Lamp button resolution RMS noise RTC button , 9-15 Run button.. 4-5, 4-8, 4-11, 4-14, 4-17, 4-20, 5-4, 5-7, 5-15, 5-18, 6-3, 6-7, 6-10, 6-19, 6-22, 6-26, 9-17 Run JY Batch Experiments button S S S/N , S/R safety goggles safety summary safety-training requirements Sample - Blank Contour Plot tab 6-12, 6-28 Sample Cell sample changer. 3-5, 6-2 4, 6-6 7, , 6-18, 6-21, 6-25, 6-27, 7-1, 7-3 sample compartment.. 3-5, , 5-4, 6-2 4, 6-6, 6-9, 6-18, 6-21, 6-23, 6-25, 7-2, 9-3, 9-13, 10-5, Sample Compartment Accessory , 10-8,
197 Aqualog Operation Manual rev. C (8 Aug 2012) sample-compartment lid. 4-6, 4-9, 4-12, 4-15, 4-18, 4-21, 5-18, 6-20, 6-27 sample mount sample platform sample preparation Samples area Samples table Save button Save To File... button S c scan speed sensitivity , 11-2 serial number , 9-14 Service Department , 4-9, 4-12, 4-15, 4-18, 4-21, 7-1 4, 7-8 Setup batch experiments window shutter , 7-1, 11-2 Shutter Mode slide-switch signal-to-noise ratio , 8-5 Single Channel Advanced Parameters window Single Point button Single Point Std tab single-point spectra , 6-21 Single-Position Thermostatted Cell Holder slits , 8-4, 11-2 Slope Slope sd small-volume samples softkey device solid-sample holder , 8-2, 8-4, solid samples special buttons special sample holder spectral correction-factors Spectra button , 6-6, 9-14 SpectrAcq firmware version SRM SRM SRM SRM 935a Standard Starna RM sample Starna sealed water-raman sample Start menu stirring bar surface requirements Introduction Switch menu between HJY Software Application and Origin Std. button system configuration System Initialization Process window T Teflon , temperature bath , 10-6, 10-8, 10-10, thin films , three-dimensional absorbance scan three-dimensional emission spectra , 6-9 toolbar 5-6, , 5-12, 5-17, 5-20, 5-22, 7-4 Total Repeats field trigger accessory trigger cable TRIGGER IN connector troubleshooting turning on the system two-dimensional emission spectra , 6-6 U ultraviolet light notice Unknown chart unpacking and installation Up button USB cable , 7-2 3, 9-2 USB port Utilities V Validation Tests.. 4-4, 4-7, 4-11, 4-13, 4-16, 4-19 View System Info button W warning notice water-raman scan , 11-2 Water Raman SNR and Emission Calibration Wavelength list
198 Aqualog Operation Manual rev. C (8 Aug 2012) Wavelengths area Windows.. 0-1, 2-7, 3-7, 4-2, 7-3, 9-13, 11-4 Introduction X X correct xenon lamp , 3-3, 3-6, 4-1, 4-22, 7-2, 9-1 2, 9-6, , 10-14, 11-2 xenon-lamp bulbs xenon-lamp scan xml Z Zip Info button
199 3880 Park Avenue, Edison, New Jersey , USA [Design Concept] The HORIBA Group application images are collaged in the overall design. Beginning from a nano size element, the scale of the story develops all the way to the Earth with a gentle flow of the water.

200
Aqualog Operation Manual rev. E (3 Oct 2013) Aqualog. Operation Manual. Rev. E
 Aqualog. Operation Manual. Rev. E") Aqual og Oper at i onmanual Par tnumberj810012r ev.e Aqualog Operation Manual http://www.horiba.com Rev. E i Copyright 2011 2013 by HORIBA Instruments Incorporated. All rights reserved. No part of this
Aqual og Oper at i onmanual Par tnumberj810012r ev.e Aqualog Operation Manual http://www.horiba.com Rev. E i Copyright 2011 2013 by HORIBA Instruments Incorporated. All rights reserved. No part of this
FluoroMax -4 & FluoroMax -4P with USB
 FluoroMax -4 & FluoroMax -4P with USB Operation Manual http://www.horiba.com Rev. E i Copyright 2011, 2012, 2015 by HORIBA Instruments Incorporated. All rights reserved. No part of this work may be reproduced,
MicroMax 384 v. 3.0 (9 Mar 2007)
") MicroMax 384 with FluorEssence Operation Manual Rev. 3 www.jobinyvon.com i Copyright HORIBA Jobin Yvon Inc. All rights reserved. No part of this work may be reproduced, stored, in a retrieval system, or
MicroMax 384 with FluorEssence Operation Manual Rev. 3 www.jobinyvon.com i Copyright HORIBA Jobin Yvon Inc. All rights reserved. No part of this work may be reproduced, stored, in a retrieval system, or
FluoroMax -3 & FluoroMax -P with FluorEssence
 FluoroMax-3 v. 3.1 (3 Mar 2006) FluoroMax -3 & FluoroMax -P with FluorEssence Operation Manual http://www.jobinyvon.com Rev. 3.1 (All HORIBA Jobin Yvon companies were formerly known as Jobin Yvon) USA:
Aqualog. CDOM Measurements Made Easy PARTICLE CHARACTERIZATION ELEMENTAL ANALYSIS FLUORESCENCE GRATINGS & OEM SPECTROMETERS OPTICAL COMPONENTS RAMAN
 Aqualog CDOM Measurements Made Easy ELEMENTAL ANALYSIS FLUORESCENCE GRATINGS & OEM SPECTROMETERS OPTICAL COMPONENTS PARTICLE CHARACTERIZATION RAMAN SPECTROSCOPIC ELLIPSOMETRY SPR IMAGING CDOM measurements
FL-1040 Phosphorimeter for Dual-Lamp Housing
 FL-1040 Phosphorimeter for Dual-Lamp Housing Operation Manual Rev. C www.horiba.com/scientific i Copyright 2003, 2012 by HORIBA Instruments Incorporated All rights reserved. No part of this work may be
The only simultaneous absorbance and f uorescence system for water quality analysis! Aqualog
 The only simultaneous absorbance and fluorescence system for water quality analysis! Aqualog CDOM measurements made easy. The only simultaneous absorbance and fluorescence system for water quality analysis!
Dual-FL. World's Fastest Fluorometer. Measure absorbance spectra and fluorescence simultaneously FLUORESCENCE
 Dual-FL World's Fastest Fluorometer Measure absorbance spectra and fluorescence simultaneously FLUORESCENCE 100 Times Faster Data Collection The only simultaneous absorbance and fluorescence system available
LSH-Series Lamp Housings
 LSHSer i es LampHousi ngs Oper at i onmanual Par tnumberj81007r ev.b LSH-Series Lamp Housings Operation Manual Rev. B http://www.horiba.com/scientific i ii Copyright 1996 2012 by HORIBA Instruments Incorporated.
Symphony II CCD Detection System
 Symphony II rev. ( ) Symphony II rev. C (2 Feb 2012) Symphony II CCD Detection System Operation Manual http://www.horiba.com Rev. C i Symphony II rev. C (2 Feb 2012) Copyright 2012 by HORIBA Instruments
FluoroMax -3 & FluoroMax -P
 Fluoromax-3 v. 2.0 (1 Oct 2001) FluoroMax -3 & FluoroMax -P Operation Manual http://www.isainc.com Rev. 2 In the USA: Jobin Yvon Inc. 3880 Park Avenue, Edison, NJ 08820 In France: Japan: (81) 3/5823.0140
Aqualog. Water Quality Measurements Made Easy FLUORESCENCE
 Aqualog Water Quality Measurements Made Easy FLUORESCENCE Water quality measurements made easy The only simultaneous absorbance and fluorescence system for water quality analysis! The new Aqualog is the
Aqualog. Water Quality Measurements Made Easy PARTICLE CHARACTERIZATION ELEMENTAL ANALYSIS FLUORESCENCE
 Aqualog Water Quality Measurements Made Easy ELEMENTAL ANALYSIS FLUORESCENCE GRATINGS & OEM SPECTROMETERS OPTICAL COMPONENTS PARTICLE CHARACTERIZATION RAMAN SPECTROSCOPIC ELLIPSOMETRY SPR IMAGING Water
SPECTRONIC Standards User Guide
 SPECTRONIC Standards User Guide The information in this publication is provided for reference only. All information contained in this publication is believed to be correct and complete. Thermo Fisher Scientific
University of Wisconsin Chemistry 524 Spectroscopic Components *
 University of Wisconsin Chemistry 524 Spectroscopic Components * In journal articles, presentations, and textbooks, chemical instruments are often represented as block diagrams. These block diagrams highlight
Horiba LabRAM ARAMIS Raman Spectrometer Revision /28/2016 Page 1 of 11. Horiba Jobin-Yvon LabRAM Aramis - Raman Spectrometer
 Page 1 of 11 Horiba Jobin-Yvon LabRAM Aramis - Raman Spectrometer The Aramis Raman system is a software selectable multi-wavelength Raman system with mapping capabilities with a 400mm monochromator and
Sarspec, Lda. - Rua Camilo Castelo Branco, 965 PQ Vila Nova de Gaia Phone:
 2 3 IMPORTANT SAFETY NOTE: Before operating this device, please read carefully this User Manual and be familiar with its contents prior to using this equipment. To help avoid potential serious injury to
Operating Manual. Model 721N. Visible Spectrophotometer
 Operating Manual of Model 721N Visible Spectrophotometer 1 Table of Contents 1. Chief uses... 3 2. Working Conditions... 3 3. Main Specifications...3 4.Operating Principles...4 5. Optical design...4 6.
Applications of Steady-state Multichannel Spectroscopy in the Visible and NIR Spectral Region
 Feature Article JY Division I nformation Optical Spectroscopy Applications of Steady-state Multichannel Spectroscopy in the Visible and NIR Spectral Region Raymond Pini, Salvatore Atzeni Abstract Multichannel
Model 5100F. Advanced Test Equipment Rentals ATEC (2832) OWNER S MANUAL RF POWER AMPLIFIER
 OWNER S MANUAL RF POWER AMPLIFIER") Established 1981 Advanced Test Equipment Rentals www.atecorp.com 800-404-ATEC (2832) OWNER S MANUAL Model 5100F RF POWER AMPLIFIER 0.8 2.5 GHz, 25 Watts Ophir RF 5300 Beethoven Street Los Angeles, CA 90066
Established 1981 Advanced Test Equipment Rentals www.atecorp.com 800-404-ATEC (2832) OWNER S MANUAL Model 5100F RF POWER AMPLIFIER 0.8 2.5 GHz, 25 Watts Ophir RF 5300 Beethoven Street Los Angeles, CA 90066
USER MANUAL FOR VISIBLE SPECTROPHOTOMETER
 USER MANUAL FOR VISIBLE SPECTROPHOTOMETER 1 Table of Contents 1. MAIN USAGES...3 2. WORKING ENVIRONMENT...3 3. MAIN TECHNICAL DATA AND SPECIFICATIONS...4 4. WORKING PRINCIPLE...5 5. OPTICAL PRINCIPLE...6
Chemistry 524--"Hour Exam"--Keiderling Mar. 19, pm SES
 Chemistry 524--"Hour Exam"--Keiderling Mar. 19, 2013 -- 2-4 pm -- 170 SES Please answer all questions in the answer book provided. Calculators, rulers, pens and pencils permitted. No open books allowed.
Spectroscopy Application: Using Raman Spectroscopy to Detect Art Forgeries Detecting art forgeries using Raman spectroscopy
 Spectroscopy Application: Using Raman Spectroscopy to Detect Art Forgeries 5 Detecting art forgeries using Raman spectroscopy In the previous experiment, you were introduced to Raman spectroscopy. This
Thermo Scientific SPECTRONIC 200
 molecular spectroscopy Thermo Scientific SPECTRONIC 200 Part of Thermo Fisher Scientific The New Standard for Routine Measurements Robust, Multifunction Sample Compartment Whether you measure in 10 mm
Wide Angle Ophthalmoscope Instructions
 Wide Angle Ophthalmoscope Instructions PLEASE READ AND FOLLOW THESE INSTRUCTIONS CAREFULLY Contents 1. Symbols 2. Warnings & Cautions 3. Description of Product 4. Getting Started 5. Apertures & Filters
2001A. 200KHz Function Generator Instruction Manual. 99 Washington Street Melrose, MA Phone Toll Free
 2001A 200KHz Function Generator Instruction Manual 99 Washington Street Melrose, MA 02176 Phone 781-665-1400 Toll Free 1-800-517-8431 Visit us at www.testequipmentdepot.com WARRANTY Global Specialties
CONFIGURING. Your Spectroscopy System For PEAK PERFORMANCE. A guide to selecting the best Spectrometers, Sources, and Detectors for your application
 CONFIGURING Your Spectroscopy System For PEAK PERFORMANCE A guide to selecting the best Spectrometers, s, and s for your application Spectral Measurement System Spectral Measurement System Spectrograph
Thermo Scientific SPECTRONIC 200 Visible Spectrophotometer. The perfect tool. for routine measurements
 Thermo Scientific SPECTRONIC 200 Visible Spectrophotometer The perfect tool for routine measurements The Standard for Routine Measurements Thermo Scientific SPECTRONIC spectrophotometers have served as
PD-3000UV. INSTRUCTION MANUAL UV-VIS Spectrophotometer OMA IMPORTANT!
 INSTRUCTION MANUAL UV-VIS Spectrophotometer PD-3000UV IMPORTANT! READ THIS OPERATION MANUAL! *Prior to operation, please read this manual carefully and retain it for future reference. Failure to read,
2011 / Circuit Tracer
 INSTRUCTION MANUAL 2011 / 00521 Circuit Tracer Read and understand all of the instructions and safety information in this manual before operating or servicing this tool. 52044992 2008 Greenlee Textron
Model #2 UVB Midband Ultraviolet Lamp Assembly with Timer
 UVB Midband Technology The Model 2 Rayminder Lamp - The World's Only UVB Midband Lamp Based On Original Research Patented design based on research. Tested and certified to Rayminder's Proprietary Select
Thermo Scientific SPECTRONIC 200 Education
 molecular spectroscopy Thermo Scientific SPECTRONIC 200 Education Part of Thermo Fisher Scientific Designed for the Teaching Laboratory Classroom Friendly Sample Compartment Whether you measure in 10 mm
ProHead. User s Guide
 ProHead User s Guide 2Profoto ProHead Profoto ProHead Thank you for choosing Profoto. Thanks for showing us your confidence by investing in a ProHead unit. For more than four decades we have sought the
LED PowerBlinder 4 ORDERCODE 41320
 LED PowerBlinder 4 ORDERCODE 41320 Congratulations! You have bought a great, innovative product from Showtec. The Showtec LED PowerBlinder brings excitement to any venue. Whether you want simple plug-&-play
Compact High Intensity Light Source
 Compact High Intensity Light Source General When a broadband light source in the ultraviolet-visible-near infrared portion of the spectrum is required, an arc lamp has no peer. The intensity of an arc
ECEN. Spectroscopy. Lab 8. copy. constituents HOMEWORK PR. Figure. 1. Layout of. of the
 ECEN 4606 Lab 8 Spectroscopy SUMMARY: ROBLEM 1: Pedrotti 3 12-10. In this lab, you will design, build and test an optical spectrum analyzer and use it for both absorption and emission spectroscopy. The
User guide ProHead Plus
 User guide ProHead Plus For other languages visit: /support ProHead Plus 2 Congratulations on your new Profoto product! Thanks for showing us your confidence by investing in a ProHead unit. For more than
UV / VIS Spectrophotometer EMCLAB Instruments GmbH
 A Professional Manufacturer UV / VIS Spectrophotometer EMCLAB Instruments GmbH EMCLAB Instruments GmbH Bismarckstrasse 120 47057 Duisburg Germany Phone: +49 203 3064042 Fax: +49 203 3064044 E-mail: info@emc-lab.de
Tunable KiloArc. Tunable Broadband Light Source.
 Optical Building Blocks Corporation Tunable KiloArc Tunable Broadband Light Source www.obb1.com Tunable KiloArc Need a CW laser that is tunable from 250 to 1,100 nm? yes Need it to deliver Hundreds of
MANUAL BMS SPEC5000 Spectrophotometer
 MANUAL BMS SPEC5000 Spectrophotometer BMS Art. Nr. 17020 1 PRINCIPLE, APPLICATION AND CHARACTERISTICS 1.1 Principle The SPEC5000 spectrophotometer is a single beam spectrophotometer with a basic structure
The equipment used share any common features regardless of the! being measured. Electronic detection was not always available.
 The equipment used share any common features regardless of the! being measured. Each will have a light source sample cell! selector We ll now look at various equipment types. Electronic detection was not
MODEL W Power Amplifier
 TEGAM, INC. MODEL 2348 18.75 W Power Amplifier This owner s manual was as current as possible when this product was manufactured. However, products are constantly being updated and improved. Because of
Installation and User Guide. FlexIR TM NIR Fiber Optic Accessory
 Installation and User Guide FlexIR TM NIR Fiber Optic Accessory The information in this publication is provided for reference only. All information contained in this publication is believed to be correct
OVA-50 Optical Variable Attenuator User s Manual
 OVA-50 Optical Variable Attenuator User s Manual Shineway Technologies, Inc. All rights reserved. Safety Instructions The WARNING sign denotes a hazard. It calls attention to a procedure, practice, or
Thermo Scientific SPECTRONIC 200 Visible Spectrophotometer. The perfect. teaching instrument
 Thermo Scientific SPECTRONIC 200 Visible Spectrophotometer The perfect teaching instrument Designed for the Teaching Laboratory Thermo Scientific SPECTRONIC spectrophotometers have served as core analytical
INSTRUCTION MANUAL LKG 601 Electrical Safety Analyzer
 INSTRUCTION MANUAL LKG 601 Electrical Safety Analyzer 110 Toledo Street Farmingdale, NY 11735 USA http://www.netech.org 510-USER-Manual Rev3 10/29/2007 Dear User, We appreciate your purchase of the LKG
Agilent Cary 7000 Universal Measurement Spectrophotometer (UMS)
") Agilent Cary 7000 Universal Measurement Spectrophotometer (UMS) Specifications Introduction The Agilent Cary 7000 Universal Measurement Spectrophotometer (UMS) is designed for superior performance, flexibility
Agilent Cary 7000 Universal Measurement Spectrophotometer (UMS) Specifications Introduction The Agilent Cary 7000 Universal Measurement Spectrophotometer (UMS) is designed for superior performance, flexibility
T92+ UV-VIS SPECTROPHOTOMETER
 T92+ UV-VIS SPECTROPHOTOMETER The T92+ is a high performance double beam spectrophotometer with a variable spectral bandwidth from 0.1-5nm, selected by a continuous variable slit. The instrument is fitted
Technical Notes. Integrating Sphere Measurement Part II: Calibration. Introduction. Calibration
 Technical Notes Integrating Sphere Measurement Part II: Calibration This Technical Note is Part II in a three part series examining the proper maintenance and use of integrating sphere light measurement
Broadband Step-Up Transformer. User Manual
 Broadband Step-Up Transformer User Manual 990-1930 09/2004 Introduction Introduction About this unit The APC Step-Up Transformer provides 220 V power from 60 VAC Broadband cable systems. Safety Electrical
TEGAM, INC. SINGLE/DUAL CHANNEL HIGH VOLTAGE AMPLIFIER MODEL 2340/2350. Instruction Manual PN# CD Publication Date: June 2006 REV.
 TEGAM, INC. SINGLE/DUAL CHANNEL HIGH VOLTAGE AMPLIFIER MODEL 2340/2350 Instruction Manual PN# 810044-CD Publication Date: June 2006 REV. C This owner s manual was as current as possible when this product
IBIL setup operation manual for SynerJY software version
 IBIL setup operation manual for SynerJY software version 1.8.5.0 Manual version 1.0, 31/10/2008 Author: Carlos Marques Equipment Managers: Carlos Marques, +351219946084, cmarques@itn.pt Luís Alves, +351219946112,
TRAINING MANUAL. Multiphoton Microscopy LSM 510 META-NLO
 TRAINING MANUAL Multiphoton Microscopy LSM 510 META-NLO September 2010 Multiphoton Microscopy Training Manual Multiphoton microscopy is only available on the LSM 510 META-NLO system. This system is equipped
INSTRUCTION MANUAL INF Fax: (503)
") INSTRUCTION MANUAL INF151 1-800-547-5740 Fax: (503) 643-6322 www.ueiautomotive.com email: info@ueitest.com Introduction Congratulations on your purchase of the INF151 infrared thermometer. Like all UEi
INSTRUCTION MANUAL INF151 1-800-547-5740 Fax: (503) 643-6322 www.ueiautomotive.com email: info@ueitest.com Introduction Congratulations on your purchase of the INF151 infrared thermometer. Like all UEi
Spectroscopy in the UV and Visible: Instrumentation. Spectroscopy in the UV and Visible: Instrumentation
 Spectroscopy in the UV and Visible: Instrumentation Typical UV-VIS instrument 1 Source - Disperser Sample (Blank) Detector Readout Monitor the relative response of the sample signal to the blank Transmittance
instruments Analytical Instruments for Science
 instruments Analytical Instruments for Science instruments Contents PAGE NO. Introduction 4 T60 UV-Vis Spectrophotometer 6 T70 UV-Vis Spectrophotometer 10 T80 UV-Vis Spectrophotometer 14 T90+ UV-Vis Spectrophotometer
SPM-50 RF Spectrum Power Meter PC Software User Manual
 SPM-50 RF Spectrum Power Meter PC Software User Manual Shineway Technologies, Inc. Notices Copyright 2014, ShinewayTech, All rights reserved. No part of this manual may be reproduced in any form or by
Smart-UPS On-Line Isolation and Step-Down Transformer SRT5KTF
 Smart-UPS On-Line Isolation and Step-Down Transformer SRT5KTF Safety Messages Read the instructions carefully to become familiar with the equipment before attempting to install, operate, service or maintain
User Manual. Smart-UPS On-Line. Uninterruptible Power Supply. Isolation Transformer Models: SURT001 and SURT002
 User Manual Smart-UPS On-Line Uninterruptible Power Supply Isolation Transformer Models: SURT001 and SURT002 Isolation and Step-Down Transformer Models: SURT003 and SURT004 General Information Important
USB. Part No Wavelength range. Spectral bandwidth 5 nm 4 nm Optical system
 Visible range spectrophotometers V-1100 and VR-2000 V-1100 MODEL WITH MANUAL WAVELENGTH SETTINGS AND AUTOMATIC BLANK. VR-2000 MODEL WITH AUTOMATIC WAVELENGTH SETTINGS AND BLANK. V-1100 Part no. 4120025
SI-125 Power Amplifier Manual 6205 Kestrel Road; Mississauga, Ontario; Canada; L5T 2A1 November 2016, Rev 0.5
 SI-125 Power Amplifier Manual 6205 Kestrel Road; Mississauga, Ontario; Canada; L5T 2A1 November 2016, Rev 0.5 Phone: (905) 564-0801 Fax: (905) 564-0806 www.telecor.com E:\T2-108\T2-M108-ABC\T2-M108-B.doc/AD
Radio System Strobe Wizard Plus Freemask
 Radio System Strobe Wizard Plus Freemask User manual Translation of the original German user manual Doc. No.: 900.0509.00 Version: 09/2017 Contents Information about this manual and about the manufacturer...
Vernier SpectroVis Plus Spectrophotometer (Order Code: SVIS-PL)
") Vernier SpectroVis Plus Spectrophotometer (Order Code: SVIS-PL) SpectroVis Plus is a portable, visible to near-ir spectrophotometer and fluorometer. What is included with the SpectroVis Plus? One SpectroVis
Vernier SpectroVis Plus Spectrophotometer (Order Code: SVIS-PL) SpectroVis Plus is a portable, visible to near-ir spectrophotometer and fluorometer. What is included with the SpectroVis Plus? One SpectroVis
MODEL 3810/2 Line Impedance Stabilization Network
 EMC TEST SYSTEMS FEBRUARY 1996 REV C PN 399197 MODEL 3810/2 Line Impedance Stabilization Network OPERATION MANUAL USA P.O. Box 80589 Austin, Texas 78708-0589 2205 Kramer Lane, Austin, Texas 78758-4047
Handheld Omnidirectional Laser Scanner
 1 i Important Notice No warranty of any kind is made in regard to this material, including, but not limited to, implied warranties of merchantability or fitness for a particular purpose. We are not liable
Diode Pointer Quick Start Guide
 Important Note: Read all Danger, Warning, Caution terms, symbols, and instructions located on our website. The diode pointer provides a safety measure by enabling operators to monitor the location of the
RENISHAW INVIA RAMAN SPECTROMETER
 STANDARD OPERATING PROCEDURE: RENISHAW INVIA RAMAN SPECTROMETER Purpose of this Instrument: The Renishaw invia Raman Spectrometer is an instrument used to analyze the Raman scattered light from samples
Diode Pointer Quick Start Guide
 Important Note: Read all Danger, Warning, Caution terms, symbols, and instructions located in the (Safety & Hazard information) on our website. Reference the Diode Pointer Specifications located on our
Advanced Test Equipment Rentals ATEC (2832)
") Established 1981 Advanced Test Equipment Rentals www.atecorp.com 800-404-ATEC (2832) 6500 Series Loop Antennas User Manual ETS-Lindgren Inc. reserves the right to make changes to any product described
Established 1981 Advanced Test Equipment Rentals www.atecorp.com 800-404-ATEC (2832) 6500 Series Loop Antennas User Manual ETS-Lindgren Inc. reserves the right to make changes to any product described
Agilent G1888 Network Headspace Sampler
 Agilent G1888 Network Headspace Sampler Safety and Regulatory Information Agilent Technologies Notices Agilent Technologies, Inc. 2004 No part of this manual may be reproduced in any form or by any means
2015 RIGOL TECHNOLOGIES, INC.
 Service Guide DG000 Series Dual-channel Function/Arbitrary Waveform Generator Oct. 205 TECHNOLOGIES, INC. Guaranty and Declaration Copyright 203 TECHNOLOGIES, INC. All Rights Reserved. Trademark Information
TriVista. Universal Raman Solution
 TriVista Universal Raman Solution Why choose the Princeton Instruments/Acton TriVista? Overview Raman Spectroscopy systems can be derived from several dispersive components depending on the level of performance
Visible & UV/Vis Spectrophotometers
 Visible & UV/Vis Spectrophotometers Accurate Precise Affordable S20 Series UV/Vis Spectrophotometers The Unico S20 Series Spectrophotometers are simple, flexible, easytouse and maximize value while providing
OP710. Multichannel Optical Power Meter Instruction Manual. (Also supports the OP710-ANX)
") Multichannel Optical Power Meter Instruction Manual (Also supports the OP710-ANX) www.optotest.com 1.805.987.1700 Contacting OptoTest Corporation 1.805.987.1700 (7:30 a.m. to 5 p.m. PST) www.optotest.com
Multichannel Optical Power Meter Instruction Manual (Also supports the OP710-ANX) www.optotest.com 1.805.987.1700 Contacting OptoTest Corporation 1.805.987.1700 (7:30 a.m. to 5 p.m. PST) www.optotest.com
34134A AC/DC DMM Current Probe. User s Guide. Publication number April 2009
 User s Guide Publication number 34134-90001 April 2009 For Safety information, Warranties, Regulatory information, and publishing information, see the pages at the back of this book. Copyright Agilent
FluorCam PAR- Absorptivity Module & NDVI Measurement
 FluorCam PAR- Absorptivity Module & NDVI Measurement Instruction Manual Please read this manual before operating this product P PSI, spol. s r. o., Drásov 470, 664 24 Drásov, Czech Republic FAX: +420 511
USER'S GUIDE. EcoQuest International 310 T. Elmer Cox Drive Greeneville, TN (423) Setup. Operation. Specifications.
 Setup. Operation. Specifications.") USER'S GUIDE Setup Operation Specifications Warranty (43) 638-746 CAUTION: Read manual carefully for proper procedures and operation. CONTENTS SPECIFICATIONS Specifications...............................................................3
USER'S GUIDE Setup Operation Specifications Warranty (43) 638-746 CAUTION: Read manual carefully for proper procedures and operation. CONTENTS SPECIFICATIONS Specifications...............................................................3
CHEM Course Outline (Part 14) Absorption Spectroscopy update 2011 For an html version of 2005 notes, click here
 Absorption Spectroscopy update 2011 For an html version of 2005 notes, click here") CHEM 524 -- Course Outline (Part 14) Absorption Spectroscopy update 2011 For an html version of 2005 notes, click here IX. Absorption Spectroscopy UV-VIS-near IR (Read Chap. 13) the most widely used analytical
CHEM 524 -- Course Outline (Part 14) Absorption Spectroscopy update 2011 For an html version of 2005 notes, click here IX. Absorption Spectroscopy UV-VIS-near IR (Read Chap. 13) the most widely used analytical
SpectraPro 2150 Monochromators and Spectrographs
 SpectraPro 215 Monochromators and Spectrographs SpectraPro 215 15 mm imaging spectrographs and monochromators from are the industry standard for researchers who demand the highest quality data. Acton monochromators
GT-1050A 2 GHz to 50 GHz Microwave Power Amplifier
 Established 1981 Advanced Test Equipment Rentals www.atecorp.com 800-404-ATEC (2832) Giga-tronics GT-1050A Microwave Power Amplifier GT-1050A 2 GHz to 50 GHz Microwave Power Amplifier Operation Manual
iq-led Software V2.1
 iq-led Software V2.1 User Manual 31. January 2018 Image Engineering GmbH & Co. KG Im Gleisdreieck 5 50169 Kerpen-Horrem Germany T +49 2273 99991-0 F +49 2273 99991-10 www.image-engineering.com CONTENT
Installation Instructions
 SYSTXBBSAM01 EVOLUTION SYSTEM ACCESS MODULE Installation Instructions NOTE: Read the entire instruction manual before starting the installation. pointsett U.S. Pat No. 7,415,102 Fig. 1 - Evolution System
Operating Instructions for ISSI Series LM2X, LM2X-DM, LM2X-DMHP
 Operating Instructions for ISSI Series LM2X, LM2X-DM, LM2X-DMHP and LM2X-DMHP-RGB LED Modules August 31, 2006 Rev. 1 Caution This LED illuminator is manufactured with very high power LEDs. Please be aware
SlimScan BT Users Manual
 SlimScan BT Users Manual ASP Microcomputers 456 North Road, Ormond, Victoria, 3204 Australia Telephone: (03) 9578-7600 FAX: (03) 9578-7727 email: solutions@asp.com.au World Wide Web: http://www.asp.com.au
Installation & Operation Manual SAGA1-K Series Industrial Radio Remote Control
 Installation & Operation Manual SAGA1-K Series Industrial Radio Remote Control Gain Electronic Co. Ltd. Table Of Contents Safety Considerations ------------------------------------------------------------2
Laser Safety & the Human Eye Recall the human eye is a simple single lens system Crystalline lens provide focus Cornea: outer surface protection
 Laser Safety & the Human Eye Recall the human eye is a simple single lens system Crystalline lens provide focus Cornea: outer surface protection Iris: control light Retina: where image is focused Note
UV / VIS Spectrophotometer
 UV / VIS Spectrophotometer Single Beam Double Beam NANO EMCLAB Instruments GmbH EMCLAB Instruments GmbH Kulturstrasse 55 47055 Duisburg Germany Fon: +49 203 3064042 Fax: +49 203 41504809 E-mail: info@emc-lab.de
Z-5652 plus Series. 2D Image Hands-Free Scanner
 Z-5652 plus Series 1 2D Image Hands-Free Scanner Revision History Changes to the original manual are listed below: Version Date Description of Version 1.0 10/02/2017 Initial release 2D Image Scan Module
Experiment 2B Integrated Laboratory Experiment DETERMINATION OF RIBOFLAVIN: A COMPARISON OF TECHNIQUES PART B. MOLECULAR FLUORESCENCE SPECTROSCOPY
 CH 461 & CH 461H F 14 Name OREGON STATE UNIVERSITY DEPARTMENT OF CHEMISTRY Experiment 2B Integrated Laboratory Experiment DETERMINATION OF RIBOFLAVIN: A COMPARISON OF TECHNIQUES PART B. MOLECULAR FLUORESCENCE
EA3012 TRANSCONDUCTANCE AMPLIFIER OPERATION MANUAL
 EA3012 TRANSCONDUCTANCE AMPLIFIER Ü EA3012 Transconductance Amplifier Operation Manual Version 2.00 Dec 2011 All product names are trademarks of their respective companies Guarantee and service Transmille
QL50 Luminescence Sensor
 Compact, self-contained luminescence sensor LISTED US Compact, self-contained design Features Senses luminescent marks, even on luminescent backgrounds and on reflective surfaces, such as ceramic, metal,
SP-8001 UV/Visible Spectrophotometer
 SP-8001 UV/Visible Spectrophotometer Provide Accurate Results High performance UV/Visible Spectrophotometer for Research, and Laboratory work Product Features The Metertech SP-8001 UV/Visible Spectrophotometer
Table of Contents 9.0 WARRANTY. 1.0 Introduction Package Contents. 2.0 Safety Instructions Overview...003
 9.0 WARRANTY Table of Contents ELECTROMATIC Equipment Co., Inc. (ELECTROMATIC) warrants to the original purchaser that this product is of merchantable quality and confirms in kind and quality with the
Miniature Spectrometer Technical specifications
 Miniature Spectrometer Technical specifications Ref: MSP-ISI-TEC 001-02 Date: 2017-05-05 Contact Details Correspondence Address: Email: Phone: IS-Instruments Ltd. Pipers Business Centre 220 Vale Road Tonbridge
Random & Sinusoidal Jitter Injector. Main Unit Operation Manual
 Random & Sinusoidal Jitter Injector RJI12G Main Unit Operation Manual Rev 1.0 September 2012 Introduction... 2 Safety Instruction... 2 1. General... 4 1 1 Features... 4 1 2 Functions & Characteristics...
Basic Components of Spectroscopic. Instrumentation
 Basic Components of Spectroscopic Ahmad Aqel Ifseisi Assistant Professor of Analytical Chemistry College of Science, Department of Chemistry King Saud University P.O. Box 2455 Riyadh 11451 Saudi Arabia
Oriel Flood Exposure Sources
 218 Oriel Flood Exposure Sources High intensity outputs CALIBRATION SOURCES Highly uniform, large collimated beams Efficient out of band rejection Timed exposures DEUTERIUM SOURCES ARC SOURCES INCANDESCENT
CBA 400M MHZ to 400 MHZ
 1 CBA 400M-100 1 MHZ to 400 MHZ 100 watt amplifier user Manual 601-298A CBA 400M-100 1 MHZ to 400 MHZ 100 watt amplifier USER Manual CBA 400M-100 User Manual contents 1 Safety information 5 2 Introduction
Acu-Park TM. user s guide Directed Electronics, Inc. Vista, CA N9100T 09-04
 Acu-Park TM user s guide 2004 Directed Electronics, Inc. Vista, CA N9100T 09-04 limited one year warranty Directed Electronics, Inc. (hereinafter "Directed") promises to the original purchaser that this
Seized Drugs Operational Guidelines for the Thermo FTIR Comparative and Analytical Division
 Operational Guidelines for the Thermo FTIR Comparative and Analytical Division THERMO FOURIER TRANSFORM INFRARED (FTIR) SPECTROMETER Instrument Nicolet 4700 Series FTIR spectrometer (Serial Number AFZ0400253)