Medical Imaging Working Group
|
|
|
- Wilfred Crawford
- 5 years ago
- Views:
Transcription

1 Medical Imaging Working Group BenQ HQ No. 16 Ji-Hu Road, Nei-Hu District Taipei, Taiwan 4 May 2016 Craig Revie, MIWG chair, opened the meeting at 14:00 and after self-introductions and a sound check for remote participants, introduced the agenda [see attached] as follows: 1. Medical photography best practices white paper 2. iccmax applied to medical displays 3. FDA guidance for whole-slide imaging 4. Review of MIWG comments on FDA draft guidance on displays 5. Action item review 1. Medical photography best practices white paper Phil Green reviewed changes to the document on behalf of John Penczek who was unable to attend the meeting. In discussion since the Munich meeting, it had been proposed that the goal of the paper should be to describe how to obtain output-referred colorimetry, rather than accuracy relative to the scene originals. The meeting supported this approach, and with putting complex material in an annex as proposed by Dr Penczek. It was agreed that the goal should be to have a complete document, reviewed by the group in advance of the next meeting in San Diego. Yves Vander Haeghen agreed to complete outstanding sections assigned to him, and also to provide a poster on camera calibration and a document on a camera calibration research project, for posting on the ICC web site. It was also agreed to post before and after images, provided by Dr Vander Haeghen, on the ICC web site as motivation for the guidelines. 2. iccmax applied to medical displays Dr Max Derhak introduced the topic of using iccmax for medical displays [see attached]. One goal was to define a profile which provided for calibration to GSDF. This could be done as a DeviceLink profile, in both grayscale and RGB. Dr Derhak showed examples in XML. The advantage of the iccmax approach was better accuracy, together with the possibility of passing in ambient luminance as an environment variable. The meeting discussed the need for an ICS in this area. A high-level ICS could describe approaches for two classes of display, both primary and secondary. Bai, Derhak, Nagashima-san, Kimpe agreed to discuss an ICS for GSDF and report back to a future MIWG meeting.
2 3. FDA guidance for whole-slide imaging Mr Revie reported on the FDA guidance document on whole-slide imaging [see attached], which had been published by FDA with MIWG comments. He felt it had been a useful activity, and asked the meeting whether there might be value in providing a suggested assessment procedure for each of the (colour related) items in the document. Dr Olsen noted that the document did a good job of listing what to test, but more work was needed on reproducibility. Dr Vander Haeghen proposed that an output-referred encoding of a microscope image be used as reference, as it was easier to make comparisons on display. This method would give the appearance under a standard illuminant, and would also be useful for data exchange. Currently the FDA document has a pointer to the ICC web site A useful task would be to define the list of items for guidance, which could be posted on the ICC web site. Olsen, Vander Haeghen, Revie, Chang, Badano and Green agreed to do this. Mr Revie noted that further comments can still be made to the FDA, and proposed that the document be posted on the ICC web site with the colour-related sections highlighted. 4. Review of MIWG comments on FDA draft guidance on displays Craig Revie summarised the MIWG comments on the draft FDA displays guidance document. Comments had been submitted to FDA on April 18. A longer draft also showed the discussion in MIWG. It was agreed to post both versions in the Displays area of the MIWG web site. It was also reported that an item had been added to the ICC FAQ on evaluating display profiles. This will be expanded as an activity in the Profile Assessment Working Group. 5. Action item review Mr Revie presented the list of action items from previous meetings [see attached]. MIWG Make assessment targets available to the group (Kimpe). Phil Green and Craig Revie agreed to check the context for this action. MIWG Provide input on calibration errors using different types of training sets (Holm/Walowit). It was agreed to close this item. Phil Green undertook to provide available data. MIWG Send Petri plate imaging guidelines for review by MIWG. This had been done and comments were invited. MIWG Provide further input on medical photography guidelines and workflow figure to Dr Penczek (Hung). This remained open Dr Hung agreed to discuss with Dr Penczek. The meeting closed at 16:30. Action items MIWG MIWG (Vander Haeghen) MIWG Kimpe) Provide poster on camera calibration (Vander Haeghen) Provide document on camera calibration research project for MIWG web site Discuss ICS for GSDF and report back to MIWG (Bai, Derhak, Nagashima-san,
3 MIWG Compile list of items for information and guidance for FDA WSI guidance document and post on MIWG web site (Olsen, Vander Haeghen, Revie, Chang, Badano and Green) MIWG web site (Green) Post FDA WSI guidelines document with colour sections highlighted on MIWG MIWG Post working and submitted versions of the MIWG-commented FDA Displays guidance document in the Displays area of the MIWG web site (Green). MIWG Post before and after images provided by Dr Vander Haeghen, showing the effect of calibration, on the Photography area of the MIWG web site (Green).


4


5

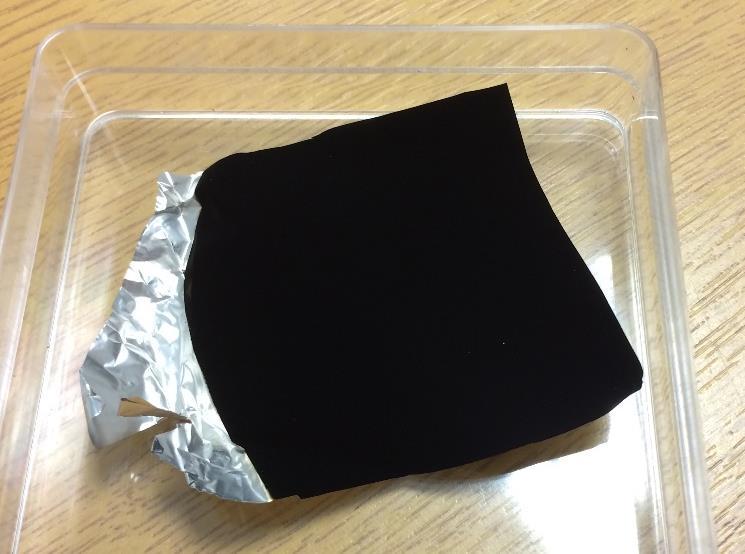


6 Reflectance measurements Vertically Aligned NanoTube Arrays BBC video details available from
7
8
9
10
11
12
13 Implementing GSDF profiles using iccmax Max Derhak
14 Grayscale Standard Display Function Medical imaging profiles display images that are based upon steps of Just Noticeable Differences (JND s) Defined by Grayscale Standard Display Function GSDF mapping Luminance to JND Effective number of JNDs of a display is determined by both the max and min luminance of display in combination with ambient luminance Relationship defined by GSDF Monitor profile needs to convert from JND steps to device drive values No intermediate PCS value needed 7/21/2016 2
15 iccmax based GSDF profiles Measure luminance of display in dark environment from lowest to highest drive values Determine inverse function (out=f i (L)) from illuminance to drive values Save as 1-D sampled curve transform in profile that is indexed by absolute luminance Use GSDF (defined as 1-D sampled curve) to determine JND min and JND max values for monitor Based upon brightest and darkest measurements plus ambient luminance Ambient luminance is provided as CMM environment variable in iccmax to calc env operator 7/21/2016 3
16 Grayscale Profile Link Application Convert input value to scaled JND of montior JND = in*(jndmax-jndmin)+jndmin Convert JND to luminance using inverse GSDF (in 1-D curve table) L = GSDF -1 (JND) Subtract ambient luminance L = L L ambient Determine output display drive value out=f i (L) Check that maximum input results in maximum output (to avoid floating point roundoff errors) 7/21/2016 4
17 RGB based GDSF profiles Measure RGB channels from dark to bright Determine adjustments to get balanced grayscale (store as 1-d sampled curves) outr=balr(inr), outg=balg(ing), outb=balb(inb) Apply same procedure as for Grayscale displays to JND min and JND max values for monitor Based upon brightest and darkest measurements plus ambient luminance Ambient luminance is provided as CMM environment variable in iccmax to calc env operator 7/21/2016 5
18 RGB Profile Link Application For each RGB channel apply Grayscale JND correction Apply RGB balancing curves 7/21/2016 6
19 GSDF with iccmax vs ICC.1 iccmax utilizes calc element Interpolation based on log(l) rather than L improves accuracy of GSDF curve interpolation Can possibly implement as direct math function CMM environment value allows ambient luminance to be passed in to determine effective JND levels Sub-element calc functions can be utilized in RGB case ICC.1 Limited transform options reduce accuracy of GSDF curve estimation Need separate profile for every ambient luminance level with separate selection of profile to use 7/21/2016 7

20 Technical Performance Assessment of Digital Pathology Whole Slide Imaging Devices Guidance for Industry and Food and Drug Administration Staff Document issued on: April 20, 2016 The draft of this document was issued on February 25, 2015 For questions about this document, contact the Division of Molecular Genetics and Pathology at and Nicholas Anderson at or or Aldo Badano at or U.S. Department of Health and Human Services Food and Drug Administration Center for Devices and Radiological Health Office of In Vitro Diagnostics and Radiological Health Division of Molecular Genetics and Pathology Molecular Pathology and Cytology Branch
21 Public Comment Contains Nonbinding Recommendations Preface You may submit electronic comments and suggestions at any time for Agency consideration to Submit written comments to the Division of Dockets Management, Food and Drug Administration, 5630 Fishers Lane, Room 1061, (HFA-305), Rockville, MD Identify all comments with the docket number [FDA D-0230]. Comments may not be acted upon by the Agency until the document is next revised or updated. Additional Copies Additional copies are available from the Internet. You may also send an request to to receive a copy of the guidance. Please use the document number to identify the guidance you are requesting.
22 Table of Contents I. Introduction... 1 II. Background... 2 III. Scope... 2 IV. Policy... 3 IV(A). Description and Test Methods for Each Component... 3 IV(A)(1). Slide Feeder... 5 IV(A)(1)(a). Description... 5 IV(A)(2). Light Source... 5 IV(A)(2)(a). Description... 5 IV(A)(2)(b). Test Method... 6 IV(A)(3). Imaging Optics... 6 IV(A)(3)(a). Description... 6 IV(A)(3)(b). Test Methods... 7 IV(A)(4). Mechanical Scanner Movement... 7 IV(A)(4)(a). Description... 7 IV(A)(4)(b). Test Method... 8 IV(A)(5). Digital Imaging Sensor... 8 IV(A)(5)(a). Description... 8 IV(A)(5)(b). Test Methods... 8 IV(A)(6). Image Processing Software... 9 IV(A)(6)(a). Description... 9 IV(A)(6)(b). Resources... 9 IV(A)(7). Image Composition... 9 IV(A)(7)(a). Description... 9 IV(A)(7)(b). Test Methods IV(A)(8). Image Files Formats IV(A)(8)(a). Description IV(A)(9). Image Review Manipulation Software IV(A)(9)(a). Description IV(A)(9)(b). Resources... 11
23 IV(A)(10). Computer Environment IV(A)(10)(a). Description IV(A)(11). Display IV(A)(11)(a). Description IV(A)(11)(b). Test Methods IV(A)(11)(c). Resources IV(B). System-level Assessment IV(B)(1). Color Reproducibility IV(B)(1)(a). Description IV(B)(1)(b). Test Methods IV(B)(1)(c). Resources IV(B)(2). Spatial Resolution IV(B)(2)(a). Description IV(B)(2)(b). Test Methods IV(B)(3). Focusing Test IV(B)(4). Whole Slide Tissue Coverage IV(B)(4)(a). Description IV(B)(4)(b). Test Method IV(B)(5). Stitching Error IV(B)(5)(a). Description IV(B)(5)(b). Test Methods IV(B)(6). Turnaround Time IV(B)(6)(a). Description IV(C). User Interface IV(C)(1). Description IV(C)(2). Test Methods IV(C)(3). Resources IV(D). Labeling IV(D)(1). Test Methods IV(D)(2). Resources IV(E). Quality Control... 23
24 Technical Performance Assessment of Digital Pathology Whole Slide Imaging Devices Guidance for Industry and Food and Drug Administration Staff This guidance represents the current thinking of the Food and Drug Administration (FDA or Agency) on this topic. It does not establish any rights for any person and is not binding on FDA or the public. You can use an alternative approach if it satisfies the requirements of the applicable statutes and regulations. To discuss an alternative approach, contact the FDA staff or Office responsible for this guidance as listed on the title page. I. Introduction FDA is issuing this guidance to provide industry and agency staff with recommendations regarding the technical performance assessment data that should be provided for regulatory evaluation of a digital whole slide imaging (WSI) system. This document does not cover the clinical submission data that may be necessary to support approval or clearance. This document provides our suggestions on how to best characterize the technical aspects that are relevant to WSI performance for their intended use and determine any possible limitations that might affect their safety and effectiveness. Recent technological advances in digital microscopy, in particular the development of whole slide scanning systems, have accelerated the adoption of digital imaging in pathology, similar to the digital transformation that radiology departments have experienced over the last decade. FDA regulates WSI system manufacturers to help ensure that the images intended for clinical uses are reasonably safe and effective for such purposes. Essential to the regulation of these systems is the understanding of the technical performance of the WSI system and the components in the imaging chain, from image acquisition to image display and their effect on pathologist s diagnostic performance and workflow. Prior to performing non-technical analytical studies (i.e., those using clinical samples) and clinical studies to evaluate a digital imaging system s performance, the manufacturer should first determine the technical characteristics that are relevant to such performance for its intended use and determine any possible limitations 1
25 that might affect its safety and effectiveness. This guidance provides recommendations for the assessment of technical characteristics of a WSI device. FDA's guidance documents, including this guidance, do not establish legally enforceable responsibilities. Instead, guidances describe the Agency's current thinking on a topic and should be viewed only as recommendations, unless specific regulatory or statutory requirements are cited. The use of the word should in Agency guidance means that something is suggested or recommended, but not required. II. Background For over a hundred years, the reference method for the diagnosis of cancer and many other critical clinical conditions has been histopathological examination of tissues using conventional light microscopy. This process is known as surgical pathology in the United States. In surgical pathology, patient tissue from surgery, biopsy or autopsy goes through a process that includes dissection, fixation, embedding, and cutting of tissue into very thin slices which are then stained, for example by the hematoxylin and eosin (H&E) protocol, and permanently mounted onto glass slides. The slides are examined by a pathologist under a light microscope by dynamically adjusting the focus and using different magnifications. By integrating their interpretations obtained by microscopic examination of the tissue from all slides pertaining to a case, pathologists arrive at a diagnosis of the case. WSI refers to the digitization of the stained entire tissue specimen on a glass slide. The glass slide is still prepared and stained just as for conventional light microscopy. Depending on the system used, various magnifications, scanning methodologies, hardware, and software are employed to convert the optical image of the slide into a digital whole slide image. With WSI, the pathologist views the image on a computer monitor rather than through the microscope oculars. III. Scope This document provides guidance regarding only the technical performance assessment of WSI systems for regulatory evaluation. WSI systems are defined here as those consisting of (a) an image acquisition subsystem that converts the content of a glass slide into a digital image file, and (b) a workstation environment for viewing the digital images. If not otherwise specified, the term image in the context of whole slide imaging refers to a pyramid structure consisting of multiple images at different resolutions. The baseline image has the highest resolution. This guidance is applicable for surgical pathology tasks performed in the anatomic pathology laboratory. It is intended to provide recommendations to industry and FDA staff regarding only the technical performance assessment data needed for the regulatory evaluation of a WSI device. This document is not meant to provide guidance for special stain techniques or 2
26 fluorescence imaging or for the non-technical analytical studies (utilizing clinical samples) or pivotal clinical studies necessary to support safety and effectiveness, nor does this guidance alone suffice to demonstrate safety and effectiveness of WSI systems. Interpretation of WSI images on mobile platforms is beyond the scope of this guidance. IV. Policy The following subsections of this section describe the technical performance assessment data FDA believes will facilitate the regulatory evaluation of a WSI device. IV(A). Description and Test Methods for Each Component This subsection details the descriptions and the test methods at the component level that should be included in the technical performance assessment of a WSI device. For purposes of this guidance only, a component is a piece of hardware, software, or a combination of hardware and software that processes the image signals flowing through the imaging chain. The concept of a component is based on the transformation of the image signals. For example, the digital imaging sensor is a hardware device that converts optical signals into digital signals. The image composition component is a software program that stitches sub-images together to form a whole slide image. A component and a physical device need not be in close physical proximity. For example, the light source component and the image optics component are usually tightly coupled within the same device, while the display calibration data is often distributed in both the color profile in the computer environment component and the on-screen display settings in the display component. The components in a WSI device can be grouped in two subsystems: image acquisition and image display. The image acquisition subsystem digitizes the tissue slide as a digital image file. The image display subsystem converts the digital image file into optical signals for the human reader. In the paradigm of telemedicine, the digital image file can be electronically sent to a remote site for reading, so the image acquisition subsystem and the image display subsystem do not need to be physically coupled. Methods for independently testing the image acquisition and display subsystems are described in Section IV(B). Sponsors should provide a block diagram of the components found in the WSI system in the premarket submission. A chart indicating the relationship among the components and the test methods utilized for the specific system characterization should also be provided. Diagram 1 on the following page is offered as an example block diagram of typical components found in current WSI systems. The components of a particular WSI system might not include all of those listed in the diagram or may include additional components. Sponsors are encouraged to provide additional diagrams, illustrations, and photographs of their devices as part of their submissions. 3


27 Diagram 1: Example block diagram of typical components found in current WSI systems 4
28 IV(A)(1). Slide Feeder IV(A)(1)(a). Description The slide feeder is the mechanism(s) used to introduce the slide(s) to the scanner. For the slide feeder, sponsors should provide the following information, if applicable: Configuration of the slide feed mechanism (a physical description of the equipment) o Slide configuration (physical description of the slide (i.e., custom or commercial off-the-shelf)) o Number of slides in queue (carrier) o Class of automation (e.g., robotics, pneumatics, etc.) User interaction o Hardware (e.g., loading of slides into carrier) o Software (e.g., does the system recognize the number of slides or is this specified by the user) o Feedback (e.g., alarms, notifications, etc.) o Failure Mode and Effects Analysis (FMEA) (including severity, likelihood, mitigations, etc.) IV(A)(2). Light Source IV(A)(2)(a). Description The light source, including the light guide, generates and delivers light to the slide being imaged. The two major components are the lamp and condenser. For the light source, sponsors should provide the following information and specifications, if applicable: Lamp o Bulb type (e.g., halogen, xenon arc, LED) o Manufacturer and model o Wattage o Spectral power distribution o Expected lifetime o Output adjustment control (electrical/electronic/mechanical) o Optical filter(s) Type (e.g., heat blocking, polarization, neutral density, diffusing) o Manufacturer and model o Expected intensity variation (coefficient of variation ) Over the duration of scanning a single slide Over the course of a single workday Over the lifetime of the device o Expected spectral variation Over the duration of scanning a single slide Over the course of a single workday Over the lifetime of the device o Capability of tracking intensity and spectral degradation with lifetime 5
29 Condenser o Illumination format (e.g., Kohler, critical) o Manufacturer and model o Numerical aperture o Focal length o Working distance IV(A)(2)(b). Test Method The following steps should be used to measure the spectral distribution of light incident on the slide. Position the input of a calibrated spectrometer or monochromator at the plane where the slide would be placed, centered on the illumination spot from the condenser. If desired, the light can be coupled into the spectrometer via light guide (e.g., fiber optic cable) or an integrating sphere. The measurement aperture should be at least as large as the anticipated field of view on the slide at the lowest magnification of the imaging optics. The wavelength accuracy and relative spectral efficiency of the spectrometer or monochromator in the wavelength range of nm should be calibrated prior to measurements and reported. Plots of the measured spectrum with at least 10 nm spectral resolution should be provided, using radiometric units (e.g., spectral irradiance in W/cm 2 /nm, spectral radiance in W/sr/cm 2 /nm). IV(A)(3). Imaging Optics IV(A)(3)(a). Description The imaging optics comprises the microscope objective and auxiliary lens(es) (e.g., tube lens), which optically transmit an image of the tissue from the slide to the digital image sensor. Sponsors should provide the following information and specifications, if applicable: Optical schematic with all optical elements identified from slide (object plane) to digital image sensor (image plane) Microscope objective o Manufacturer o Type o Magnification o Numerical aperture (NA) o Focal length o Working distance Auxiliary lens(es) o Manufacturer o Lens type o Focal length Magnification of imaging optics: ISO 8039:2014 Optics and optical instruments Microscopes Magnification 6
30 IV(A)(3)(b). Test Methods Sponsors should conduct the following tests in conformance with the International Standards, if applicable: Relative irradiance of imaging optics at image plane per ISO 13653:1996 Optics and optical instruments General optical test methods - Measurement of relative irradiance in the image field Distortion per ISO 9039:2008 Optics and photonics Quality evaluation of optical systems Determination of distortion Chromatic aberrations per ISO 15795:2002 Optics and optical instruments Quality evaluation of optical systems Assessing the image quality degradation due to chromatic aberrations IV(A)(4). Mechanical Scanner Movement IV(A)(4)(a). Description The mechanical scanner addresses the physical characteristics of the stage upon which the glass slide is affixed. The key components include stage configuration, movement, and control. This information is relevant whether it is only the stage that is moving and the optics are stationary, or if there is movement on all axes. For the mechanical scanner, sponsors should provide the following information and specifications, if applicable: Configuration of the stage (a physical description of the stage) o Stage size o Stage manufacturer and model number o Stage material (e.g., anodized aluminum) o Single multi-axis or multiple stacked linear stages (manufacturer and model number) o Type of guides or ways (e.g., bearings) o Sample retention mechanism (slide holder) Method of movement of the stage (e.g., stepper motor, servomotor, piezomotor, etc., coupled with belt, ball-screw, lead-screw, etc.) o Movement resolution for XY-axes o Movement in Z-axis o Speed range o Travel distance o Maximum scanning area o Localization and reading of bar code labels Control of movement of the stage o Open or closed loop operation o Positional accuracy (calibration) and repeatability Lost motion compensation (e.g., backlash) o Physical control (e.g., joystick) for single-slide, non-batch mode o Selection of area to be scanned (in accordance to image composition software) whole slide 7
31 automatically determined area with tissue content Failure Mode and Effects Analysis (FMEA) (including severity, likelihood, mitigations, etc.) IV(A)(4)(b). Test Method Sponsors should demonstrate the mechanical performance of the stage with respect to positional repeatability and accuracy on all relevant axes, in accordance with ISO 230-2:2014 Test code for machine tools Part 2: Determination of accuracy and repeatability of positioning numerically controlled axes. IV(A)(5). Digital Imaging Sensor IV(A)(5)(a). Description The digital image sensor is an array of photosensitive elements (pixels) that convert the optical signals of the slide to digital signals, which consist of a set of values corresponding to the brightness and color at each point in the optical image. Please provide the following information and specifications: Sensor type (e.g., CMOS, CCD) and manufacturer Pixel information/specifications o Number and dimensions of pixels o Design of color filter array Configuration of color filter array Spectral transmittance of color filter mask Responsivity specifications o Relative response versus wavelength o Linearity o Spatial uniformity Noise specifications o Dark current level (electrons per second) o Read noise (electrons) Readout rate (e.g., pixels per second, frames per second) Digital output format (e.g., bits per pixel, bits per color channel) IV(A)(5)(b). Test Methods Sponsors should conduct the following tests in conformance with the corresponding International Standards, if applicable: Opto-electronic conversion function per ISO 14524:2009 Photography Electronic still-picture cameras Methods for measuring optoelectronic conversion functions (OECFs) Noise measurements per ISO 15739:2013 Photography Electronic still-picture imaging Noise measurements 8
32 IV(A)(6). Image Processing Software IV(A)(6)(a). Description Image processing software refers to the embedded software components of the image acquisition device. It typically includes control algorithms for image capture and processing algorithms for raw data conversion into the digital image file. Sponsors should provide the following information and specifications, if applicable: Exposure control White balance Color correction Sub-sampling Pixel-offset correction Pixel-gain or flat-field correction Pixel-defect correction IV(A)(6)(b). Resources See the guidance entitled Guidance for the Content of Premarket Submissions for Software Contained in Medical Devices ( s/ucm htm) for the information that should be provided. IV(A)(7). Image Composition IV(A)(7)(a). Description Image composition is a step present in systems that produce whole slide images as opposed to individual fields of view. Whole slide scanning is typically performed in accordance with the positioning of a stage that moves in submicron steps. At each location of the stage movement, an image of the field of view is acquired. Images can be acquired with a degree of overlapping (redundancy) between them to avoid gaps in data collection. Images can also be acquired at different depths of focus followed by the application of focusing algorithms. At the end of this process, all acquired images are combined (stitched) together to create a composite high resolution image. There are a number of features that can affect this process, and they are listed below. Sponsors should provide a description of these features, if applicable: Scanning method o Single objective or multiple miniature objectives in an array pattern o Scanning pattern: square matrix acquisition (tiling), line scanning, etc. o Overlap between scanned regions o Merging algorithms that stitch the aligned images together into a composite image file. Such algorithms may employ functions to align adjacent fields of view in accordance to the scanning pattern, overlap, etc. 9
33 o Automatic background correction functions to eliminate the effect of nonuniformities in the microscope s illumination and image merging procedure. These non-uniformities if not corrected might create visible borders (seams and stitch lines) between the adjacent fields of view. Scanning speed: time to scan the whole slide. This time is dependent on selected magnification, and the amount of tissue on the glass slide. Number of planes at the Z-axis to be digitized (stack depth) IV(A)(7)(b). Test Methods Testing for image composition can be performed on a system level using special calibration slides (such as grid patterns) that can test for line uniformity and focus quality. Sponsors should provide the following outputs for these tests, if applicable: Images of digitized calibration slides Analysis of focus quality metrics Analysis of coverage of the image acquisition for the entire tissue slide IV(A)(8). Image Files Formats IV(A)(8)(a). Description The final result from image acquisition can be a whole slide image consisting of a stack of all acquired fields of view and magnifications during WSI. The complete digitized image file usually occupies between 1-20 gigabytes of storage space depending on the sample and the magnification of the objective lens used. Images can then be stored in a number of ways and formats. Sponsors should provide the following information: Compression method (e.g., the wavelet-based JPEG2000 compression standard or TIFF) Compression ratio: ratio of uncompressed to compressed file size. This metric should be provided along with descriptive information on the data it was measured from, since compression ratio is dependent on the content of the data applied to. Compression type: lossless or lossy compression File format: can be formats easily accessible with public domain software such as JPEG or TIFF, or can be proprietary formats only accessible with specific vendor viewers. The file format depends on the file organization and related use. For systems that interact with DICOM-compliant software and hardware, sponsors should provide a DICOM compatibility report. File organization: o Single file with multi-resolution information (pyramidal organization) o Stack of files at different magnifications 10
34 IV(A)(9). Image Review Manipulation Software IV(A)(9)(a). Description For the image review manipulation software, sponsors should provide the following information, describing software features, if applicable. Continuous panning (moving in x-y space) and pre-fetching (buffering adjacent images to speed up panning time) Continuous zooming (magnification) Discrete Z-axis displacement Ability to compare multiple slides simultaneously on multiple windows Ability to perform annotations Image enhancement such as sharpening functions Color manipulation, including color profile, white balance, color histogram manipulation, and color filters Annotation tools Tracking of visited areas and annotations Digital bookmarks (revisit selected regions of interest) Virtual multihead microscope (this is when multiple pathologists simultaneously review the same areas remotely) IV(A)(9)(b). Resources See the guidance entitled Guidance for the Content of Premarket Submissions for Software Contained in Medical Devices ( s/ucm htm) for additional information on this subject. IV(A)(10). Computer Environment IV(A)(10)(a). Description Computer environment refers to the workstation, including both hardware and software components, that retrieves the digital image file and drives the display for the user to review the images. Sponsors should provide the following information and specifications, if applicable: Computer hardware Operating system Graphics card Graphics card driver Color management settings Color profile Display interface (e.g., DVI or DisplayPort) 11
35 IV(A)(11). Display IV(A)(11)(a). Description The final stage of a WSI system is the display component that presents the scanned image to the pathologists for reading. Technically, display refers to the optoelectronic device that converts the digital image signals in the RGB space into optical image signals. For the display, sponsors should provide the following information and specifications, if applicable: Technological characteristics of the display device (e.g., in-plane switching LCD panel with TFT active-matrix array with fluorescent backlight) Physical size of the viewable area and aspect ratio For transmissive displays, backlight type and properties including temporal, spatial, and spectral characteristics Frame rate and refresh rate Pixel array, pitch, pixel aperture ratio and subpixel matrix scheme (e.g., chevron, RGBW) Subpixel driving to improve grayscale resolution (e.g., spatial and temporal dithering) Supported color spaces Display Interface User controls of brightness, contrast, gamma, color space, power-saving options, etc. via the on-screen display (OSD) menu Ambient light adaptation including the ambient light sensing method, instrumentation, and software tool description Touch screen technology including method, functionality, and any calibration or periodical re-tuning requirements Color calibration tools (sensor hardware and associated software), color profile, and method for color management Frequency and nature of quality-control tests to be performed by the user and/or the physicist with associated action limits. IV(A)(11)(b). Test Methods User controls: Modes and settings of the display undergoing testing should be specified, including brightness, contrast, gamma, white point, color space, etc. See 2.1 Modified-Performance Modes, IDMS Spatial resolution: Measurements of the transfer of information from the image data to the luminance fields at different spatial frequencies of interest typically done by reporting the modulation transfer function. Non-isotropic resolution properties should be characterized properly by providing two-dimensional measurements or measurements along at least two representative axes. See 7.7 Effective Resolution, IDMS
36 Pixel defects (count and map): Measurements (counts) and location of pixel defects. This is typically provided as a tolerance limit. Pixel defects can interfere with the visibility of small details in medical images. See 7.6 Defective Pixels, IDMS Artifacts: Evaluate for image artifacts such as ghosting and/or image sticking from displaying a fixed test pattern for a period of time. See 4.6 Artifacts and Irregularities, IDMS Temporal response: Measurements of the temporal behavior of the display in responding to changes in image values from frame to frame. Since these transitions are typically not symmetric, rise and fall time constants are needed to characterize the system. See Gray-to-Gray Response Time, IDMS Maximum and minimum luminance (achievable and recommended): Measurements of the maximum and minimum luminance that the device outputs as used in the application under recommended conditions and the achievable values if the device is set to expand the range to the limit. See 2.4 Vantage-Point Suite of Measurement, IDMS Grayscale: Measurements of the mapping between image values and the luminance. See 6.1 Grayscale, IDMS Luminance uniformity and Mura test: Measurements of the uniformity of the luminance across the display screen. See Sampled Vantage-Point Uniformity and Mura Analysis, IDMS Stability of luminance and chromaticity response with temperature and lifetime Bidirectional reflection distribution function: Measurements of the reflection coefficients of the display device. Specular and diffuse reflection coefficients can be used as surrogates for the full bidirectional reflection distribution function. See Diagnostic: Characterizing Hemisphere Uniformity, IDMS Gray Tracking: Chromaticity at different luminance levels as indicated by the color coordinates in an appropriate units system (e.g., CIE u v ). See AAPM Task Group 196 Report. Color scale: Color coordinates of primary and secondary colors as a function of the digital driving level and their additivity. See 6. Gray- and Color-Scale Measurement and 5.4 Color-Signal White, IDMS Color gamut volume: See 5.31 Volume-Color-Reproduction Capability, IDMS IV(A)(11)(c). Resources Those interested in learning more about these types of display considerations should consider reading: IDMS Information Display Measurements Standard Version 1.03, International Committee for Display Metrology, Society for Information Display, E. Samei, A. Badano, D. Chakraborty, K. Compton, C. Cornelius, K. Corrigan, M. J. Flynn, B. Hemminger, N. Hangiandreou, J. Johnson, M. Moxley, W. 13
37 Pavlicek, H. Roehrig, L. Rutz, J. Shepard, R. Uzenoff, J. Wang, and C. Willis, Assessment of display performance for medical imaging systems, Report of the American Association of Physicists in Medicine (AAPM) Task Group 18, Technical Report, AAPM (April 2005). IEC :2009, Medical electrical equipment Medical image display systems Part 1: Evaluation methods Amendment 1 to IEC : Medical image display systems Part 1: Evaluation methods The guidance entitled Guidance for Industry and FDA Staff: Display Accessories for Full-Field Digital Mammography Systems-Premarket Notification (510(k)) Submissions ( ocuments/ucm htm). IV(B). System-level Assessment This subsection details the test methods at the system level that should be included in the technical performance assessment of a WSI device. In this guidance, system refers to a series of consecutive components in the imaging chain with clearly defined, measureable input and output. For example, a system-level test can be designed for the image acquisition subsystem, the image display subsystem, or a combination of both. The goal of system-level tests is to assess the composite performance of a series of consecutive components in the imaging chain. System-level tests should be conducted when the component-level tests are either unfeasible or unable to capture the interplay between components. The common framework of the system-level tests described in this section is to compare the system under test with an ideal system based on the same input, and then report the difference between their outputs quantitatively. Designing such a system-level test typically involves the following steps: (1) define the scope of the system and its input and output, (2) define the input, which in most cases is a test target or phantom, (3) measure the input to establish the ground truth that would be generated by an ideal system, (4) measure the output of the system under test, and (5) calculate the errors between the truth and the output with a quantitative metric. The framework of a typical system-level test is shown in Diagram 2. Notice that the ideal system is a hypothetical device that generates the perfect output with respect to the objective of the test such as color or focus. The purpose of the ideal system is to define the intended behavior of the system under test. The ideal system does not need to be implemented. Instead, the ideal system should be simulated by a test method that establishes the truth of the input phantom. 14
38 Input (Phantom) IV(B)(1). Diagram 2: Framework of a typical system-level test. IV(B)(1)(a). Color Reproducibility Description Color reproducibility is one of the key characteristics of a WSI system. The color characteristics are determined by every component in the imaging chain. Therefore, the color characteristics might be best evaluated at the system level. Color reproducibility indicates the accuracy and precision of the color transformation from the tissue sample on the slide to the image on the display. The colors of the tissue specimen should be accurately and precisely reproduced on the display based on the color reproduction intent, which should be clearly defined and justified by the sponsor. IV(B)(1)(b). System under test Ideal system Test Methods Output Truth Error The WSI system should be tested with a target slide. The target slide should contain a set of measurable and representative color patches. Ideally the color patches should have similar spectral characteristics to stained tissue. The color patches should include a grayscale ramp for evaluating the grayscale response. The truth of the color patches should be measured with proper apparatuses separately. For each color patch, the intended color (i.e., the expected output color based on the color reproduction intent defined by the Sponsor) should be calculated based on the truth of the color patches. The target slide should be scanned and displayed by the WSI system. The output color of each color patch should be measured from the display. The three datasets truth, intended color, and output color should be compared and analyzed. The sponsor should provide a rationale if the intended color is different from the truth. f 15
39 Target Slide Diagram 3: Framework of the system-level color reproducibility test. IV(B)(1)(c). Resources Useful references on the subject of color reproducibility can be found at the International Color Consortium website IV(B)(2). IV(B)(2)(a). Spatial Resolution Description Spatial resolution is another key characteristic of a WSI system. The goal of this systemlevel test is to evaluate the composite optical performance of all components in the image acquisition phase (i.e., from slide to digital image file). IV(B)(2)(b). Test Methods The following test is recommended for assessing spatial resolution of the image acquisition phase: Resolution and spatial frequency response: ISO 12233:2014(E) Photography Electronic still picture imaging Resolution and spatial frequency responses. IV(B)(3). Meter Focusing Test WSI under test Truth Color Reproduction Intent Output Color Intended Color Accuracy Precision The quality of focus in WSI can be affected by a number of inter-related factors, including the scanning method and approaches for constructing a focus map. Due to a trade-off between the number of focus points and the overall speed of the scanning process, focusing is typically based on a sample of focus points, determined automatically (auto-focus) or manually by the user. Since tissue can have uneven depth, auto-focus algorithms are needed to detect and adjust for different depths of focus. Data demonstrating that the focus quality is acceptable, even in the presence of uneven tissue, should be provided. Such data with proper justification could be derived from a phantom study, from clinical data, or both in a complementary fashion. The technology of phantom construction for testing focus is under development and this guidance will be updated as such technologies become available. Sponsors could attempt to build their own phantoms for testing depth - 16
40 of focus for their device. Alternatively, sponsors could provide experimental data using clinical tissue slides. Sampling of cases for such an experiment should be enriched for uneven tissue cases within a range representative of typical laboratory output. Alternative approaches for assessing the focus quality of a WSI will be considered along with proper justification. In addition, the following specifications should be provided, if applicable: o Focus method: auto-focus for high-throughput or user-operated focus points o Instructions for the selection of manual focus points (if applicable), including number of focus points and location in relation to a tissue sample o Metrics used to evaluate focusing and description of methods to extract them o Methods for constructing focus map from sample focus points Phantom Slide IV(B)(4). Diagram 4: Framework of the system-level focusing test. IV(B)(4)(a). Whole Slide Tissue Coverage Description During the scan phase, WSI systems usually skip blank areas where tissue is absent in order to reduce scan time and file size. The purpose of the whole slide tissue coverage test is to demonstrate that all of the tissue specimen on the glass slide is included in the digital image file. IV(B)(4)(b). WSI under test WSI with perfect focusing capability Test Method Actual Focus Optimal Focus Error Sponsors should include a test that demonstrates the completeness of the tissue coverage. Sponsors should describe the test method and include the following items: Selection of the input tissue slide How to determine the complete coverage of the input tissue slide How to measure the actual coverage of the WSI output Calculate the ratio of the actual to complete coverage f 17
41 Diagram 5: Framework of the system-level whole slide tissue coverage test Tissue Slide IV(B)(5). IV(B)(5)(a). Stitching Error Description Stitching is the technique that enables a WSI system to combine thousands of sub-images into a single whole-slide image. Although during the scanning process a certain amount of overlapping between adjacent sub-images is maintained for alignment purposes, successful stitching relies on the texture present in the overlapped area. When the stitching algorithm fails to align two sub-images seamlessly, the error may or may not be perceivable by the human reader depending on whether noticeable stitching artifacts are generated. Therefore, a system-level test should be conducted when assessing the stitching quality of the WSI system. IV(B)(5)(b). Test Methods Sponsors should include a test that evaluates the stitching errors and include the following items: Selection of the input test slide Method for sampling of the stitching boundaries where stitching errors might occur How to determine the ideal stitching as the ground truth o For example, the region of the stitching boundaries can be re-imaged in one shot such that there is no stitching artifact. How to evaluate quality of the actual stitching based on the perfect stitching o For example, compare the image of stitching boundaries with the perfect one that does not have stitching artifact. The difference between these two images can be used as a figure of merit of the stitching quality. Tissue Slide WSI under test WSI with complete coverage capability Diagram 6: Framework of the system-level stitching error test WSI under test WSI with perfect stitching capability Actual Coverage Complete Coverage Actual Stitching Perfect Stitching f f Error Error 18
Technical Performance Assessment of Digital Pathology Whole Slide Imaging Devices. Draft Guidance for Industry and Food and Drug Administration Staff
 1 2 3 Technical Performance Assessment of Digital Pathology Whole Slide Imaging Devices 4 5 6 7 8 9 10 11 12 13 14 15 16 17 18 19 20 21 22 23 24 25 26 27 28 35 Draft Guidance for Industry and Food and
Image Display and Perception
 Image Display and Perception J. Anthony Seibert, Ph.D. Department of Radiology UC Davis Medical Center Sacramento, California, USA Image acquisition, display, & interpretation X-rays kvp mas Tube filtration
Yagi Digital Microscope Calibration
 Yagi Digital Microscope Calibration Method summary, assessment and suggestions for improvement W Craig Revie, International Color Consortium Introduction In the area of pathology, a type of digital microscope
Technical Paper CONSISTENT PRESENTATION OF MEDICAL IMAGES
 Technical Paper CONSISTENT PRESENTATION OF MEDICAL IMAGES A REPORT ON MEDICAL WORKSTATION CALIBRATION By Tom Schulte In years past, the quality of medical images was strictly controlled during the exposure,
Calibration Slide for Histopathology task force Teleconference 20 February :00 (UK) / 10:00 (EST)
 / 10:00 (EST)") Calibration Slide for Histopathology task force Teleconference 20 February 2014 15:00 (UK) / 10:00 (EST) The meeting was called to order at 10:00 am (EST) by Craig Revie, chair of MIWG, with the following
Calibration Slide for Histopathology task force Teleconference 20 February 2014 15:00 (UK) / 10:00 (EST) The meeting was called to order at 10:00 am (EST) by Craig Revie, chair of MIWG, with the following
ICC Votable Proposal Submission Colorimetric Intent Image State Tag Proposal
 ICC Votable Proposal Submission Colorimetric Intent Image State Tag Proposal Proposers: Jack Holm, Eric Walowit & Ann McCarthy Date: 16 June 2006 Proposal Version 1.2 1. Introduction: The ICC v4 specification
SECTION I - CHAPTER 2 DIGITAL IMAGING PROCESSING CONCEPTS
 RADT 3463 - COMPUTERIZED IMAGING Section I: Chapter 2 RADT 3463 Computerized Imaging 1 SECTION I - CHAPTER 2 DIGITAL IMAGING PROCESSING CONCEPTS RADT 3463 COMPUTERIZED IMAGING Section I: Chapter 2 RADT
Image acquisition. In both cases, the digital sensing element is one of the following: Line array Area array. Single sensor
 Image acquisition Digital images are acquired by direct digital acquisition (digital still/video cameras), or scanning material acquired as analog signals (slides, photographs, etc.). In both cases, the
SPECTRAL SCANNER. Recycling
 SPECTRAL SCANNER The Spectral Scanner, produced on an original project of DV s.r.l., is an instrument to acquire with extreme simplicity the spectral distribution of the different wavelengths (spectral
Motion Solutions for Digital Pathology. White Paper
 Motion Solutions for Digital Pathology White Paper Design Considerations for Digital Pathology Instruments With an ever increasing demand on throughput, pathology scanning applications are some of the
White Paper Focusing more on the forest, and less on the trees
 White Paper Focusing more on the forest, and less on the trees Why total system image quality is more important than any single component of your next document scanner Contents Evaluating total system
A simulation tool for evaluating digital camera image quality
 A simulation tool for evaluating digital camera image quality Joyce Farrell ab, Feng Xiao b, Peter Catrysse b, Brian Wandell b a ImagEval Consulting LLC, P.O. Box 1648, Palo Alto, CA 94302-1648 b Stanford
Motion Solutions for Digital Pathology
 Parker Hannifin Electromechanical Dvision N. A. 1140 Sandy Hill Road Irwin, PA 1564203049 724-861-8200 www.parkermotion.com Motion Solutions for Digital Pathology By: Brian Handerhan and Jim Monnich Design
CERTIFIED PROFESSIONAL PHOTOGRAPHER (CPP) TEST SPECIFICATIONS CAMERA, LENSES AND ATTACHMENTS (12%)
 TEST SPECIFICATIONS CAMERA, LENSES AND ATTACHMENTS (12%)") CERTIFIED PROFESSIONAL PHOTOGRAPHER (CPP) TEST SPECIFICATIONS CAMERA, LENSES AND ATTACHMENTS (12%) Items relating to this category will include digital cameras as well as the various lenses, menu settings
CERTIFIED PROFESSIONAL PHOTOGRAPHER (CPP) TEST SPECIFICATIONS CAMERA, LENSES AND ATTACHMENTS (12%) Items relating to this category will include digital cameras as well as the various lenses, menu settings
PICO MASTER 200. UV direct laser writer for maskless lithography
 PICO MASTER 200 UV direct laser writer for maskless lithography 4PICO B.V. Jan Tinbergenstraat 4b 5491 DC Sint-Oedenrode The Netherlands Tel: +31 413 490708 WWW.4PICO.NL 1. Introduction The PicoMaster
ECEN. Spectroscopy. Lab 8. copy. constituents HOMEWORK PR. Figure. 1. Layout of. of the
 ECEN 4606 Lab 8 Spectroscopy SUMMARY: ROBLEM 1: Pedrotti 3 12-10. In this lab, you will design, build and test an optical spectrum analyzer and use it for both absorption and emission spectroscopy. The
technology meets pathology Institute of Pathology, Charité Universitätsmedizin Berlin, Berlin, Germany 3 Overview
 ASSESSMENT OF TECHNICAL PARAMETERS A. Alekseychuk 1, N. Zerbe 2, Y. Yagi 3 1 Computer Vision and Remote Sensing, TU Berlin, Berlin, Germany 2 Institute of Pathology, Charité Universitätsmedizin Berlin,
Imaging Photometer and Colorimeter
 W E B R I N G Q U A L I T Y T O L I G H T. /XPL&DP Imaging Photometer and Colorimeter Two models available (photometer and colorimetry camera) 1280 x 1000 pixels resolution Measuring range 0.02 to 200,000
Systems Biology. Optical Train, Köhler Illumination
 McGill University Life Sciences Complex Imaging Facility Systems Biology Microscopy Workshop Tuesday December 7 th, 2010 Simple Lenses, Transmitted Light Optical Train, Köhler Illumination What Does a
DICOM Correction Proposal
 Tracking Information - Administration Use Only DICOM Correction Proposal Correction Proposal Number Status CP-1713 Letter Ballot Date of Last Update 2018/01/23 Person Assigned Submitter Name David Clunie
Color , , Computational Photography Fall 2018, Lecture 7
 Color http://graphics.cs.cmu.edu/courses/15-463 15-463, 15-663, 15-862 Computational Photography Fall 2018, Lecture 7 Course announcements Homework 2 is out. - Due September 28 th. - Requires camera and
Guidance for Industry and FDA Staff Use of Symbols on Labels and in Labeling of In Vitro Diagnostic Devices Intended for Professional Use
 Guidance for Industry and FDA Staff Use of Symbols on Labels and in Labeling of In Vitro Diagnostic Devices Intended for Professional Use Document issued on: November 30, 2004 The draft of this document
Acquisition Basics. How can we measure material properties? Goal of this Section. Special Purpose Tools. General Purpose Tools
 Course 10 Realistic Materials in Computer Graphics Acquisition Basics MPI Informatik (moving to the University of Washington Goal of this Section practical, hands-on description of acquisition basics general
Very short introduction to light microscopy and digital imaging
 Very short introduction to light microscopy and digital imaging Hernan G. Garcia August 1, 2005 1 Light Microscopy Basics In this section we will briefly describe the basic principles of operation and
Lighting Techniques 18 The Color of Light 21 SAMPLE
 Advanced Evidence Photography Contents Table of Contents General Photographic Principles. 2 Camera Operation 2 Selecting a Lens 2 Focusing 3 Depth of Field 4 Controlling Exposure 6 Reciprocity 7 ISO Speed
Digital Pathology at Johns Hopkins Practical Research and Clinical Considerations
 Digital Pathology at Johns Hopkins Practical Research and Clinical Considerations July 10, 2017 Alexander Baras, MD, PhD Assistant Professor of Pathology, Urology, and Oncology Associate Director of Pathology
Color Management User Guide
 Color Management User Guide Edition July 2001 Phase One A/S Roskildevej 39 DK-2000 Frederiksberg Denmark Tel +45 36 46 01 11 Fax +45 36 46 02 22 Phase One U.S. 24 Woodbine Ave Northport, New York 11768
WE BRING QUALITY TO LIGHT DTS 500. Positioner Systems AUTOMATED DISPLAY AND LIGHT MEASUREMENT
 WE BRING QUALITY TO LIGHT DTS 500 Positioner Systems AUTOMATED DISPLAY AND LIGHT MEASUREMENT Standalone XYZ positioners (260 to 560 mm max. travel range) Standalone 2-axis goniometers (up to 70 cm diagonal
Camera Image Processing Pipeline: Part II
 Lecture 13: Camera Image Processing Pipeline: Part II Visual Computing Systems Today Finish image processing pipeline Auto-focus / auto-exposure Camera processing elements Smart phone processing elements
IMAGE SENSOR SOLUTIONS. KAC-96-1/5" Lens Kit. KODAK KAC-96-1/5" Lens Kit. for use with the KODAK CMOS Image Sensors. November 2004 Revision 2
 KODAK for use with the KODAK CMOS Image Sensors November 2004 Revision 2 1.1 Introduction Choosing the right lens is a critical aspect of designing an imaging system. Typically the trade off between image
Background. Computer Vision & Digital Image Processing. Improved Bartlane transmitted image. Example Bartlane transmitted image
 Background Computer Vision & Digital Image Processing Introduction to Digital Image Processing Interest comes from two primary backgrounds Improvement of pictorial information for human perception How
Improving the Collection Efficiency of Raman Scattering
 PERFORMANCE Unparalleled signal-to-noise ratio with diffraction-limited spectral and imaging resolution Deep-cooled CCD with excelon sensor technology Aberration-free optical design for uniform high resolution
ISO/IEC JTC 1/SC 29 N 16019
 ISO/IEC JTC 1/SC 29 N 16019 ISO/IEC JTC 1/SC 29 Coding of audio, picture, multimedia and hypermedia information Secretariat: JISC (Japan) Document type: Title: Status: Text for PDAM ballot or comment Text
Before you start, make sure that you have a properly calibrated system to obtain high-quality images.
 CONTENT Step 1: Optimizing your Workspace for Acquisition... 1 Step 2: Tracing the Region of Interest... 2 Step 3: Camera (& Multichannel) Settings... 3 Step 4: Acquiring a Background Image (Brightfield)...
DIGITAL-MICROSCOPY CAMERA SOLUTIONS USB 3.0
 DIGITAL-MICROSCOPY CAMERA SOLUTIONS USB 3.0 PixeLINK for Microscopy Applications PixeLINK will work with you to choose and integrate the optimal USB 3.0 camera for your microscopy project. Ideal for use
Camera Requirements For Precision Agriculture
 Camera Requirements For Precision Agriculture Radiometric analysis such as NDVI requires careful acquisition and handling of the imagery to provide reliable values. In this guide, we explain how Pix4Dmapper
Camera Requirements For Precision Agriculture
 Camera Requirements For Precision Agriculture Radiometric analysis such as NDVI requires careful acquisition and handling of the imagery to provide reliable values. In this guide, we explain how Pix4Dmapper
Illumination Correction tutorial
 Illumination Correction tutorial I. Introduction The Correct Illumination Calculate and Correct Illumination Apply modules are intended to compensate for the non uniformities in illumination often present
A Study of Slanted-Edge MTF Stability and Repeatability
 A Study of Slanted-Edge MTF Stability and Repeatability Jackson K.M. Roland Imatest LLC, 2995 Wilderness Place Suite 103, Boulder, CO, USA ABSTRACT The slanted-edge method of measuring the spatial frequency
Understand brightness, intensity, eye characteristics, and gamma correction, halftone technology, Understand general usage of color
 Understand brightness, intensity, eye characteristics, and gamma correction, halftone technology, Understand general usage of color 1 ACHROMATIC LIGHT (Grayscale) Quantity of light physics sense of energy
Instructions for the Experiment
 Instructions for the Experiment Excitonic States in Atomically Thin Semiconductors 1. Introduction Alongside with electrical measurements, optical measurements are an indispensable tool for the study of
Practical work no. 3: Confocal Live Cell Microscopy
 Practical work no. 3: Confocal Live Cell Microscopy Course Instructor: Mikko Liljeström (MIU) 1 Background Confocal microscopy: The main idea behind confocality is that it suppresses the signal outside
Camera Overview. Digital Microscope Cameras for Material Science: Clear Images, Precise Analysis. Digital Cameras for Microscopy
 Digital Cameras for Microscopy Camera Overview For Materials Science Microscopes Digital Microscope Cameras for Material Science: Clear Images, Precise Analysis Passionate about Imaging: Olympus Digital
GE Healthcare. Senographe 2000D Full-field digital mammography system
 GE Healthcare Senographe 2000D Full-field digital mammography system Digital has arrived. The Senographe 2000D Full-Field Digital Mammography (FFDM) system gives you a unique competitive advantage. That
CRISATEL High Resolution Multispectral System
 CRISATEL High Resolution Multispectral System Pascal Cotte and Marcel Dupouy Lumiere Technology, Paris, France We have designed and built a high resolution multispectral image acquisition system for digitizing
MEASURING HEAD-UP DISPLAYS FROM 2D TO AR: SYSTEM BENEFITS & DEMONSTRATION Presented By Matt Scholz November 28, 2018
 MEASURING HEAD-UP DISPLAYS FROM 2D TO AR: SYSTEM BENEFITS & DEMONSTRATION Presented By Matt Scholz November 28, 2018 Light & Color Automated Visual Inspection Global Support TODAY S AGENDA The State of
STEM Spectrum Imaging Tutorial
 STEM Spectrum Imaging Tutorial Gatan, Inc. 5933 Coronado Lane, Pleasanton, CA 94588 Tel: (925) 463-0200 Fax: (925) 463-0204 April 2001 Contents 1 Introduction 1.1 What is Spectrum Imaging? 2 Hardware 3
HoloMonitor M4. For powerful discoveries in your incubator
 HoloMonitor M4 For powerful discoveries in your incubator HoloMonitor offers unique imaging capabilities that greatly enhance our understanding of cell behavior, previously unachievable by other technologies
EXC500p-- PATHOLOGY MICROSCOPE. EXC500hd -- HD DIGITAL PATHOLOGY MICROSCOPE. EXC500r -- RESEARCH MICROSCOPE EXC500-LABORATORY SCOPE
 EXC500p-- PATHOLOGY MICROSCOPE EXC500hd -- HD DIGITAL PATHOLOGY MICROSCOPE EXC500r -- RESEARCH MICROSCOPE EXC500-LABORATORY SCOPE The EXC500 Pathology and Laboratory Microscope is the most optically advanced
Improving Color Image Quality in Medical Photography
 White Paper #46 Level: Intermediate Date: April 2017 Improving Color Image Quality in Medical Photography Introduction Medical images have played an important role in the development of modern medicine.
CENTER FOR DEVICES AND RADIOLOGICAL HEALTH. Notice to Industry Letters
 CENTER FOR DEVICES AND RADIOLOGICAL HEALTH Standard Operating Procedure for Notice to Industry Letters PURPOSE This document describes the Center for Devices and Radiological Health s (CDRH s, or Center
Camera Overview. Digital Microscope Cameras for Material Science: Clear Images, Precise Analysis. Digital Cameras for Microscopy
 Digital Cameras for Microscopy Camera Overview For Materials Science Microscopes Digital Microscope Cameras for Material Science: Clear Images, Precise Analysis Passionate about Imaging: Olympus Digital
Performance Comparison of Spectrometers Featuring On-Axis and Off-Axis Grating Rotation
 Performance Comparison of Spectrometers Featuring On-Axis and Off-Axis Rotation By: Michael Case and Roy Grayzel, Acton Research Corporation Introduction The majority of modern spectrographs and scanning
Photography and graphic technology Extended colour encodings for digital image storage, manipulation and interchange. Part 4:
 Provläsningsexemplar / Preview TECHNICAL SPECIFICATION ISO/TS 22028-4 First edition 2012-11-01 Photography and graphic technology Extended colour encodings for digital image storage, manipulation and interchange
Automatic optical measurement of high density fiber connector
 Key Engineering Materials Online: 2014-08-11 ISSN: 1662-9795, Vol. 625, pp 305-309 doi:10.4028/www.scientific.net/kem.625.305 2015 Trans Tech Publications, Switzerland Automatic optical measurement of
Practical guidelines for color calibration and quality assurance of medical displays
 Practical guidelines for color calibration and quality assurance of medical displays Poster No.: C-1140 Congress: ECR 2017 Type: Educational Exhibit Authors: T. Kimpe, J. Rostang, G. Van Hoey, A. Xthona
Difrotec Product & Services. Ultra high accuracy interferometry & custom optical solutions
 Difrotec Product & Services Ultra high accuracy interferometry & custom optical solutions Content 1. Overview 2. Interferometer D7 3. Benefits 4. Measurements 5. Specifications 6. Applications 7. Cases
ISO INTERNATIONAL STANDARD. Photography Electronic still-picture cameras Resolution measurements
 INTERNATIONAL STANDARD ISO 12233 First edition 2000-09-01 Photography Electronic still-picture cameras Resolution measurements Photographie Appareils de prises de vue électroniques Mesurages de la résolution
Chapter 3 Part 2 Color image processing
 Chapter 3 Part 2 Color image processing Motivation Color fundamentals Color models Pseudocolor image processing Full-color image processing: Component-wise Vector-based Recent and current work Spring 2002
DRAFT Direct View Display D-Cinema Addendum
 DRAFT Direct View Display D-Cinema Addendum DRAFT Version 0.9 Approved for Distribution for Comments 16 November 2018 Digital Cinema Initiatives, LLC, Member Representatives Committee This document is
Color aspects and Color Standardization in Digital Microscopy
 Color aspects and Color Standardization in Digital Microscopy Yukako Yagi, PhD yyagi@partners.org Director of the MGH Pathology Imaging & Communication Technology Center Assistant Professor of Pathology,
Things you may want to know
 Things you may want to know 1 / 9 Last updated 18-Nov-05 Why medical monitors are special? Unlike commercial displays, Medical displays are used in the hospital and they are displaying contain life critical
Camera Image Processing Pipeline: Part II
 Lecture 14: Camera Image Processing Pipeline: Part II Visual Computing Systems Today Finish image processing pipeline Auto-focus / auto-exposure Camera processing elements Smart phone processing elements
LSM 780 Confocal Microscope Standard Operation Protocol
 LSM 780 Confocal Microscope Standard Operation Protocol Basic Operation Turning on the system 1. Sign on log sheet according to Actual start time 2. Check Compressed Air supply for the air table 3. Switch
Graphic technology Prepress data exchange Preparation and visualization of RGB images to be used in RGB-based graphics arts workflows
 Provläsningsexemplar / Preview INTERNATIONAL STANDARD ISO 16760 First edition 2014-12-15 Graphic technology Prepress data exchange Preparation and visualization of RGB images to be used in RGB-based graphics
Optimizing throughput with Machine Vision Lighting. Whitepaper
 Optimizing throughput with Machine Vision Lighting Whitepaper Optimizing throughput with Machine Vision Lighting Within machine vision systems, inappropriate or poor quality lighting can often result in
Color Science. What light is. Measuring light. CS 4620 Lecture 15. Salient property is the spectral power distribution (SPD)
") Color Science CS 4620 Lecture 15 1 2 What light is Measuring light Light is electromagnetic radiation Salient property is the spectral power distribution (SPD) [Lawrence Berkeley Lab / MicroWorlds] exists
Color Science CS 4620 Lecture 15 1 2 What light is Measuring light Light is electromagnetic radiation Salient property is the spectral power distribution (SPD) [Lawrence Berkeley Lab / MicroWorlds] exists
Perceptual Rendering Intent Use Case Issues
 White Paper #2 Level: Advanced Date: Jan 2005 Perceptual Rendering Intent Use Case Issues The perceptual rendering intent is used when a pleasing pictorial color output is desired. [A colorimetric rendering
Module 6 STILL IMAGE COMPRESSION STANDARDS
 Module 6 STILL IMAGE COMPRESSION STANDARDS Lesson 16 Still Image Compression Standards: JBIG and JPEG Instructional Objectives At the end of this lesson, the students should be able to: 1. Explain the
Optical design of a high resolution vision lens
 Optical design of a high resolution vision lens Paul Claassen, optical designer, paul.claassen@sioux.eu Marnix Tas, optical specialist, marnix.tas@sioux.eu Prof L.Beckmann, l.beckmann@hccnet.nl Summary:
Multispectral. imaging device. ADVANCED LIGHT ANALYSIS by. Most accurate homogeneity MeasureMent of spectral radiance. UMasterMS1 & UMasterMS2
 Multispectral imaging device Most accurate homogeneity MeasureMent of spectral radiance UMasterMS1 & UMasterMS2 ADVANCED LIGHT ANALYSIS by UMaster Ms Multispectral Imaging Device UMaster MS Description
For more information about how to cite these materials visit
 Author(s): Paul Conway, Don Williams, 2008-2011. License: Unless otherwise noted, this material is made available under the terms of the Creative Commons Creative Commons Attribution - Non-Commercial -
DMETRIX S (FUTURE) PERSPECTIVES ON DIGITAL IMAGING & DIGITAL PATHOLOGY SYSTEMS
 PERSPECTIVES ON DIGITAL IMAGING & DIGITAL PATHOLOGY SYSTEMS") Michael R. Descour, Ph.D., DMetrix, Inc., & University of Arizona Lloyd J. LaComb, Jr., Ph.D., DMetrix, Inc. DMETRIX S (FUTURE) PERSPECTIVES ON DIGITAL IMAGING & DIGITAL PATHOLOGY SYSTEMS Outline of presentation
Michael R. Descour, Ph.D., DMetrix, Inc., & University of Arizona Lloyd J. LaComb, Jr., Ph.D., DMetrix, Inc. DMETRIX S (FUTURE) PERSPECTIVES ON DIGITAL IMAGING & DIGITAL PATHOLOGY SYSTEMS Outline of presentation
For a long time I limited myself to one color as a form of discipline. Pablo Picasso. Color Image Processing
 For a long time I limited myself to one color as a form of discipline. Pablo Picasso Color Image Processing 1 Preview Motive - Color is a powerful descriptor that often simplifies object identification
It should also be noted that with modern cameras users can choose for either
 White paper about color correction More drama Many application fields like digital printing industry or the human medicine require a natural display of colors. To illustrate the importance of color fidelity,
DEFENSE APPLICATIONS IN HYPERSPECTRAL REMOTE SENSING
 DEFENSE APPLICATIONS IN HYPERSPECTRAL REMOTE SENSING James M. Bishop School of Ocean and Earth Science and Technology University of Hawai i at Mānoa Honolulu, HI 96822 INTRODUCTION This summer I worked
Acceptance Testing of a Digital Breast Tomosynthesis Unit
 Acceptance Testing of a Digital Breast Tomosynthesis Unit 2012 AAPM Spring Clinical Meeting Jessica Clements, M.S., DABR Objectives Review of technology and clinical advantages Acceptance Testing Procedures
Leica ADS80 - Digital Airborne Imaging Solution NAIP, Salt Lake City 4 December 2008
 Luzern, Switzerland, acquired at 5 cm GSD, 2008. Leica ADS80 - Digital Airborne Imaging Solution NAIP, Salt Lake City 4 December 2008 Shawn Slade, Doug Flint and Ruedi Wagner Leica Geosystems AG, Airborne
Simulation of film media in motion picture production using a digital still camera
 Simulation of film media in motion picture production using a digital still camera Arne M. Bakke, Jon Y. Hardeberg and Steffen Paul Gjøvik University College, P.O. Box 191, N-2802 Gjøvik, Norway ABSTRACT
SUSPENSION CRITERIA FOR IMAGE MONITORS AND VIEWING BOXES.
 SUSPENSION CRITERIA FOR IMAGE MONITORS AND VIEWING BOXES. Tingberg, Anders Published in: Radiation Protection Dosimetry DOI: 10.1093/rpd/ncs302 Published: 2013-01-01 Link to publication Citation for published
Digital Microscopy: New Paradigm's for Teaching Microscopic Anatomy and Pathology
 Digital Microscopy: New Paradigm's for Teaching Microscopic Anatomy and Pathology Michael Feldman, MD, PhD Assistant Dean IT Assistant Professor Pathology University of Pennsylvania Health System Feldmanm@mail.med.upenn.edu
Machine Vision for the Life Sciences
 Machine Vision for the Life Sciences Presented by: Niels Wartenberg June 12, 2012 Track, Trace & Control Solutions Niels Wartenberg Microscan Sr. Applications Engineer, Clinical Senior Applications Engineer
Image Capture TOTALLAB
 1 Introduction In order for image analysis to be performed on a gel or Western blot, it must first be converted into digital data. Good image capture is critical to guarantee optimal performance of automated
AxioCam HR Success Through Performance
 Microscopy from Carl Zeiss AxioCam HR Success Through Performance The high-resolution camera for digital documentation Superior performance for research and routine work brilliant quality documentation
RGB Laser Meter TM6102, RGB Laser Luminance Meter TM6103, Optical Power Meter TM6104
 1 RGB Laser Meter TM6102, RGB Laser Luminance Meter TM6103, Optical Power Meter TM6104 Abstract The TM6102, TM6103, and TM6104 accurately measure the optical characteristics of laser displays (characteristics
Technical Aspects in Digital Pathology
 Technical Aspects in Digital Pathology Yukako Yagi, PhD yyagi@mgh.harvard.edu Director of the MGH Pathology Imaging & Communication Technology Center Assistant Professor of Pathology, Harvard Medical School
Maximizing clinical outcomes
 Maximizing clinical outcomes Digital Tomosynthesis Dual Energy Subtraction Automated Long Length Imaging Improved image quality at a low dose Xray Xray Patented ISS capture technology promotes high sensitivity
Instruction Manual T Binocular Acromat Research Scope T Trinocular Acromat Research Scope
 Research Scope Instruction Manual T-29031 Binocular Acromat Research Scope T-29041 Trinocular Acromat Research Scope T-29032 Binocular Semi-Plan Research Scope T-29042 Trinocular Semi-Plan Research Scope
This document is a preview generated by EVS
 TECHNICAL REPORT ISO/TR 19263-1 First edition 2017-03 Photography Archiving systems Part 1: Best practices for digital image capture of cultural heritage material Photographie Systèmes d archivage Partie
Introduction to 2-D Copy Work
 Introduction to 2-D Copy Work What is the purpose of creating digital copies of your analogue work? To use for digital editing To submit work electronically to professors or clients To share your work
INNOVATIVE CAMERA CHARACTERIZATION BASED ON LED LIGHT SOURCE
 Image Engineering imagequalitytools INNOVATIVE CAMERA CHARACTERIZATION BASED ON LED LIGHT SOURCE Image Engineering Relative Power ILLUMINATION DEVICES imagequalitytools The most flexible LED-based light
Be aware that there is no universal notation for the various quantities.
 Fourier Optics v2.4 Ray tracing is limited in its ability to describe optics because it ignores the wave properties of light. Diffraction is needed to explain image spatial resolution and contrast and
μscope Microscopy Software
 μscope Microscopy Software Pixelink μscope Essentials (ES) Software is an easy-to-use robust image capture tool optimized for productivity. Pixelink μscope Standard (SE) Software had added features, making
High-sensitivity. optical molecular imaging and high-resolution digital X-ray. In-Vivo Imaging Systems
 High-sensitivity optical molecular imaging and high-resolution digital X-ray In-Vivo Imaging Systems In vivo imaging solutions available in several packages Carestream Molecular Imaging offers a selection
Transmission Electron Microscopy 9. The Instrument. Outline
 Transmission Electron Microscopy 9. The Instrument EMA 6518 Spring 2009 02/25/09 Outline The Illumination System The Objective Lens and Stage Forming Diffraction Patterns and Images Alignment and Stigmation
Bringing Answers to the Surface
 3D Bringing Answers to the Surface 1 Expanding the Boundaries of Laser Microscopy Measurements and images you can count on. Every time. LEXT OLS4100 Widely used in quality control, research, and development
Digital Camera Technologies for Scientific Bio-Imaging. Part 2: Sampling and Signal
 Digital Camera Technologies for Scientific Bio-Imaging. Part 2: Sampling and Signal Yashvinder Sabharwal, 1 James Joubert 2 and Deepak Sharma 2 1. Solexis Advisors LLC, Austin, TX, USA 2. Photometrics
Stereotopix Research. Precision Pathology. Highthroughput. pathology. powered by newcast. Advantages of Stereotopix : RUO
 Precision Pathology Highthroughput pathology Stereotopix Research powered by newcast RUO Researchers use quantitative microscopy in many ways with the goal of producing high-quality, quantitative results
LCD handheld displays characterization by means of the MTF measurement
 MSc in Photonics Universitat Politècnica de Catalunya (UPC) Universitat Autònoma de Barcelona (UAB) Universitat de Barcelona (UB) Institut de Ciències Fotòniques (ICFO) PHOTONICSBCN http://www.photonicsbcn.eu
Color , , Computational Photography Fall 2017, Lecture 11
 Color http://graphics.cs.cmu.edu/courses/15-463 15-463, 15-663, 15-862 Computational Photography Fall 2017, Lecture 11 Course announcements Homework 2 grades have been posted on Canvas. - Mean: 81.6% (HW1: